

Work from Home during the COVID-19 Pandemic—The Impact on Employees’ Self-Assessed Job Performance


Abstract
:1. Introduction
2. Literature Review ad Research Questions
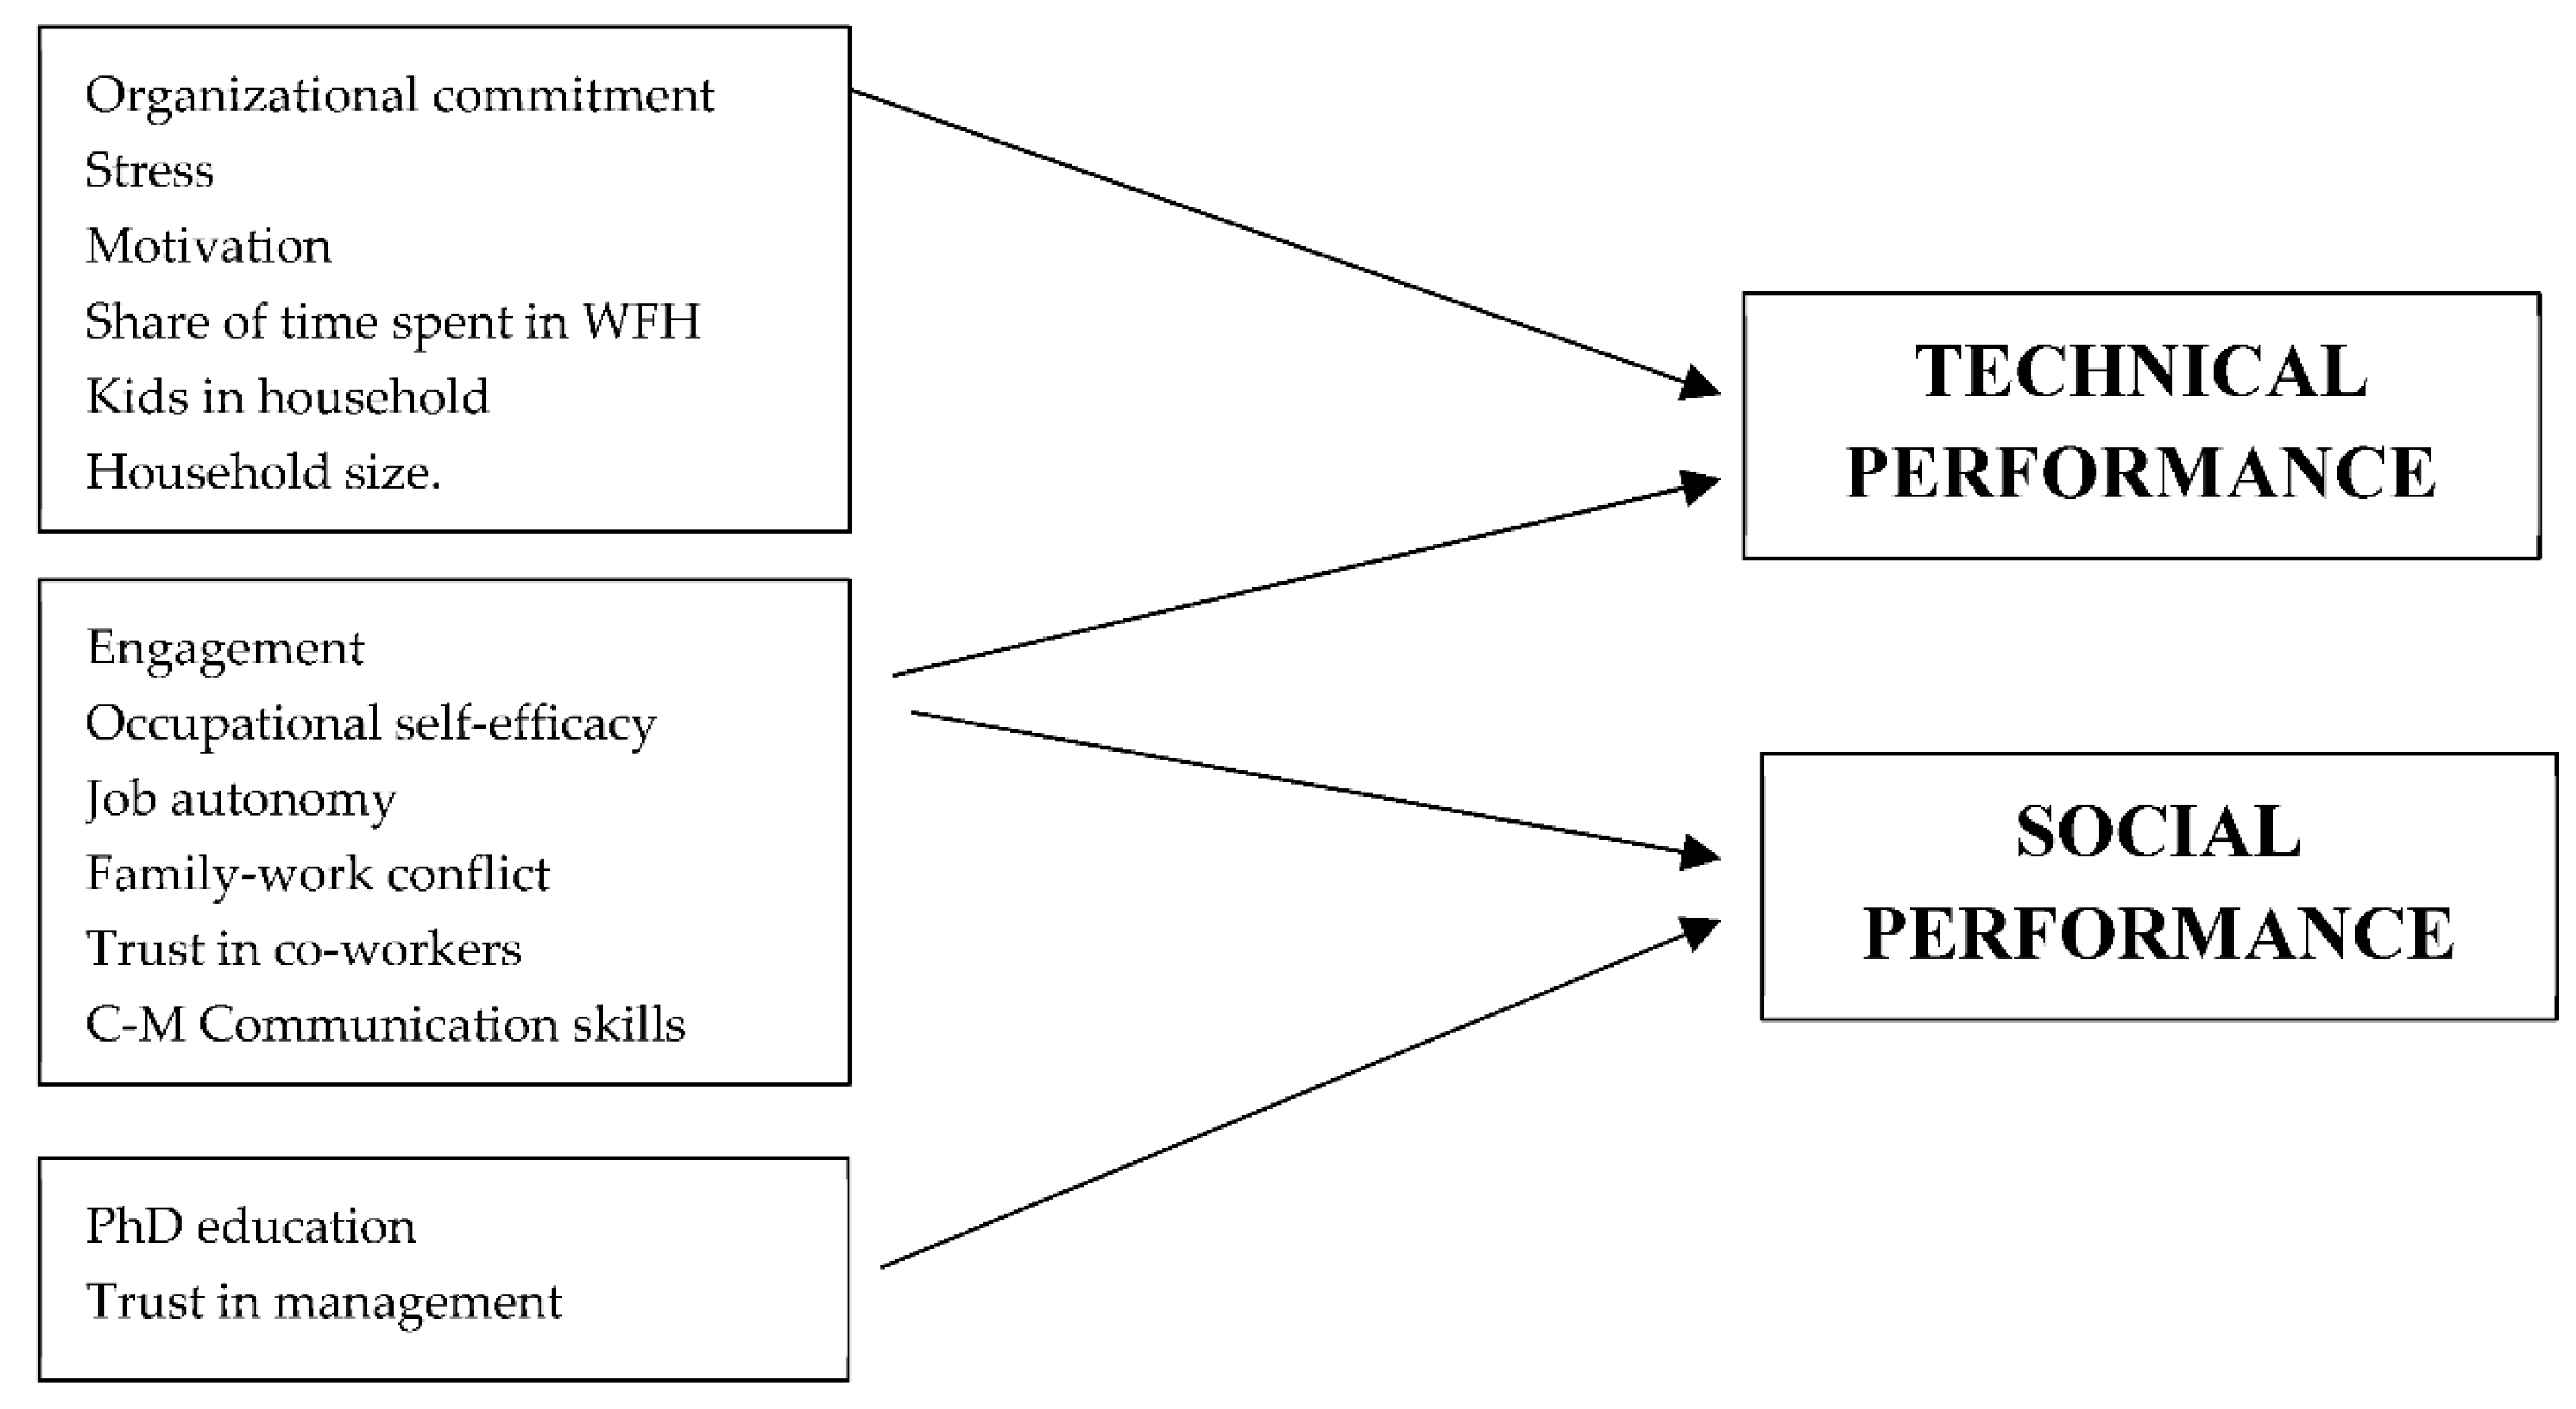
2.1. Employee’s Profile and Job Performance
2.2. Organizational Environment and Job Performance
2.3. Work-Life Balance and Job Performance
3. Data and Methods
3.1. Sampling
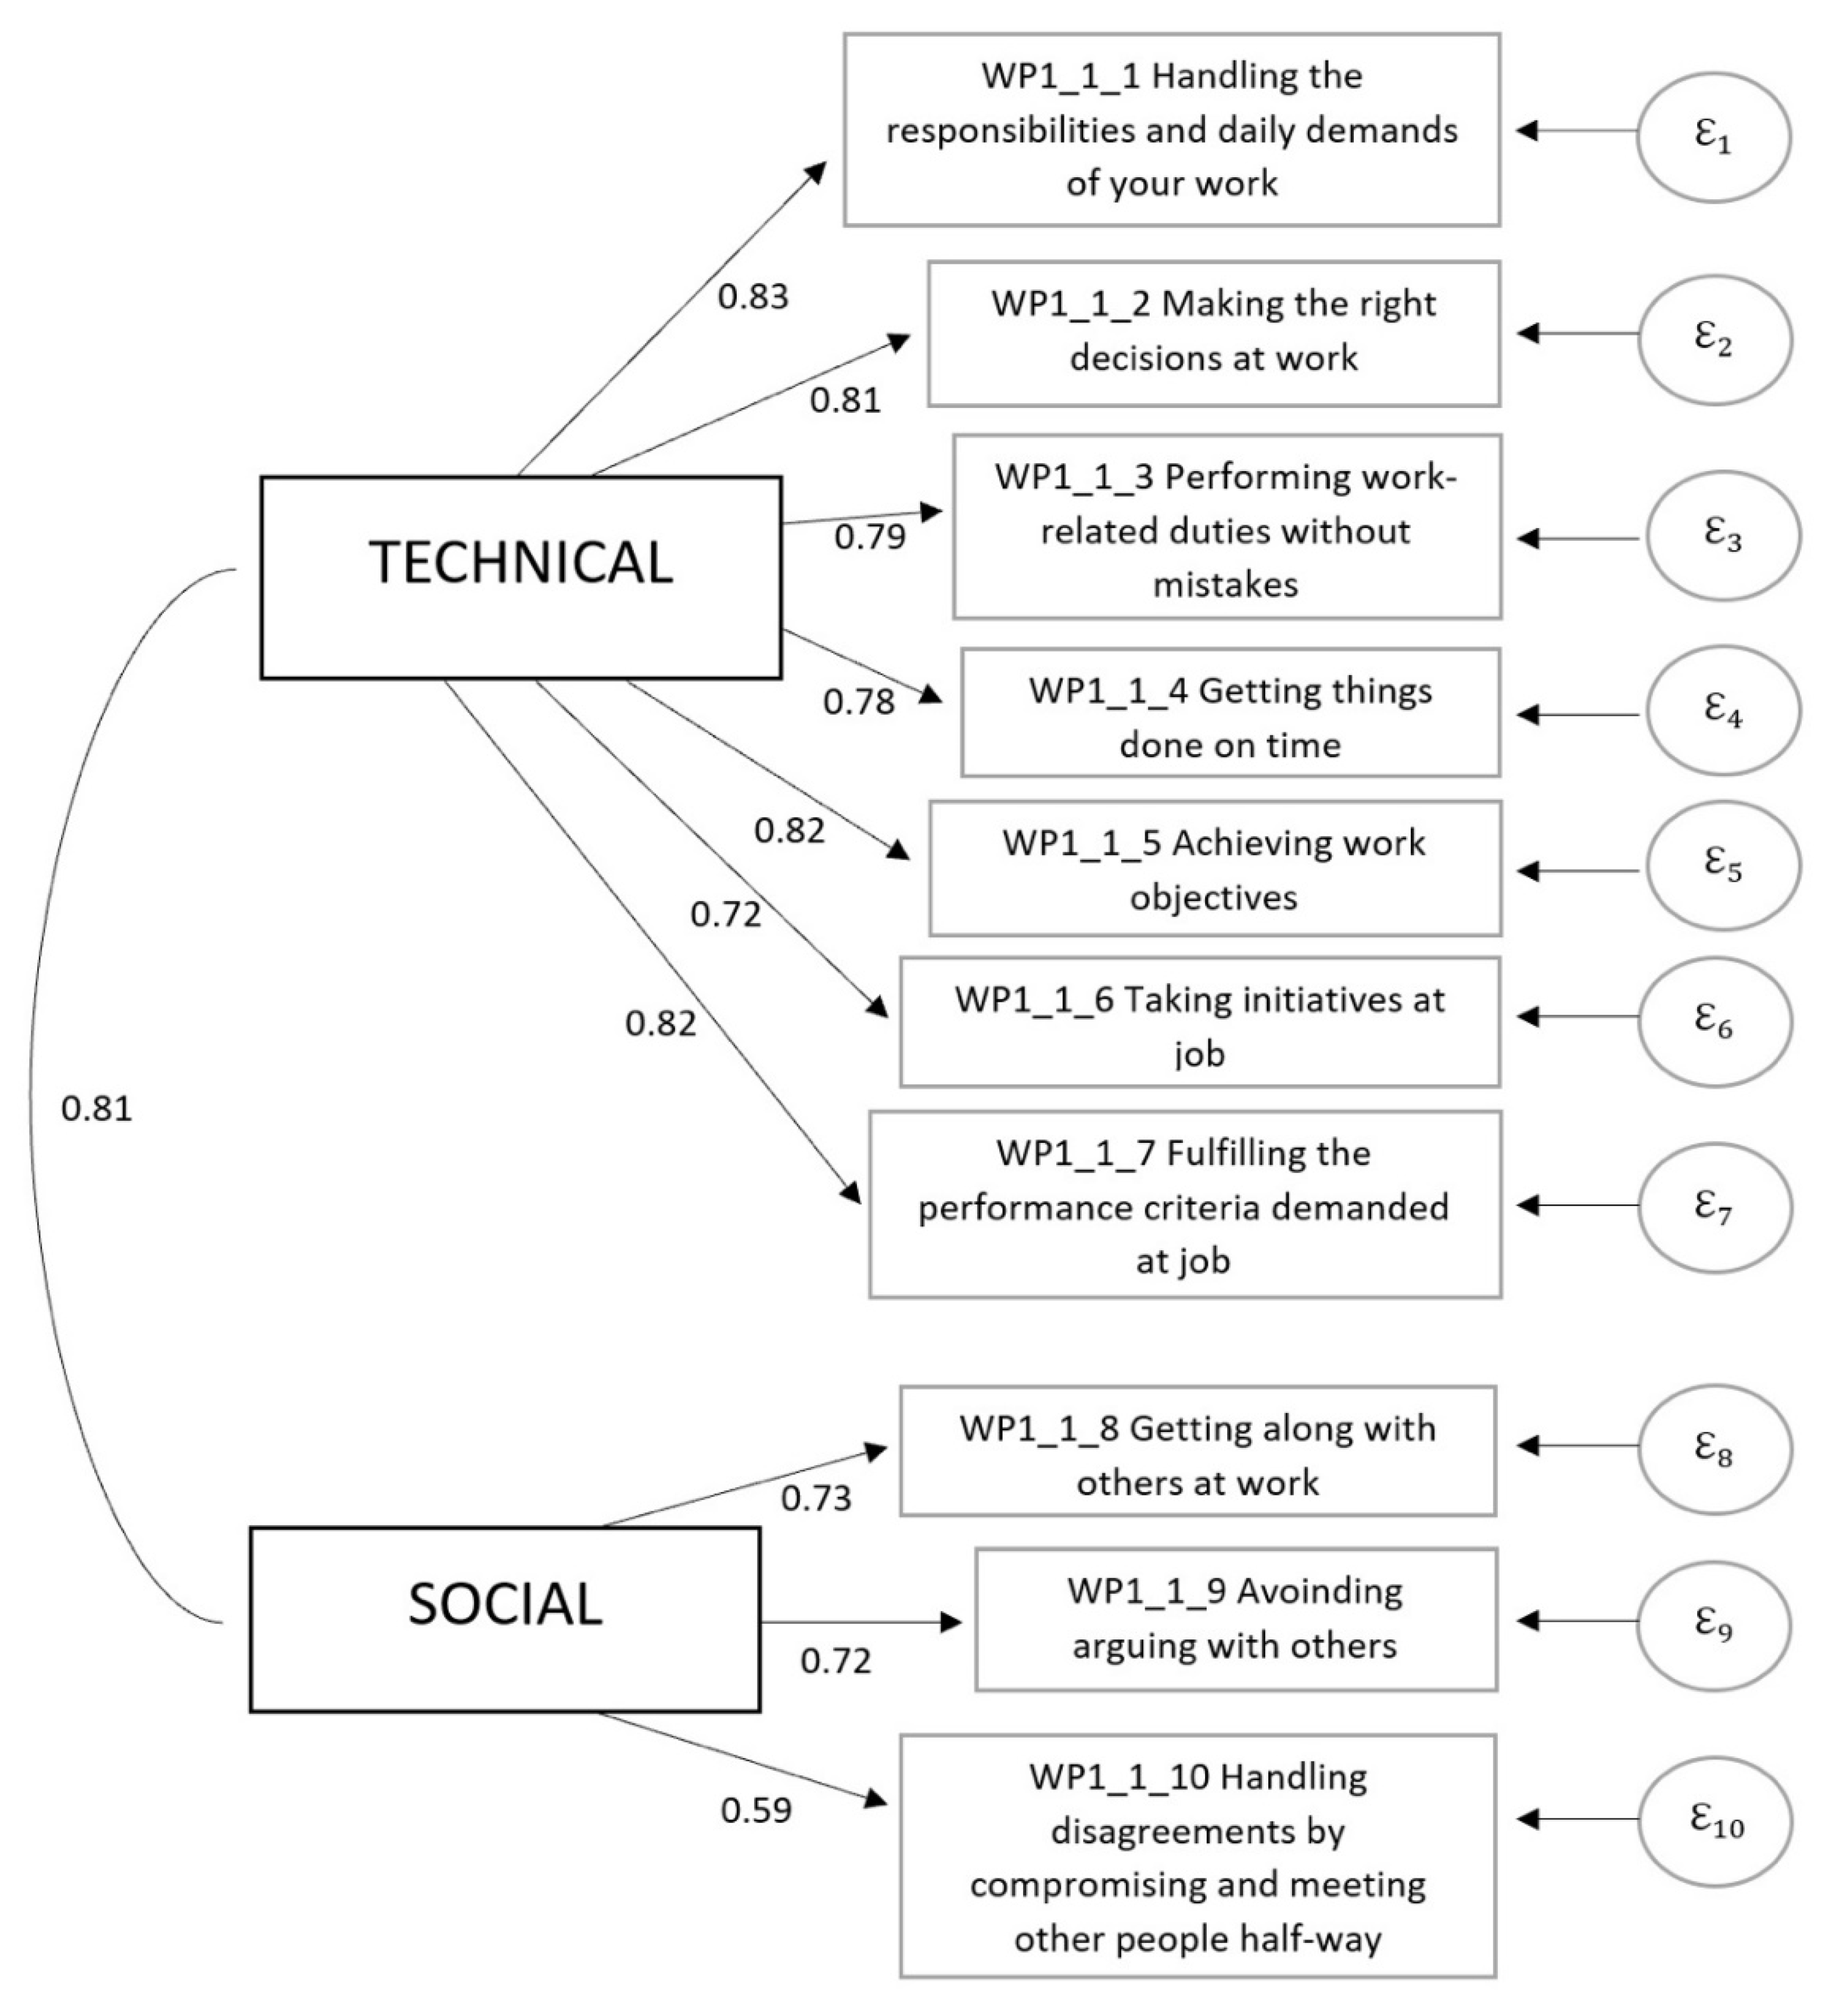
3.2. Response Variables (RVs)
3.3. Explanatory Variables (EVs)
- Employee’s profile variables:
- ⇨
- Socio-demographic characteristics: gender, age, education level, relationship status, household size, number of children in household regardless of age;
- ⇨
- Job characteristics: professional domain, experience in WFH before the pandemic, time worked from home in a regular week (share from 40 h), time worked for current employer, work experience in the current role regardless of employer.
- Organizational environment variables:
- ⇨
- WFH engagement was measured based on a battery developed by Schaufeli, W. B., Shimazu, A., Hakanen, J., Salanova, M., De Witte, H. [72] and refers to how enthusiastic and energetic the employees feel about their job;
- ⇨
- Occupational self-efficacy (effectiveness), evaluated, based on the Self-Efficacy Scale developed by Rigotti, T., Schyns, B., Mohr, G. [27], how confident the employees are in their ability to cope with difficult tasks or problems or in their ability to successfully fulfil a task;
- ⇨
- Computer-mediated (C-M) communication skills evaluated, based on the C-M communication competency scale created by Spitzberg [25], how people use various online communication technologies (for example, instant messaging, email, video conferencing, chat apps, etc.) in communicating with co-workers, and if online interactions are more productive than face-to-face interactions;
- ⇨
- Motivation was evaluated based on a battery developed by Tremblay, M. A., Blanchard, S. T., Pelletier, L. G., Villeneuve, M. [30] and covers introjected, integrated and amotivation. Introjected motivation is a type of internal motivation, and results from feeling pressure to perform well at a job, coupled with feeling shameful when the performance is not up to par. Integrated motivation is about identifying with the work itself and amotivation refers to the lack of both internal and external motivation;
- ⇨
- Job interdependence (received and initiated) evaluated if specific jobs are dependent on other activities in the organization, and was measured base on a battery developed by Morgeson and Humphrey [73];
- ⇨
- Situational constraints and organizational influencers evaluated how specific constraints specific to the workplace (furniture, IT infrastructure, documentation, video-conferencing etc.) influence activity and job performance. This variable was suggested by the previous qualitative study [12];
- ⇨
- Organizational commitment evaluated, based on a battery developed by Allen, N. J., Meyer, J. P. [35] how loyal the employees are to the company;
- ⇨
- Interpersonal trust (trust in management and trust in co-workers) meant in our study employees’ trust in supervisors, enforcing the importance of building work-environments, where employees are taught to rely on each other and are praised for their achievements as a team. These characteristics were separately measured, based on a battery developed by Cook, J. D. and Wall, T. D. [45];
- ⇨
- Performance reviews identified if the employees participated in the performance reviews, and how these were organized: formally—following a clear set of criteria and pre-set objectives; semi-formally—some indicators are discussed, but the emphasis falls on what the employee does well; or informally—when ideas, opinions, subjective work perceptions, strong and weak points are discussed.
- Work-life balance variables:
- ⇨
- Family—work conflict and work—family conflict evaluated the extent to which employees feel that family-related activities interfere with their jobs, and are based on the Family-Work Conflict Scales, developed by Netemeyer, R. G., Mcmurrian, R. C., Boles, J. [74];
- ⇨
- Professional isolation assessed the extent of professional isolation experienced by employees working remotely and was measured based on a battery developed by Golden, T. D.; Veiga, J. F.; Dino, R. N. [75];
- ⇨
- Stress was interpreted as workers’ perception of exhaustion and fatigue due to WFH and was measured based on a battery developed by Weinert, C., Maier, C., Laumer, S. [52];
- ⇨
- Job satisfaction was measured based on a batery developed by Brayfield, A. H. and Rothe, H. F. [76], and evaluated how happy the employees felt at their job, and how much they enjoyed working in the organization;
- ⇨
- Job autonomy, measured with a battery developed by Morgeson and Humphrey [73], evaluated the freedom of the employees in organizing their work and in the decision about the methods used or completing their tasks.
4. Results
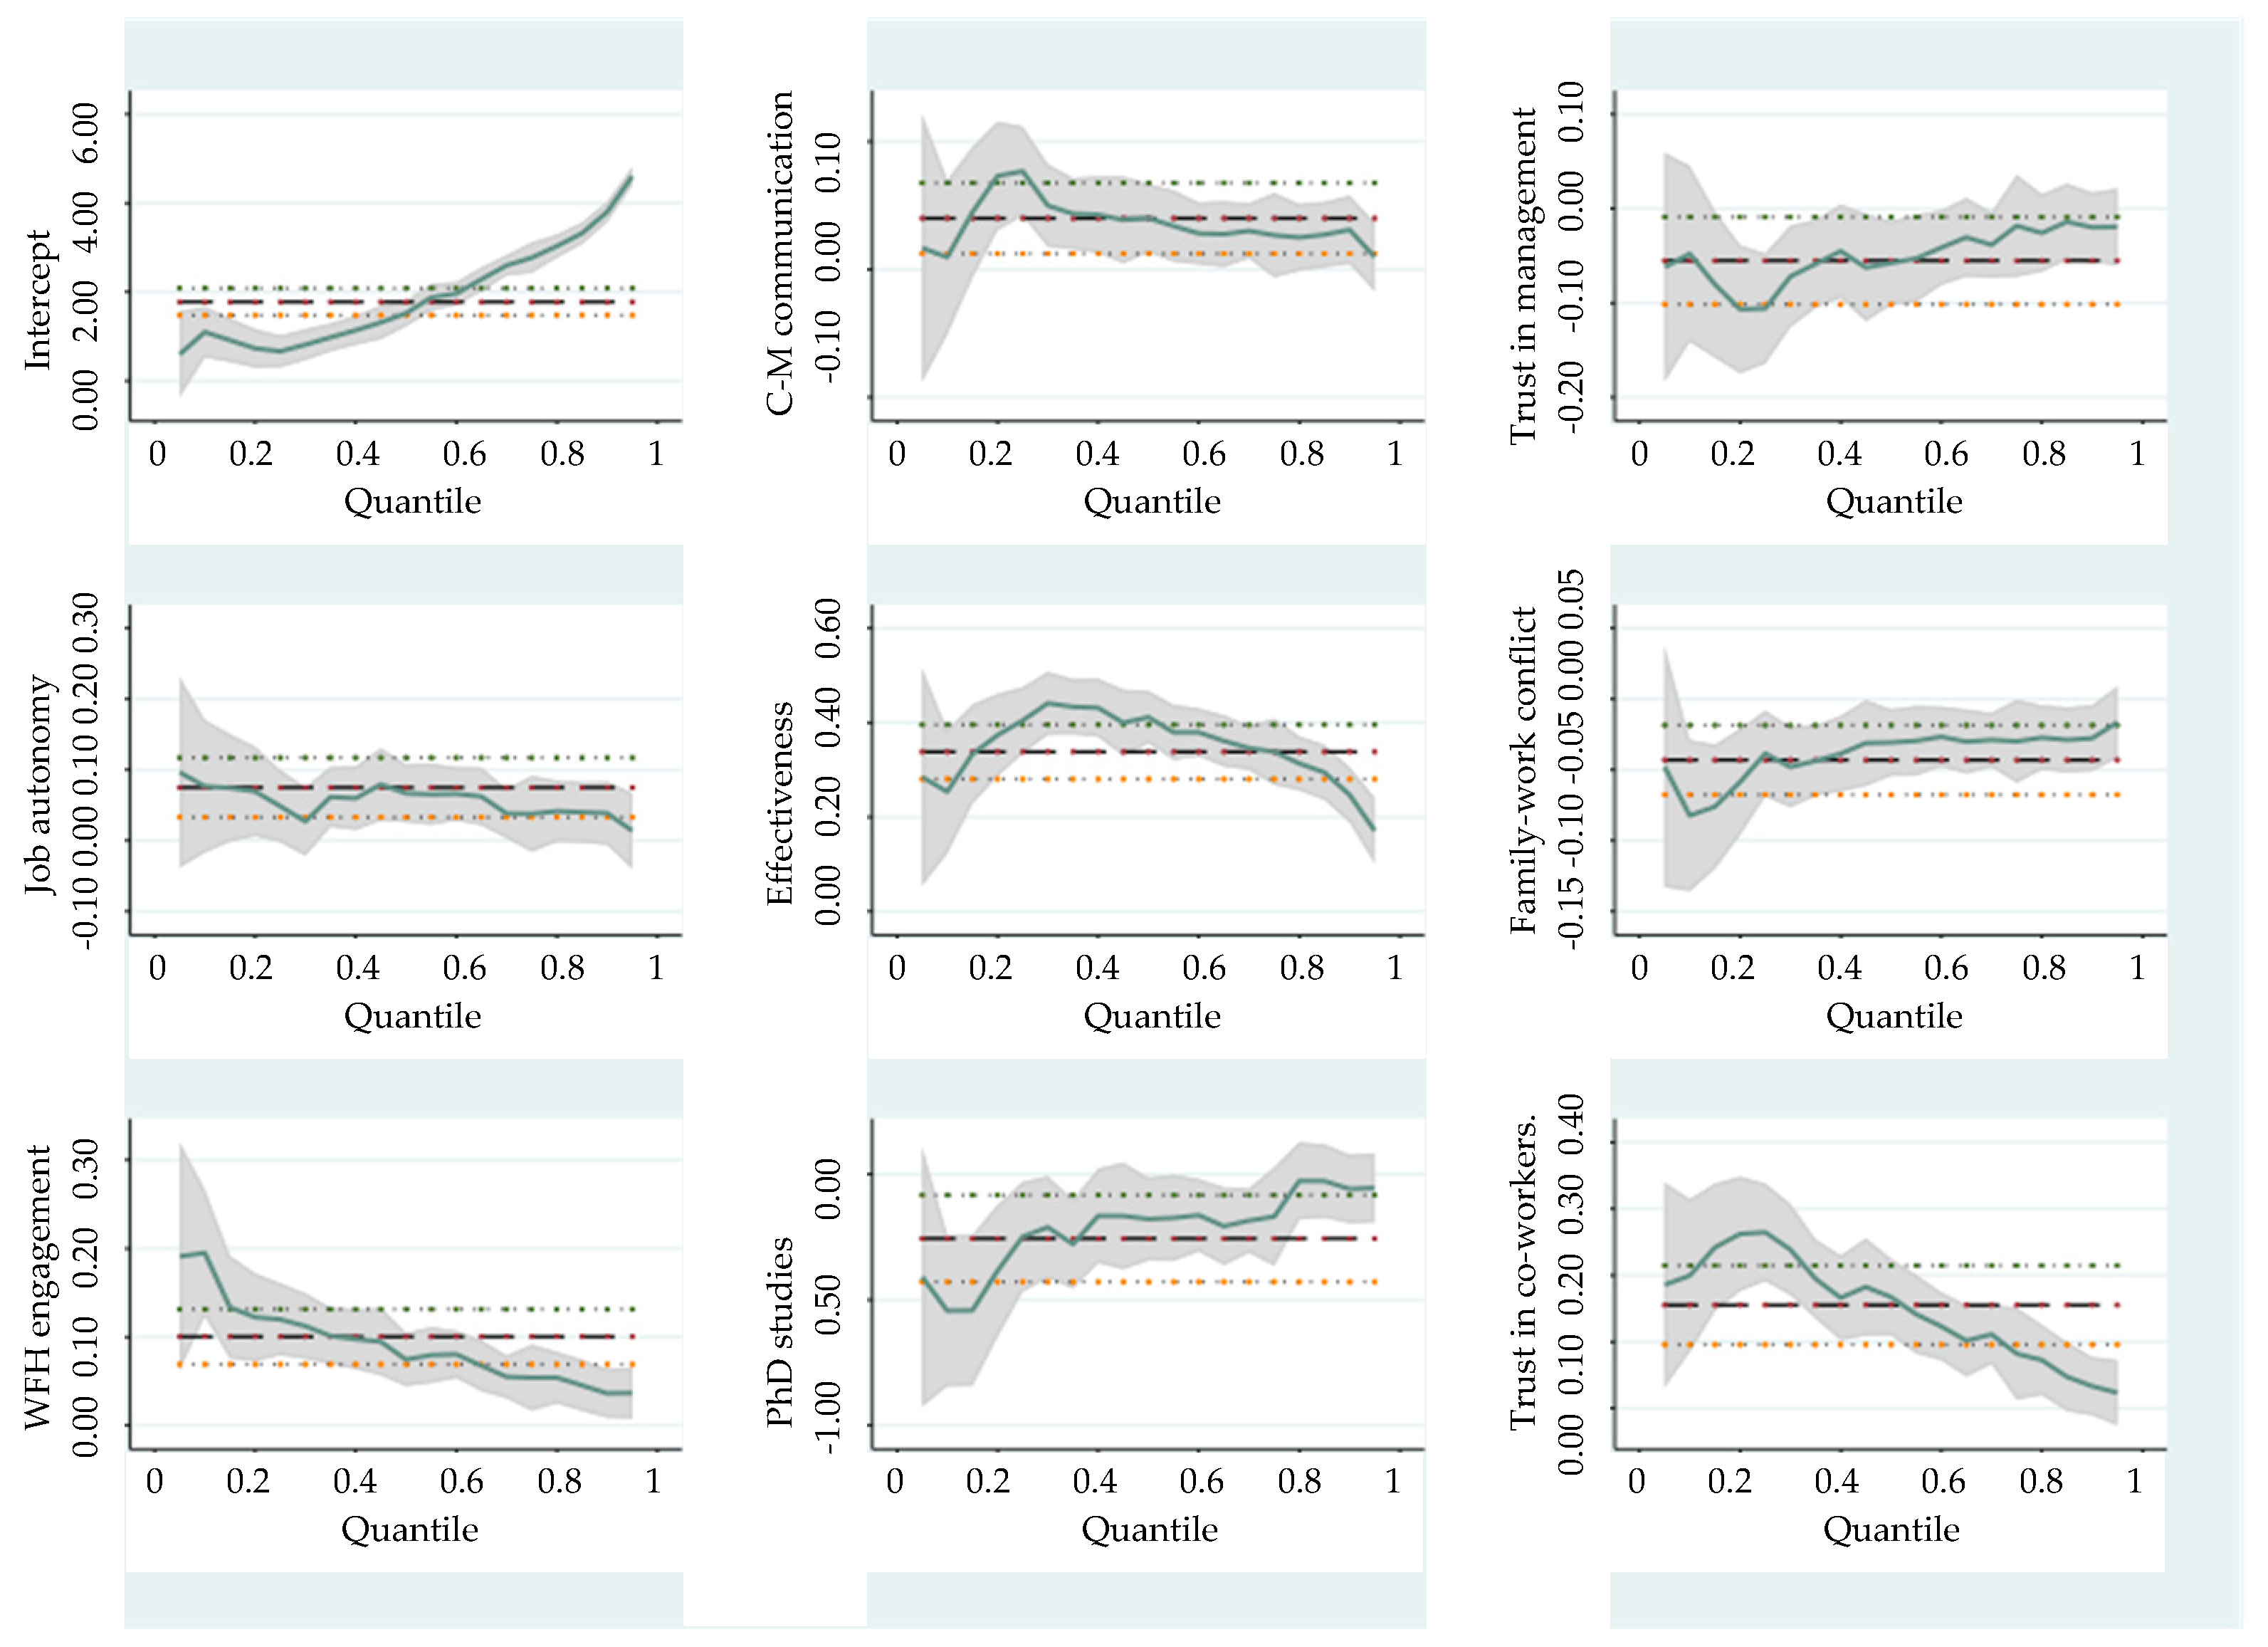
4.1. The Social Performance Model
- Q—quantile for the explanatory variable (Iv)
- q = 0.1, 0.25, 0.5, 0.75 or 0.9
- SP—Social Performance Explanatory Variable (please see Table 4)
- i = 1–8—Number of the explanatory variables
4.2. The Technical Performance Model
- Q—quantile for the explanatory variable (Iv)
- q = 0.1, 0.25, 0.5, 0.75 or 0.9
- TP—Technical Performance Explanatory Variable
- i = 1–14—Number of the explanatory variable
5. Discussions and Recommendations for Organizations
5.1. WFH Factors Predicting Both Social and Technical Performance
5.2. WFH Factors Predicting Social Performance
5.3. WFH Factors Predicting Technical Performance
6. Conclusions, Limitations and Future Research
Author Contributions
Funding
Institutional Review Board Statement
Informed Consent Statement
Data Availability Statement
Acknowledgments
Conflicts of Interest
Appendix A. The Sample Profile
| Variable/Category | % |
| R2. Gender | |
| Man | 48.0 |
| Woman | 52.0 |
| D1. Relationship status | |
| Single | 16.2 |
| In a relationship, but I do not live with my partner | 7.8 |
| Married/live with my partner | 69.8 |
| Divorced/separated/widowed | 6.2 |
| R3. Age | |
| Between 21–29 y o. | 23.0 |
| Between 30–39 y.0. | 41.0 |
| Between 40–49 y.0. | 24.0 |
| Between 50–60 y.0. | 12.0 |
| Region | |
| Bucharest | 41.0 |
| Banat Crisana Maramures | 10.0 |
| Dobrogea | 4.0 |
| Moldova | 16.0 |
| Muntenia | 10.0 |
| Oltenia | 8.0 |
| Transilvania | 11.0 |
| Locality size | |
| Urban: less than 50.000 inh | 19.0 |
| Urban: 50.000–200.000 inh. | 20.0 |
| Urban: over 200.000 inh. | 20.0 |
| Bucharest | 41.0 |
| R15. Activity domain | |
| Computers/IT/Internet/Telecommunications | 18.7 |
| Agriculture, Industry | 6.3 |
| Health. Social work | 1.5 |
| Trade, Sales | 7.3 |
| Financial/Banking/Accounting/Insurance/Taxation | 12.8 |
| Construction, Transportation | 6.4 |
| Education/Research | 18.0 |
| Architecture, Real estate, Consultancy, Communications/ Telephony/Postal services/Public administration | 7.6 |
| Services | 6.2 |
| Advertising, Mass Media/Press, Culture, Sports, Entertainment | 2.1 |
| Legal, Security | 2.1 |
| Other | 11.0 |
| R4. Education | |
| Complete upper-secondary education/high school | 3.8 |
| Vocational education (professional qualification) | 0.5 |
| Incomplete bachelor studies | 2.8 |
| Post-secondary non-tertiary education | 1.1 |
| Tertiary education—Complete bachelor studies | 45.7 |
| Tertiary education—Master studies | 41.3 |
| Tertiary education—PhD studies | 4.8 |
| D4. Children in Household | |
| No children in Household | 61.8 |
| Children in Household | 38.2 |
| 6 y.o. or younger | 27.7 |
| 7–10 y.o. | 12.9 |
| 11–13 y.o. | 9.2 |
| 14–17 y.o. | 7.0 |
| D2—Household size | |
| 1 person | 11.5 |
| 2 persons | 35.8 |
| 3 persons | 29.1 |
| 4 persons | 17.5 |
| 5 and more persons | 6.2 |
| R11. Number of hours worked from home in a regular week (Mean = 33.38; Std.Dev. = 12.7) | |
| 20 or less Between 21–39 Exactely 40 More than 40 | 24.6 20.3 35.4 19.7 |
| Share of time worked from home (from 40 h/week working time) | |
| 20–49% 50% 51–99% 100% Over 100% | 15.0 9.6 20.3 35.4 19.7 |
Appendix B. Descriptive Statistics and Scores for the Response Variables
| Response Variable | Code | Mean | Std. Dev. | Score |
| Technical performance (TP) | ||||
| Handling the responsibilities and daily demands of your work | WP1_1_1 | 6.2 | 1.05 | Technical performance score = WP1_1_1 × 0.149 + WP1_1_2 × 0.122 + WP1_1_3 × 0.119 + WP1_1_4 × 0.105 + WP1_1_5 × 0.130 + WP1_1_6 × 0.072 + WP1_1_7 × 0.151 + WP1_1_8 × 0.033 + WP1_1_9 × 0.030 + WP1_1_10 × 0.016 Average = 5.64 StDev = 0.82 Cronbach Alpha = 0.9214 |
| Making the right decisions at work | WP1_1_2 | 5.94 | 1.12 | |
| Performing your work-related duties without mistakes | WP1_1_3 | 6.01 | 1.01 | |
| Getting things done on time | WP1_1_4 | 6.1 | 1.13 | |
| Achieving your work objectives | WP1_1_5 | 6.05 | 1.16 | |
| Taking initiatives at your job | WP1_1_6 | 5.82 | 1.23 | |
| Fulfilling the performance criteria demanded at your job | WP1_1_7 | 6.22 | 1.03 | |
| Social performance (SP) | ||||
| Getting along with others at work | WP1_1_8 | 6.1 | 1.14 | Social performance score = WP1_1_1 × 0.061 + WP1_1_2 × 0.050 + WP1_1_3 × 0.049 + WP1_1_4 × 0.043 + WP1_1_5 × 0.053 + WP1_1_6 × 0.030 + WP1_1_7 × 0.062 + WP1_1_8 × 0.213 + WP1_1_9 × 0.195 + WP1_1_10 × 0.102 Average = 5.14 StDev = 0.75 Cronbach Alpha = 0.7098 |
| Avoiding arguing with others | WP1_1_9 | 6.05 | 1.22 | |
| Handling disagreements by compromising and meeting other people half-way | WP1_1_10 | 5.42 | 1.4 | |
Appendix C. Descriptive Statistics and Scores for the Explanatory Variables
| Explanatory Variable | Code | % | Mean | Std. Dev. | Score | Observations * (Item Irrelevant/Relevant for the Model) |
| Age | R3 | Appendix A | 37.17 | 9.2 | Irrelevant | |
| Gender | R2 | Appendix A | - | - | Irrelevant | |
| Number of children in household | D4 | Appendix A | - | - | D4_1. Kids in Household—(0–6 y.o.) | |
| Household size | D2 | Appendix A | - | - | D2_4_4. Household size—4 persons | |
| Relationship status | D1 | Appendix A | - | - | Irrelevant | |
| Educational level | R4 | Appendix A | - | - | R4_15. Tertiary education—PhD studies relevant for social performance | |
| Activity domain | R15 | Appendix A | - | - | Irrelevant | |
| Share of time worked from home | R11 | Appendix A | relevant for technical performance | |||
| Places worked from before the pandemic (March 2020)—From home, using devices connected to the Internet (laptop/computer, tablet, smartphone, etc.) | R8_1 | 10.4% | - | - | Irrelevant | |
| Time working for current employer—Years + (months × 1/12) | R12 | Irrelevant | ||||
| 0–2 years | R12_1 | 19.3% | - | - | ||
| 2–5 years | R12_2 | 28.0% | - | - | ||
| 5–10 years | R12_3 | 24.3% | - | - | ||
| Over 10 years | R12_4 | 28.4% | - | - | ||
| Work experience in current role regardless of employer—Years + (months × 1/12) | R13 | Irrelevant | ||||
| 0–2 years | R13_1 | 10.7% | - | - | ||
| 2–5 years | R13_2 | 20.5% | - | - | ||
| 5–10 years | R13_3 | 25.5% | - | - | ||
| 10–20 year | R13_4 | 28.1% | - | - | ||
| Over 20 years | R13_5 | 15.21% | - | - | ||
| WFH engagement—To what extent do you agree or disagree with each of the following statements below about working from home, considering your own personal experiences? (Scale 1 to 7, where 1 = do not agree at all … 7 = fully agree) | WP2 | 5.22 | 1.43 | WFH Engagement score = (WP2_1 + WP2_2 + WP2_3)/3 Cronbach Alpha = 0.8429 | relevant for social performance relevant for technical performance | |
| 1. When I work from home, I feel bursting with energy | WP2_1 | - | 5.08 | 1.7 | ||
| 2. I am enthusiastic about my job when I work from home | WP2_2 | - | 5.31 | 1.7 | ||
| 3. When I work from home, I am immersed in my work | WP2_3 | - | 5.18 | 1.6 | ||
| Effectiveness (ocupational self-efficacyy)—To what extent do you find that each of the following statements describes you personally when it comes to your work in general? (Scale 1 to 7, where 1 = do not identity at all with the statement, 7 = fully identify with it.) | WP3 | 5.75 | 0.82 | Occupational self-efficacy (Effectiveness) score = WP3_1 × 0.114 + WP3_2 × 0,167 + WP3_3 × 0.216 + WP3_4 × 0.102 + WP3_5 × 0.154 + WP3_6 × 0.194 Cronbach Alpha = 0.9048 | relevant for social performance relevant for technical performance | |
| 1. I can remain calm when facing difficulties in my job because I can rely on my abilities | WP3_1 | - | 5.91 | 1.1 | ||
| 2. When I am confronted with a problem in my job, I can usually find several solutions | WP3_2 | - | 6.04 | 1.0 | ||
| 3. Whatever comes my way in my job, I can usually handle it | WP3_3 | - | 6.23 | 1.0 | ||
| 4. My past experiences in my job have prepared me well for my occupational future | WP3_4 | - | 5.87 | 1.2 | ||
| 5. Generally, I meet the goals that I set for myself in my job | WP3_5 | - | 6.16 | 1.0 | ||
| 6. I feel prepared for most of the demands in my job | WP3_6 | - | 6.11 | 1.0 | ||
| job autonomy—To what extent the following statements fit the role/job you have in the company where you work. (Scale 1 to 7, where 1 = does not fit your situation at all, 7 = it fits perfectly) | FP1 | 5.18 | 1.06 | Job autonomy score = FP1_1 × 0.148 + FP1_2 × 0.103 + FP1_3 × 0.121 + FP1_4 × 0.135 + FP1_5 × 0.171 + FP1_6 × 0.234 Cronbach Alpha = 0.9252 | relevant for social performance relevant for technical performance | |
| 1. My job allows me to make my own decisions about how to schedule my work | FP1_1 | - | 5.68 | 1.4 | ||
| 2. My job allows me to decide on the order in which things are done on the job | FP1_2 | - | 5.72 | 1.4 | ||
| 3. My job gives me a chance to use my personal initiative in carrying out the work | FP1_3 | - | 5.77 | 1.3 | ||
| 4. My job provides me with significant autonomy in making decisions | FP1_4 | - | 5.45 | 1.4 | ||
| 5. My job allows me to make decisions about what methods I use to complete my work | FP1_5 | - | 5.78 | 1.3 | ||
| 6. My job allows me to decide on my own how to go about doing my work | FP1_6 | - | 5.77 | 1.3 | ||
| organizational commitment—To what extent do you agree with each of the statements below about your workplace? (Scale 1 to 7, where 1 = do not agree at all, 7 = totally agree) | FP5 | 4.52 | 1.43 | Organisational commitment score = (FP5_1 + FP5_2 + FP5_3+ FP5_4 + FP5_5)/5 Cronbach Alpha = 0.8601 | relevant for technical performance | |
| 1. I would be very happy to spend the rest of my life with this company | FP5_1 | - | 4.72 | 1.7 | ||
| 2. I feel like part of the family at my company | FP5_2 | - | 4.82 | 1.7 | ||
| 3. Too much of my life would be disrupted if I decided I wanted to leave my company now | FP5_3 | - | 4.75 | 1.8 | ||
| 4. I believe that loyalty is important, and therefore I feel a sense of moral obligation to stay | FP5_4 | - | 4.46 | 1.8 | ||
| 5. If I got another offer for a better job elsewhere, I would not feel it was right to leave my company | FP5_5 | - | 3.95 | 2.0 | ||
| interpresonal trust at work: Trust in co-workers/Trust in management—To what extent do you agree or disagree with each of the following statements about your job? (Scale 1 to 7, where 1 = do not agree at all, 7 = totally agree) | FP6 | 4.68 | 1.17 | Trust_coworkers score = FP6_1 × 0.040 + FP6_2 × 0.182 + FP6_3 × 0.043 + FP6_4 × 0.034 + FP6_5 × 0.223 + FP6_6 × 0.239 + FP6_7 × 0.065 + FP6_8 × 0.099 Cronbach Alpha = 0.8766 Trust_management score = FP6_1 × 0.283 + FP6_2 × 0.041 + FP6_3 × 0.305 + FP6_4 × 0.244 + FP6_5 × 0.050 + FP6_6 × 0.053 + FP6_7 × 0.015 + FP6_8 × 0.022 Cronbach Alpha = 0.9019 | relevant for social performance (Trust in management & Trust in co-workers) relevant for technical performance (Trust in co-workers) | |
| 1. Management at my company are really trying to understand the employees’ points of view | FP6_1 | - | 4.53 | 1.8 | ||
| 2. If I got into difficulties at work, I trust my workmates would try and help me out | FP6_2 | - | 5.26 | 1.5 | ||
| 3. Management can be trusted to make sensible decisions for the company’s future | FP6_3 | - | 4.67 | 1.7 | ||
| 4. I feel confident that the company will always try to treat me fairly | FP6_4 | - | 4.81 | 1.7 | ||
| 5. Most of my workmates can be relied upon to do as they say they will do | FP6_5 | - | 5.15 | 1.5 | ||
| 6. I have full confidence in the skills of my workmates | FP6_6 | - | 5.12 | 1.4 | ||
| 7. Most of my fellow workers would do their work efficiently even if supervisors/ managers were not around | FP6_7 | - | 4.93 | 1.8 | ||
| 8. I can rely on my workmates not to make my job more difficult by careless work | FP6_8 | - | 4.86 | 1.6 | ||
| C-M (computer mediated) communication—We are interested in how people use various online communication technologies (for example, instant messaging, email, video conferencing, chat apps, etc.). Please indicate to what extent each of the statements below describes you. (Scale 1 to 7, where 1 = do not agree at all, 7 = totally agree) | PRO1 | 4.69 | 1.49 | C-M_communication = (PRO1_1 + PRO1_2)/2 Cronbach Alpha = 0.6969 | relevant for social performance relevant for technical performance | |
| 1. I get my ideas across clearly in online conversations with others | PRO1_1 | - | 5.14 | 1.6 | ||
| 2. My online interactions are more productive than my face-to-face interactions | PRO1_2 | - | 4.21 | 1.8 | ||
| Motivation—Please indicate to what extent you agree that each of the following statements corresponds to the reasons why you are presently involved in your work (Scale 1 to 7, where 1 = do not agree at all, 7 = totally agree) | A03 | - | - | relevant for technical performance | ||
| 2. Amotivation—I ask myself this question, I do not seem to be able to manage the important tasks related to this work | A03_2 | - | 5.30 | 1.4 | ||
| 3. Integrated motivation—Because it has become a fundamental part of who I am | A03_3 | - | 2.73 | 1.8 | ||
| 6. Introjected motivation—Because I want to be very good at this work, otherwise I would be very disappointed | A03_6 | - | 5.20 | 1.5 | ||
| Stress—Please think about the way you feel when your work from home. To what extent do you agree that each of the following statements describes the way you feel when you work from home? (Scale 1 to 7, where 1 = do not agree at all, 7 = totally agree) | PWB2 | 3.03 | 1.75 | Stress score = PWB2_1 × 0.245 + PWB2_2 × 0.265 + PWB2_3 × 0.132 + PWB2_4 × 0.308 Cronbach Alpha = 0.9550 | relevant for technical performance | |
| 1. I feel exhausted from working from home | PWB2_1 | - | 3.15 | 2.0 | ||
| 2. I feel tired from working from home | PWB2_1 | - | 3.24 | 2.0 | ||
| 3. Working all day at home is a strain for me | PWB2_1 | - | 3.25 | 2.0 | ||
| 4. I feel drained from working from home | PWB2_1 | - | 3.26 | 2.0 | ||
| Family—work conflict—Please think about the days you have been working from home. To what extent do you agree that the following statements fit your own situation? (Scale 1 to 7, where 1 = do not agree at all, 7 = totally agree) | WB2_1 | 2.88 | 1.57 | Family—work conflict score = (WB2_1_1 + WB2_1_2 + WB2_1_3)/3 Cronbach Alpha = 0.8249 | relevant for social performance relevant for technical performance | |
| 1. The demands of my family (spouse/ partner, kids, parents) interfere with work-related activities | WB2_1_1 | - | 3.18 | 1.9 | ||
| 2. I have to put off doing things at work because of personal demands on my time | WB2_1_2 | - | 2.70 | 1.8 | ||
| 3. Things I want to do at work do not get done in time because of the demands of my family | WB2_1_3 | - | 2.82 | 1.8 | ||
| Work—family conflict—Please think about the days you have been working from home. To what extent do you agree that the following statements fit your own situation? (Scale 1 to 7, where 1 = do not agree at all, 7 = totally agree) | WB2_2 | 3.20 | 1.73 | Work—family conflict score = (WB2_2_1 + WB2_2_2 + WB2_2_3)/3 Cronbach Alpha = 0.8888 | Irrelevant | |
| 1. When I work from home the demands of my work interfere with my home and family life | WB2_2_1 | - | 3.12 | 1.9 | ||
| 2. The amount of time my job takes up makes it difficult to fulfil household responsibilities | WB2_2_2 | - | 3.28 | 2.0 | ||
| 3. Due to work-related duties, I have to make changes to my plans for family activities | WB2_2_2 | - | 3.34 | 1.9 | ||
| Situational constraints—To support remote work, has your company offered you … (Scale 1. Yes, enough, 2. Yes, but not enough, 3. No, although I needed it, 4. No, and I did not need it) | FP4 | 2.30 | 0.67 | Situational constraints score = (FP4_1+ FP4_2+ FP4_3+ FP4_4+ FP4_5+ FP4_6+ FP4_7+ FP4_8)/8 Cronbach Alpha = 0.7899 | Irrelevant | |
| 1. IT equipment needed to carry out your work-related activities (laptop/computer, headphones, keyboard, etc.) | FP4_1 | Yes, enough—55.8% Yes, but not enough—18.8% No, although I needed it—14.7% No, and I did not need it—10.7% | ||||
| 2. Access to seminars/ courses for personal development (e.g., parenting courses, coaching) | FP4_2 | Yes, enough—29.8% Yes, but not enough—20.2% No, although I needed it—24.5% No, and I did not need it—25.4% | ||||
| 3. Online team building sessions | FP4_3 | Yes, enough—23.6% Yes, but not enough—16.8% No, although I needed it—27.7% No, and I did not need it—31.9% | ||||
| 4. Office furniture (desk, office chair) | FP4_4 | Yes, enough—19.4% Yes, but not enough—8.7% No, although I needed it—33.4% No, and I did not need it—38.5% | ||||
| 5. Access to resources for professional development (workshops, courses, trainings) | FP4_5 | Yes, enough—33.3% Yes, but not enough—21.5% No, although I needed it—28.4% No, and I did not need it—16.7% | ||||
| 6. Option to have semi-formal or informal discussions with your immediate superior to understand your needs | FP4_6 | Yes, enough—54.6% Yes, but not enough—22.4% No, although I needed it—12.5% No, and I did not need it—10.5% | ||||
| 7. Reimbursement of certain maintenance costs you incur (Internet bill, electricity bill, etc.) | FP4_7 | Yes, enough—12.9% Yes, but not enough—8.6% No, although I needed it—56.0% No, and I did not need it—22.5% | ||||
| 8. Access to the resources needed to carry out your work-related activities—documentation, virtual access to certain files | FP4_8 | Yes, enough—60.2% Yes, but not enough—20.9% No, although I needed it—12.5% No, and I did not need it—6.4% | ||||
| Performance review—Do you ever have performance evaluation meetings with your manager? | JE1 | Irrelevant | ||||
| 1. No, our workplace does not evaluate individual performance | JE1_1 | 17.5% | ||||
| 2. Yes, once a year | JE1_2 | 39.9% | ||||
| 3. Yes, two times a year | JE1_3 | 20.2% | ||||
| 4. Yes, three-four times a year or more often | JE1_4 | 22.4% | ||||
| Satisfaction—To what extent when working from home do you find that… (Scale 1 to 7, where 1 = do not agree at all, 7 = totally agree) | SAT1 | 5.35 | 1.16 | Satisfaction = (SAT1_2 + SAT1_4 + SAT1_6)/3 Cronbach Alpha = 0.7665 | Irrelevant | |
| 2. You feel fairly well satisfied with your present job | SAT1_2 | - | 5.62 | 1.3 | ||
| 4. You feel that you are happier in your work than most other people | SAT1_4 | - | 5.13 | 1.5 | ||
| 6. You find real enjoyment in your work | SAT1_6 | - | 5.30 | 1.5 | ||
| Professional isolation—Think about the way you feel when working from home. To what extent do you agree that each of the following statements describes the way you feel when you work from home? (Scale 1 to 7, where 1 = do not agree at all, 7 = totally agree) | PWB1 | 2.50 | 1.02 | Profesional isolation = PWB1_1 × 0.031 + PWB1_2 × 0.120 + PWBB1_3 × 0.089 + PWB1_4 × 0.109 + PWB1_5 × 0.264 + PWB1_6 × 0.045 Cronbach Alpha = 0.8830 | Irrelevant | |
| 1. I feel left out on activities and meetings that could enhance my career | PWB1_1 | - | 3.11 | 1.8 | ||
| 2. I miss out on opportunities to be mentored | PWB1_2 | - | 3.92 | 1.9 | ||
| 3. I miss face-to-face contact with co-workers | PWB1_3 | - | 4.67 | 1.9 | ||
| 4. I feel isolated | PWB1_4 | - | 3.30 | 1.9 | ||
| 5. I miss the emotional support of co-workers | PWB1_5 | - | 3.69 | 1.9 | ||
| 6. I miss informal interactions with others | PWB1_6 | - | 4.88 | 1.8 | ||
| Interdependence—To what extent the following statements fit the role/job you have in the company where you work. (Scale 1 to 7, where 1 = statement does not fit your situation at all, 7 = it fits perfectly). | FP2 | 3.58 | 1.53 | Received interdependence score = FP2_1 × 0.041 + FP2_2 × 0.033 + FP2_3 × 0.044 + FP2_4 × 0.253 + FP2_5 × 0.325 + FP2_6 × 0.207 Cronbach Alpha = 0.8978 Initiated interdependence score = FP2_1 × 0.295 + FP2_2 × 0.239 + FP2_3 × 0.313 + FP2_4 × 0.039 + FP2_5 × 0.050 + FP2_6 × 0.032 Cronbach Alpha = 0.9103 | Irrelevant | |
| 1. My job requires me to accomplish my work duties before others complete their job | FP2_1 | - | 4.15 | 2.0 | ||
| 2. Other jobs depend directly on my job | FP2_2 | - | 4.44 | 2.0 | ||
| 3. Unless my job gets done, other jobs cannot be completed | FP2_3 | - | 3.91 | 2.0 | ||
| 4. My job activities are greatly affected by the work of other people | FP2_4 | - | 3.91 | 1.9 | ||
| 5. My job depends on the work of many different people for its completion | FP2_5 | - | 4.08 | 1.9 | ||
| 6. My job cannot be done unless others do their work | FP2_6 | - | 3.64 | 2.0 | ||
| Interaction between gender and children in household regardless age | ||||||
| Female and have children in household | 21.35% | |||||
| Men and have children in household | 17.98% | |||||
| * Based on results of Backward stepwise regression (Mean Variance Inflation Factor = 2.48). | ||||||
References
- Galanti, T.; Guidetti, G.; Mazzei, E.; Zappalà, S.; Toscano, F. Work from Home during the COVID-19 Outbreak: The Impact on Employees’ Remote Work Productivity, Engagement and Stress. J. Occup. Environ. Med. 2021, 63, e426–e432, Publish Ahead of Print. [Google Scholar] [CrossRef] [PubMed]
- European Parliament. Directorate General for Internal Policies of the Union. In The Impact of Teleworking and Digital Work on Workers and Society: Special Focus on Surveillance and Monitoring, as Well as on Mental Health of Workers; Publications Office: Luxembourg, 2021. [Google Scholar]
- Iorganda, A.-M.; Maftei, M. Working from Home in Romania during COVID-19 Lockdown across Occupations and Economic Sectors. August 2021, 5, 484–492. [Google Scholar]
- Simion, I.; Tomescu, C.; Anton, A. A Leadership Agenda to Take on Tomorrow; PwC’s 24th Annual Global CEO Survey, 2021 Key findings for Romania; PwC: Bucharest, Romania, 2021; pp. 1–60. [Google Scholar]
- Berg, J.; Furrer, M.; Harmon, E.; Rani, U.; Silberman, M.S. Digital Labour Platforms and the Future of Work: Towards Decent Work in the Online World; International Labour Organization: Geneva, Switzerland, 2018; ISBN 978-92-2-031024-3. [Google Scholar]
- Toffler, A. The Third Wave; Bantam: Toronto, ON, Canada, 1981; ISBN 978-0-553-14431-4. [Google Scholar]
- Handy, C.B. What Jobs Will There Be? What Will Life Be like? What Needs to Be Done? In The Future of Work: A Guide to a Changing Society; Blackwell: Oxford, UK, 1984; ISBN 978-0-85520-689-5. [Google Scholar]
- Vyas, L.; Butakhieo, N. The Impact of Working from Home during COVID-19 on Work and Life Domains: An Exploratory Study on Hong Kong. Policy Des. Pract. 2020, 4, 1–18. [Google Scholar] [CrossRef]
- Kitagawa, R.; Kuroda, S.; Okudaira, H.; Owan, H. Working from Home and Productivity under the COVID-19 Pandemic: Using Survey Data of Four Manufacturing Firms. PLoS ONE 2021, 16, e0261761. [Google Scholar] [CrossRef] [PubMed]
- Choukir, J.; Alqahtani, M.S.; Khalil, E.; Mohamed, E. Effects of Working from Home on Job Performance: Empirical Evidence in the Saudi Context during the COVID-19 Pandemic. Sustainability 2022, 14, 3216. [Google Scholar] [CrossRef]
- Angelici, M.; Profeta, P. Smart-Working: Work Flexibility without Constraints. SSRN J. 2020. [Google Scholar] [CrossRef]
- Săvescu, R.; Kifor, Ș.; Dănuț, R.; Rusu, R. Transition from Office to Home Office: Lessons from Romania during COVID-19 Pandemic. Sustainability 2022, 14, 5758. [Google Scholar] [CrossRef]
- Abramis, D.J. Relationship of Job Stressors to Job Performance: Linear or an Inverted-U? Psychol. Rep. 1994, 75, 547–558. [Google Scholar] [CrossRef]
- Boyatzis, R.E. The Competent Manager: A Model for Effective Performance; John Wiley & Sons: New York, NY, USA, 1982. [Google Scholar]
- Campo, A.M.D.V.; Avolio, B.; Carlier, S.I. The Relationship between Telework, Job Performance, Work–Life Balance and Family Supportive Supervisor Behaviours in the Context of COVID-19. Glob. Bus. Rev. 2021, 097215092110499. [Google Scholar] [CrossRef]
- Ellison, N.B. Social Impacts: New Perspectives on Telework. Soc. Sci. Comput. Rev. 1999, 17, 338–356. [Google Scholar] [CrossRef]
- Mann, S.; Varey, R.; Button, W. An Exploration of the Emotional Impact of Tele-working via Computer-mediated Communication. J. Manag. Psychol. 2000, 15, 668–690. [Google Scholar] [CrossRef]
- Gajendran, R.S.; Harrison, D.A. The Good, the Bad, and the Unknown about Telecommuting: Meta-Analysis of Psychological Mediators and Individual Consequences. J. Appl. Psychol. 2007, 92, 1524–1541. [Google Scholar] [CrossRef]
- Allen, T.D.; Golden, T.D.; Shockley, K.M. How Effective Is Telecommuting? Assessing the Status of Our Scientific Findings. Psychol. Sci. Public Interest 2015, 16, 40–68. [Google Scholar] [CrossRef] [PubMed]
- Sandoval-Reyes, J.; Idrovo-Carlier, S.; Duque-Oliva, E.J. Remote Work, Work Stress, and Work–Life during Pandemic Times: A Latin America Situation. Int. J. Environ. Res. Public Health 2021, 18, 7069. [Google Scholar] [CrossRef] [PubMed]
- Schieman, S.; Badawy, P.J.; Milkie, M.A.; Bierman, A. Work-Life Conflict during the COVID-19 Pandemic. Socius 2021, 7, 237802312098285. [Google Scholar] [CrossRef]
- Bakker, A.B.; Bal, M.P. Weekly Work Engagement and Performance: A Study among Starting Teachers. J. Occup. Organ. Psychol. 2010, 83, 189–206. [Google Scholar] [CrossRef]
- Van Zyl, L.E.; Deacon, E.; Rothmann, S. Towards Happiness: Experiences of Work-Role Fit, Meaningfulness and Work Engagement of Industrial/Organisational Psychologists in South Africa. SA J. Ind. Psychol. 2010, 36, 1–10. [Google Scholar] [CrossRef]
- Mehta, P. Work from Home—Work Engagement amid COVID-19 Lockdown and Employee Happiness. J. Public Aff. 2021, 21, e2709. [Google Scholar] [CrossRef]
- Spitzberg, B.H. Preliminary Development of a Model and Measure of Computer-Mediated Communication (CMC) Competence. J. Comput. Mediat. Commun. 2006, 11, 629–666. [Google Scholar] [CrossRef]
- Bandura, A. Self-Efficacy: Toward a Unifying Theory of Behavioral Change. Psychol. Rev. 1977, 84, 191–215. [Google Scholar] [CrossRef]
- Rigotti, T.; Schyns, B.; Mohr, G. A Short Version of the Occupational Self-Efficacy Scale: Structural and Construct Validity across Five Countries. J. Career Assess. 2008, 16, 238–255. [Google Scholar] [CrossRef]
- Hellriegel, D.; Slocum, J.W.; Woodman, R.W. Organizational Behavior; South-Western College Pub: Cincinnati, OH, USA, 1998; ISBN 978-0-538-88024-4. [Google Scholar]
- Vroom, V.H. Work and Motivation; Wiley: New York, NY, USA, 1964. [Google Scholar]
- Tremblay, M.A.; Blanchard, C.M.; Taylor, S.; Pelletier, L.G.; Villeneuve, M. Work Extrinsic and Intrinsic Motivation Scale: Its Value for Organizational Psychology Research. Can. J. Behav. Sci./Rev. Can. Des Sci. Du Comport. 2009, 41, 213–226. [Google Scholar] [CrossRef]
- Mahdiyeh, M.; Nakhaei, H.; Kebriaei, A. Impact of Organizational Culture on Productivity: A Study among Employees of Ministry of Youth and Sports, Iran. Int. J. Humanit. Cult. Stud. 2016, 3, 9. [Google Scholar]
- Mento, A.J.; Steel, P.R.; Karren, J.R. A Meta-Analytic Study of the Effects of Goal Setting on Task Performance: 1966–1984. Organ. Behav. Hum. Decis. Processes 1987, 39, 52–83. [Google Scholar] [CrossRef]
- Locke, E.A.; Latham, G.P. (Eds.) New Developments in Goal Setting and Task Performance; Routledge: New York, NY, USA, 2013; ISBN 978-0-415-88548-5. [Google Scholar]
- Newstrom, J.W. Organizational Behaviour-Human Behaviour at Work, 12th ed.; McGraw Hill International Edition: New York, NY, USA, 2007. [Google Scholar]
- Allen, N.J.; Meyer, J.P. The Measurement and Antecedents of Affective, Continuance and Normative Commitment to the Organization. J. Occup. Psychol. 1990, 63, 1–18. [Google Scholar] [CrossRef]
- Meyer, J.P.; Stanley, D.J.; Herscovitch, L.; Topolnytsky, L. Affective, Continuance, and Normative Commitment to the Organization: A Meta-Analysis of Antecedents, Correlates, and Consequences. J. Vocat. Behav. 2002, 61, 20–52. [Google Scholar] [CrossRef]
- Lee, H.; Lee, S.-Y. Is More Commitment Always Better? A Study on the Side Effects of Excessive Organizational Commitment on Work–Family Conflict. Rev. Public Pers. Adm. 2021, 41, 25–56. [Google Scholar] [CrossRef]
- Jaramillo, F.; Mulki, J.P.; Marshall, G.W. A Meta-Analysis of the Relationship between Organizational Commitment and Salesperson Job Performance: 25 Years of Research. J. Bus. Res. 2005, 58, 705–714. [Google Scholar] [CrossRef]
- Mathieu, J.E.; Zajac, D.M. A Review and Meta-Analysis of the Antecedents, Correlates, and Consequences of Organizational Commitment. Psychol. Bull. 1990, 108, 171–194. [Google Scholar] [CrossRef]
- Taboroši, S.; Strukan, E.; Poštin, J.; Konjikušić, M.; Nikolić, M. Organizational Commitment and Trust at Work by Remote Employees. J. Eng. Manag. Compet. 2020, 10, 48–60. [Google Scholar] [CrossRef]
- Al-Omari, K.; Okasheh, H. The Influence of Work Environment on Job Performance: A Case Study of Engineering Company in Jordan. Int. J. Appl. Eng. Res. 2017, 12, 7. [Google Scholar]
- Mayer, R.C.; Davis, J.H.; Schoorman, F.D. An Integrative Model of Organizational Trust. Acad. Manag. Rev. 1995, 20, 709. [Google Scholar] [CrossRef]
- Tan, H.H.; Lim, A.K.H. Trust in Coworkers and Trust in Organizations. J. Psychol. 2009, 143, 45–66. [Google Scholar] [CrossRef] [PubMed]
- Mayer, R.C.; Gavin, M.B. Trust in Management and Performance: Who Minds the Shop While the Employees Watch the Boss? Acad. Manag. J. 2005, 48, 874–888. [Google Scholar] [CrossRef]
- Cook, J.; Wall, T. New Work Attitude Measures of Trust, Organizational Commitment and Personal Need Non-Fulfilment. J. Occup. Psychol. 1980, 53, 39–52. [Google Scholar] [CrossRef]
- Parker, S.; Knight, C.; Keller, A. Remote Managers Are Having Trust Issues. Available online: https://hbr.org/2020/07/remote-managers-are-having-trust-issues (accessed on 6 July 2022).
- Mortensen, M.; Gardner, H. WFH Is Corroding Our Trust in Each Other. Available online: https://hbr.org/2021/02/wfh-is-corroding-our-trust-in-each-other (accessed on 7 June 2022).
- Guinot, J.; Chiva, R. Vertical Trust within Organizations and Performance: A Systematic Review. Hum. Resour. Dev. Rev. 2019, 18, 196–227. [Google Scholar] [CrossRef]
- Iddagoda, Y.A.; Opatha, H.H.D.N.P. Relationships and Mediating Effects of Employee Engagement: An Empirical Study of Managerial Employees of Sri Lankan Listed Companies. SAGE Open 2020, 10, 215824402091590. [Google Scholar] [CrossRef]
- Talukder, A.K.M.; Vickers, M.; Khan, A. Supervisor Support and Work-Life Balance: Impacts on Job Performance in the Australian Financial Sector. Pers. Rev. 2018, 47, 727–744. [Google Scholar] [CrossRef]
- Mann, S.; Holdsworth, L. The Psychological Impact of Teleworking: Stress, Emotions and Health. New Technol. Work. Employ. 2003, 18, 196–211. [Google Scholar] [CrossRef]
- Weinert, C.; Maier, C.; Laumer, S. Why Are Teleworkers Stressed? An Empirical Analysis of the Causes of Telework-Enabled Stress. Wirtsch. Proc. 2015, 1407–1421. [Google Scholar]
- Duxbury, L.E.; Higgins, C.A. Gender Differences in Work-Family Conflict. J. Appl. Psychol. 1991, 76, 60–74. [Google Scholar] [CrossRef]
- Karatepe, O.M. The Effects of Work Overload and Work-family Conflict on Job Embeddedness and Job Performance: The Mediation of Emotional Exhaustion. Int. J. Contemp. Hosp. Manag. 2013, 25, 614–634. [Google Scholar] [CrossRef]
- Ryff, C.D.; Friedman, E.M.; Morozink, J.A.; Tsenkova, V. Chapter 4 Psychological Resilience in Adulthood and Later Life: Implications for Health. Annu. Rev. Gerontol. Geriatr. 2012, 32, 73–92. [Google Scholar] [CrossRef]
- Rogers, C.R. On Becoming a Person: A Therapist’s View of Psychotheraphy; Houghton Mifflin: Boston, MA, USA, 1961. [Google Scholar]
- Brooks, S.K.; Webster, R.K.; Smith, L.E.; Woodland, L.; Wessely, S.; Greenberg, N.; Rubin, G.J. The Psychological Impact of Quarantine and How to Reduce It: Rapid Review of the Evidence. Lancet 2020, 395, 912–920. [Google Scholar] [CrossRef] [Green Version]
- Holt-Lunstad, J.; Smith, T.B.; Baker, M.; Harris, T.; Stephenson, D. Loneliness and Social Isolation as Risk Factors for Mortality: A Meta-Analytic Review. Perspect. Psychol. Sci. 2015, 10, 227–237. [Google Scholar] [CrossRef] [PubMed]
- Hawkley, L.C.; Burleson, M.H.; Berntson, G.G.; Cacioppo, J.T. Loneliness in Everyday Life: Cardiovascular Activity, Psychosocial Context, and Health Behaviors. J. Personal. Soc. Psychol. 2003, 85, 105–120. [Google Scholar] [CrossRef]
- Palmer, C. How to Deal with Stress Caused by Working from Home. Available online: https://www.mcleanhospital.org/essential/how-deal-stress-caused-working-home (accessed on 7 July 2022).
- Chu, A.M.Y.; Chan, T.W.C.; So, M.K.P. Learning from Work-from-Home Issues during the COVID-19 Pandemic: Balance Speaks Louder than Words. PLoS ONE 2022, 17, e0261969. [Google Scholar] [CrossRef]
- Bentler, P.M. Comparative Fit Indexes in Structural Models. Psychol. Bull. 1990, 107, 238–246. [Google Scholar] [CrossRef]
- Tucker, L.R.; Lewis, C. A Reliability Coefficient for Maximum Likelihood Factor Analysis. Psychometrika 1973, 38, 1–10. [Google Scholar] [CrossRef]
- Steiger, J.H.; Lind, J.C. Statistically Based Tests for the Number of Common Factors. In Proceedings of the Psychometric Society Annual Meeting, Iowa City, IA, USA, 28 May 1998. [Google Scholar]
- Jöreskog, K.G.; Sörbom, D. LISREL 8: User’s Referece Guide; Scientific Software International: Chicago, IL, USA, 1993. [Google Scholar]
- Babyak, M.A.; Green, S.B. Confirmatory Factor Analysis: An Introduction for Psychosomatic Medicine Researchers. Psychosom. Med. 2010, 72, 587–597. [Google Scholar] [CrossRef]
- Marsh, H.W.; Balla, J.R.; McDonald, R.P. Goodness-of-Fit Indexes in Confirmatory Factor Analysis: The Effect of Sample Size. Psychol. Bull. 1988, 103, 391–410. [Google Scholar] [CrossRef]
- Hu, L.; Bentler, P.M. Fit Indices in Covariance Structure Modeling: Sensitivity to Underparameterized Model Misspecification. Psychol. Methods 1998, 3, 424–453. [Google Scholar] [CrossRef]
- Browne, M.W.; Cudeck, R. Alternative Ways of Assessing Model Fit. Sociol. Methods Res. 1992, 21, 230–258. [Google Scholar] [CrossRef]
- Byrne, B.M. Structural Equation Modeling with LISREL, PRELIS, and SIMPLIS: Basic Concepts, Applications, and Programming; Multivariate Applications Book Series; L. Erlbaum Associates: Mahwah, NJ, USA, 1998; ISBN 978-0-8058-2924-2. [Google Scholar]
- Hu, L.; Bentler, P.M. Cutoff Criteria for Fit Indexes in Covariance Structure Analysis: Conventional Criteria versus New Alternatives. Struct. Equ. Modeling A Multidiscip. J. 1999, 6, 1–55. [Google Scholar] [CrossRef]
- Schaufeli, W.B.; Shimazu, A.; Hakanen, J.; Salanova, M.; De Witte, H. An Ultra-Short Measure for Work Engagement: The UWES-3 Validation Across Five Countries. Eur. J. Psychol. Assess. 2019, 35, 577–591. [Google Scholar] [CrossRef]
- Morgeson, F.P.; Humphrey, S.E. The Work Design Questionnaire (WDQ): Developing and Validating a Comprehensive Measure for Assessing Job Design and the Nature of Work. J. Appl. Psychol. 2006, 91, 1321–1339. [Google Scholar] [CrossRef]
- Netemeyer, R.G.; Boles, J.S.; McMurrian, R. Development and Validation of Work–Family Conflict and Family–Work Conflict Scales. J. Appl. Psychol. 1996, 81, 400–410. [Google Scholar] [CrossRef]
- Golden, T.D.; Veiga, J.F.; Dino, R.N. The Impact of Professional Isolation on Teleworker Job Performance and Turnover Intentions: Does Time Spent Teleworking, Interacting Face-to-Face, or Having Access to Communication-Enhancing Technology Matter? J. Appl. Psychol. 2008, 93, 1412–1421. [Google Scholar] [CrossRef]
- Brayfield, A.H.; Rothe, H.F. An Index of Job Satisfaction. J. Appl. Psychol. 1951, 35, 307–311. [Google Scholar] [CrossRef]
- Koenker, R.; Bassett, G. Regression Quantiles. Econometrica 1978, 46, 33. [Google Scholar] [CrossRef]
- Kurland, N.B.; Egan, T.D. Telecommuting: Justice and Control in the Virtual Organization. Organ. Sci. 1999, 10, 500–513. [Google Scholar] [CrossRef]
- Vanderfeesten, I. How to Increase Work Autonomy in Workflow Management Systems? Manag. Res. News 2006, 29, 652–665. [Google Scholar] [CrossRef]
- Aboobaker, N.; Edward, M.; Pramatha, K.P. Work–Family Conflict, Family–Work Conflict and Intention to Leave the Organization: Evidences across Five Industry Sectors in India. Glob. Bus. Rev. 2017, 18, 524–536. [Google Scholar] [CrossRef]


| Response Variable | Code |
|---|---|
| Technical performance | |
| Handling the responsibilities and daily demands of your work | WP1_1_1 |
| Making the right decisions at work | WP1_1_2 |
| Performing work-related duties without mistakes | WP1_1_3 |
| Getting things done on time | WP1_1_4 |
| Achieving work objectives | WP1_1_5 |
| Taking initiatives at job | WP1_1_6 |
| Fulfilling the performance criteria demanded at job | WP1_1_7 |
| Social performance | |
| Getting along with others at work | WP1_1_8 |
| Avoiding arguing with others | WP1_1_9 |
| Handling disagreements by compromising and meeting other people half-way | WP1_1_10 |
| Category | Explanatory Variables | Coef. | Std. Err. | t | P > t | [95% Conf. Interval] | |
|---|---|---|---|---|---|---|---|
| Individual employee profile variables | PhD studies | −0.2555 | 0.0877 | −2.91 | 0.004 | −0.4278 | −0.0832 |
| Organizational environment variables | WFH engagement | 0.1003 | 0.0159 | 6.31 | 0.000 | 0.0691 | 0.1315 |
| Occupational Effectiveness | 0.3380 | 0.0293 | 11.54 | 0.000 | 0.2805 | 0.3955 | |
| C−M communication skills | 0.0400 | 0.0140 | 2.84 | 0.005 | 0.0123 | 0.0676 | |
| Trust in management | −0.0550 | 0.0235 | −2.34 | 0.020 | −0.1012 | −0.0087 | |
| Trust in co−workers | 0.1555 | 0.0303 | 5.12 | 0.000 | 0.0957 | 0.2147 | |
| Work−life balance variables | Familywork conflict | −0.043 | 0.0124 | −3.45 | 0.001 | −0.0674 | −0.0185 |
| Job autonomy | 0.0752 | 0.0214 | 3.50 | 0.000 | 0.0330 | 0.1173 | |
| Intercept | 1.7782 | 0.1552 | 11.45 | 0.000 | 1.4734 | 2.0831 | |
| R2 = 0.4903 F(8,790) = 94.99 p = 0.000 | |||||||
| Category | Explanatory Variables | Coef. | Std. Err. | t | P > t | [95% Conf. Interval] | |
|---|---|---|---|---|---|---|---|
| Individual employee profile variables | Household size (4 persons) | 0.1005 | 0.0510 | 1.97 | 0.049 | 0.0003 | 0.2008 |
| Kids in household (0–6 y.o.) | −0.1586 | 0.0509 | −3.12 | 0.002 | −2.586 | −0.0587 | |
| Share of time spent working from home | 0.0019 | 0.0005 | 3.30 | 0.001 | 0.0007 | 0.0030 | |
| Organizational environment variables | WFH engagement | 0.1381 | 0.0166 | 8.31 | 0.000 | 0.1055 | 0.1707 |
| Occupational Effectiveness | 0.4127 | 0.0302 | 13.63 | 0.000 | 0.3532 | 0.4719 | |
| C-M communication skills | 0.0293 | 0.0144 | 2.03 | 0.043 | 0.0098 | 0.0576 | |
| Introjected regulation | 0.0349 | 0.0160 | 2.18 | 0.030 | 0.0034 | 0.0664 | |
| Integrated motivation | −0.0334 | 0.0166 | −2.01 | 0.045 | −0.0661 | −0.0007 | |
| Amotivation | −0.0322 | 0.0115 | −2.79 | 0.005 | −0.0548 | −0.0095 | |
| Organizational commitment | −0.0382 | 0.0173 | −2.21 | 0.028 | −0.0723 | −0.0042 | |
| Trust in co-workers | 0.0458 | 0.0194 | 2.36 | 0.019 | 0.0076 | 0.0840 | |
| Work−life balance variables | Family—work conflict | −0.0358 | 0.0139 | −2.57 | 0.010 | −0.0631 | −0.0084 |
| Job autonomy | 0.0886 | 0.0217 | 4.08 | 0.000 | 0.04594 | 0.1312 | |
| Stress | −0.0301 | 0.0132 | −2.27 | 0.024 | −0.0561 | −0.0040 | |
| Intercept | 2.0193 | 0.1748 | 11.55 | 0.000 | 1.6760 | 2.3626 | |
| R2 = 0.5787 F(15,783) = 71.71 p = 0.000 | |||||||
| Category | Explanatory Variables | OLS Regression | 0.10 Quantile | 0.25 Quantile | 0.50 Quantile | 0.75 Quantile | 0.90 Quantile |
|---|---|---|---|---|---|---|---|
| Individual employee profile variables | PhD studies | −0.2555 *** | −0.5431 *** | −0.2485 | −0.1784 * | −0.1684 | −0.0585 |
| Organizational environment variables | WFH engagement | 0.1003 *** | 0.1950 ***,+ | 0.1199 *** | 0.0745 *** | 0.0540 ***,+ | 0.0362 ***,+ |
| Occupational Effectiveness | 0.3380 *** | 0.2537 *** | 0.4048 *** | 0.4115 *** | 0.3383 *** | 0.2470 ***,+ | |
| C-M communication skills | 0.0400 *** | 0.0096 | 0.0767 *** | 0.0400 *** | 0.0267 *** | 0.0309 *** | |
| Trust in management | −0.0550 ** | −0.0479 | −0.1057 ***,+ | −0.0576 ** | −0.0181 | −0.0197 | |
| Trust in co-workers | 0.15552 *** | 0.19966 *** | 0.2646 ***,+ | 0.1674 *** | 0.0821 **,+ | 0.03328 | |
| Work-life balance variables | Family—work conflict | −0.043 *** | −0.0822 *** | −0.0385 ** | −0.0307 *** | −0.0298 ** | −0.0276 *** |
| Job autonomy | 0.0752 *** | 0.0768 | 0.0486 * | 0.0667 *** | 0.0378 | 0.0387 ** | |
| Intercept | 1.7782 *** | 1.0982 ***,+ | 0.6629 ***,+ | 1.5201 *** | 2.7714 ***,+ | 3.8044 ***,+ | |
| Model Summary | |||||||
| Pseudo R2 | - | 0.3275 | 0.3403 | 0.3116 | 0.2674 | 0.1524 |
| Category | OLS Regression | 0.10 Quantile | 0.25 Quantile | 0.50 Quantile | 0.75 Quantile | 0.90 Quantile | |
|---|---|---|---|---|---|---|---|
| Individual employee profile variables | Household size-4 persons | 0.1005 ** | 0.2522 *** | 0.1003 * | 0.0687 | 0.0331 | 0.0174 |
| Kids in household (0–6 y.o.) | −0.1586 *** | −0.2455 ** | −0.1399 ** | −0.0766 | −0.0762 **,+ | −0.0701 | |
| Share of time spent working from home | 0.0019 *** | 0.0020 | 0.0006 | 0.0020 *** | 0.0021 *** | 0.0011 ** | |
| Organizational environment variables | WFH engagement | 0.1381 *** | 0.2045 *** | 0.1756 *** | 0.1191 *** | 0.0614 ***,+ | 0.0327 * |
| Occupational Effectiveness | 0.4127 *** | 0.3062 *** | 0.4750 *** | 0.5347 ***,+ | 0.4403 *** | 0.2935 ***,+ | |
| C-M communication skills | 0.0293 ** | 0.0328 | 0.0216 | 0.0191 * | 0.0292 * | 0.0247 *** | |
| Introjected motivation | 0.0349 ** | 0.0650 ** | 0.0408 ** | 0.0265 * | 0.0153 | 0.0112 | |
| Integrated motivation | −0.0334 ** | −0.0386 * | −0.0438 ** | −0.0133 | −0.0134 | 0.0147 | |
| Amotivation | −0.0322 *** | −0.0356 * | −0.0267 | −0.0170 ** | −0.0127 | −0.0182 ** | |
| Organizational commitment | −0.0382 ** | −0.0715 ** | −0.0397 * | −0.0142 | −0.0234 | −0.0261 | |
| Trust in co-workers | 0.0458 ** | 0.1134 *** | 0.0531 | 0.0206 | 0.0380 *** | 0.0052 | |
| Work-life balance variables | Family—work conflict | −0.0358 ** | −0.0713 *** | −0.0483 *** | −0.0279 ** | −0.0209 * | −0.0121 |
| Job autonomy | 0.0886 *** | 0.1389 ** | 0.1189 *** | 0.0475 | 0.0242 | 0.0302 | |
| Stress | −0.0301 ** | −0.0758 ** | −0.0293 | −0.0123 | −0.021 * | −0.0184 | |
| Intercept | 2.0193 *** | 1.2905 ** | 1.1662 ***,+ | 1.5524 *** | 2.7687 ***,+ | 4.1130 ***,+ | |
| Model Summary | |||||||
| Pseudo R2 | − | 0.4551 | 0.4218 | 0.3864 | 0.2951 | 0.1610 |
Publisher’s Note: MDPI stays neutral with regard to jurisdictional claims in published maps and institutional affiliations. |
© 2022 by the authors. Licensee MDPI, Basel, Switzerland. This article is an open access article distributed under the terms and conditions of the Creative Commons Attribution (CC BY) license (https://creativecommons.org/licenses/by/4.0/).
Share and Cite
Kifor, C.V.; Săvescu, R.F.; Dănuț, R. Work from Home during the COVID-19 Pandemic—The Impact on Employees’ Self-Assessed Job Performance. Int. J. Environ. Res. Public Health 2022, 19, 10935. https://doi.org/10.3390/ijerph191710935
Kifor CV, Săvescu RF, Dănuț R. Work from Home during the COVID-19 Pandemic—The Impact on Employees’ Self-Assessed Job Performance. International Journal of Environmental Research and Public Health. 2022; 19(17):10935. https://doi.org/10.3390/ijerph191710935
Chicago/Turabian StyleKifor, Claudiu Vasile, Roxana Florența Săvescu, and Raluca Dănuț. 2022. "Work from Home during the COVID-19 Pandemic—The Impact on Employees’ Self-Assessed Job Performance" International Journal of Environmental Research and Public Health 19, no. 17: 10935. https://doi.org/10.3390/ijerph191710935
APA StyleKifor, C. V., Săvescu, R. F., & Dănuț, R. (2022). Work from Home during the COVID-19 Pandemic—The Impact on Employees’ Self-Assessed Job Performance. International Journal of Environmental Research and Public Health, 19(17), 10935. https://doi.org/10.3390/ijerph191710935