
Interactions between Self-Perceived Weight Status and Lifestyle Behaviors and Their Associations with Childhood Obesity: Results from the Childhood Obesity Study in China Mega-Cities


 , ,
, , 
Abstract: Background
1. Introduction
2. Materials and Methods
2.1. Study Design and Study Participants
2.2. Assessment and Measures
2.3. Statistical Analysis
3. Results
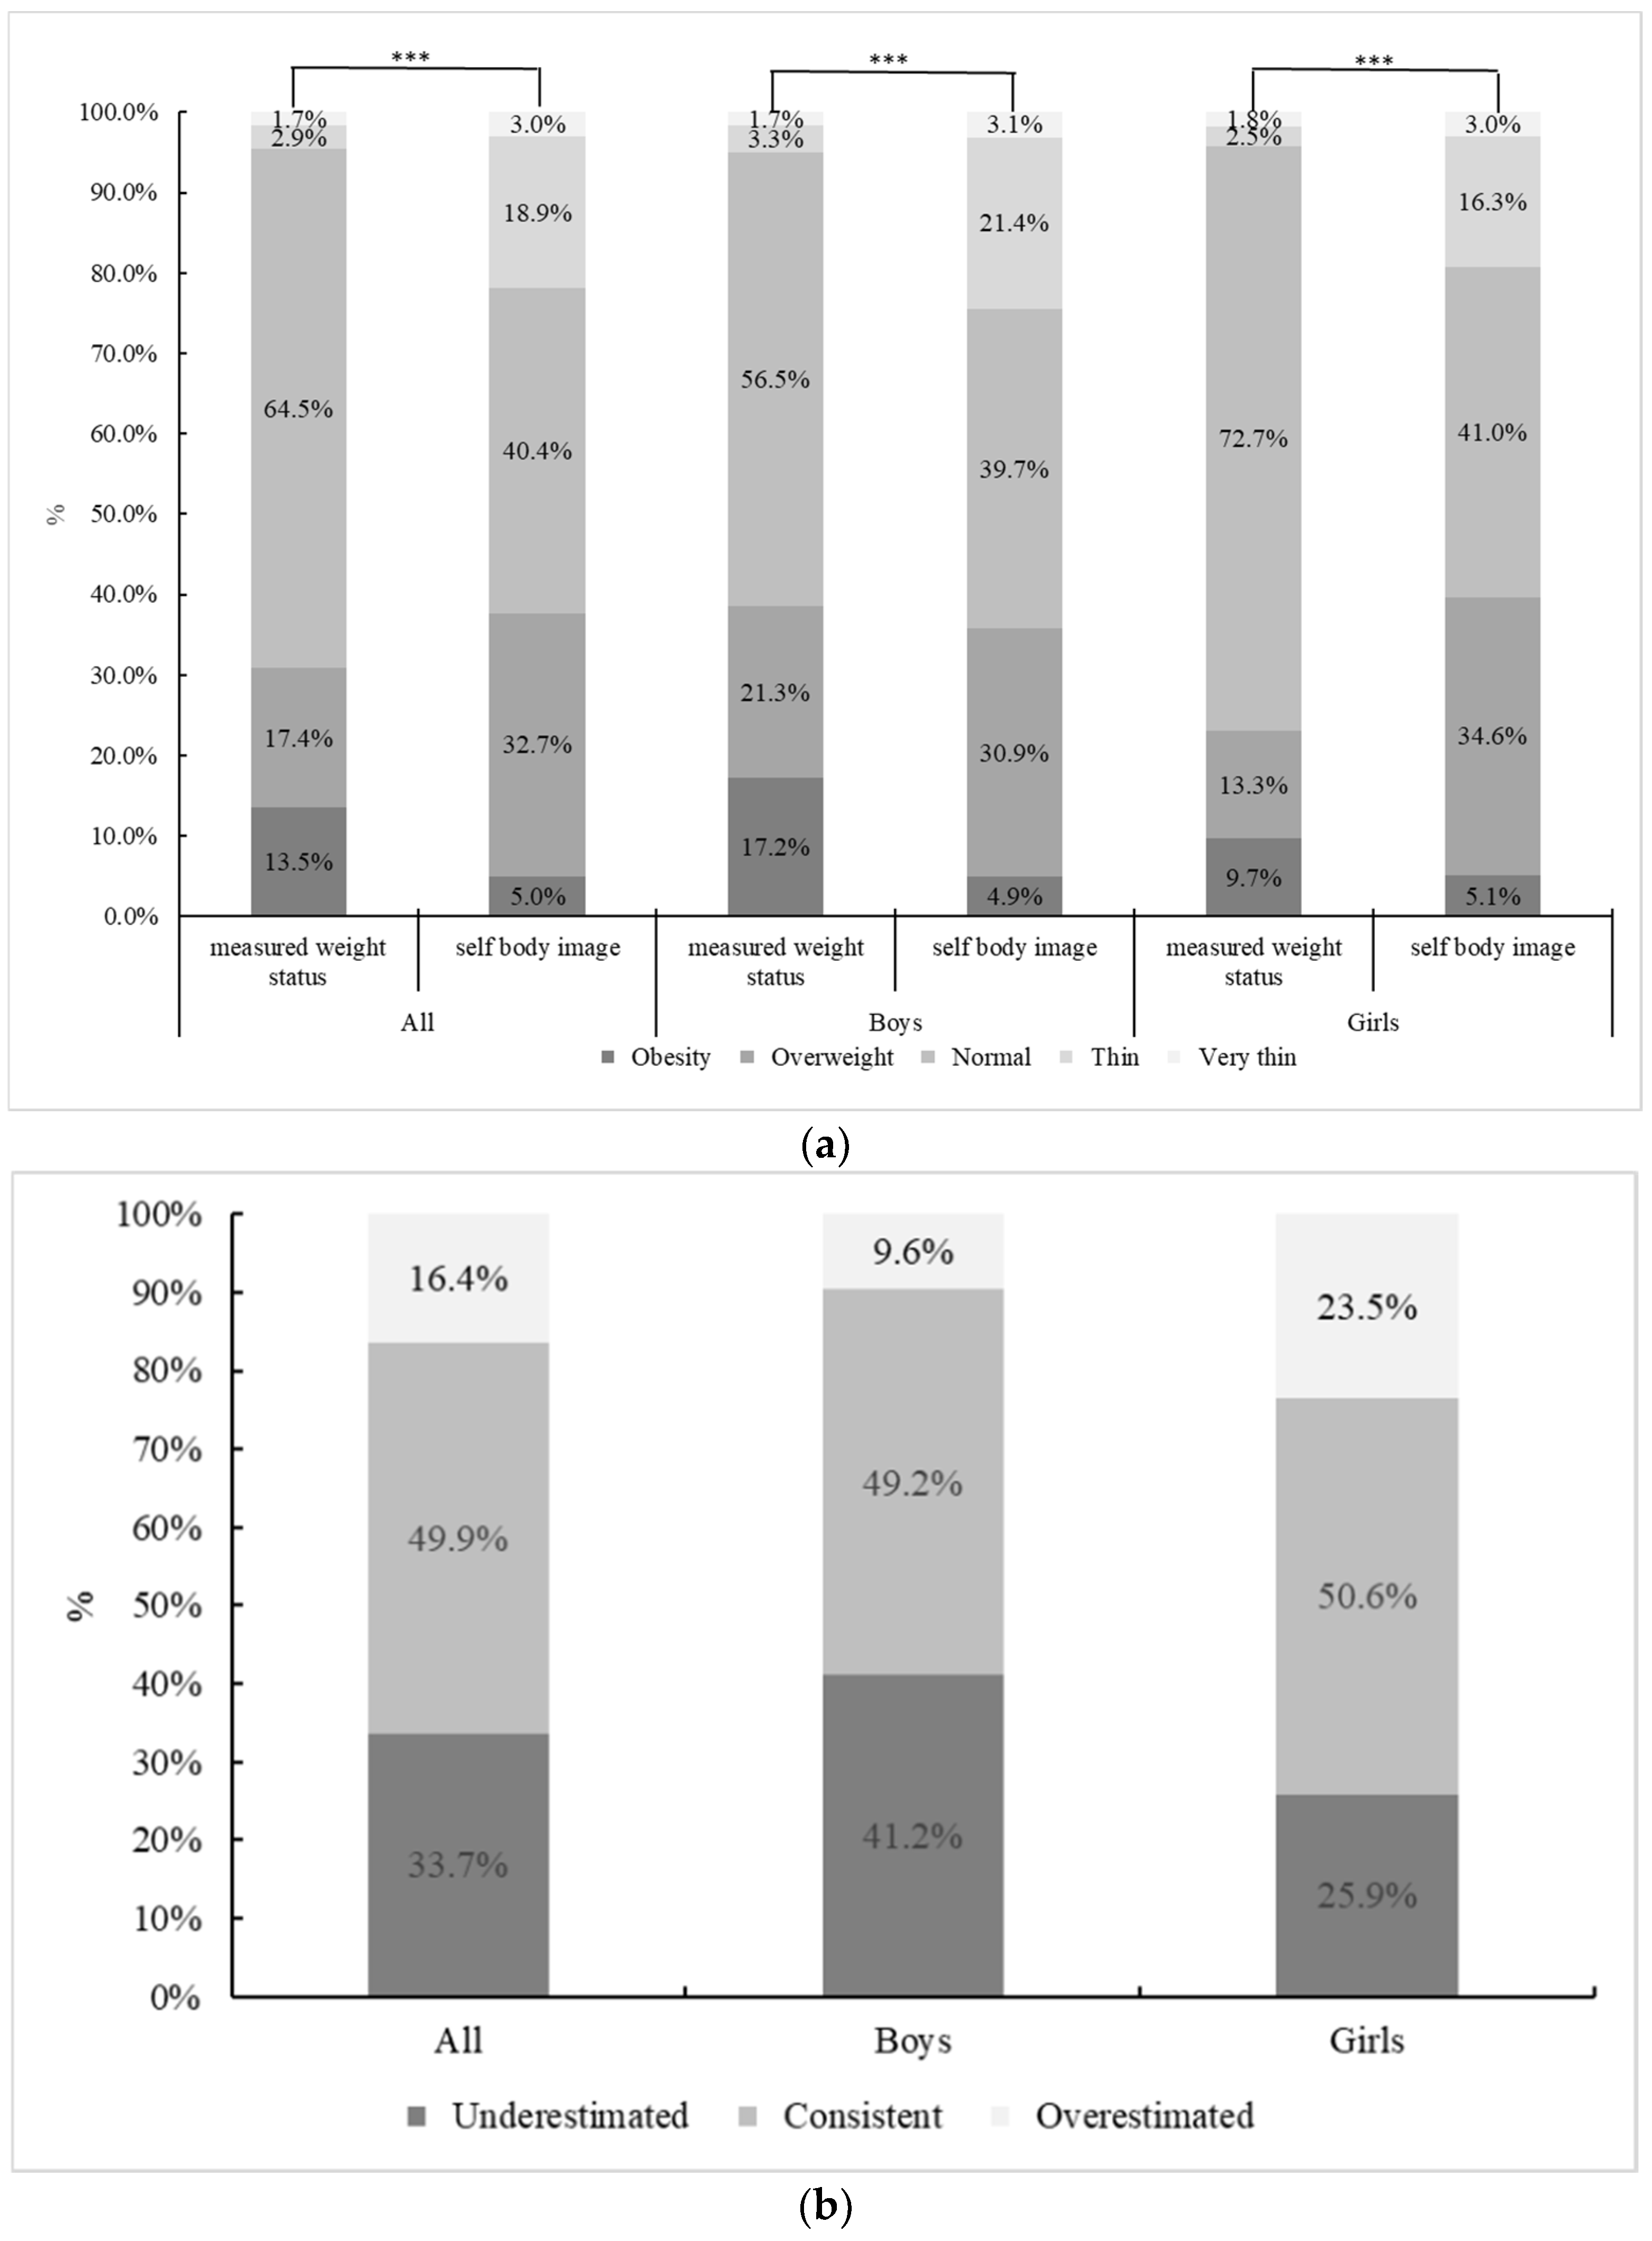
3.1. Study Participants’ Characteristics and Body Image
3.2. Factor Analysis: Eating and Physical Activity Behaviors
3.3. Association between Obesity and Interaction of Self-Perceived Weight Status and Lifestyle Behavior Factors
4. Discussion
5. Conclusions
Author Contributions
Funding
Institutional Review Board Statement
Informed Consent Statement
Data Availability Statement
Conflicts of Interest
Appendix A

| Age (Year) | Boys | Girls | ||
|---|---|---|---|---|
| Overweight | Obesity | Overweight | Obesity | |
| 6.0~ | 16.4 | 17.7 | 16.2 | 17.5 |
| 6.5~ | 16.7 | 18.1 | 16.5 | 18.0 |
| 7.0~ | 17.0 | 18.7 | 16.8 | 18.5 |
| 7.5~ | 17.4 | 19.2 | 17.2 | 19.0 |
| 8.0~ | 17.8 | 19.7 | 17.6 | 19.4 |
| 8.5~ | 18.1 | 20.3 | 18.1 | 19.9 |
| 9.0~ | 18.5 | 20.8 | 18.5 | 20.4 |
| 9.5~ | 18.9 | 21.4 | 19.0 | 21.0 |
| 10.0~ | 19.2 | 21.9 | 19.5 | 21.5 |
| 10.5~ | 19.6 | 22.5 | 20.0 | 22.1 |
| 11.0~ | 19.9 | 23.0 | 20.5 | 22.7 |
| 11.5~ | 20.3 | 23.6 | 21.1 | 23.3 |
| 12.0~ | 20.7 | 24.1 | 21.5 | 23.9 |
| 12.5~ | 21.0 | 24.7 | 21.9 | 24.5 |
| 13.0~ | 21.4 | 25.2 | 22.2 | 25.0 |
| 13.5~ | 21.9 | 25.7 | 22.6 | 25.6 |
| 14.0~ | 22.3 | 26.1 | 22.8 | 25.9 |
| 14.5~ | 22.6 | 26.4 | 23.0 | 26.3 |
| 15.0~ | 22.9 | 26.6 | 23.2 | 26.6 |
| 15.5~ | 23.1 | 26.9 | 23.4 | 26.9 |
| 16.0~ | 23.3 | 27.1 | 23.6 | 27.1 |
| 16.5~ | 23.5 | 27.4 | 23.7 | 27.4 |
| 17.0~ | 23.7 | 27.6 | 23.8 | 27.6 |
| 17.5~ | 23.8 | 27.8 | 23.9 | 27.8 |
| 18.0~ | 24.0 | 28.0 | 24.0 | 28.0 |
| A: The Interactions between Self-Perceived Weight Status and Factor 1 | |||
|---|---|---|---|
| Factor 1 | Self-Perceived Weight Status | Factor 1& Self-Perceived Weight Status | |
| Regr.(regression) Coefficients | 0.43594 | 3.22908 | 3.55456 |
| Cov Factor 1 | 0.0435 | 0.02584 | 0.02591 |
| Cov Self-perceived weight status | 0.02584 | 0.04537 | 0.031 |
| Cov Factor 1 & self-perceived weight status | 0.02591 | 0.031 | 0.0481 |
| Exposure | RR | Lower | Upper |
| Factor 1 | 1.546 | 1.028 | 2.327 |
| Self-perceived weight status | 25.256 | 16.636 | 38.343 |
| Factor 1 & self-perceived weight status | 34.972 | 22.753 | 53.754 |
| Measure | Estimate | Lower | Upper |
| RERI | 9.17 | −1.975 | 20.314 |
| AP | 0.262 | 0.008 | 0.517 |
| S | 1.37 | 0.959 | 1.957 |
| B: the interactions between self-perceived weight status and factor 1 in girls | |||
| Factor 1 | Self-perceived weight status | Factor 1 & self-perceived weight status | |
| Regr.(regression) Coefficients | −0.11338 | 2.43583 | 3.08345 |
| Cov Factor 1 | 0.12427 | 0.06297 | 0.06294 |
| Cov Self-perceived weight status | 0.06297 | 0.09515 | 0.07071 |
| Cov Factor 1 & self-perceived weight status | 0.06294 | 0.07071 | 0.09761 |
| Exposure | RR | Lower | Upper |
| Factor 1 | 0.893 | 0.447 | 1.782 |
| Self-perceived weight status | 11.425 | 6.242 | 20.914 |
| Factor 1 & self-perceived weight status | 21.834 | 11.835 | 40.278 |
| Measure | Estimate | Lower | Upper |
| RERI | 10.516 | 1.197 | 19.834 |
| AP | 0.482 | 0.248 | 0.715 |
| S | 2.019 | 1.243 | 3.281 |
| C: the interactions between self-perceived weight status and factor 2 in boys | |||
| Factor 2 | Self-perceived weight status | Factor 2 & self-perceived weight status | |
| Regr.(regression) Coefficients | −0.12473 | 3.0694 | 3.57187 |
| Cov Factor 2 | 0.06305 | 0.03385 | 0.03442 |
| Cov Self-perceived weight status | 0.03385 | 0.07989 | 0.037 |
| Cov Factor 2 & self-perceived weight status | 0.03442 | 0.037 | 0.08549 |
| Exposure | RR | Lower | Upper |
| Factor 2 | 0.883 | 0.54 | 1.444 |
| Self-perceived weight status | 21.529 | 12.372 | 37.464 |
| Factor 2 & self-perceived weight status | 35.583 | 20.062 | 63.113 |
| Measure | Estimate | Lower | Upper |
| RERI | 14.171 | -4.189 | 32.531 |
| AP | 0.398 | 0.041 | 0.756 |
| S | 1.694 | 0.914 | 3.141 |
| D: the interactions between self-perceived weight status and factor 3 in girls | |||
| Factor 3 | Self-perceived weight status | Factor 4 & self-perceived weight status | |
| Regr.(regression) Coefficients | 0.22064 | 2.69594 | 3.13756 |
| Cov Factor 3 | 0.13052 | 0.05985 | 0.06333 |
| Cov Self-perceived weight status | 0.05985 | 0.09131 | 0.06727 |
| Cov Factor 3 & self-perceived weight status | 0.06333 | 0.06727 | 0.09778 |
| Exposure | RR | Lower | Upper |
| Factor 3 | 1.247 | 0.614 | 2.531 |
| Self-perceived weight status | 14.819 | 8.196 | 26.795 |
| Factor 3 & self-perceived weight status | 23.048 | 12.487 | 42.541 |
| Measure | Estimate | Lower | Upper |
| RERI | 7.981 | −1.783 | 17.745 |
| AP | 0.346 | 0.049 | 0.644 |
| S | 1.567 | 0.968 | 2.538 |
References
- Pan, X.; Wang, L.; Pan, A. Epidemiology and determinants of obesity in China. Lancet Diabetes Endocrinol. 2021, 9, 373–392. [Google Scholar] [CrossRef]
- National Health Commission. Report on Nutrition and Chronic Disease Status of Chinese Residents; National Health Commission: Beijing, China, 2021. [Google Scholar]
- Twig, G.; Yaniv, G.; Levine, H.; Leiba, A.; Goldberger, N.; Derazne, E.; Ben-Ami Shor, D.; Tzur, D.; Afek, A.; Shamiss, A.; et al. Body-Mass Index in 2.3 million Adolescents and Cardiovascular Death in Adulthood. N. Engl. J. Med. 2016, 374, 2430–2440. [Google Scholar] [CrossRef] [PubMed]
- Chen, F.; Wang, Y.; Shan, X.; Cheng, H.; Hou, D.; Zhao, X.; Wang, T.; Zhao, D. Association between childhood obesity and metabolic syndrome: Evidence from a large sample of Chinese children and adolescents. PLoS ONE 2012, 7, e47380. [Google Scholar] [CrossRef] [PubMed]
- Xi, B.; Liang, Y.; Mi, J. Hypertension trends in Chinese children in the national surveys, 1993 to 2009. Int. J. Cardiol. 2013, 165, 577–579. [Google Scholar] [CrossRef] [PubMed]
- Lobstein, T.; Jackson-Leach, R.; Moodie, M.L.; Hall, K.D.; Gortmaker, S.L.; Swinburn, B.A.; James, P.T.; Wang, Y.; McPherson, K. Child and adolescent obesity: Part of a bigger picture. Lancet 2015, 385, 2510–2520. [Google Scholar] [CrossRef]
- Wang, Y.; Sun, M.; Yang, Y. China Blue Book on Obesity Prevention and Control; Peking University Medical Press: Beijing, China, 2018. [Google Scholar]
- Chatterjee, A.; Gerdes, M.; Martinez, S. Identification of Risk Factors Associated with Obesity and Overweight-A Machine Learning Overview. Sensors 2020, 20, 2734. [Google Scholar] [CrossRef]
- Kwansa, A.; Akparibo, R.; Cecil, J.; Infield Solar, G.; Caton, S.J. Risk Factors for Overweight and Obesity within the Home Environment of Preschool Children in Sub-Saharan Africa: A Systematic Review. Nutrients 2022, 14, 1706. [Google Scholar] [CrossRef]
- Jia, P.; Xue, H.; Zhang, J.; Wang, Y. Time Trend and Demographic and Geographic Disparities in Childhood Obesity Prevalence in China-Evidence from Twenty Years of Longitudinal Data. Int. J. Environ. Res. Public Health 2017, 14, 369. [Google Scholar] [CrossRef]
- Zhao, Y.; Wang, L.; Xue, H.; Wang, H.; Wang, Y. Fast food consumption and its associations with obesity and hypertension among children: Results from the baseline data of the Childhood Obesity Study in China Mega-cities. BMC Public Health 2017, 17, 933. [Google Scholar] [CrossRef]
- Kerkadi, A.; Sadig, A.H.; Bawadi, H.; Al Thani, A.A.M.; Al Chetachi, W.; Akram, H.; Al Hazzaa, H.M.; Musaiger, A.O. The Relationship between Lifestyle Factors and Obesity Indices among Adolescents in Qatar. Int. J. Environ. Res. Public Health 2019, 16, 4428. [Google Scholar] [CrossRef]
- Lynch, E.; Liu, K.; Wei, G.S.; Spring, B.; Kiefe, C.; Greenland, P. The Relation Between Body Size Perception and Change in Body Mass Index Over 13 Years: The Coronary Artery Risk Development in Young Adults (CARDIA) Study. Am. J. Epidemiol. 2009, 169, 857–866. [Google Scholar] [CrossRef] [PubMed]
- Min, J.; Fang Yan, A.; Wang, Y. Mismatch in Children’s Weight Assessment, Ideal Body Image, and Rapidly Increased Obesity Prevalence in China: A 10-Year, Nationwide, Longitudinal Study. Obesity 2018, 26, 1777–1784. [Google Scholar] [CrossRef] [PubMed]
- Wang, Y.; Liang, H.; Chen, X. Measured body mass index, body weight perception, dissatisfaction and control practices in urban, low-income African American adolescents. BMC Public Health 2009, 9, 183. [Google Scholar] [CrossRef] [PubMed]
- Chigbu, C.O.; Aniebue, U.U.; Berger, U.; Parhofer, K.G. Impact of perceptions of body size on obesity and weight management behaviour: A large representative population study in an African setting. J. Public Health 2021, 43, e54–e61. [Google Scholar] [CrossRef]
- Silva, S.; Alves, M.A.; Vasconcelos, F.; Gonçalves, V.S.S.; Barufaldi, L.A.; Carvalho, K.M.B.D. Association between body weight misperception and dietary patterns in Brazilian adolescents: Cross-sectional study using ERICA data. PLoS ONE 2021, 16, e0257603. [Google Scholar] [CrossRef]
- Gao, L.; Ma, L.; Xue, H.; Min, J.; Wang, H.; Wang, Y. A 3-year longitudinal study of effects of parental perception of children’s ideal body image on child weight change: The Childhood Obesity Study in China mega-cities. Prev. Med. 2020, 132, 105971. [Google Scholar] [CrossRef]
- Screening for Overweight and Obesity among School-Age Children and Adolescents. Available online: http://www.nhc.gov.cn/wjw/pqt/201803/a7962d1ac01647b9837110bfd2d69b26.shtml (accessed on 23 April 2022).
- Xu, F.; Wang, X.; Ware, R.S.; Tse, L.A.; Wang, Z.; Hong, X.; Yang Chang, E.M.; Li, J.; Wang, Y. A school-based comprehensive lifestyle intervention among Chinese kids against Obesity (CLICK-Obesity) in Nanjing City, China: The baseline data. Asia Pac. J. Clin. Nutr. 2014, 23, 48–54. [Google Scholar]
- Andersson, T.; Alfredsson, L.; Källberg, H.; Zdravkovic, S.; Ahlbom, A. Calculating measures of biological interaction. Eur. J. Epidemiol. 2005, 20, 575–579. [Google Scholar] [CrossRef]
- Wang, Y.; Liu, H.; Wu, F.; Yang, X.; Yue, M.; Pang, Y.; Li, X.; Ma, J.; Zhou, G.; Gong, P.; et al. The association between BMI and body weight perception among children and adolescents in Jilin City, China. PLoS ONE 2018, 13, e0194237. [Google Scholar] [CrossRef]
- Kilpatrick, M.; Ohannessian, C.; Bartholomew, J.B. Adolescent weight management and perceptions: An analysis of the National Longitudinal Study of Adolescent Health. J. Sch. Health 1999, 69, 148–152. [Google Scholar] [CrossRef]
- Hazzard, V.M.; Hahn, S.L.; Sonneville, K.R. Weight misperception and disordered weight control behaviors among U.S. high school students with overweight and obesity: Associations and trends, 1999–2013. Eat. Behav. 2017, 26, 189–195. [Google Scholar] [CrossRef] [PubMed]
- Xie, B.; Chou, C.; Spruijt-Metz, D.; Reynolds, K.; Clark, F.; Palmer, P.H.; Gallaher, P.; Sun, P.; Guo, Q.; Johnson, A. Weight perception and weight-related sociocultural and behavioral factors in Chinese adolescents. Prev. Med. 2006, 42, 229–234. [Google Scholar] [CrossRef] [PubMed]
- Nye, S. The Muscular Ideal: Psychological, Social and Medical Perspectives. Eat. Disord. 2008, 17, 95–96. [Google Scholar] [CrossRef]
- Felts, W.M.; Parrillo, A.V.; Chenier, T.; Dunn, T. Adolescents’ perceptions of relative weight and self-reported weight-loss activities: Analysis of 1990 YRBS (Youth Risk behavior Survey) national data. J. Adolesc. Health 1996, 18, 20–26. [Google Scholar] [CrossRef]
- Wellman, J.D.; Araiza, A.M.; Solano, C.; Berru, E. Sex differences in the relationships among weight stigma, depression, and binge eating. Appetite 2019, 133, 166–173. [Google Scholar] [CrossRef]
- Stice, E.; Cameron, R.P.; Killen, J.D.; Hayward, C.; Taylor, C.B. Naturalistic weight-reduction efforts prospectively predict growth in relative weight and onset of obesity among female adolescents. J. Consult. Clin. Psychol. 1999, 67, 967–974. [Google Scholar] [CrossRef]
- Ahnen, R.T.; Jonnalagadda, S.S.; Slavin, J.L. Role of plant protein in nutrition, wellness, and health. Nutr. Rev. 2019, 77, 735–747. [Google Scholar] [CrossRef]
- McCarty, M.F. Vegan proteins may reduce risk of cancer, obesity, and cardiovascular disease by promoting increased glucagon activity. Med. Hypotheses 1999, 53, 459–485. [Google Scholar] [CrossRef]
- McCarty, M.F. The origins of western obesity: A role for animal protein? Med. Hypotheses 2000, 54, 488–494. [Google Scholar] [CrossRef]
- Neumark-Sztainer, D. Preventing the broad spectrum of weight-related problems: Working with parents to help teens achieve a healthy weight and a positive body image. J. Nutr. Educ. Behav. 2005, 37, 133–140. [Google Scholar] [CrossRef]
| All (n = 3258) | Boys (n = 1651) | Girls (n = 1607) | p | |
|---|---|---|---|---|
| Age (years) | 12.2 ± 2.0 | 12.2 ± 1.9 | 11.2 ± 2.0 | 0.964 |
| Body mass index (BMI) (kg/m2) | 19.6 ± 3.8 | 20.1 ± 3.9 | 19.2 ± 3.6 | <0.001 |
| Diet (<3 d/week, %) | ||||
| Livestock meat | 41.3 | 38.1 | 44.6 | 0.018 |
| Poultry | 66.9 | 62.8 | 71.1 | 0.001 |
| Pure milk | 28.8 | 25.8 | 31.9 | 0.005 |
| Dairy products | 51.8 | 53.4 | 50.2 | 0.012 |
| Soybeans and soy products | 71.5 | 69.1 | 74.0 | 0.053 |
| Exercise & sedentary behaviors (<3 times/week, %) | ||||
| Watching TV/video/movies | 80.0 | 78.3 | 81.8 | <0.001 |
| Go online/use a computer | 76.5 | 75.1 | 77.9 | 0.676 |
| Extracurricular physical activity | 52.7 | 48.5 | 56.9 | 0.077 |
| Demographics & family socioeconomic status | ||||
| Father’s BMI (kg/m2) | 24.4 ± 3.7 | 24.4 ± 3.7 | 24.3 ± 3.7 | 0.159 |
| Mather’s BMI (kg/m2) | 22.3 ± 3.7 | 22.2 ± 3.7 | 22.4 ± 3.7 | 0.117 |
| Parental highest education level (%) | 0.184 | |||
| Middle school or below | 16.0 | 17.2 | 14.8 | |
| High or vocational schools | 28.2 | 28.9 | 27.6 | |
| College or above | 55.7 | 53.8 | 57.6 | |
| Family homeownership (%) | 0.791 | |||
| Rent or share residency with relatives | 26.8 | 27.2 | 26.3 | |
| Own apartment | 58.9 | 57.9 | 59.8 | |
| Own house | 12.6 | 12.7 | 11.8 |
| Variables | Factor 1 | Factor 2 | Factor 3 | Factor 4 |
|---|---|---|---|---|
| 1. Livestock meat | ··· | 0.781 | ··· | ··· |
| 2. Poultry meat | ··· | 0.911 | ··· | ··· |
| 3. Pure milk | 0.680 | ··· | ··· | ··· |
| 4. Dairy products | 0.730 | ··· | ··· | ··· |
| 5. Soybeans and soy products | 0.816 | ··· | ··· | ··· |
| 6. Watching TV/video/movies | ··· | ··· | 0.780 | ··· |
| 7. Go online/use a computer | ··· | ··· | 0.846 | ··· |
| 8. extracurricular physical activity | ··· | ··· | ··· | 0.992 |
| Characteristic root | 1.780 | 1.600 | 1.380 | 1.016 |
| Variance contribution rate (%) | 22.24 | 20.00 | 17.25 | 12.69 |
| Variance cumulative contribution rate (%) | 22.24 | 42.24 | 59.50 | 72.19 |
| Self-Perceived Weight Status | Life Behavior Factors | All | Boys | Girls | |||
|---|---|---|---|---|---|---|---|
| Coef. (95%CI) | AP (%) | Coef. (95%CI) | AP (%) | Coef. (95%CI) | AP (%) | ||
| Factor 1 | |||||||
| − | − | Reference | Reference | Reference | |||
| − | + | 0.44 (0.03, 0.84) * | 0.69 (0.19, 1.20) ** | −0.11 (−0.80, 0.58) | |||
| + | − | 3.23 (2.81, 3.65) *** | 3.89 (3.30, 4.49) *** | 2.44 (1.83, 3.04) *** | |||
| + | + | 3.55 (3.12, 3.98) *** | 26.2 * | 3.67 (3.09, 4.25) *** | −26.9 | 3.08 (2.47, 3.70) *** | 48.2 * |
| Factor 2 | |||||||
| − | − | Reference | Reference | Reference | |||
| − | + | −0.14 (−0.55, 0.26) | −0.12 (−0.62, 0.37) | −0.12 (−0.83, 0.58) | |||
| + | − | 2.95 (2.56, 3.35) *** | 3.07 (2.52, 3.62) *** | 2.72 (2.15, 3.29) *** | |||
| + | + | 3.19 (2.79, 3.60) *** | 21.8 | 3.57 (3.00, 4.15) *** | 39.8 * | 2.80 (2.20, 3.40) *** | 7.6 |
| Factor 3 | |||||||
| − | − | Reference | Reference | Reference | |||
| − | + | 0.07 (−0.34, 0.48) | 0.00 (−0.50, 0.50) | 0.22 (−0.49, 0.93) | |||
| + | − | 3.07 (2.68, 3.46) *** | 3.44 (2.90, 3.99) *** | 2.70 (2.10, 3.29) *** | |||
| + | + | 3.29 (2.88, 3.69) *** | 19.1 | 3.34 (2.80, 3.89) *** | −10.8 | 3.13 (2.52, 3.75) *** | 34.6 * |
| Factor 4 | |||||||
| − | − | Reference | Reference | Reference | |||
| − | + | 0.36 (−0.06, 0.77) | 0.11 (−0.38, 0.61) | 0.92 (0.16, 1.68) * | |||
| + | − | 3.25 (2.82, 3.68) *** | 3.36 (2.80, 3.93) *** | 3.26 (2.53, 3.98) *** | |||
| + | + | 3.43 (3.01, 3.87) *** | 15.7 | 3.56 (2.98, 4.14) *** | 17.6 | 3.43 (2.71, 4.15) *** | 11.4 |
Publisher’s Note: MDPI stays neutral with regard to jurisdictional claims in published maps and institutional affiliations. |
© 2022 by the authors. Licensee MDPI, Basel, Switzerland. This article is an open access article distributed under the terms and conditions of the Creative Commons Attribution (CC BY) license (https://creativecommons.org/licenses/by/4.0/).
Share and Cite
Gao, L.; Zhu, J.; Wang, L.; Wen, L.M.; Chen, Z.; Zhao, B.; Wang, W.; Wang, Y. Interactions between Self-Perceived Weight Status and Lifestyle Behaviors and Their Associations with Childhood Obesity: Results from the Childhood Obesity Study in China Mega-Cities. Int. J. Environ. Res. Public Health 2022, 19, 9921. https://doi.org/10.3390/ijerph19169921
Gao L, Zhu J, Wang L, Wen LM, Chen Z, Zhao B, Wang W, Wang Y. Interactions between Self-Perceived Weight Status and Lifestyle Behaviors and Their Associations with Childhood Obesity: Results from the Childhood Obesity Study in China Mega-Cities. International Journal of Environmental Research and Public Health. 2022; 19(16):9921. https://doi.org/10.3390/ijerph19169921
Chicago/Turabian StyleGao, Liwang, Jiang Zhu, Liang Wang, Li Ming Wen, Zhuo Chen, Bingtong Zhao, Weidong Wang, and Youfa Wang. 2022. "Interactions between Self-Perceived Weight Status and Lifestyle Behaviors and Their Associations with Childhood Obesity: Results from the Childhood Obesity Study in China Mega-Cities" International Journal of Environmental Research and Public Health 19, no. 16: 9921. https://doi.org/10.3390/ijerph19169921
APA StyleGao, L., Zhu, J., Wang, L., Wen, L. M., Chen, Z., Zhao, B., Wang, W., & Wang, Y. (2022). Interactions between Self-Perceived Weight Status and Lifestyle Behaviors and Their Associations with Childhood Obesity: Results from the Childhood Obesity Study in China Mega-Cities. International Journal of Environmental Research and Public Health, 19(16), 9921. https://doi.org/10.3390/ijerph19169921