
Quantitative Evaluation of China’s Ecological Protection Compensation Policy Based on PMC Index Model

Abstract
:1. Introduction
2. Literature Review
2.1. Research on Ecological Protection Compensation
2.2. Research on Policy Evaluation
3. Research Design
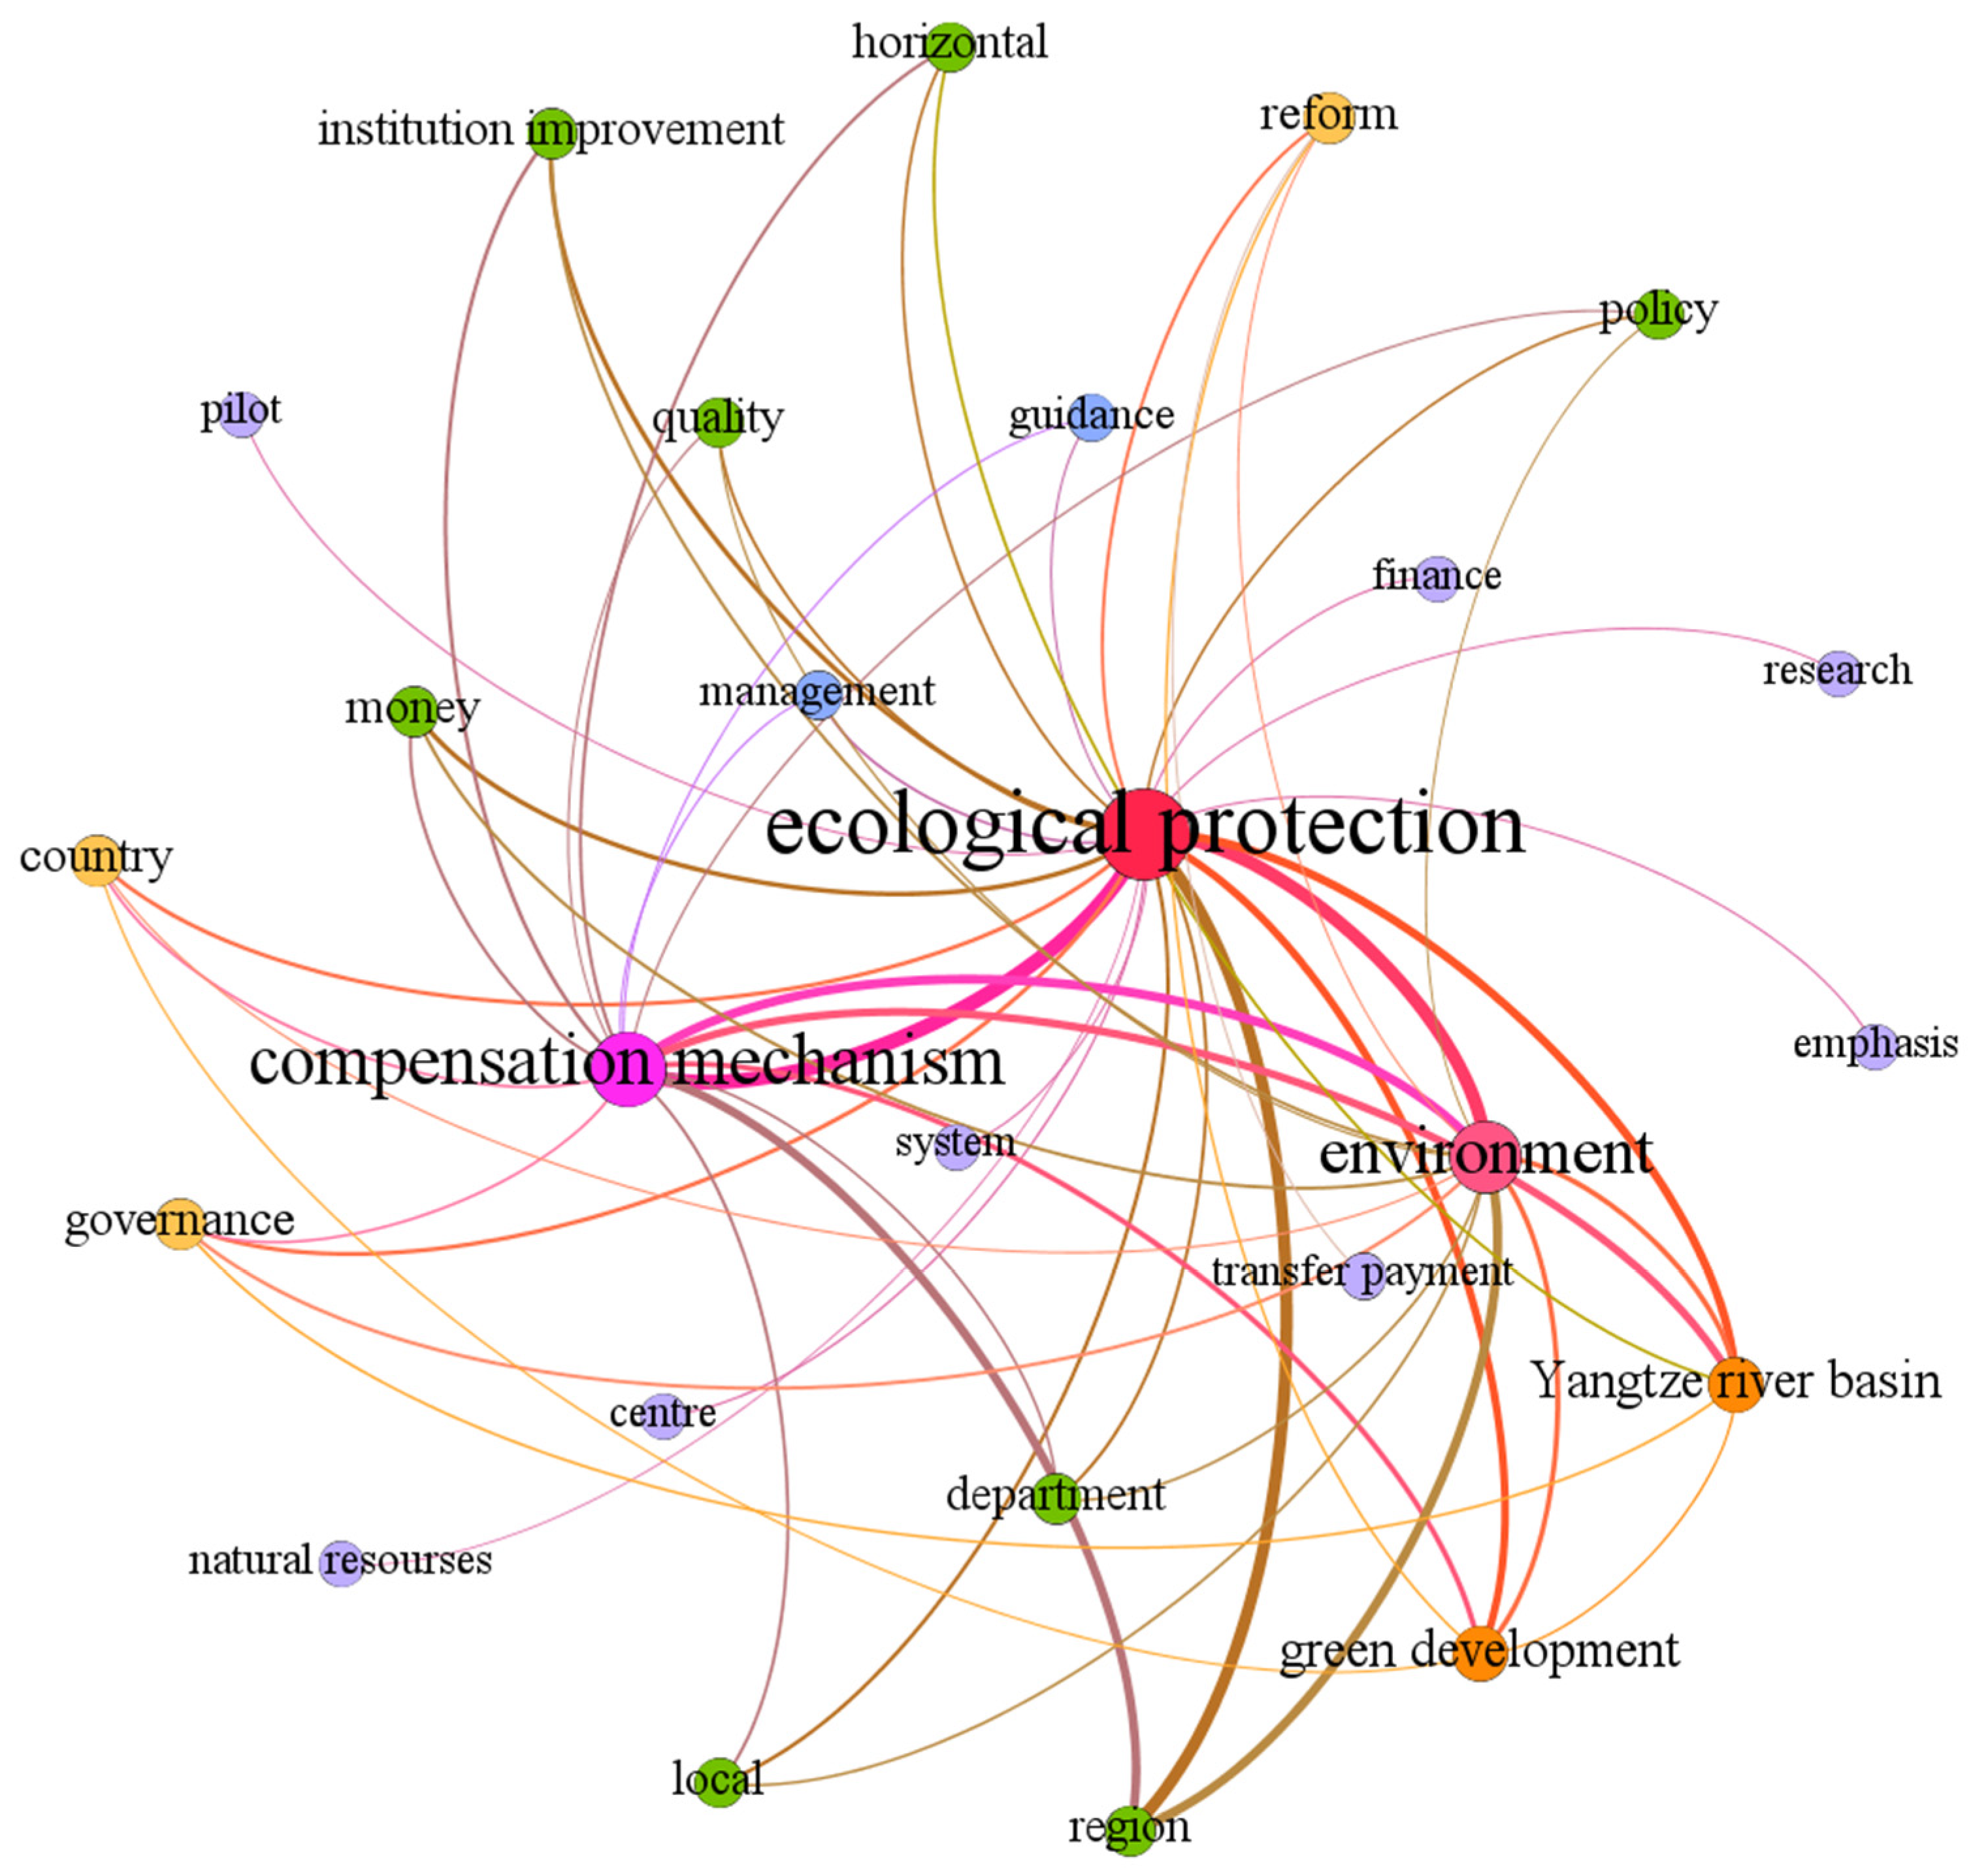
3.1. Data Sources
3.2. Identification of Basic Policy Features
3.3. Construction of PMC Index Model
3.3.1. Variable Classification and Parameter Identification
3.3.2. Building a Multi-Input–Output Table
3.3.3. PMC Index Calculation
- (1)
- Construct variables according to the text of ecological protection compensation policy, including first-level and second-level variables.
- (2)
- Create a multi-input–output table and base them on text mining and binary methods to assign specific values to secondary variables. Each parameter was coded to the binary values “0” or “1”.
- (3)
- Calculate the value of the first-level variable by Formula (3) in conjunction with the assignment of the second-level variable in the previous step. In the Formula (3), t is the ordinal number of first-level index, j is the ordinal number of second-level variable, n is the number of the second-level indexes.
- (4)
- Sum up values of all variables by using Formula (4).
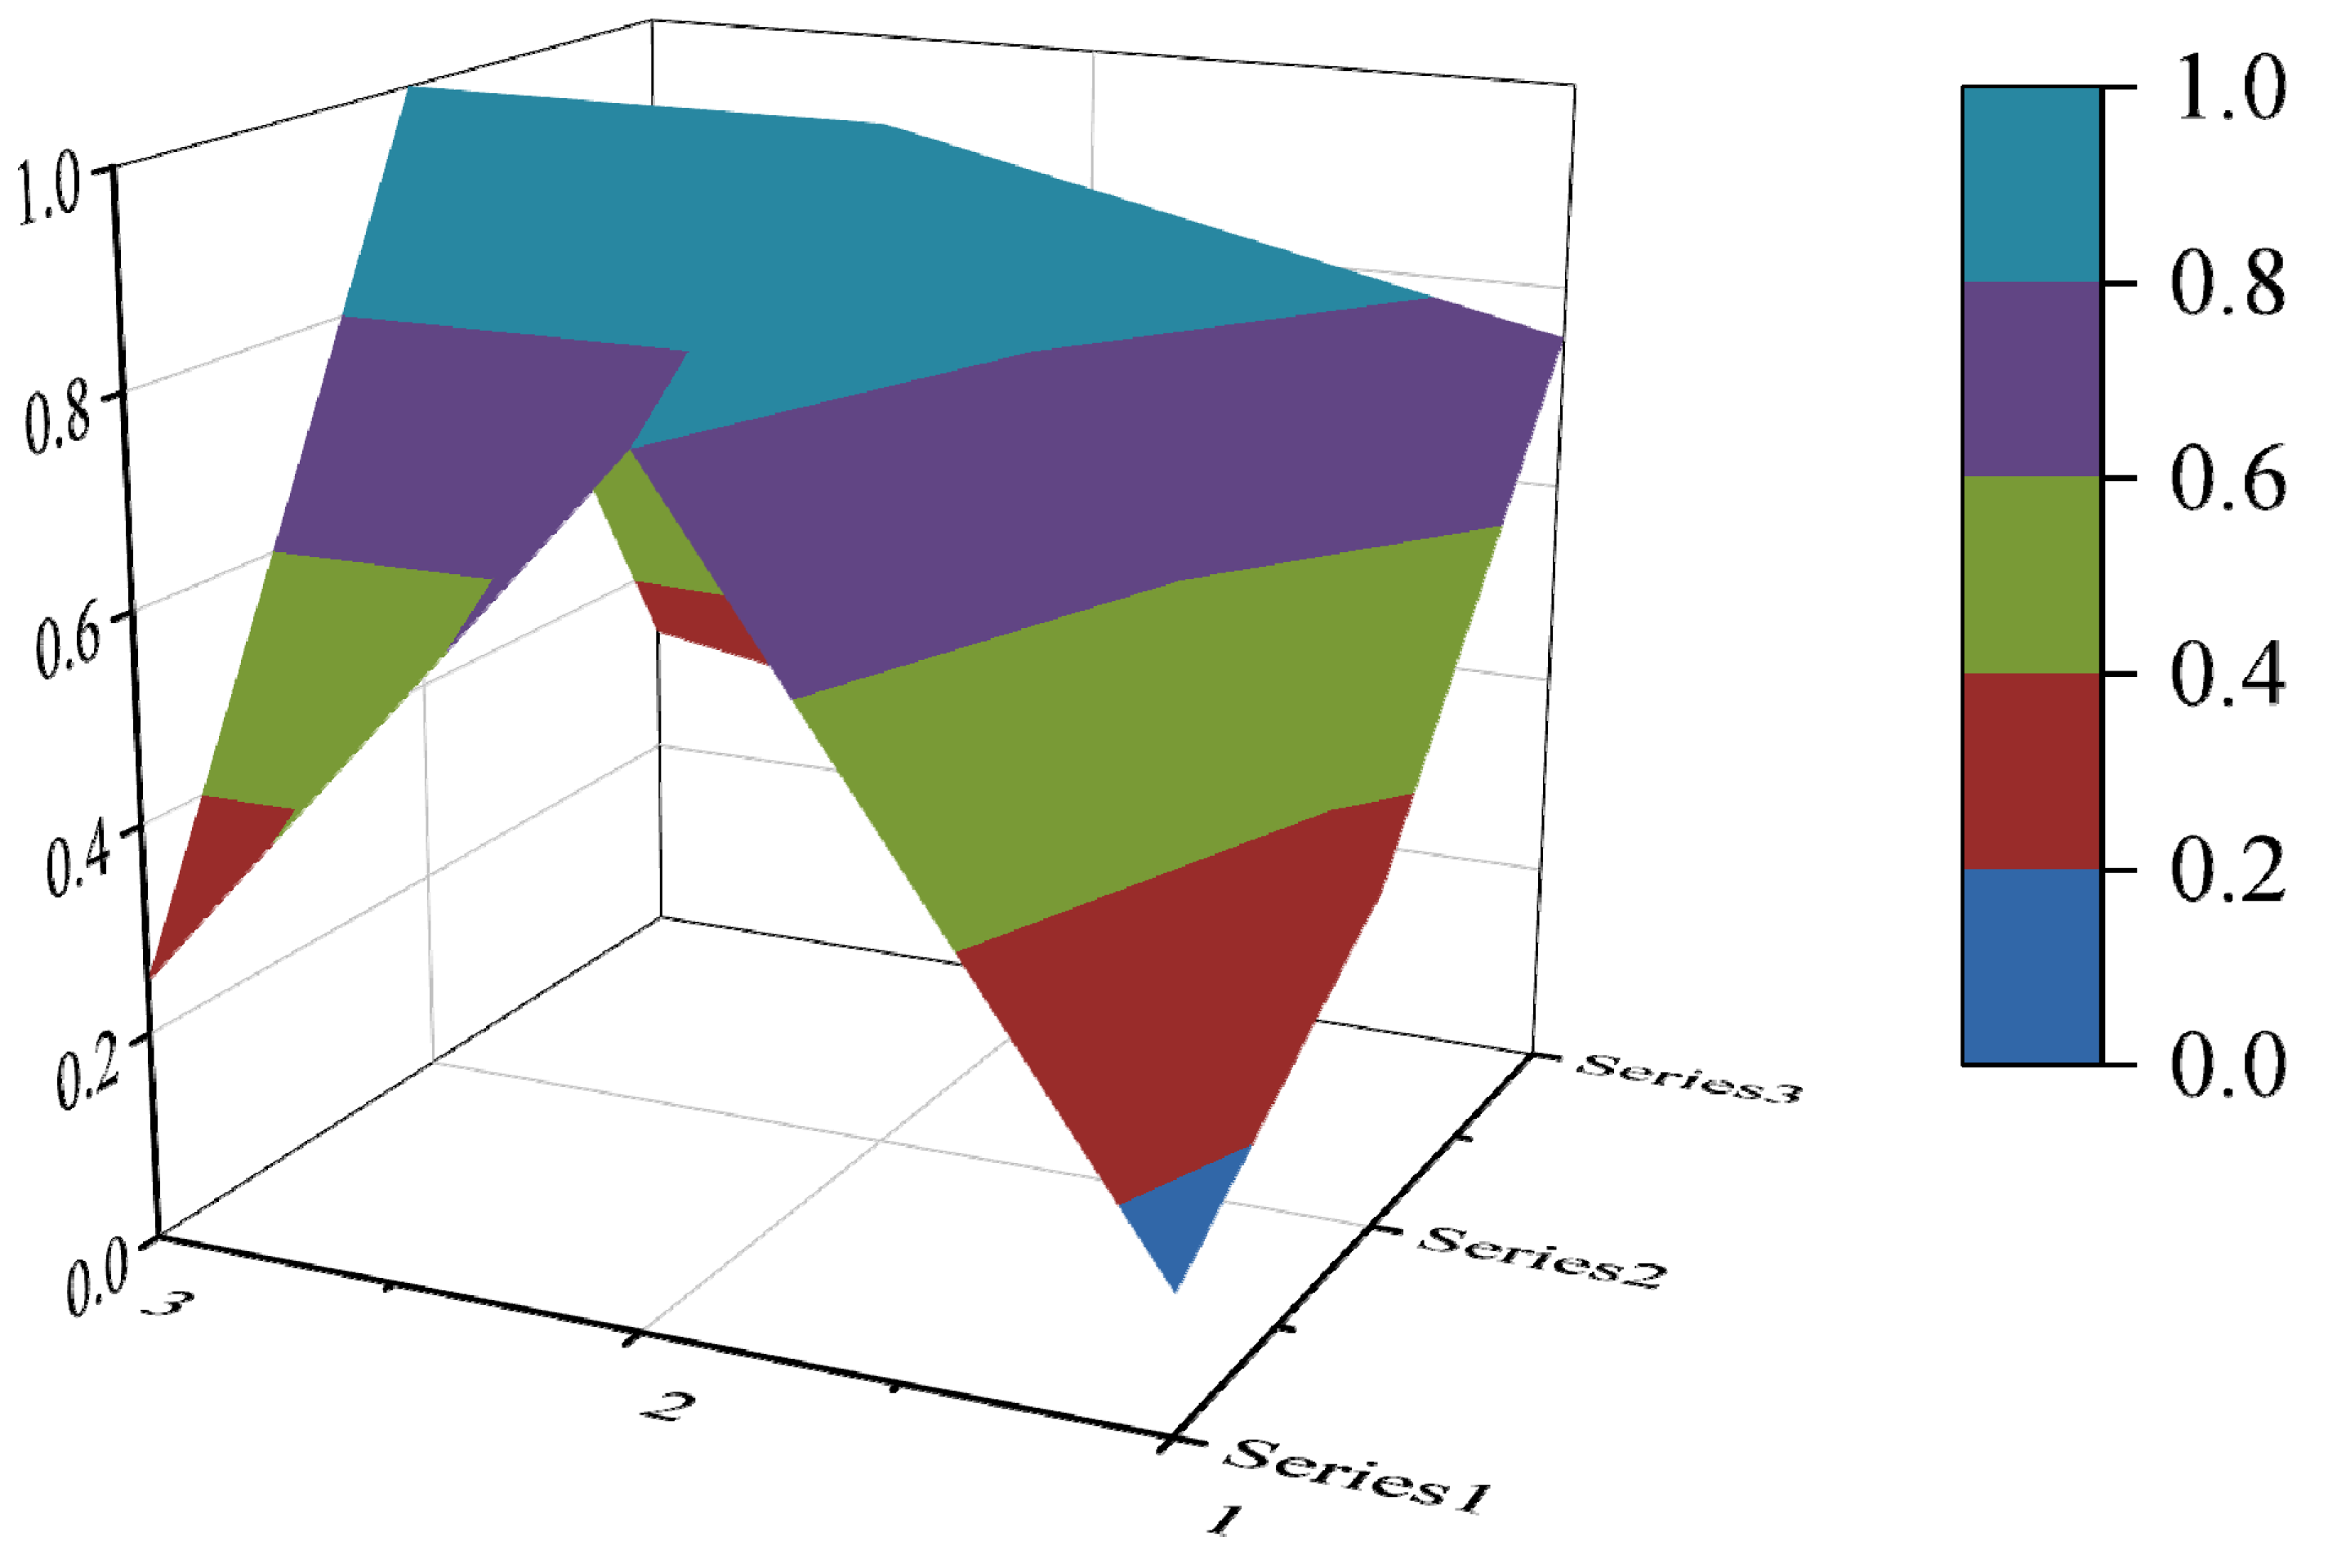
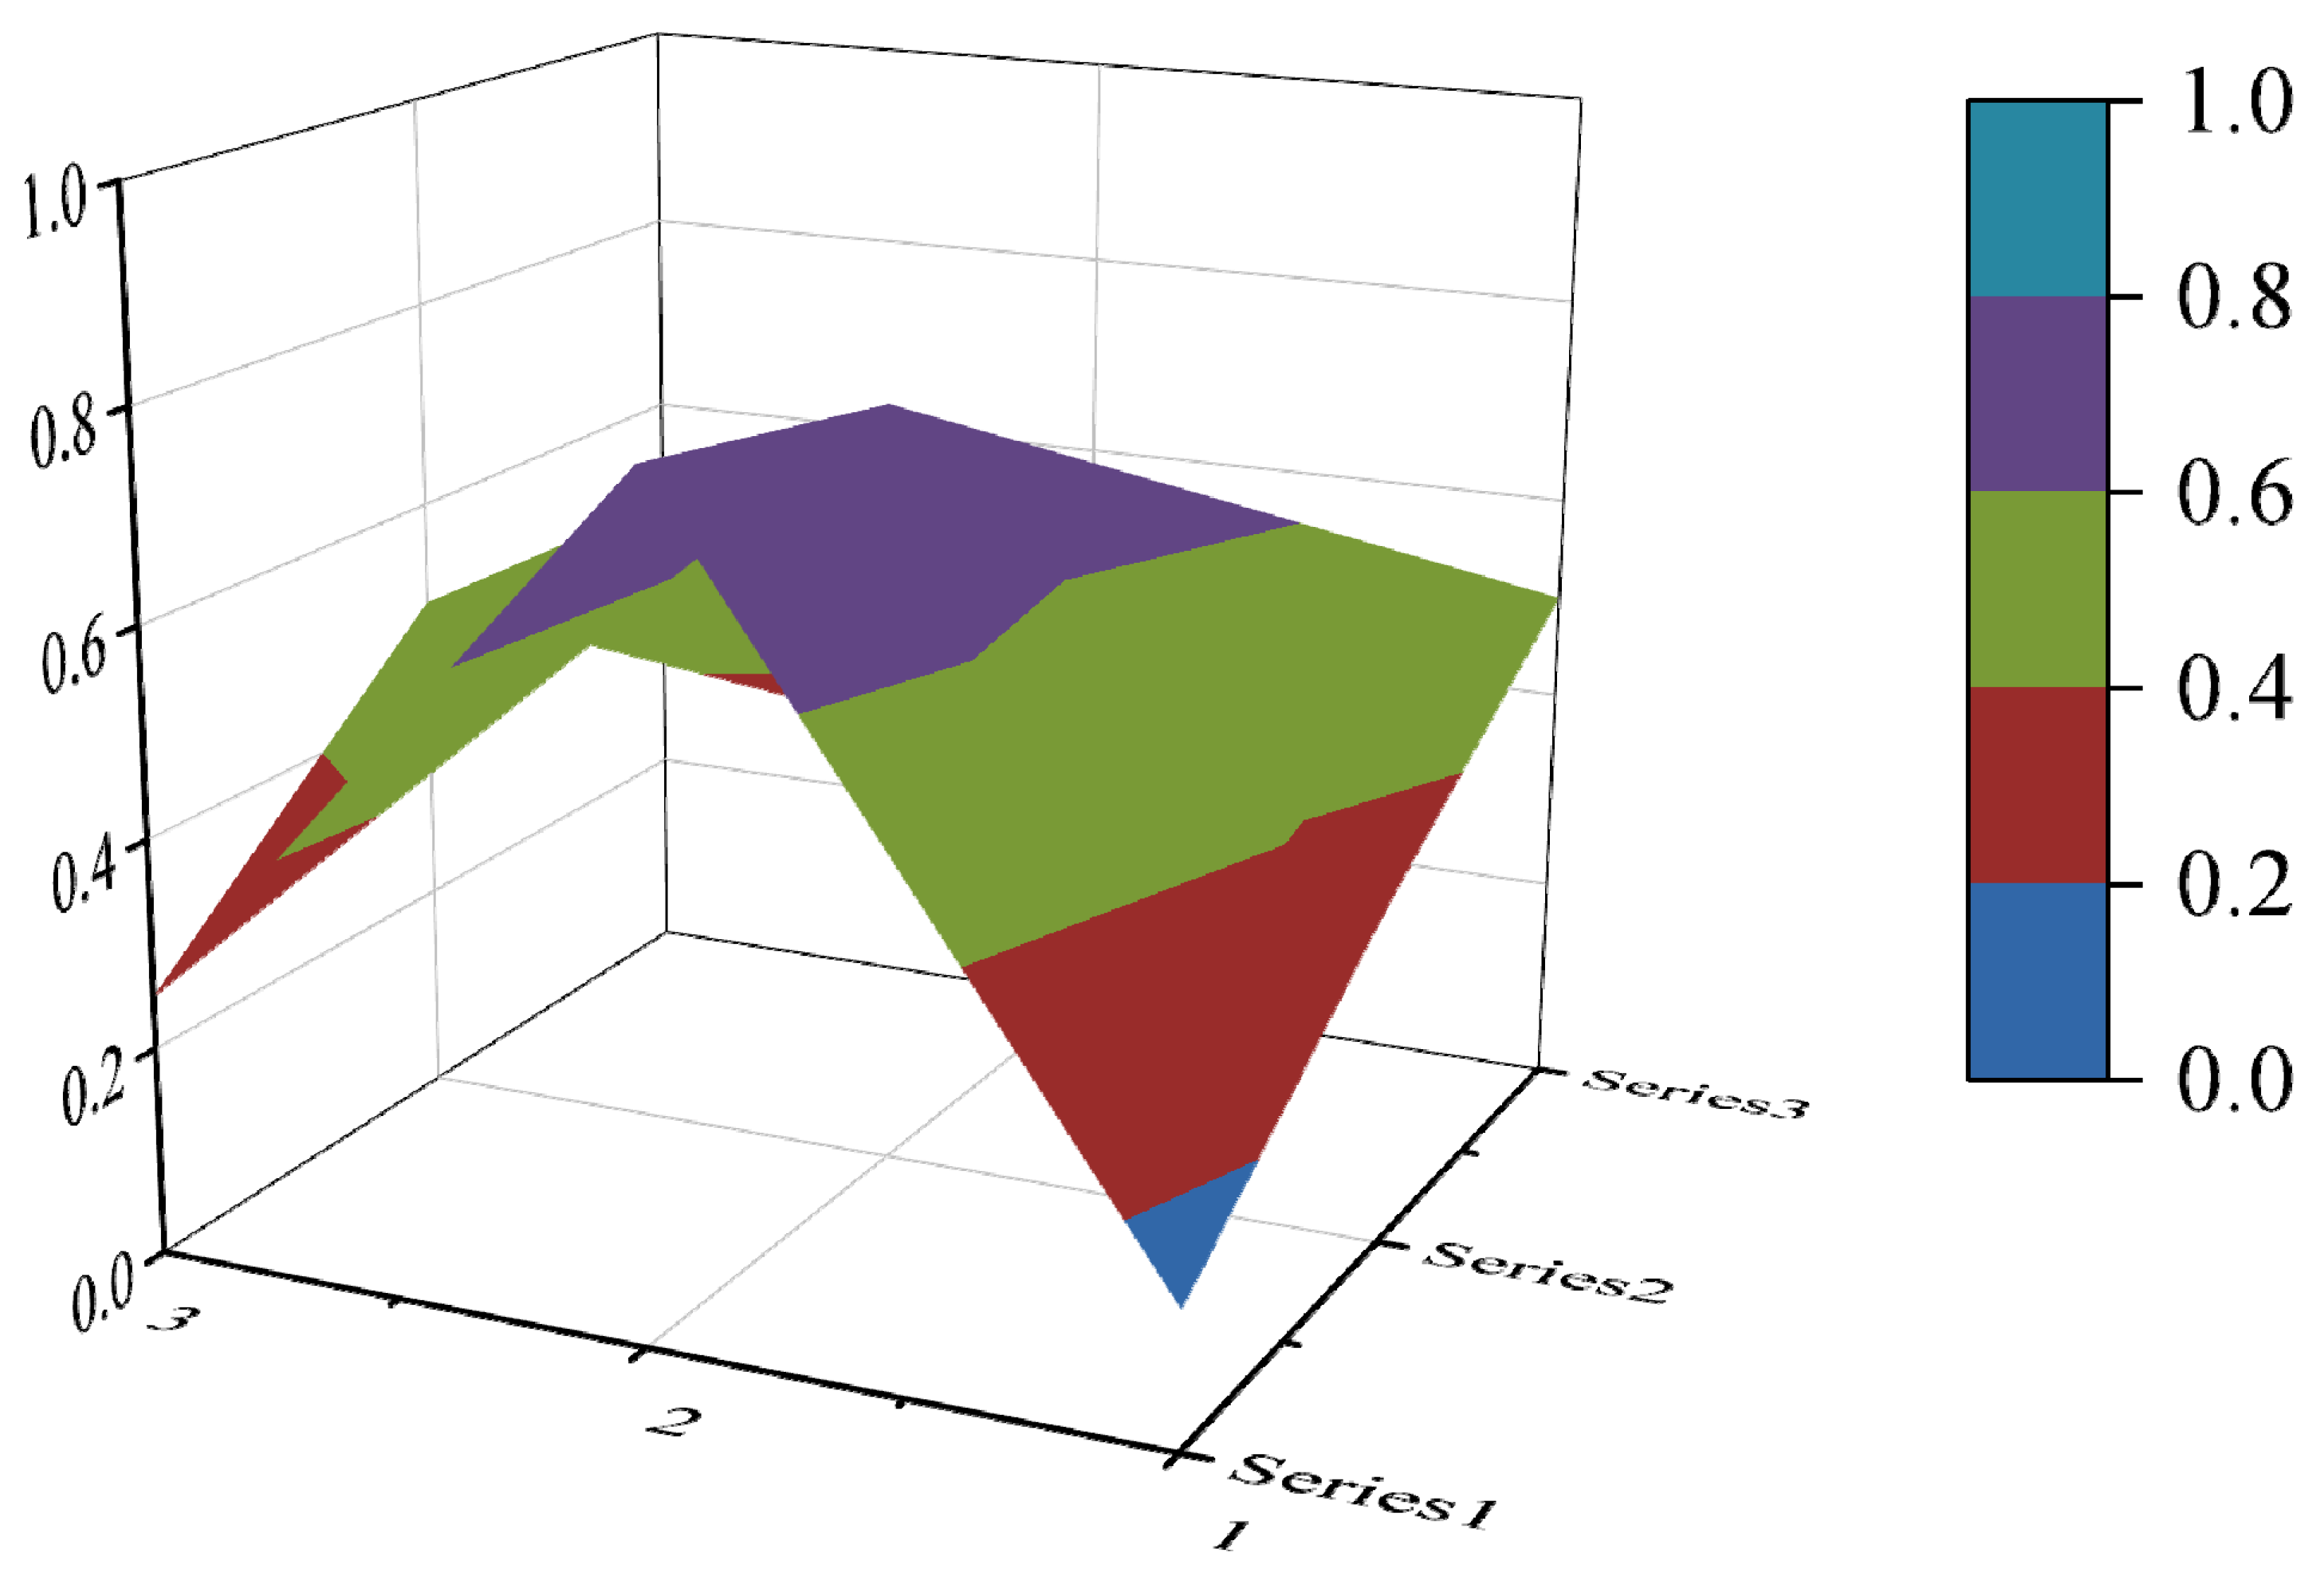
3.3.4. PMC Surface Construction
3.4. Research Question
- (1)
- What is the quality of current ecological protection policies? By summing up and calculating the PMC index and classifying it hierarchically, we can understand the overall development level of ecological protection compensation policy.
- (2)
- What are the shortcomings in the overall design of the existing ecological protection compensation policies? The advantages and disadvantages of the various policies can be judged by the degree of concavity of the PMC surface. It will help to identify the shortcomings of the policy.
- (3)
- In what ways can future policies be improved? A comparative analysis of policies to clarify their strengths and weaknesses can help us better grasp the direction of policy improvement.
4. Results and Discussion
4.1. The PMC Index of 10 Samples
4.2. Specific Evaluation of Each Group of Ecological Protection Compensation Policies
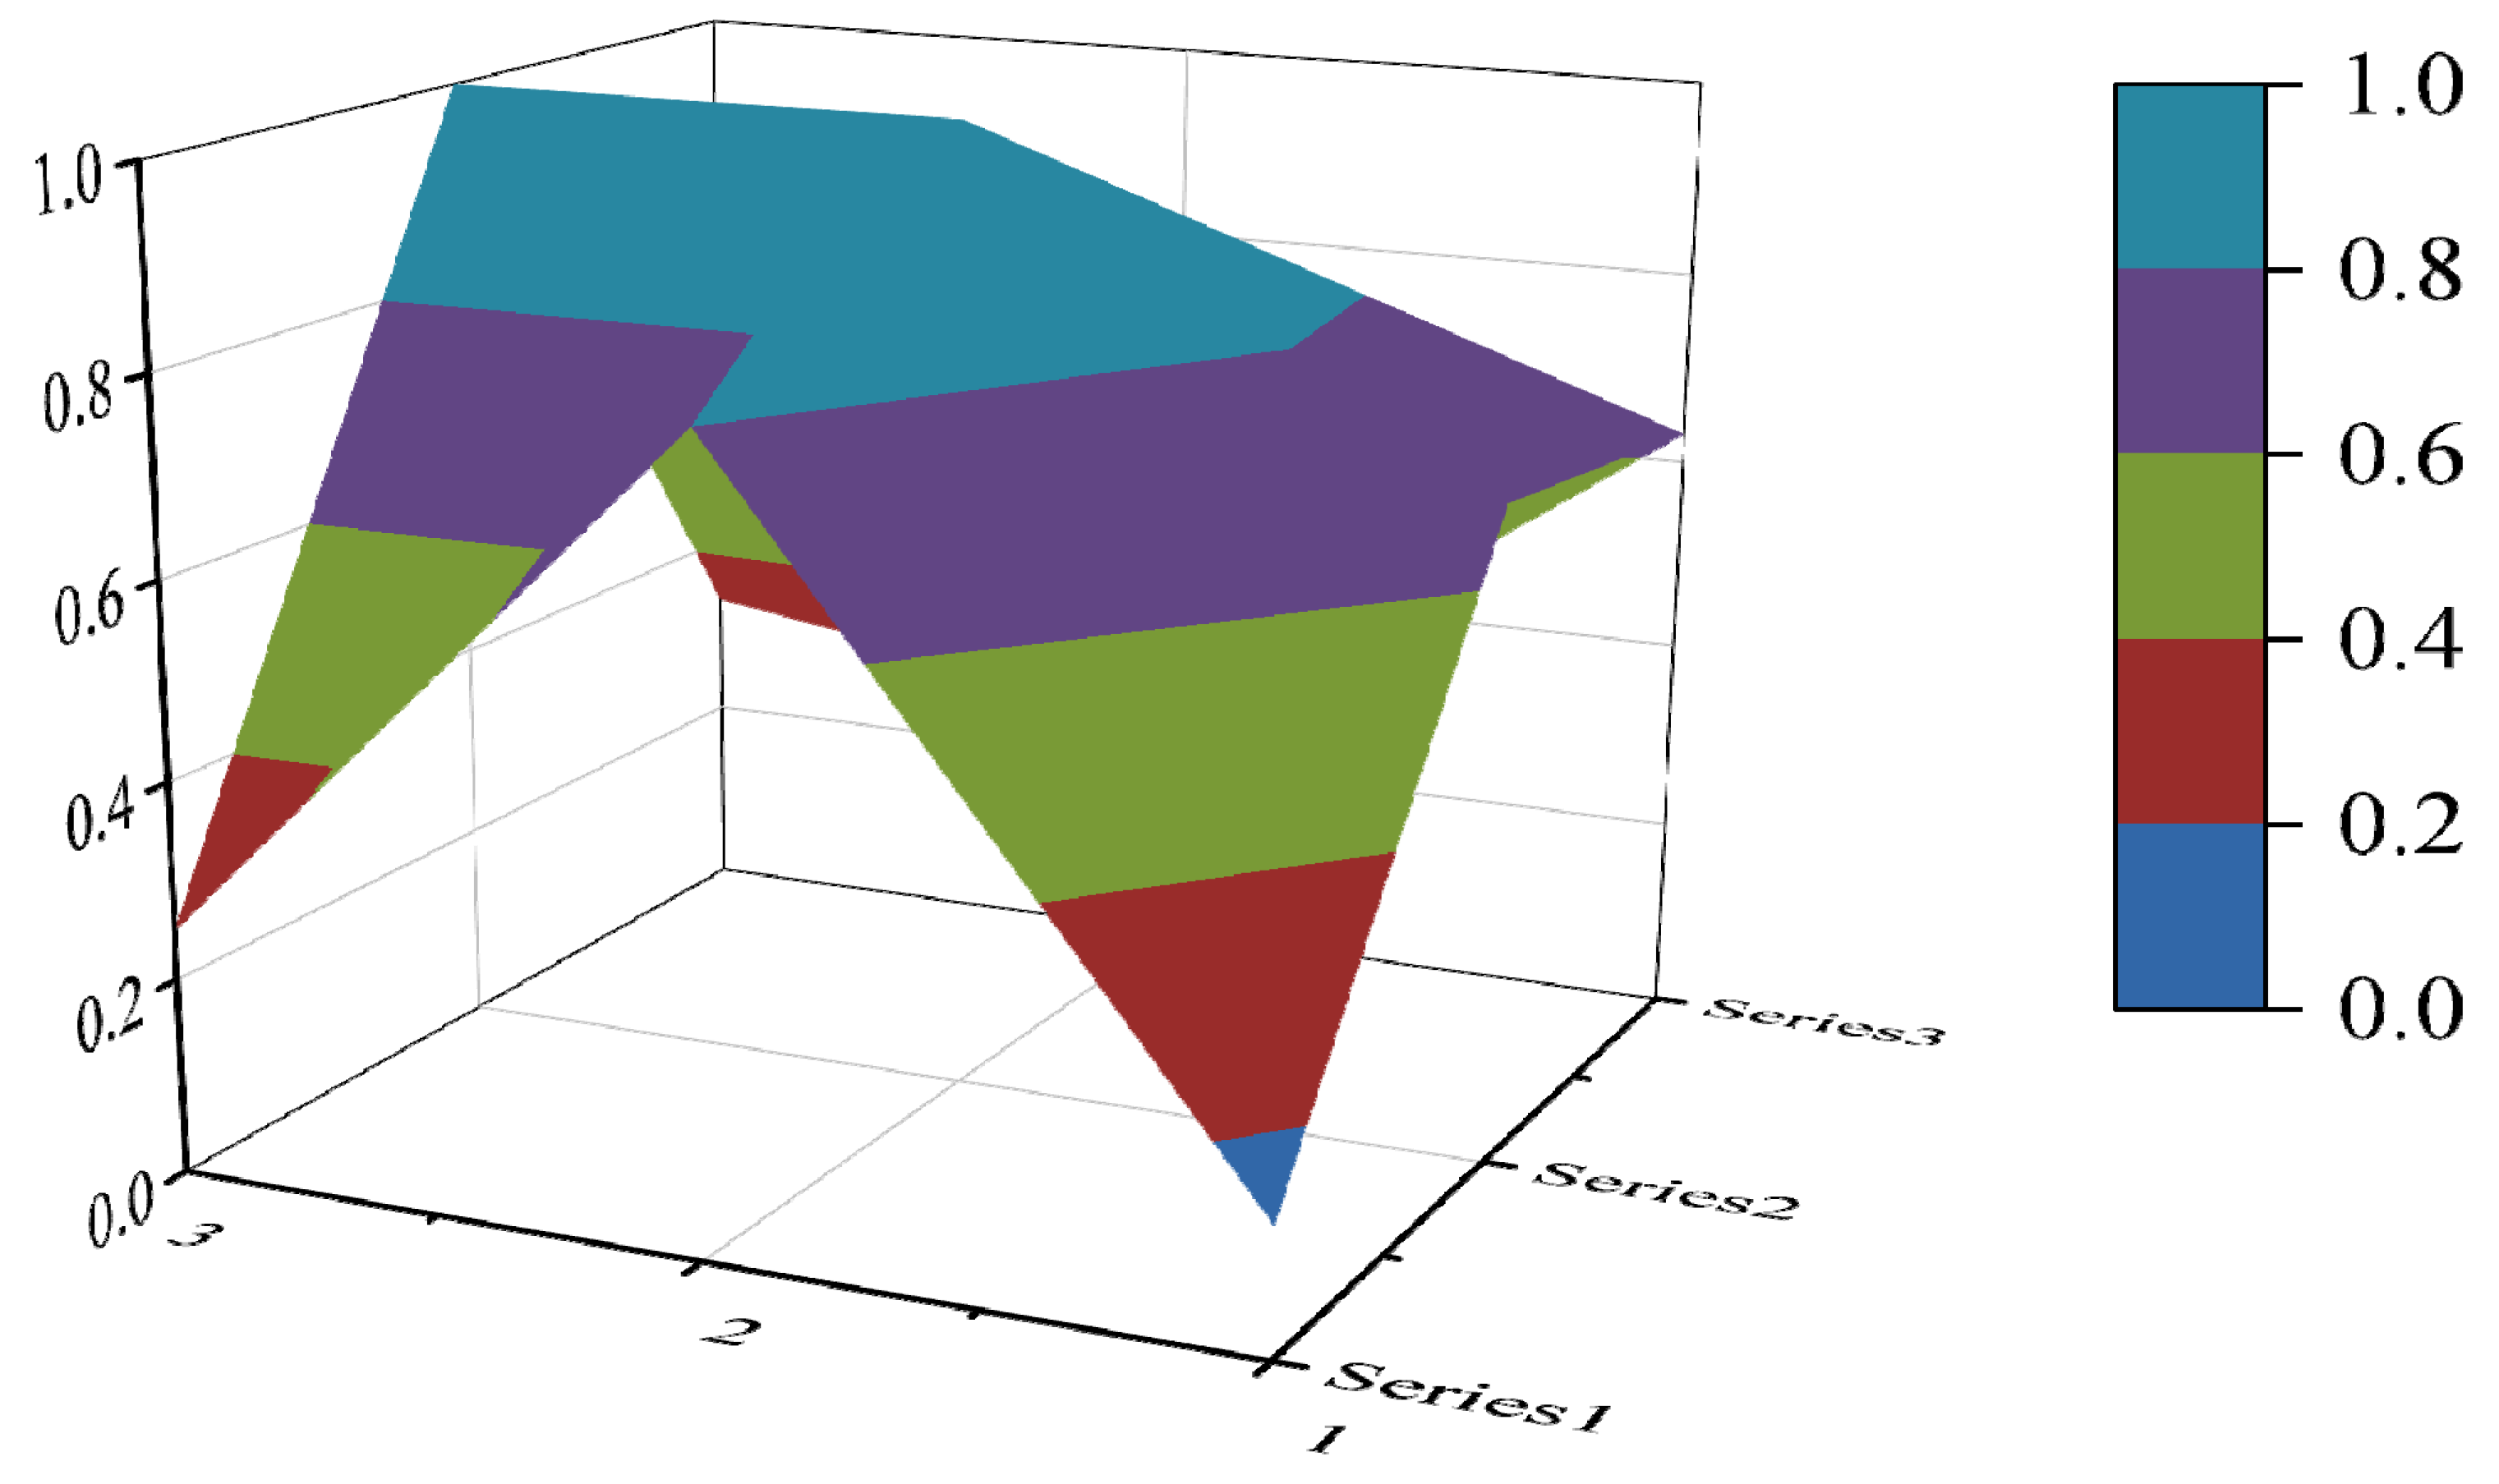
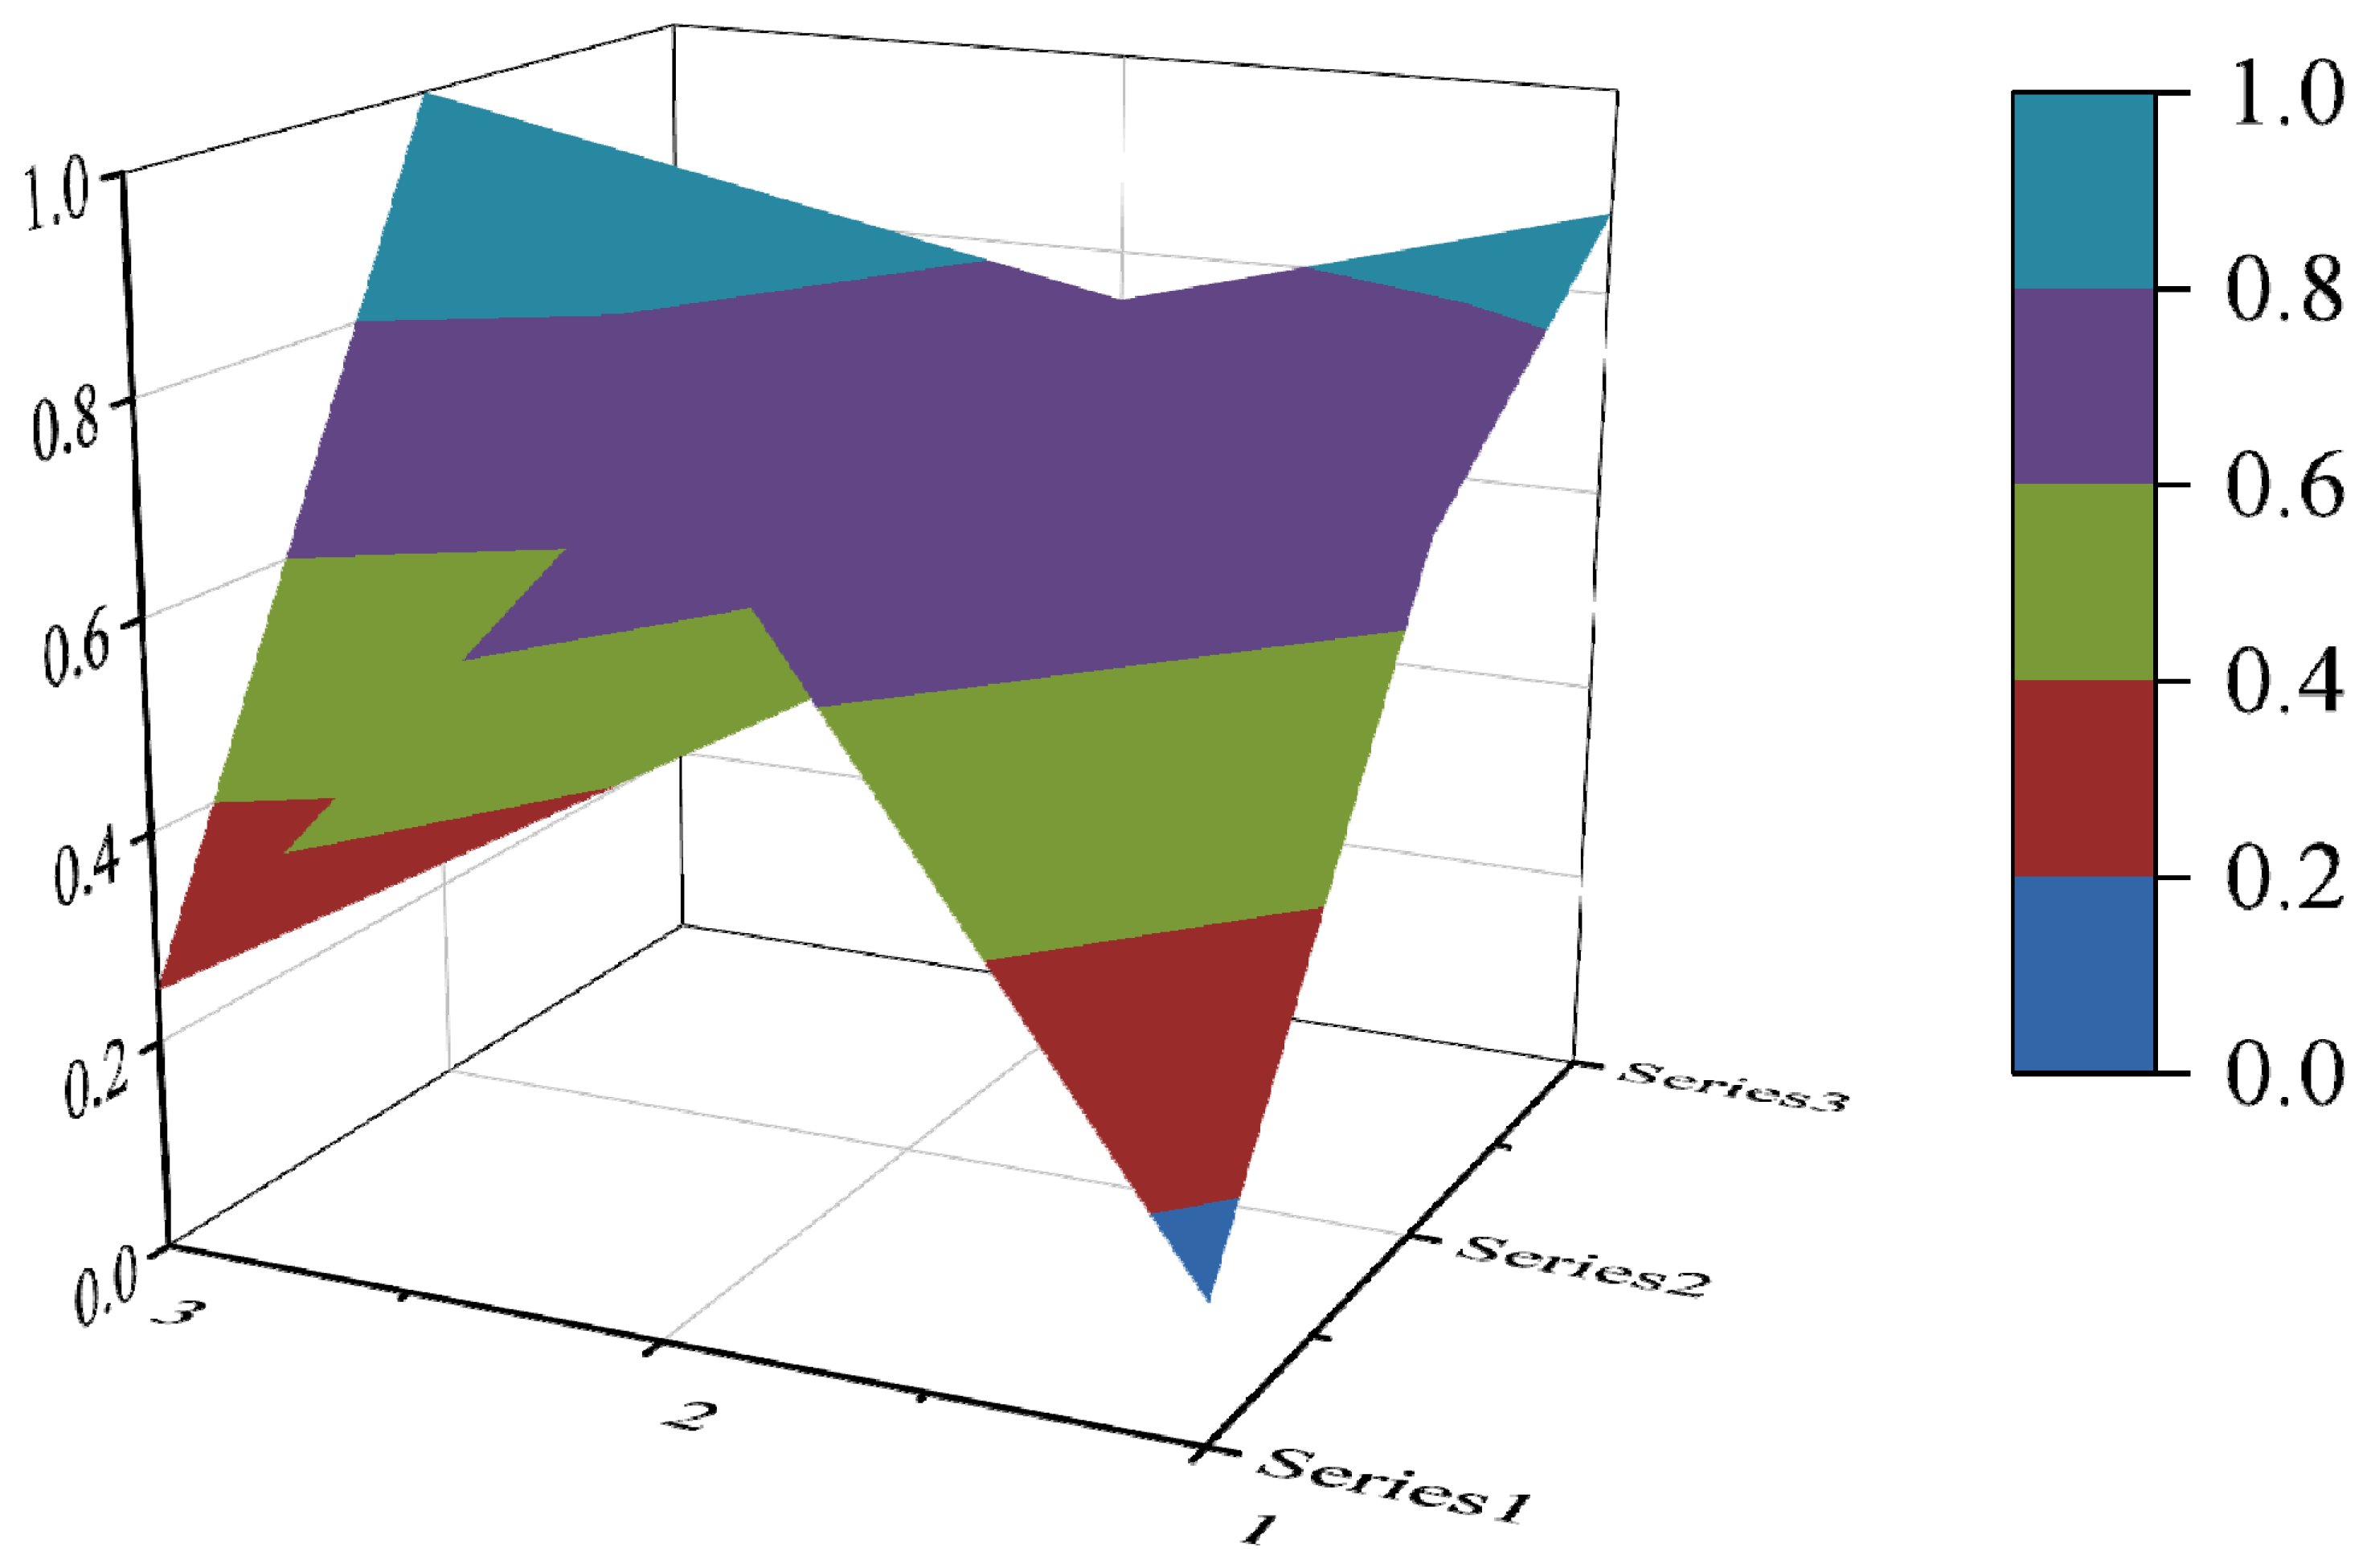
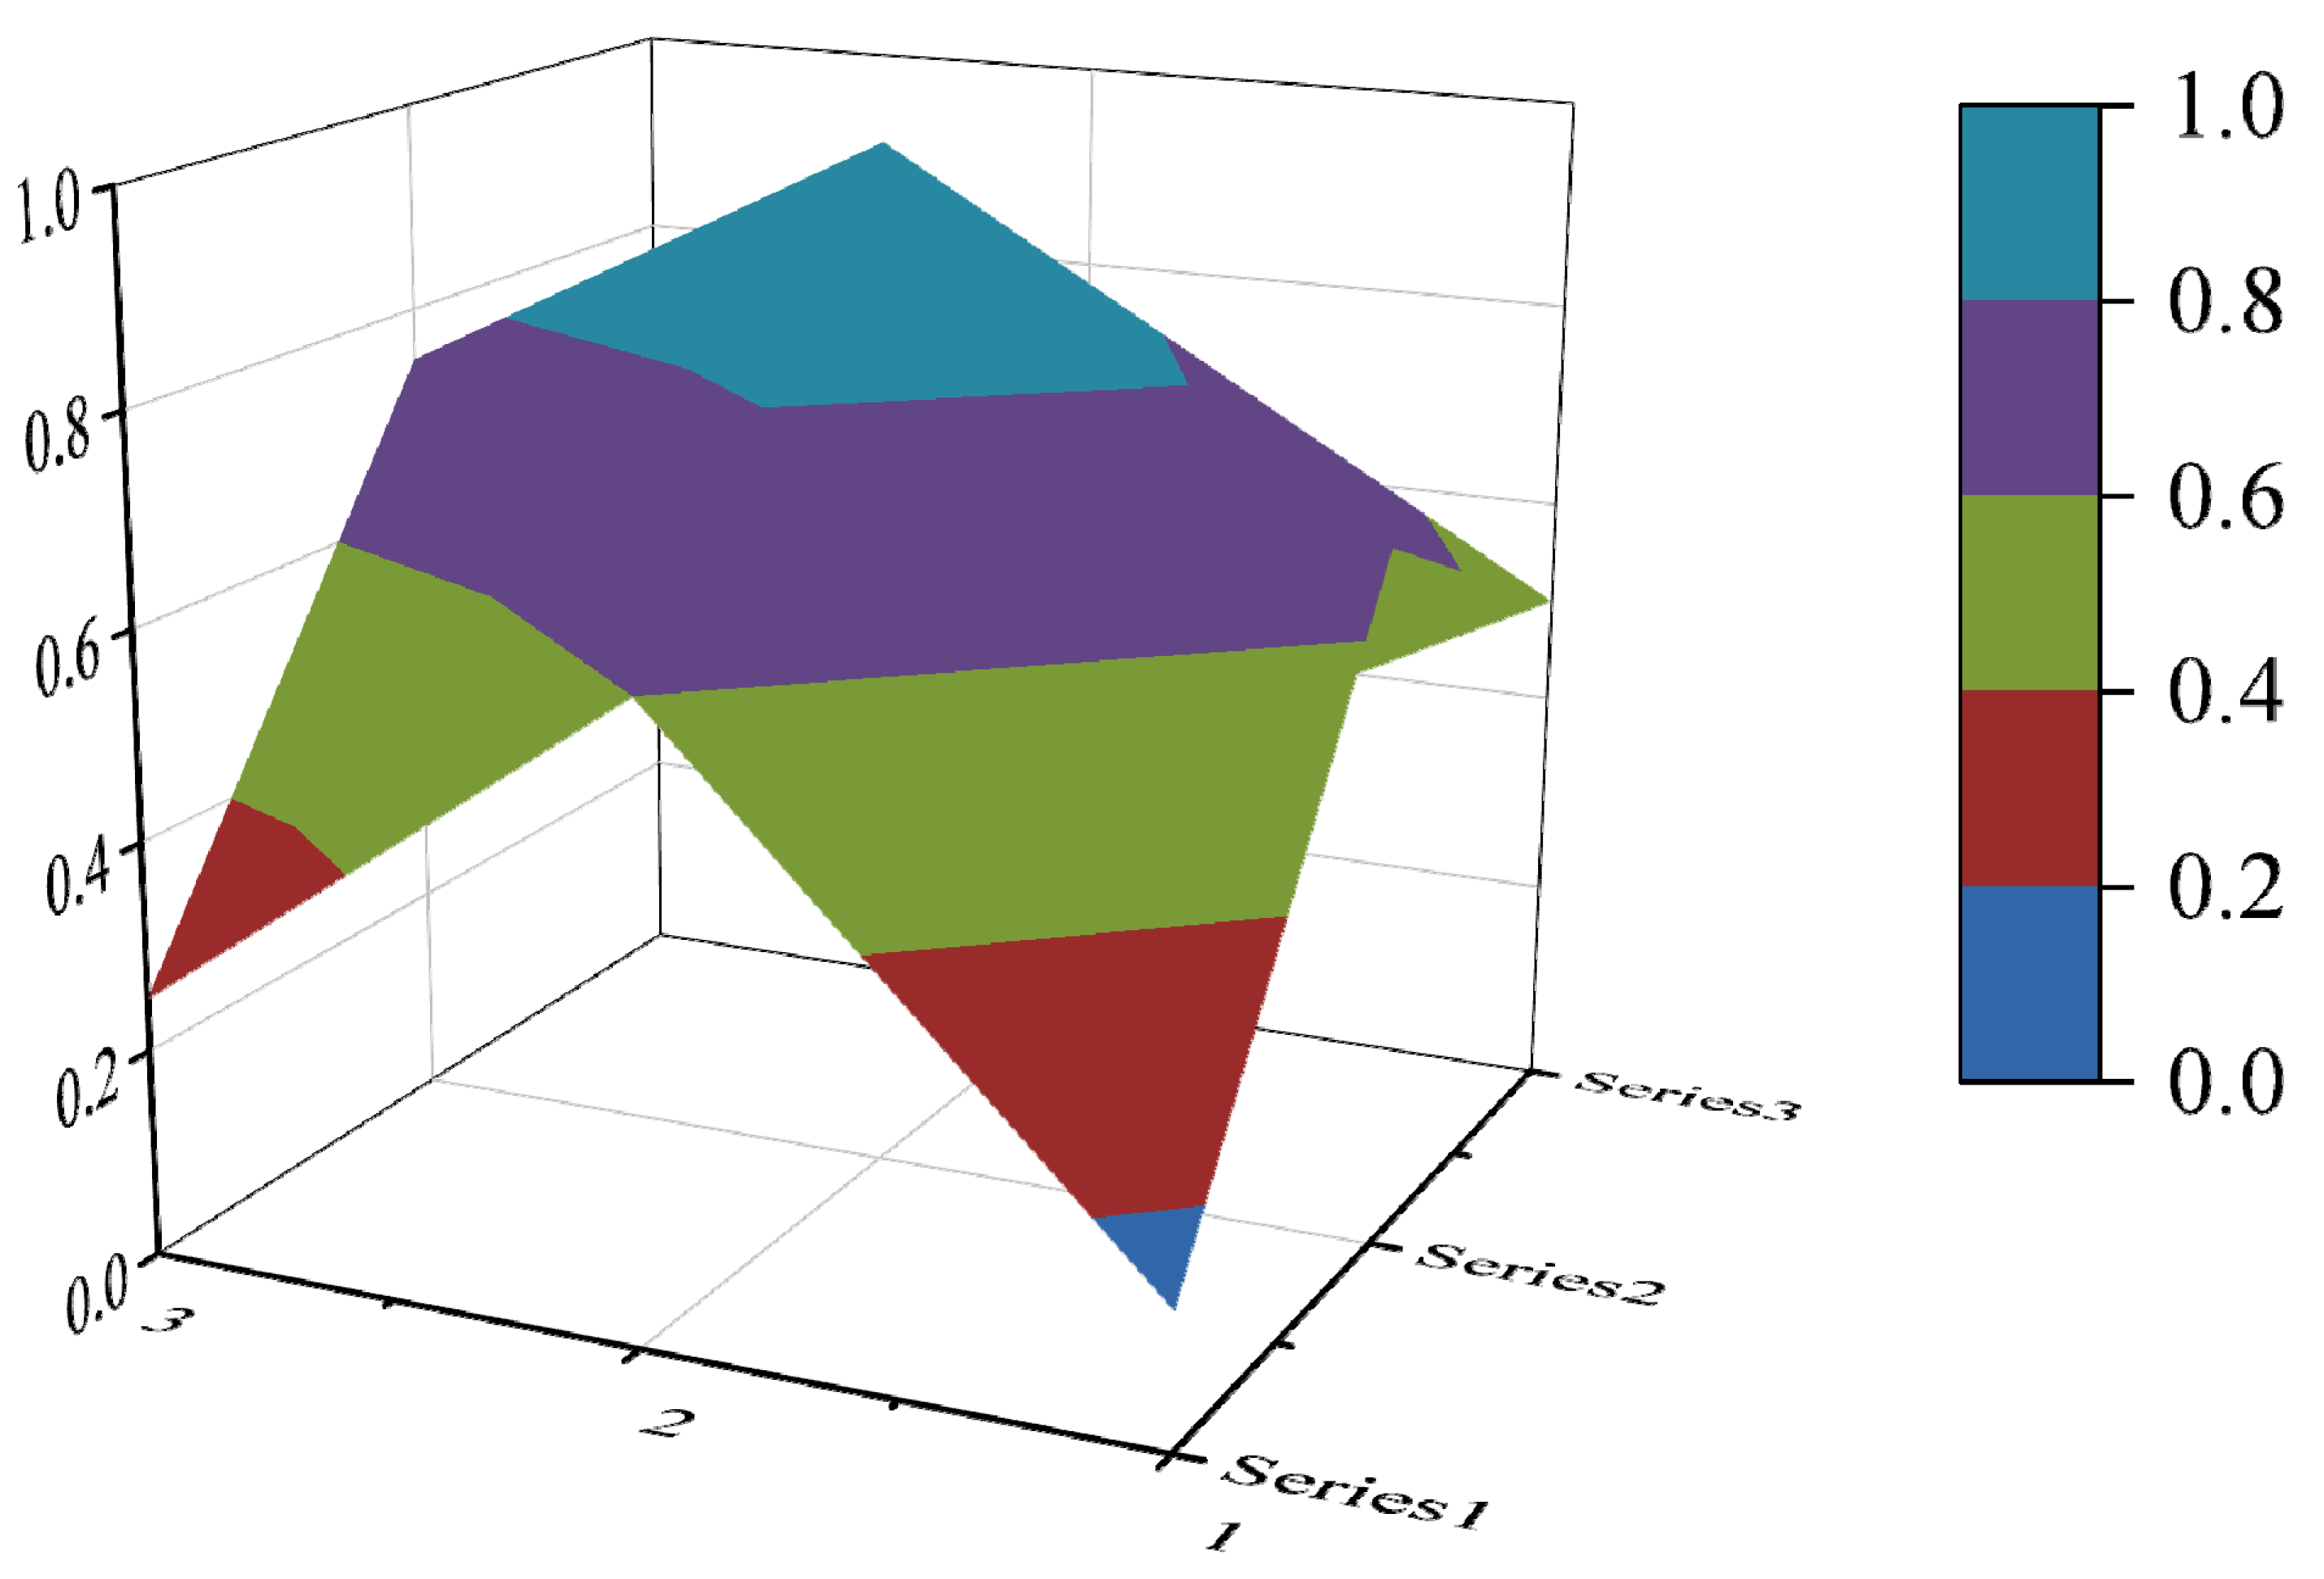
4.2.1. The “Good” Group of Policies
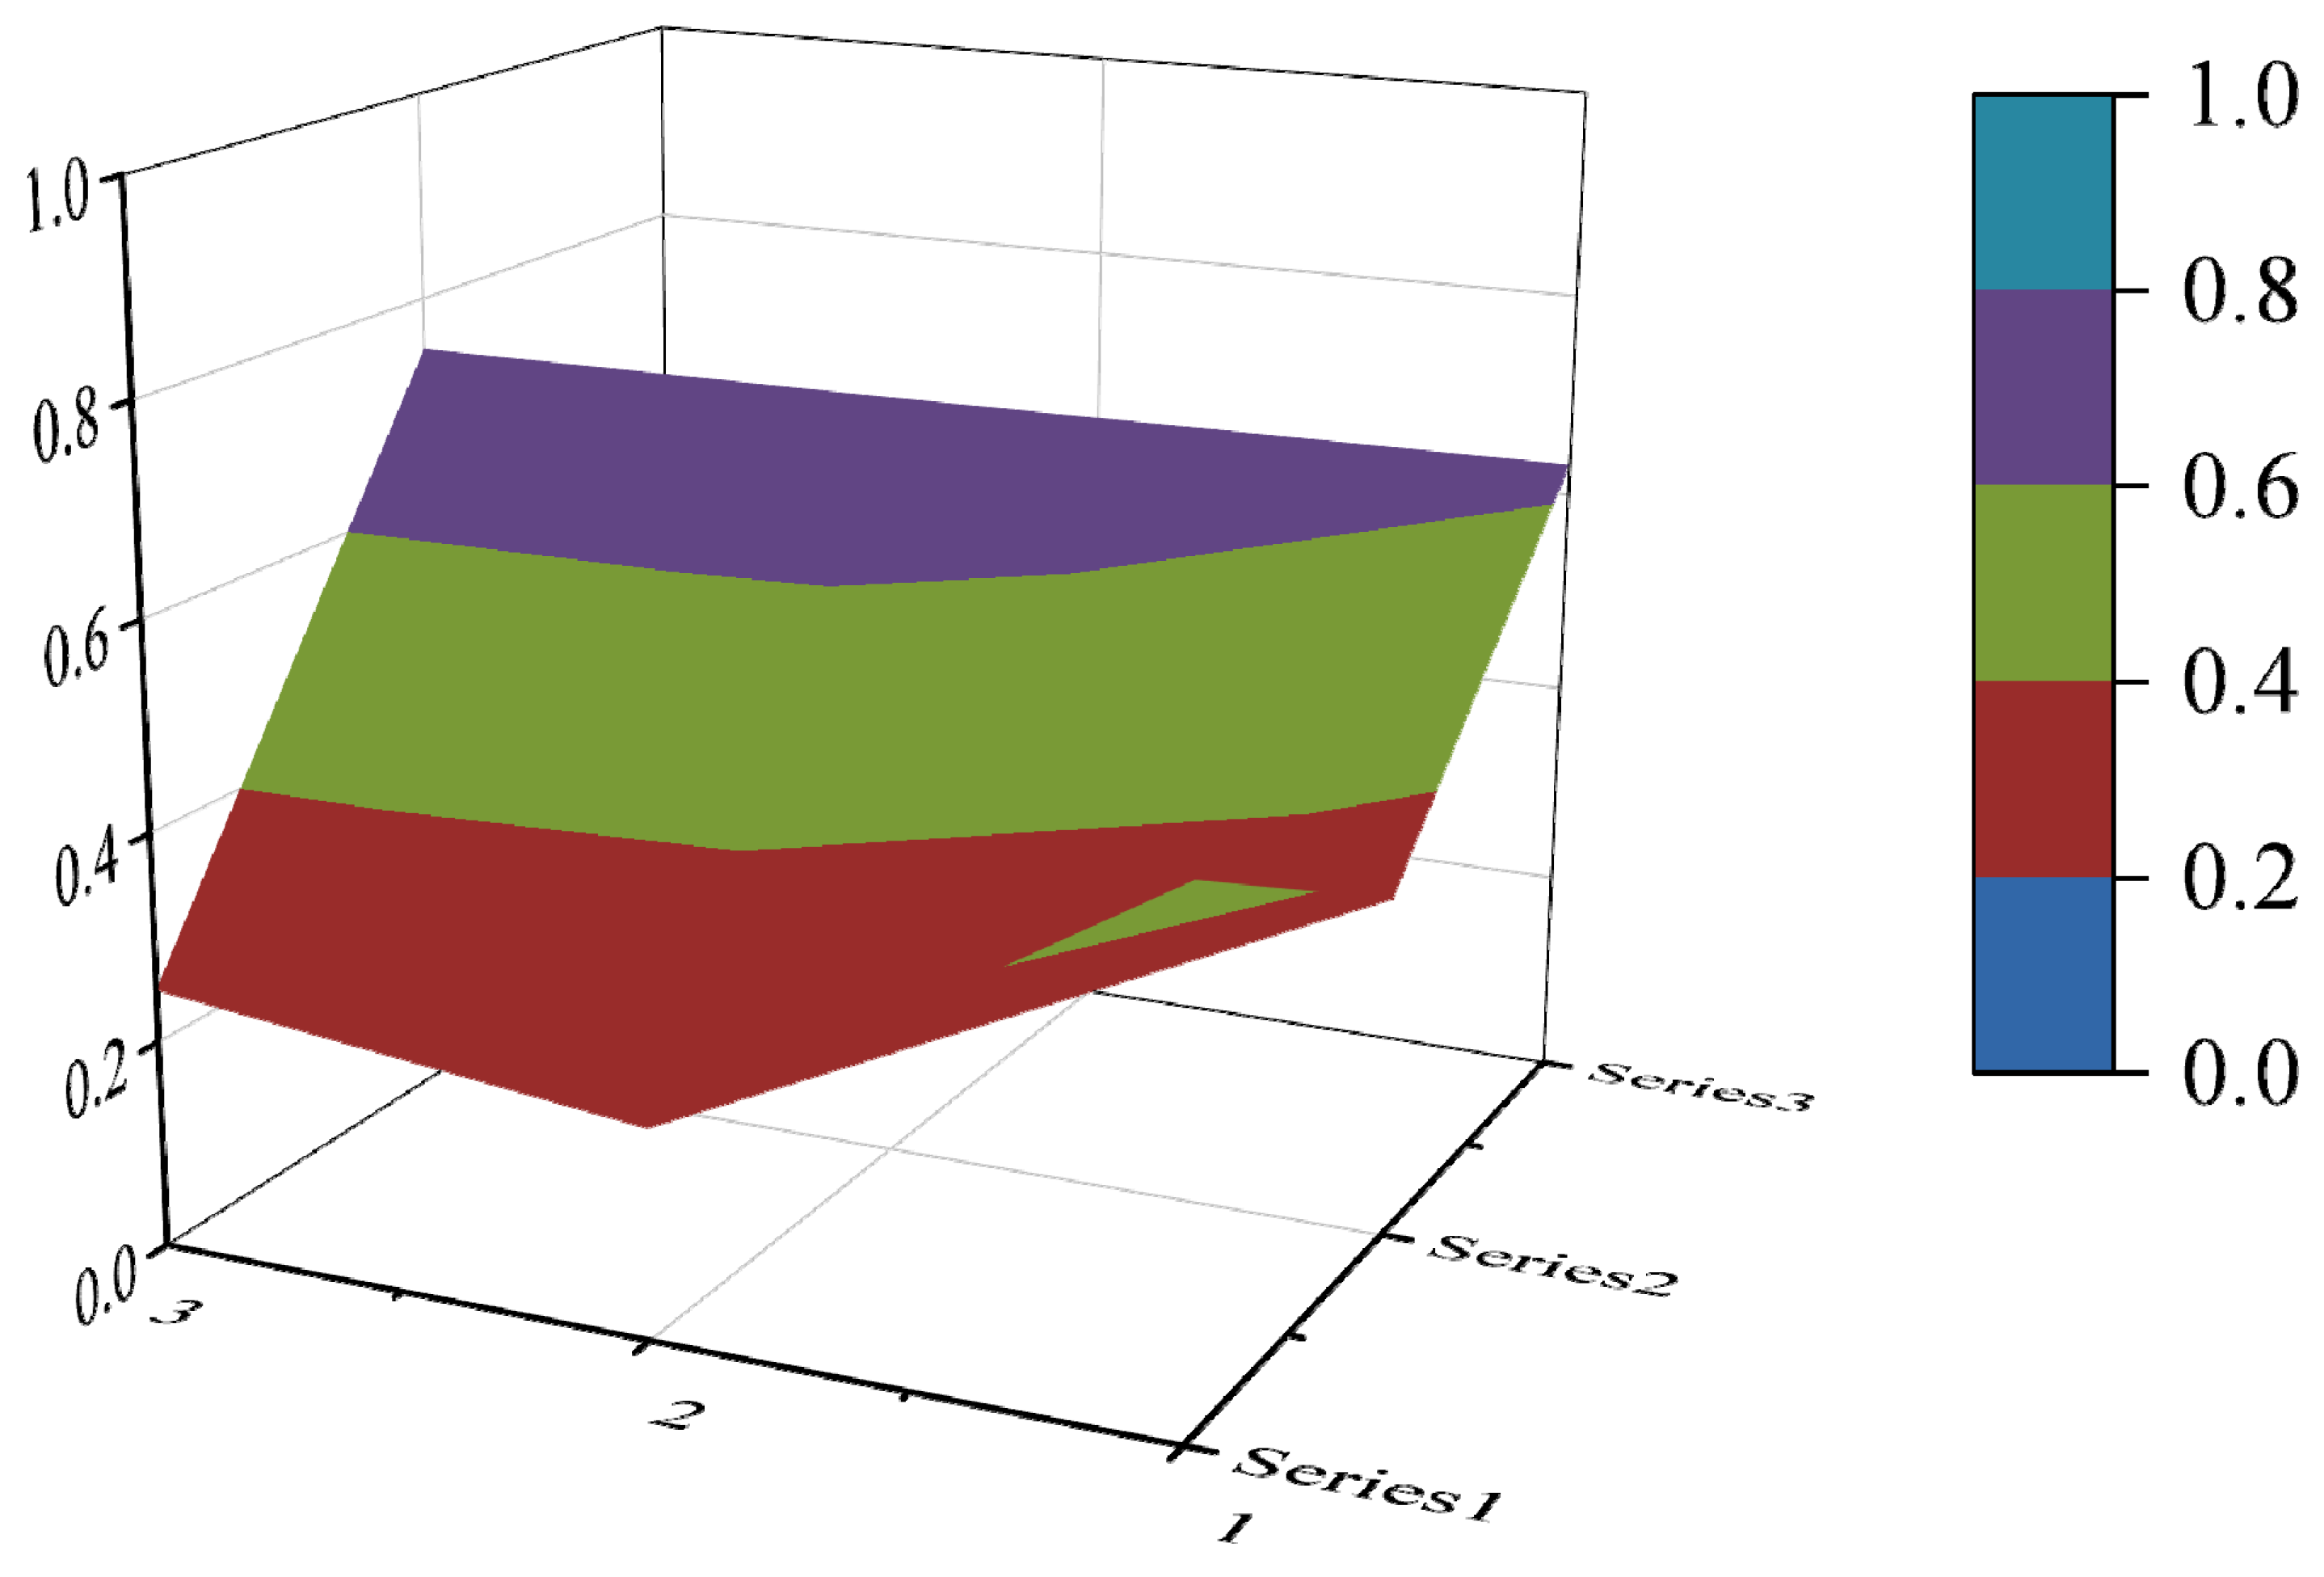
4.2.2. The “Acceptable” Group of Policies
4.3. Comparative Analysis of Ecological Protection Compensation Policies
- (1)
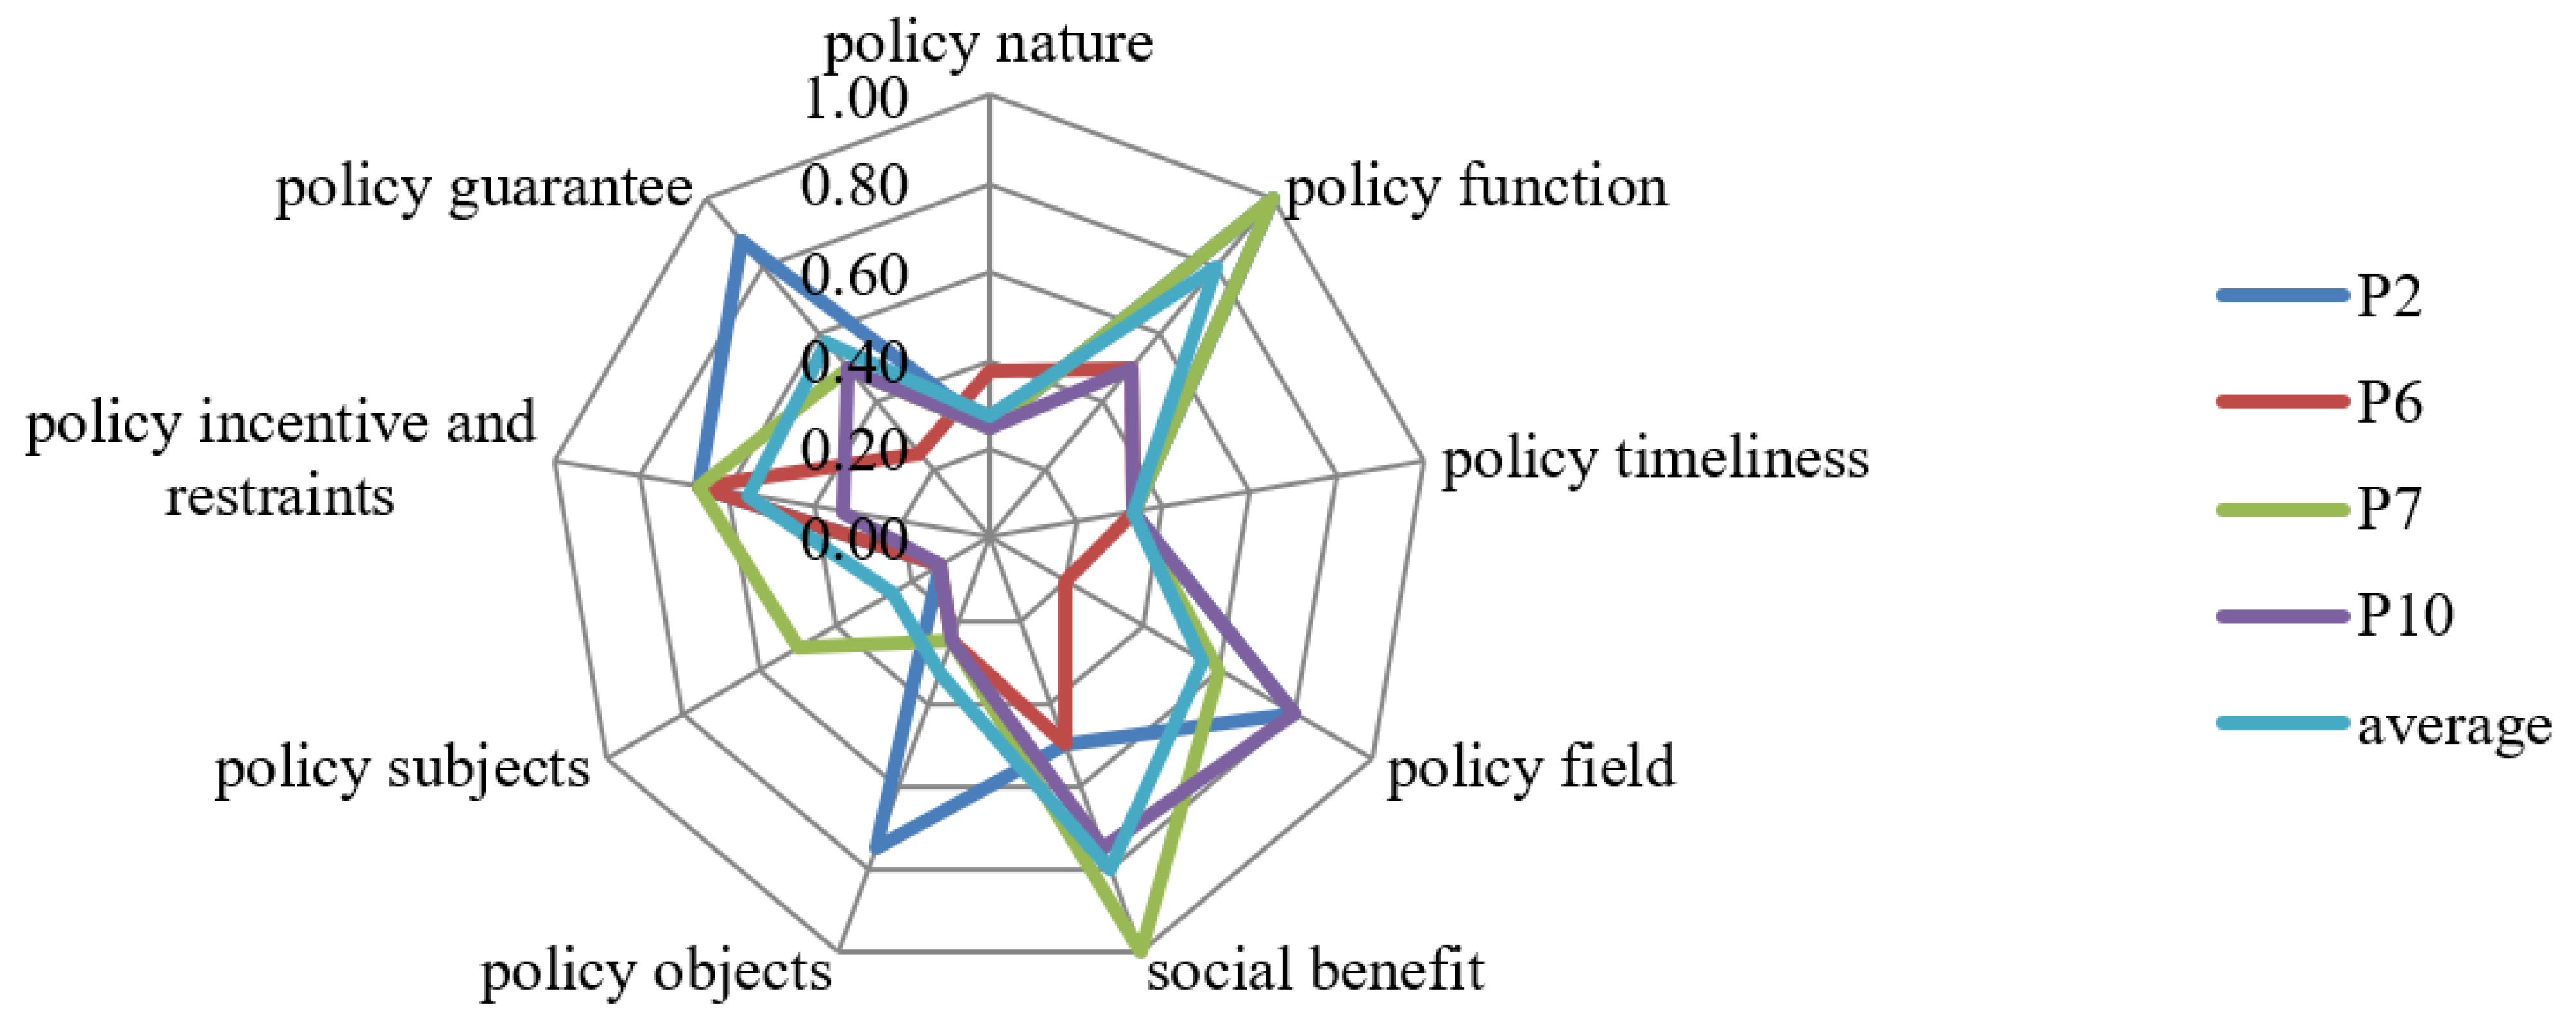
- X1 (policy nature). According to the regulations on the handling of official documents by Chinese party and government organs, policy nature consists of the number of documents issued and the type of policy documents, which could reveal the variability of different policies [66], and, in this paper, policy nature refers to the latter, including: the law, regulations, projects, opinions, notifications, decisions, plans and methods. The four policies are opinions or measures issued by the central government and its ministries, and the policy scores are balanced.
- (2)
- X2 (policy function). The policy function is an intrinsic property of the policy, referring to the role and effect that the policy can play in the process of implementation [67]. According to the PMC surface, the scores of policies P2 and P7 are 1, which indicates that the policy plays a good role in normative guidance, classified supervision, collaborative management and overall coordination, highlighting the effective governance of the government. In contrast, policies P6 and P10 scored 0.5, and there were no clear measures in X2.1 standard guidance, X2.3 collaborative management and X2.3 overall coordination, indicating that the policy should further detail its effects.
- (3)
- X3 (policy timeliness). The policy timeline refers to the time frame of the impact of the policy and reflects the overall design planning of the policy. The average value of the four policies is 0.33. Policy P2 is a long-term policy and policies P6, P7 and P10 are short-term policies, which shows that the development target time limit set by the content of the ecological protection compensation policy is relatively single, and the specific planning on long-term, medium-term and short-term development time limits is not comprehensive enough.
- (4)
- X4 (policy area). The policy area refers to the scope of policy influence, including economic, social, political, scientific and technological, and ecological. The scores of policies P2, P7 and P10 are all higher than the average score, which indicates that the policies cover a wide range of fields, including economy, society, science and technology and ecology, and the content is perfect. It is worth noting that policy 6 scored only 0.2 points in this item, only for the ecological field. From the content of the policy, it aims to promote the construction of ecological civilization and provide high-quality development and guide local governments to strengthen ecological, environmental protection by defining the scope of transfer payment support.
- (5)
- X5 (social benefits). The social benefits generated by the policy include environmental protection, sustainability, sound mechanism and win-win cooperation. The policy P7 score of X5 is 1, which is much higher than the average value, indicating that the policy is well-considered and pays attention to social benefits. The scores of policies P2, P6 and P10 are 0.50, 0.50 and 0.75, respectively, which are lower than the average value of 0.80. Therefore, future policy improvement can strengthen the attention to social benefits.
- (6)
- X6 (policy objects). Policy objects mainly refer to those who are affected by the policy and need to take corresponding measures [68]; it is the focus point of policy operation, and to a certain extent reflects the level and scope of the policy role. Policy P2’s score is 1. The policy receptor is the people’s governments of all provinces, autonomous regions and municipalities directly under the Central Government, ministries and commissions of the State Council and institutions. In China, government departments at different administrative levels have played an essential role in improving the compensation mechanism for ecological protection. The higher the administrative level of the institution, the higher the administrative level, and the stronger the coordination ability when implementing the ecological protection compensation policy, so policy P2 has a better policy effect in this item. Policies P6, P7 and P10 scored 0.25 in this item, and further attention can be paid to the cooperation of policy objects, that is, executive departments, in future policy improvement.
- (7)
- X7 (policy subjects). The policy subject includes a variety of subject forms such as single subject and multi-subject association, which is the beginning of the policy operation. Generally speaking, the administrative level and management scope of policy-issuing agencies directly affect the efficiency of policy implementation [69].The score of P7 policy is 0.50, which is higher than the average, while the scores of P2, P6 and P10 are all 0.13, which is lower than the average. It can be seen that P7 has a good policy effect in this item.
- (8)
- X8 (policy incentive and restraints). Policy incentives and constraints are measures to motivate the subjects to actively implement their responsibilities to promote the effective implementation of policies in the process of policy implementation. The scores of P2, P6 and P10 on X8 are higher than the average, which indicates that the incentive constraint is perfect. For P7, the policy score is only 0.33, which is lower than the average. Therefore, more attention should be paid to implementing incentive and restraint measures in future policy improvement.
- (9)
- X9 (policy guarantee). In order to facilitate the smooth implementation of the policy, a series of guarantees are usually put in place when the policy is released [70]. According to the surface chart, policy 2 is higher than the average value in the X9 execution guarantee office, which indicates that the policy pays attention to the execution guarantee work to promote the implementation of the policy. The scores of P7 and P10 are 0.50, which is at the average level. The policy score for P6 is only 0.25, which is also the reason for the low overall score of the policy. Therefore, in the future, the improvement of the policy can further pay more attention to the implementation of safeguard measures.
5. Conclusions
Author Contributions
Funding
Institutional Review Board Statement
Informed Consent Statement
Data Availability Statement
Conflicts of Interest
References
- Gao, X.; Huang, B.; Hou, Y.; Xu, W.; Zheng, H.; Ma, D.; Ouyang, Z. Using Ecosystem Service Flows to Inform Ecological Compensation: Theory & Application. Int. J. Environ. Res. Public Health 2020, 17, 3340. [Google Scholar]
- Engel, S.; Pagiola, S.; Wunder, S. Designing payments for environmental services in theory and practice: An overview of the issues. Ecol. Econ. 2000, 65, 663–674. [Google Scholar] [CrossRef]
- Yu, H.; Xie, W.; Yang, L.; Du, A.; Almeida, C.; Wang, Y. From payments for ecosystem services to eco-compensation: Conceptual change or paradigm shift? Sci. Total Environ. 2020, 700, 134627. [Google Scholar] [CrossRef]
- Kinzig, A.P.; Perrings, C.; Chapin Iii, F.S.; Polasky, S.; Smith, V.K.; Tilman, D.; Turner, B.L. Paying for ecosystem services—promise and peril. Science 2011, 334, 603–604. [Google Scholar] [CrossRef]
- Salzman, J.; Bennett, G.; Carroll, N.; Goldstein, A.; Jenkins, M. The global status and trends of Payments for Ecosystem Services. Nat. Sustain. 2018, 1, 136–144. [Google Scholar] [CrossRef]
- Liu, D.; Hu, Z.; Jin, L. Review on analytical framework of eco-compensation. Acta Ecol. Sin. 2018, 38, 380–392. [Google Scholar]
- Liu, G.H.; Zhang, Y.M.; Shi, Y.H. The suggestions of improving the ecological compensation mechanism under the background of ecological civilization construction. Environ. Prot. 2015, 43, 34–38. [Google Scholar]
- Opinions of the General Office of the State Council on the Sound Ecological Protection Compensation Mechanism; General Office of the State Council: Beijing, China, 2016.
- Crabb, A.; Leroy, P. The Handbook of Environmental Policy Evaluation, 1st ed.; Routledge: Oxfordshire, UK, 2008. [Google Scholar]
- Vedung, E. Public Policy and Program Evaluation; Routledge: Oxfordshire, UK, 2017. [Google Scholar]
- Villarroya, A.; Puig, J. Ecological compensation and environmental impact assessment in Spain. Environ. Impact Assess. Rev. 2010, 30, 357–362. [Google Scholar] [CrossRef]
- Zheng, Q.; Wan, L.; Wang, S.; Wang, C.; Fang, W. Does ecological compensation have a spillover effect on industrial structure upgrading? Evidence from China based on a multi-stage dynamic DID approach. J. Environ. Manag. 2021, 294, 112934. [Google Scholar] [CrossRef]
- Chen, Y.; Dou, S.; Xu, D. The effectiveness of eco-compensation in environmental protection-a hybrid of the government and market. J. Environ. Manag. 2021, 280, 111840. [Google Scholar] [CrossRef]
- Liu, F.; Liu, Z. Quantitative Evaluation of Waste Separation Management Policies in the Yangtze River Delta Based on the PMC Index Model. Int. J. Environ. Res. Public Health 2022, 19, 3815. [Google Scholar] [CrossRef] [PubMed]
- Zhang, Q.; Hong, J.; Wu, F.; Yang, Y.; Dong, C. Gains or losses? A quantitative estimation of environmental and economic effects of an ecological compensation policy. Ecol. Appl. 2021, 31, e2341. [Google Scholar] [CrossRef] [PubMed]
- Estrada, M.A.R. Policy modeling: Definition, classification and evaluation. J. Policy Model. 2011, 33, 523–536. [Google Scholar] [CrossRef]
- Xu, S.S. Report of the State Council on the Status of Construction of Ecological Compensation Mechanism. In Proceedings of the Second Meeting of the Standing Committee of the Twelfth National People’s Congress, Beijing, China, 23 April 2013; Communiqué of the Standing Committee of the National People’s Congress of the People’s Republic of China: Beijing, China, 2013; pp. 466–473. [Google Scholar]
- Wunder, S. Payments for Environmental Services: Some Nuts and Bolts; Center for International Forestry Research: Jawa Barat, Indonesia, 2015. [Google Scholar]
- Tacconi, L. Redefining payments for environmental services. Ecol. Econ. 2012, 73, 29–36. [Google Scholar] [CrossRef]
- Wunder, S. Revisiting the concept of payments for environmental services. Ecol. Econ. 2015, 117, 234–243. [Google Scholar] [CrossRef]
- Vatn, A. An institutional analysis of payments for environmental services. Ecol. Econ. 2010, 69, 1245–1252. [Google Scholar] [CrossRef]
- Muradian, R.; Corbera, E.; Pascual, U.; Kosoy, N.; May, P.H. Reconciling theory and practice: An alternative conceptual framework for understanding payments for environmental services. Ecol. Econ. 2010, 69, 1202–1208. [Google Scholar] [CrossRef]
- Grima, N.; Singh, S.J.; Smetschka, B.; Ringhofer, L. Payment for Ecosystem Services (PES) in Latin America: Analysing the performance of 40 case studies. Ecosyst. Serv. 2016, 17, 24–32. [Google Scholar] [CrossRef]
- Schomers, S.; Matzdorf, B. Payments for ecosystem services: A review and comparison of developing and industrialized countries. Ecosyst. Serv. 2013, 6, 16–30. [Google Scholar] [CrossRef]
- Farley, J.; Costanza, R. Payments for ecosystem services: From local to global. Ecol. Econ. 2010, 69, 2060–2068. [Google Scholar] [CrossRef]
- Rode, J.; Gómez-Baggethun, E.; Krause, T. Motivation crowding by economic incentives in conservation policy: A review of the empirical evidence. Ecol. Econ. 2015, 117, 270–282. [Google Scholar] [CrossRef]
- Sierra, R.; Russman, E. On the efficiency of environmental service payments: A forest conservation assessment in the Osa Peninsula, Costa Rica. Ecol. Econ. 2006, 59, 131–141. [Google Scholar] [CrossRef]
- Kumar, P. The Economics of Ecosystems and Biodiversity: Ecological and Economic Foundations; Routledge: Oxfordshire, UK, 2012. [Google Scholar]
- Chan, K.M.; Satterfield, T.; Goldstein, J. Rethinking ecosystem services to better address and navigate cultural values. Ecol. Econ. 2012, 74, 8–18. [Google Scholar] [CrossRef]
- Bateman, I.J.; Harwood, A.R.; Mace, G.M.; Watson, R.T.; Abson, D.J.; Andrews, B.; Binner, A.; Crowe, A.; Day, B.H.; Dugdale, S.; et al. Bringing ecosystem services into economic decision-making: Land use in the United Kingdom. Science 2013, 341, 45–50. [Google Scholar] [CrossRef] [PubMed]
- de Groot, R.; Brander, L.; der Ploeg, S.; Costanza, R.; Bernard, F.; Braat, L.; Christie, M.; Crossman, N.; Ghermandi, A.; Hein, L.; et al. Global estimates of the value of ecosystems and their services in monetary units. Ecosyst. Serv. 2012, 1, 50–61. [Google Scholar] [CrossRef]
- Clements, T.; John, A.; Nielsen, K.; An, D.; Tan, S.; Milner-Gulland, E.J. Payments for biodiversity conservation in the context of weak institutions: Comparison of three programs from Cambodia. Ecol. Econ. 2010, 69, 1283–1291. [Google Scholar] [CrossRef]
- Sattler, C.; Trampnau, S.; Schomers, S.; Meyer, C.; Matzdorf, B. Multi-classification of payments for ecosystem services: How do classification characteristics relate to overall PES success? Ecosyst. Serv. 2013, 6, 31–45. [Google Scholar] [CrossRef]
- Yu, H.; Ren, Y. Eco-compensation scheme in China: Concept, issue types and policy options. China Soft Sci. 2008, 6, 7–15. [Google Scholar]
- Liu, G.; Wan, J.; Zhang, H.; Cai, L. Eco-Compensation Policies and Mechanisms in China. Rev. Eur. Community Int. Environ. Law 2008, 17, 234–242. [Google Scholar] [CrossRef]
- Jiang, Y.; Zhang, J.; Chen, K.; Xue, X.; Michael, A.U. Moving towards a systematic marine eco-compensation mechanism in China: Policy, practice and strategy. Ocean Coast. Manag. 2019, 169, 10–19. [Google Scholar] [CrossRef]
- Zhao, C.W.; Wang, S.J. Benefits and standards of ecological compensation: International experiences and revelations for China. Geogr. Res. 2010, 29, 597–606. [Google Scholar]
- Hu, X.J.; Zhouzhai, Y.J.; Zhang, H.Y.; Hao, G.M. International progress on Payments for ecosystem services and its implications for Chinese Exo-compensation polices. Environ. Prot. 2018, 46, 6–79. [Google Scholar]
- Wang, Q.J. Exo-compensation payment condition: Type Determination and incentive and effectiveness judgement. J. China Univ. Geosci. 2018, 18, 56–69. [Google Scholar]
- Lai, M.; Chen, F. Eco-compensation standard for ecological conservation of marine protected areas based on opportunity cost method. Acta Ecol. Sin. 2020, 40, 1901–1909. [Google Scholar]
- Shang, W.; Gong, Y.; Wang, Z.; Stewardson, M.J. Eco-compensation in China: Theory, practices and suggestions for the future. J. Environ. Manag. 2018, 210, 162–170. [Google Scholar] [CrossRef]
- Hu, Y.; Huang, J.; Hou, L. Impacts of the grassland ecological compensation policy on household livestock production in China: An empirical study in Inner Mongolia. Ecol. Econ. 2019, 161, 248–256. [Google Scholar] [CrossRef]
- Li, Z.; Rao, D.; Liu, M. The Impact of China’s Grassland Ecological Compensation Policy on the Income Gap between Herder Households? A Case Study from a Typical Pilot Area. Land 2021, 10, 1405. [Google Scholar] [CrossRef]
- Lu, Y.; Kong, F.; Huang, L.; Xiong, K.; Xu, C.; Wang, B. Evaluation of the Implementation Effect of the Ecological Compensation Policy in the Poyang Lake River Basin Based on Difference-in-Difference Method. Sustainability 2021, 13, 8667. [Google Scholar] [CrossRef]
- Brock, W.A.; Durlauf, S.N.; West, K.D. Model uncertainty and policy evaluation: Some theory and empirics. J. Econom. 2007, 136, 629–664. [Google Scholar] [CrossRef]
- Feng, T.Y.; Nan, Y. Social Security Emergency Policy Evaluation and Policy Optimization in Public Crisis Governance—Based on PMC Index Model. J. Beijing Inst. Technol. 2021, 23, 75–84. [Google Scholar]
- Massey, A.K.; Eisenstein, J.; Antón, A.I.; Swire, P.P. Automated text mining for requirements analysis of policy documents. In Proceedings of the 2013 21st IEEE International Requirements Engineering Conference (RE), Rio de Janeiro, Brazil, 15–19 July 2013; pp. 4–13. [Google Scholar]
- Debnath, R.; Bardhan, R. India nudges to contain COVID-19 pandemic: A reactive public policy analysis using machine-learning based topic modelling. PLoS ONE 2020, 15, e0238972. [Google Scholar] [CrossRef] [PubMed]
- Behzadifar, M.; Gorji, H.A.; Rezapour, A.; Rezvanian, A.; Bragazzi, N.L.; Vatankhah, S. Hepatitis C virus-related policy-making in Iran: A stakeholder and social network analysis. Health Res. Policy Syst. 2019, 17, 1–11. [Google Scholar] [CrossRef] [PubMed]
- Lu, C.; Chang, J. Beijing Cultural and Creative Industry policy effect evaluation based on fuzzy comprehensive evaluation. Clust. Comput. 2015, 19, 2133–2143. [Google Scholar] [CrossRef]
- Fan, F.; Zhang, X. Transformation effect of resource-based cities based on PSM-DID model: An empirical analysis from China. Environ. Impact Assess. Rev. 2021, 91, 106648. [Google Scholar] [CrossRef]
- Mogstad, M.; Torgovitsky, A.; Walters, C.R. Policy Evaluation with Multiple Instrumental Variables (No. w27546); National Bureau of Economic Research: Cambridge, MA, USA, 2020. [Google Scholar]
- Chen, Y. A distributional synthetic control method for policy evaluation. J. Appl. Econom. 2020, 35, 505–525. [Google Scholar] [CrossRef]
- Estrada, M.R.; Yap, S.F.; Nagaraj, S. Beyond the Ceteris Paribus Assumption: Modeling Demand and Supply Assuming Omnia Mobili; Social Science Electronic Publishing: Rochester, NY, USA, 2010. [Google Scholar]
- Kuang, B.; Han, J.; Lu, X.; Zhang, X.; Fan, X. Quantitative evaluation of China’s cultivated land protection policies based on the PMC-Index model. Land Use Policy 2020, 99, 105062. [Google Scholar] [CrossRef]
- Li, Z.; Guo, X. Quantitative evaluation of China’s disaster relief policies: A PMC index model approach. Int. J. Disaster Risk Reduct. 2022, 74, 102911. [Google Scholar] [CrossRef]
- Wei, X.; Hu, Q.; Ma, J. Evaluation on the Effect of Fishery Insurance Policy: Evidence Based on Text Mining. Fishes 2021, 6, 41. [Google Scholar] [CrossRef]
- Peng, R.; Chen, Q.K.; Li, X.; Chen, K.X. Evaluating the consistency of long-term care insurance policy using PMC index model. DEStech Trans. Comput. Sci. Eng. 2020, 45, 34219. [Google Scholar] [CrossRef]
- Li, Y.; He, R.; Liu, J.; Li, C.; Xiong, J. Quantitative Evaluation of China’s Pork Industry Policy: A PMC Index Model Approach. Agriculture 2021, 11, 86. [Google Scholar] [CrossRef]
- Zhang, Y.A.; Geng, Z. The Quantitative Evaluation of Regional Science and Technology Innovation Policy: Based on the index of PMC Model. Sci. Technol. Manag. Res. 2015, 14, 26–31. [Google Scholar]
- Zhang, Y.A.; Qie, H.T. Quantitative Evaluation of the Impact of Financial Policy Combination to Enterprise Technology Innovation—Based on the PMC-Index Model. Sci. Technol. Prog. Policy 2017, 34, 113–121. [Google Scholar]
- Zhang, Y.A.; Zhou, Y.Y. Policy instrument mining and quantitative evaluation of new energy vehicles subsidies. China Popul. Resour. Environ. 2017, 10, 188–197. [Google Scholar]
- Zhang, Y.A.; Qie, H.T. Quantitative Evaluation Innovation Policies of the State Council—Based on the PMC-Index Model. Sci. Technol. Prog. Policy 2017, 34, 127–136. [Google Scholar]
- Zhang, Y.A.; Qie, H.T. The Quantitative Evaluation Research of Mass Entrepreneurship and Innovation—Based on Ten Dual Innovation Policies of 2017. J. Intell. 2018, 3, 158–164. [Google Scholar]
- Dai, S.; Zhang, W.; Zong, J.; Wang, Y.; Wang, G. How effective is the green development policy of China’s Yangtze River Economic Belt? A quantitative evaluation based on the PMC-index model. Int. J. Environ. Res. Public Health 2021, 18, 7676. [Google Scholar] [CrossRef]
- Regulations on the Handling of Official Documents by Party and Government Organs; Bulletin of the State Council of the People’s Republic of China: Beijing, China, 2013; pp. 5–10.
- Yu, J.; Yin, W.; Liu, D. Evolution of mariculture policies in China: Experience and challenge. Mar. Policy 2020, 119, 104062. [Google Scholar] [CrossRef]
- Hu, F.; Qi, X.N.; Wang, X.Y. Quantitative evaluation of robot industry policies based on PMC index model: Taking eight robot industry policies intelligence as an example. J. Intell. 2020, 39, 121–129+161. [Google Scholar]
- Dong, F.; Liu, Y. Policy evolution and effect evaluation of new-energy vehicle industry in China. Resour. Policy 2020, 67, 101655. [Google Scholar] [CrossRef]
- Kuang, B.; Lu, X.H.; Chen, D.L. Research on policy tool choices on crop rotation and fallow of cultivated land in China based on content analysis method. China Land Sci. 2018, 32, 30–36. [Google Scholar]


| Code | Policy Name | Date Issued |
|---|---|---|
| P1 | Guidance on the development of ecological compensation pilot work | 24 August 2007 |
| P2 | Opinions on the sound ecological protection compensation mechanism | 28 April 2016 |
| P3 | Guidance on accelerating the establishment of horizontal ecological protection compensation mechanisms upstream and downstream of the watershed | 20 December 2016 |
| P4 | Guidance on the establishment of a sound long-term mechanism for ecological compensation and protection of the Yangtze River Economic Belt | 13 February 2018 |
| P5 | Notice on the issuance of “the establishment of market-oriented, diversified ecological protection compensation mechanism action plan” | 28 December 2018 |
| P6 | Notice on the issuance of the “support to guide the Yellow River basin-wide pilot implementation plan for the establishment of horizontal ecological compensation mechanism” | 9 May 2019 |
| P7 | Notice on the issuance of the “support to guide the Yellow River basin-wide pilot implementation plan for the establishment of horizontal ecological compensation mechanism” | 20 April 2020 |
| P8 | Notice on the issuance of the Implementation Plan to Support the Establishment of Horizontal Ecological Protection Compensation Mechanism in the Whole Yangtze River Basin | 16 April 2021 |
| P9 | Guiding Opinions on Accelerating the Construction of Ecological Protection and Compensation Mechanism of Dongting Lake and Poyang Lake | 28 May 2021 |
| P10 | Opinions on Deepening the Reform of Ecological Protection Compensation System | 12 September 2021 |
| Serial Number | Vocabulary | Frequency | Serial Number | Vocabulary | Frequency |
|---|---|---|---|---|---|
| 1 | Ecology | 910 | 16 | Pilot | 84 |
| 2 | Compensation | 524 | 17 | Governance | 81 |
| 3 | Protection | 516 | 18 | Local | 79 |
| 4 | Mechanism | 300 | 19 | Yangtze River | 74 |
| 5 | Environment | 255 | 20 | Green | 70 |
| 6 | Basin | 235 | 21 | Transfer | 67 |
| 7 | Development | 144 | 22 | Reform | 64 |
| 8 | Money | 128 | 23 | Finance | 64 |
| 9 | Construction | 126 | 24 | Payment | 62 |
| 10 | Region | 121 | 25 | Resource | 61 |
| 11 | Country | 111 | 26 | Policy | 59 |
| 12 | Institution | 98 | 27 | System | 59 |
| 13 | Department | 95 | 28 | Ministry of Finance | 58 |
| 14 | Horizontal | 89 | 29 | Nature | 48 |
| 15 | Emphasis | 85 | 30 | Functional Zone | 48 |
| Level Indicator | The Secondary Indicators | Define |
|---|---|---|
| X1 Policy nature | X1.1 law | Whether the policy belongs to laws; if yes, it is 1, if no, it is 0. |
| X1.2 regulation | Whether the policy belongs to regulations; if yes, it is 1, if no, it is 0. | |
| X1.3 project | Whether the policy belongs to project; if yes, it is 1; if no, it is 0. | |
| X1.4 opinion | Whether the policy belongs to opinion; if yes, it is 1, and if no, it is 0. | |
| X1.5 notification | Whether the policy belongs to notification; if yes, it is 1, if no, it is 0. | |
| X1.6 decision | Whether the policy belongs to decision; if yes, it is 1; if no, it is 0. | |
| X1.7 plan | Whether the policy belongs to the plan; if yes, it is 1; if no, it is 0. | |
| X1.8 method | Whether the policy belongs to the method; yes is 1, no is 0. | |
| X2 Policy function | X2.1 Normative guidance | Whether the policy involves the function of normative guidance; if yes, it is 1, and if no, it is 0. |
| X2.2 Classified oversight | Whether the policy involves the function of classified supervision; if yes, it is 1; if no, it is 0. | |
| X2.3 Collaborative management | Whether the policy function involves the function of collaborative management; if yes, it is 1; if no, it is 0. | |
| X2.4 Overall coordination | Whether the policy function involves the function of overall coordination; if yes, it is 1; if no, it is 0. | |
| X3 Policy timeliness | X3.1 short-term | Whether the policy prescription is less than 3 years; if yes, it is 1, if no, it is 0. |
| X3.2 Medium-term | Whether the policy prescription is 3–5 years; if yes, it is 1, if no, it is 0. | |
| X3.3 Long term | Whether the policy prescription is greater than 5 years; if yes, it is 1, if no, it is 0. | |
| X4 Policy field | X4.1 Economy | Whether the policy involves the economic field; if yes, it is 1, if no, it is 0. |
| X4.2 Society | Whether the policy affects social life; if yes, it is 1, if no, it is 0. | |
| X4.3 Politics | Whether the policy involves the political field; if yes, it is 1, if no, it is 0. | |
| X4.4 Science and technology | Whether the policy involves science and technology field; if yes, it is 1, if no, it is 0. | |
| X4.5 Ecology | Whether the policy has environmental implications; if yes, it is 1, if no, it is 0. | |
| X5 Policy social benefits | X5.1 Environmental protection | Whether the policy contributes to environment protection; if yes, it is 1; if no, it is 0. |
| X5.2 Sustainability | Whether the policy contributes to sustainable development; if yes, it is 1; if no, it is 0. | |
| X5.3 Sound mechanism | Whether the policy produces has the utility of a sound mechanism; if yes, it is 1; if no, it is 0. | |
| X5.4 Win-win cooperation | Whether the policy contributes to win-win cooperation; if yes, it is 1; if no, it is 0. | |
| X6 Policy objects | X6.1 National ministries and commissions | Whether the policy object is a national ministry; if yes, it is 1, and if no, it is 0. |
| X6.2 Local government | Whether the policy object is a local government; if yes, it is 1, if no, it is 0. | |
| X6.3 Enterprise and public institution | Whether the policy object is an enterprise or a public institution; if yes, it is 1; if no, it is 0. | |
| X6.4 Other | Whether the policy object is another relative department; it is 1, if no, it is 0. | |
| X7 Policy subjects | X7.1 Ministry of finance | Whether the policy subject is the Ministry of Finance; if yes, it is 1; if no, it is 0. |
| X7.2 Ministry of Environmental Protection | Whether the policy subject is the Ministry of Environmental Protection; if yes, it is 1; if no, it is 0. | |
| X7.3 National Development and Reform Commission | Whether the policy subject is the National Development and Reform Commission; if yes, it is 1, if no, it is 0. | |
| X7.4 Ministry of Water Resources | Whether the policy subject is the Ministry of Water Resources; if yes, it is 1; if no, it is 0. | |
| X7.5 Ministry of Science and Technology | Whether the policy subject is the Ministry of Science and Technology; if yes, it is 1; if no, it is 0. | |
| X7.6 Ministry of Transport | Whether the policy subject is the Ministry of Transport; if yes, it is 1; if no, it is 0. | |
| X7.7 Forestry Bureau | Whether the policy subject is the Forestry Bureau; if yes, it is 1, and if no, it is 0. | |
| X7.8 other related departments | Whether the policy subject is other related departments; if yes, it is 1; if no, it is 0. | |
| X8 Policy incentive and restraints | X8.1 Economic incentive | Whether the policy includes measures for economic incentives; if yes, it is 1, and if no, it is 0. |
| X8.2 Tax benefits | Whether the policy includes measures for tax benefits; if yes, it is 1, and if no, it is 0. | |
| X8.3 Financial subsidy | Whether the policy includes measures for financial subsidy; if yes, it is 1, and if no, it is 0. | |
| X8.4 Convenient service | Whether the policy includes measures for convenient service; if yes, it is 1, and if no, it is 0. | |
| X8.5 Administrative penalty | Whether the policy includes measures for administrative punishment; if yes, it is 1, and if no, it is 0. | |
| X8.6 Capital investment | Whether the policy includes measures for the capital investment; if yes, it is 1, and if no, it is 0. | |
| X9 Policy guarantee | X9.1 Assessment | Whether the policy involves assessment; if yes, it is 1; if no, it is 0. |
| X9.2 Publicity and guidance | Whether the policy involves publicity and guidance; if yes, it is 1, and if no, it is 0. | |
| X9.3 Self-regulation | Whether the policy involves industry self-regulation; if yes, it is 1; if no, it is 0. | |
| X9.4 Government regulation | Whether the policy involves government regulation; if yes, it is 1, and if no, it is 0. | |
| X9.5 Law rules | Whether the policy involves legal rules; if yes, it is 1, and if no, it is 0. | |
| X9.6 Policy support | Whether the policy involves policy support; if yes, it is 1; if no, it is 0. | |
| X9.7 Social supervision | Whether the policy involves social supervision; if yes, it is 1, and if no, it is 0. | |
| X9.8 Technological innovation | Whether the policy involves technological innovation; if yes, it is 1, and if no, it is 0. | |
| X10 policy disclosure | Whether the policy is open and transparent; if yes, it is 0, if no, it is 1. |
| X1 | X2 |
| X1.1, X1.2, X1.3, X1.4, X1.5, X1.6, X1.7, X1.8 | X2.1, X2.2, X2.3, X2.4 |
| X3 | X4 |
| X3.1, X3.2, X.3.3 | X4.1, X4.2, X4.3, X4.4, X4.5 |
| X5 | X6 |
| X5.1, X5.2, X5.3, X5.4 | X6.1, X6.2, X6.3, X6.4 |
| X7 | X8 |
| X7.1, X7.2, X7.3, X7.4, X7.5, X7.6, X7.7, X7.8 | X8.1, X8.2, X8.3, X8.4, X8.5, X8.6 |
| X9 | X10 |
| X9.1, X9.2, X9.3, X9.4, X9.5, X9.6, X9.7, X9.8 | X10 |
| PMC Index | 0~3.968 | 3.969~5.548 | 5.549~7.127 | 7.128~7.920 |
|---|---|---|---|---|
| Evaluation | Low consistency | Acceptable consistency | Good consistency | Perfect consistency |
| X1 | X2 | X3 | ||||||||||||
|---|---|---|---|---|---|---|---|---|---|---|---|---|---|---|
| X1.1 | X1.2 | X1.3 | X1.4 | X1.5 | X2.1 | X2.2 | X2.3 | X2.4 | X3.1 | X3.2 | X3.3 | |||
| P1 | 0 | 0 | 0 | 1 | 0 | … | 1 | 0 | 0 | 1 | 0 | 0 | 1 | |
| P2 | 0 | 0 | 0 | 1 | 0 | 1 | 1 | 0 | 0 | 0 | 0 | 1 | ||
| P3 | 0 | 0 | 0 | 1 | 0 | 1 | 0 | 1 | 0 | 0 | 0 | 1 | ||
| … | … | |||||||||||||
| P9 | 0 | 0 | 0 | 1 | 0 | 1 | 0 | 1 | 1 | 0 | 0 | 0 | ||
| P10 | 0 | 0 | 0 | 1 | 0 | 0 | 1 | 0 | 1 | 0 | 0 | 0 | ||
| … | … | |||||||||||||
| X8 | X9 | |||||||||||||
| P1 | 0 | 0 | 0 | 0 | … | 1 | 0 | 1 | 0 | 1 | 1 | 1 | … | 0 |
| P2 | 1 | 0 | 0 | 0 | 1 | 1 | 1 | 0 | 1 | 1 | 1 | 1 | ||
| P3 | 0 | 0 | 1 | 0 | 0 | 1 | 1 | 0 | 1 | 0 | 0 | 0 | ||
| P9 | 0 | 0 | 0 | 0 | 0 | 1 | 1 | 0 | 1 | 0 | 1 | 1 | ||
| P10 | 0 | 0 | 1 | 0 | 0 | 1 | 0 | 0 | 1 | 1 | 1 | 0 | ||
| X1 | X2 | X3 | X4 | X5 | X6 | X7 | X8 | X9 | X10 | PMC Index | Type | Rank | |
|---|---|---|---|---|---|---|---|---|---|---|---|---|---|
| P1 | 0.25 | 1.00 | 0.33 | 0.80 | 1.00 | 0.25 | 0.13 | 0.67 | 0.63 | 1.00 | 6.06 | Good | 3 |
| P2 | 0.25 | 1.00 | 0.33 | 0.80 | 0.50 | 0.75 | 0.13 | 0.67 | 0.88 | 1.00 | 6.31 | Good | 1 |
| P3 | 0.25 | 0.75 | 0.33 | 0.20 | 0.75 | 0.25 | 0.50 | 0.33 | 0.63 | 1.00 | 4.99 | Acceptable | 7 |
| P4 | 0.25 | 0.75 | 0.33 | 0.60 | 1.00 | 0.25 | 0.13 | 0.67 | 0.50 | 1.00 | 5.48 | Acceptable | 6 |
| P5 | 0.38 | 0.75 | 0.33 | 0.60 | 0.75 | 0.50 | 0.38 | 0.50 | 0.75 | 1.00 | 5.94 | Good | 4 |
| P6 | 0.38 | 0.50 | 0.33 | 0.20 | 0.50 | 0.25 | 0.13 | 0.67 | 0.25 | 1.00 | 4.21 | Acceptable | 10 |
| P7 | 0.25 | 1.00 | 0.33 | 0.60 | 1.00 | 0.25 | 0.50 | 0.67 | 0.50 | 1.00 | 6.10 | Good | 2 |
| P8 | 0.25 | 0.75 | 0.33 | 0.20 | 0.75 | 0.25 | 0.38 | 0.67 | 0.38 | 1.00 | 4.96 | Acceptable | 8 |
| P9 | 0.25 | 1.00 | 0.33 | 0.80 | 1.00 | 0.25 | 0.13 | 0.33 | 0.75 | 1.00 | 5.84 | Good | 5 |
| P10 | 0.25 | 0.50 | 0.33 | 0.80 | 0.75 | 0.25 | 0.13 | 0.33 | 0.50 | 1.00 | 4.84 | Acceptable | 9 |
| Total | 2.76 | 8.00 | 3.30 | 5.60 | 8.00 | 3.25 | 2.54 | 5.51 | 5.77 | 10.00 | 54.73 | - | - |
| Average | 0.28 | 0.80 | 0.33 | 0.56 | 0.80 | 0.33 | 0.25 | 0.55 | 0.58 | 1.00 | 5.47 | - | - |
Publisher’s Note: MDPI stays neutral with regard to jurisdictional claims in published maps and institutional affiliations. |
© 2022 by the authors. Licensee MDPI, Basel, Switzerland. This article is an open access article distributed under the terms and conditions of the Creative Commons Attribution (CC BY) license (https://creativecommons.org/licenses/by/4.0/).
Share and Cite
Dai, S.; Zhang, W.; Lan, L. Quantitative Evaluation of China’s Ecological Protection Compensation Policy Based on PMC Index Model. Int. J. Environ. Res. Public Health 2022, 19, 10227. https://doi.org/10.3390/ijerph191610227
Dai S, Zhang W, Lan L. Quantitative Evaluation of China’s Ecological Protection Compensation Policy Based on PMC Index Model. International Journal of Environmental Research and Public Health. 2022; 19(16):10227. https://doi.org/10.3390/ijerph191610227
Chicago/Turabian StyleDai, Shengli, Weimin Zhang, and Linshan Lan. 2022. "Quantitative Evaluation of China’s Ecological Protection Compensation Policy Based on PMC Index Model" International Journal of Environmental Research and Public Health 19, no. 16: 10227. https://doi.org/10.3390/ijerph191610227
APA StyleDai, S., Zhang, W., & Lan, L. (2022). Quantitative Evaluation of China’s Ecological Protection Compensation Policy Based on PMC Index Model. International Journal of Environmental Research and Public Health, 19(16), 10227. https://doi.org/10.3390/ijerph191610227