1. Introduction
Over the last few years, the world has seen a rapid increase in global temperature [
1,
2,
3]. Carbon dioxide (CO
2) emissions make up the largest share of greenhouse gasses (GHG). The concentration of CO
2 emissions has increased by 146% in the last few years [
4,
5,
6]. Along with CO
2 emissions, there are other polluting factors which are creating environmental problems. In this context, the authors of [
7] presented the term EF as an accumulative environmental factor that considers water, air, and soil pollution. EF considers the human pressures on the environment according to six parameters regarding grazing land, cropland, fishing, and carbon grounds. Ever since the 1970s, EF has been increasing according to the biocapacity of the world, which is now creating drastic climatic problems, especially in developing nations. This index calculates the human necessity for environmental resources through the use of ecosystem services rooted in the earth. Explicitly, this index is identified as a physical index rather than a financial quantity because it measures the use of naturally beneficial land to meet human demands and to deal with human-generated waste. According to the measurement from
www.footprintnetwork.org, this index is quantified in units of global hectares area (gha). Therefore, this index measures the usage of environmental services through human activities such as construction, agriculture, raising livestock, and fishing.
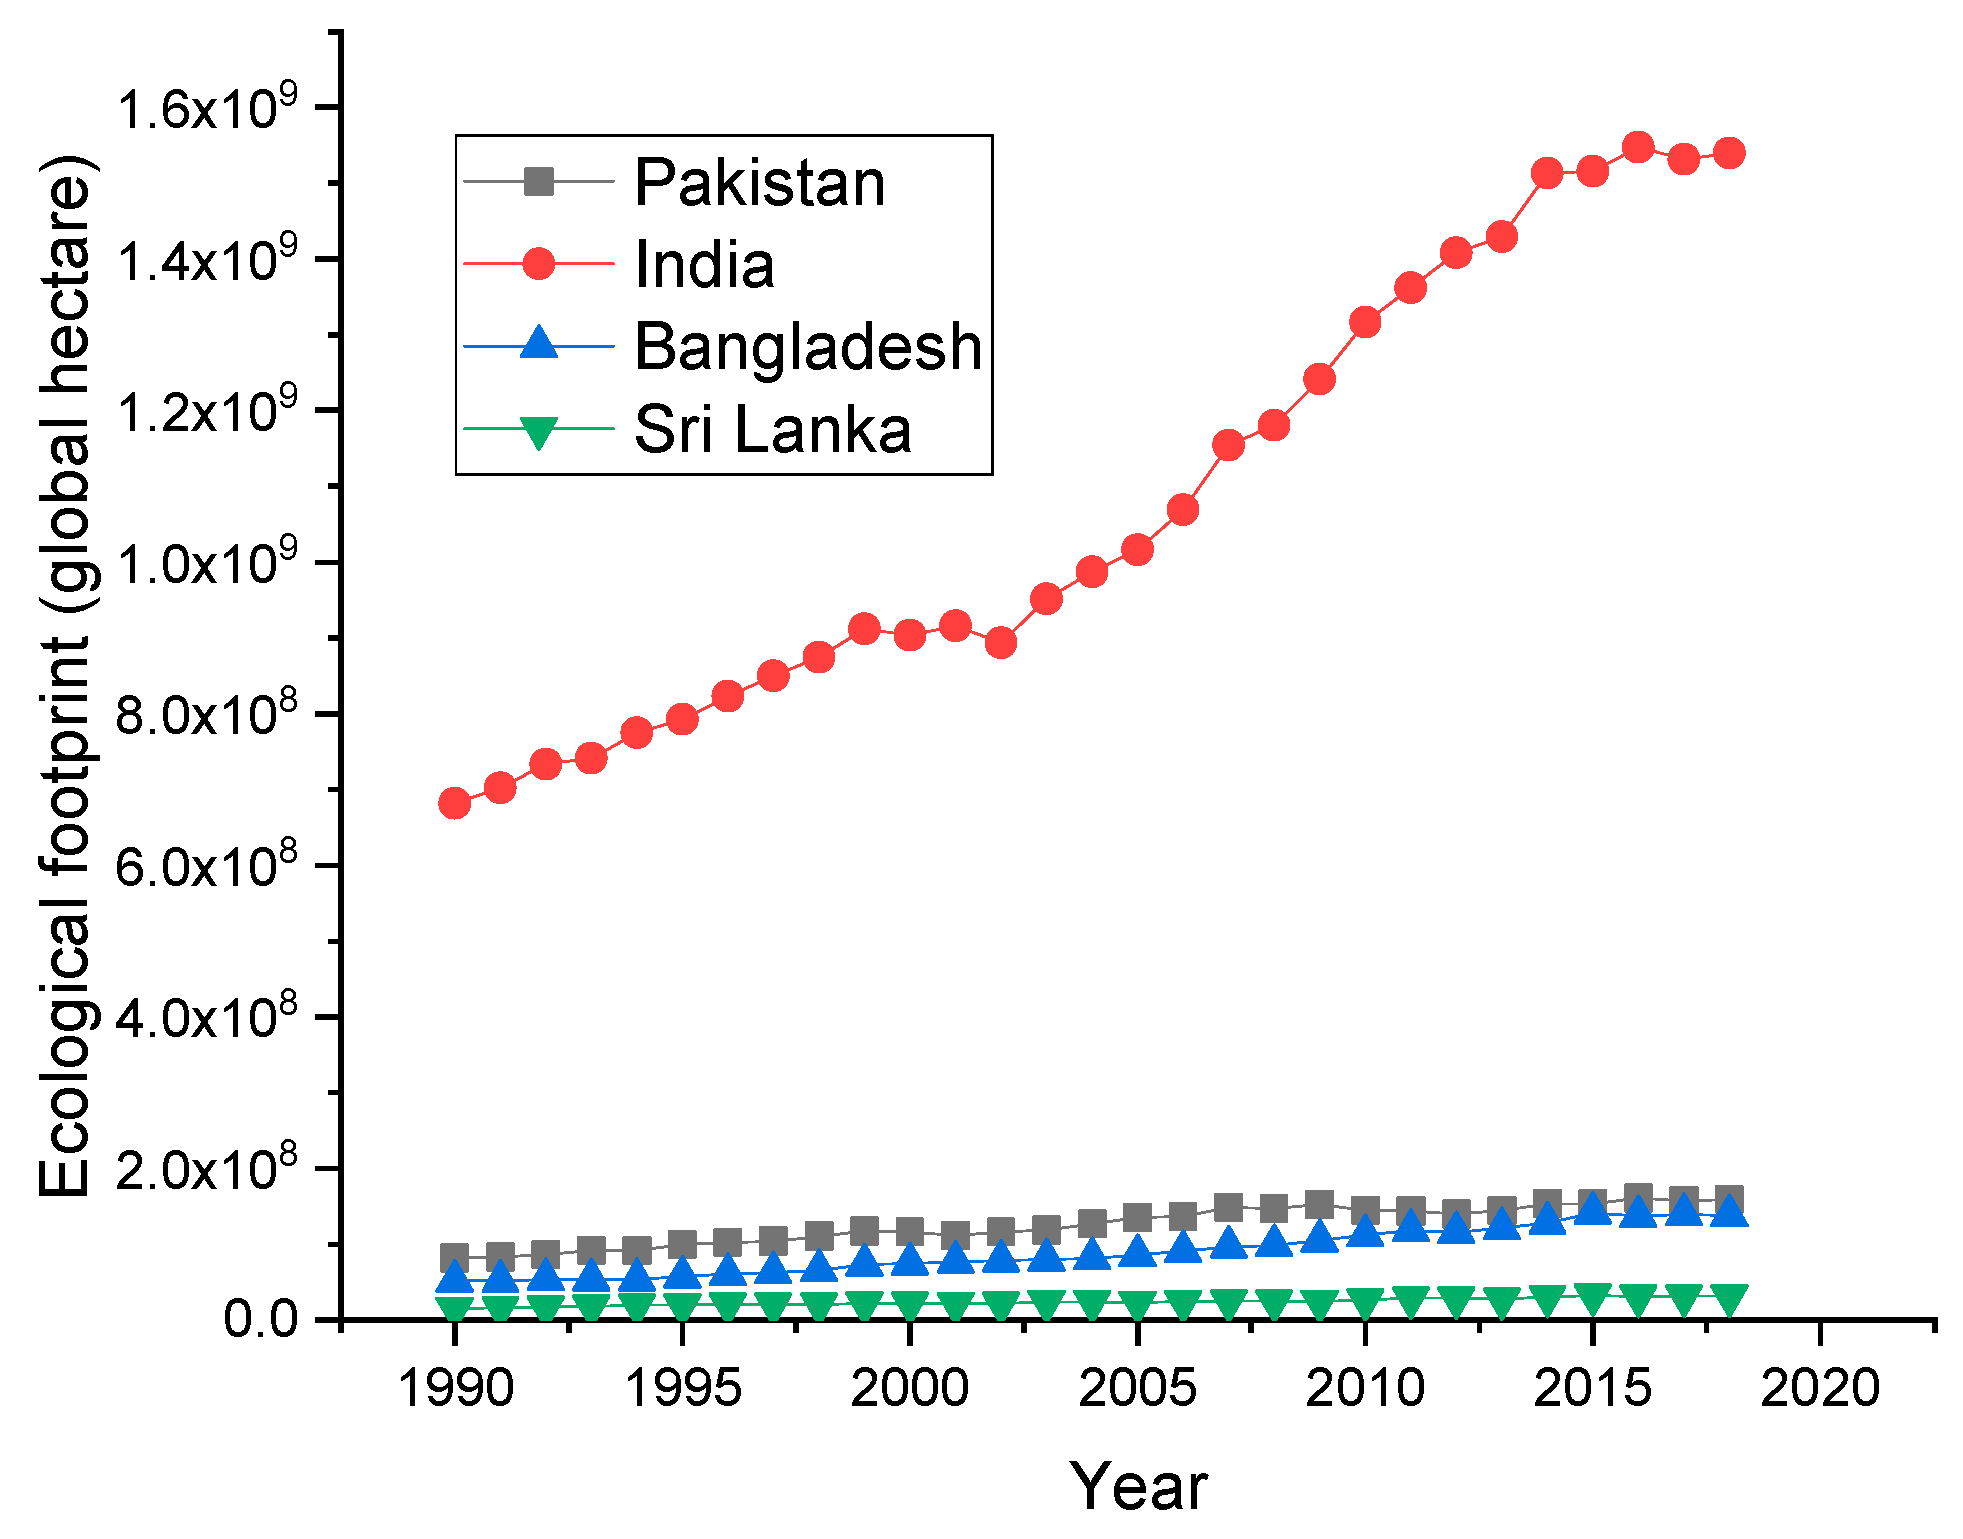
Figure 1 shows the trend of EF in selected South Asian nations. Sri Lanka’s EF is comparatively lower than the other countries. The reason may be that Sri Lanka is depending upon more imports than exports. The lower level of exports may be due to the lower production of domestic products. The other countries are exporting their domestic goods rapidly. Therefore, they have huge industries, and their ecological footprints are comparatively high.
Today, the world is trying to achieve green growth, which means fulfilling the needs of the nations without hurting the ecosystem [
8]. According to the Brundtland report in 1987, increasing population, energy use, and excessive use of natural resources in agricultural and industrial production are the main hurdles in the way of sustainable development [
9].
AG is considered an important tool to achieve sustainable development [
10]. The world has acknowledged the role of AG to eradicate poverty. Therefore, it is important to produce sustainable food with an efficient supply of nutritional products. In this context, an efficient transformation of the agricultural system, which considers environmental protection, is required today.
Agricultural activities support economies by providing food and jobs to people. Agricultural activities, such as forestry and fishing, play a significant role in wealth creation, especially in developing countries [
11,
12]. However, these activities increase water consumption and carbon footprints. Due to the food production of maize, wheat, rice, and livestock, carbon footprints have increased over the past few decades [
13,
14,
15]. Agricultural production using traditional technologies is causing environmental problems, which are becoming hurdles in the way of sustainable development goals [
13,
16]. Therefore, it is important to reduce carbon emissions, which are emitted from agricultural outputs. AG is the third contributing factor to environmental pollution, after energy and industry [
17]. Activities such as crop and soil burning and the usage of fossil fuels are contaminating the environment [
18].
During the COVID-19 pandemic, the energy requirements were significantly reduced, and the world’s economies saw environmental improvements. According to the research of [
19], the COVID-19 situation reduced the pace of economic growth and reduced fossil fuel consumption. This situation further improves environmental quality. The scholars recommended the use of RE as an effective tool to mitigate environmental pollution. Therefore, fossil fuels are contaminating the climate, and RE provides the advantage to the farmers to compensate for the economic and climatic losses [
18,
20]. RE can be used for different purposes, such as heating, cooling, and irrigation systems [
21]. Today, developed and developing nations are experiencing rapid population growth. Due to better health and employment opportunities, people are moving toward urban areas. Urban areas require huge infrastructural settlements, which consume more natural resources. If these settlements are created without planning and the energy is consumed without regard to renewable resources, the environmental quality will degrade significantly. Therefore, rapid population growth is becoming a hurdle in the way of sustainable development [
22]. To achieve the 17 sustainable development goals (SDGs), it is important to deal with environmental problems.
This is the era of globalization, and nations are exchanging goods across borders to feed their populations [
23]. Therefore, globalization has increased industrial production in almost every country. If the production is from non-RE sources, it increases the CO
2 emissions and causes environmental pollution. If the energy resources are altered as a result of foreign direct investment, it can improve air quality by using RE resources [
24,
25].
Due to the detrimental role of fossil fuels in the environment, the world is moving towards RE resources [
17]. RE can provide clean energy in all economic sectors. It provides more jobs without impacting the environmental quality. RE reduces the imports of fossil fuels and is available domestically in abundance. It is expected that RE production will surpass coal for electricity generation by 2025 [
26]. Developing countries are also trying to increase the share of RE in the total energy mix.
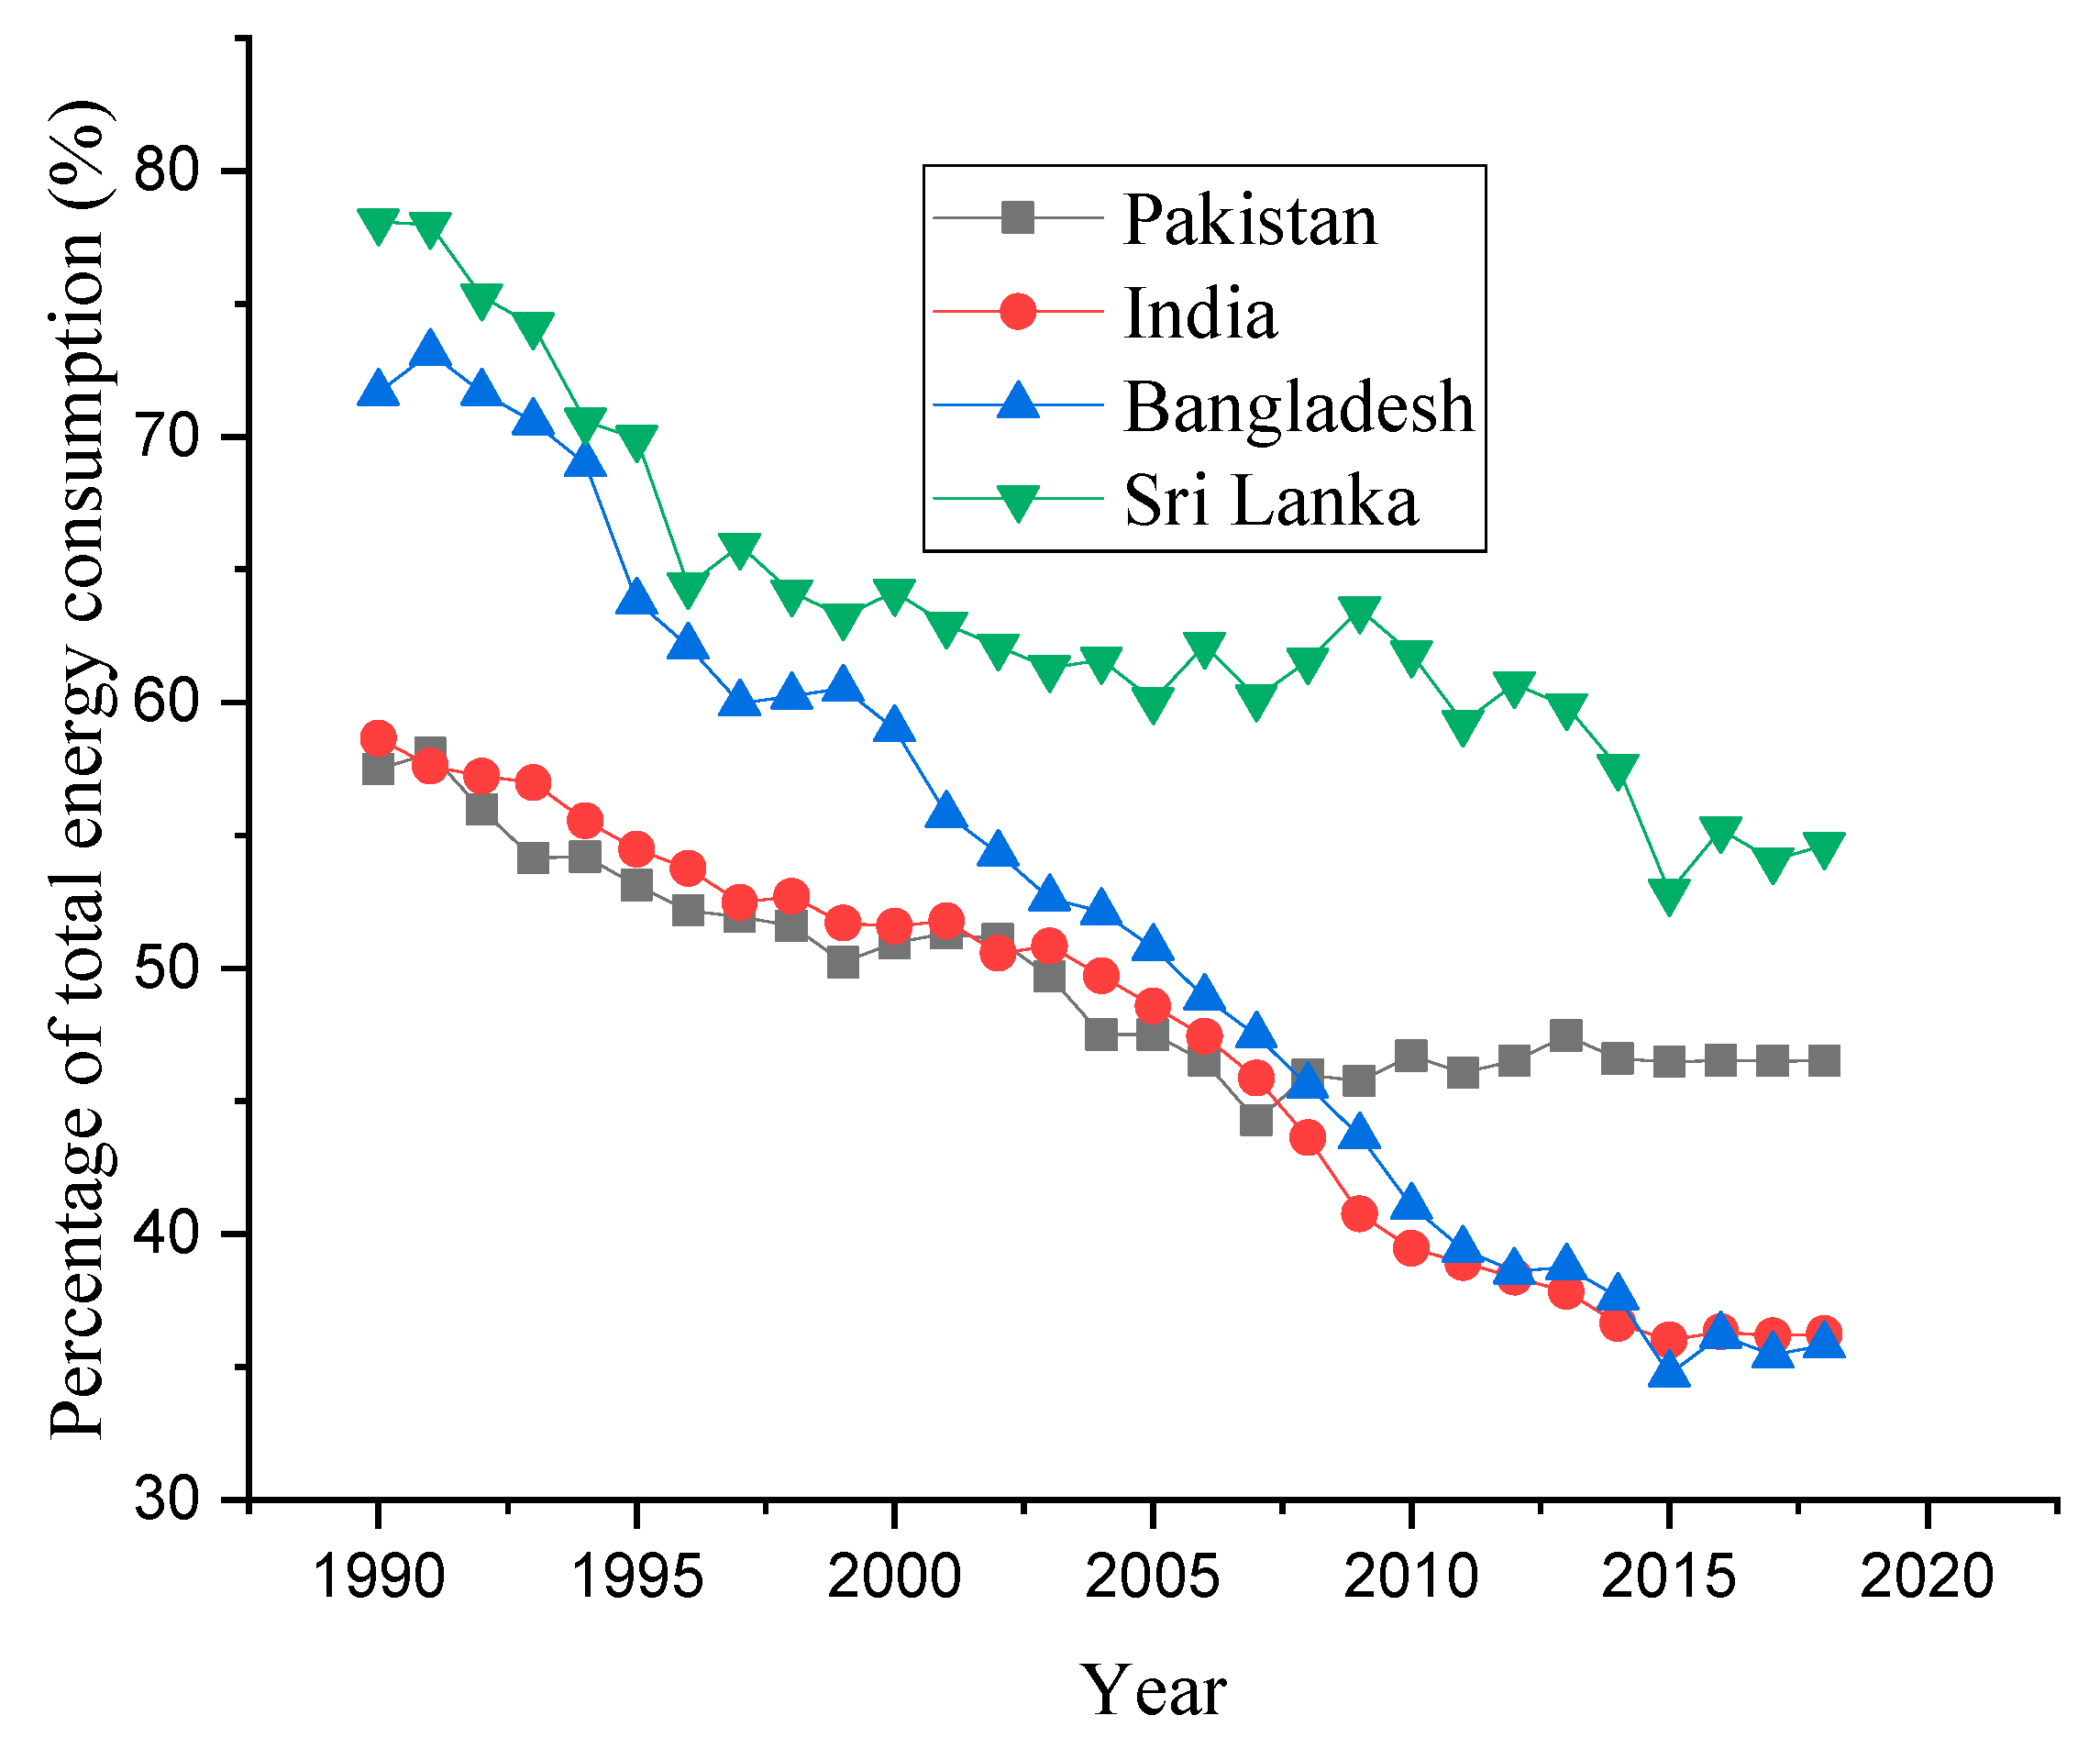
Figure 2 shows the trend of RE use in developing nations over the estimated period. The RE trend has been continuously decreasing, although currently, these countries are employing efficient technologies for RE production. This study has taken RE as a percentage of total energy consumption. With time, the energy demand has been rising, and these countries continue to focus on non-renewable energy consumption and neglect RE production. Therefore, the ratio of RE as a percentage of total energy is decreasing over time.
This work tries to answer the following questions (1) How does renewable energy impact environmental quality? (2) Is globalization helpful in mitigating the ecological footprints and CO2 emissions in South Asian nations? (3) What is the role of agriculture in environmental quality? Hence, this work contributes to the literature on South Asian nations by investigating the impacts of RE use, globalization, and agricultural value-added on CO2 emissions and EF in selected South Asian countries.
This work is organized as follows: the background studies are discussed in
Section 2.
Section 3 presents the methods used and the data description. The results and a discussion are in sound in
Section 4, and
Section 5 presents the conclusion.
3. Data and Methodology
This research aims to probe the linkages of RE, globalization, AG, and climate. This work takes the selected countries’ annual time series data from 1990 to 2018 for panel study. Therefore, this study has used balanced panel data of selected South Asian nations for panel estimations.
Table 1 shows the data description and their sources. Data for RE, CO
2 emissions, AG, and GL have been obtained from world data indicators and the KOF Economic Institute, and ecological footprint data has been obtained from the Global Footprint Network. This work follows the work of [
15,
43,
59] to estimate two linear equations for RE, globalization, AG, and environmental pollution.
Table 2 shows the descriptive statistics of the study. It can be noted that EF has the maximum value in global hectares, and CO
2 has the minimum value of 0.13 per capita. CO
2 has a mean value of 0.72, and GL has a mean value of 49.14.
Environmental pollution indices receive different impacts from different economic variables. Therefore, two indices for environmental pollution are used in this study. Where CO2 is carbon emissions, RE, GL, and AG represent RE, globalization, and AG, respectively; t is the time, i is the cross-section, is the long run coefficient value, and is the error term. Globalization shows the economic, political, and social dimensions in one index, therefore omitting the problem of biased results of this equation.
Most of the past studies have taken CO
2 emissions as the proxy for environmental pollution [
60], but CO
2 emissions do not represent soil and water pollution. Therefore, EF provides us with a comprehensive index of environmental pollution [
61]. Therefore, for accurate sustainable policy instruments, this study uses EF and CO
2 emissions as indicators of environmental pollution.
RE is considered environmentally friendly, which reduces the usage of fossil fuels. Therefore, its coefficient values are expected to be negative. Globalization consists of three indices of political, economic, and social globalization [
58]. Globalization increases energy consumption with enhanced economic activity. Therefore, it can degrade the environment. At the same time, globalization can bring efficient technologies, which can improve air quality [
62].
Apart from the mixed results regarding the impacts of AG on the environment, AG can pollute the environment with its waste [
16]. Therefore, its coefficient value is expected to be positive.
Methodology
Before the application of the long-run evaluation, cross-section dependence is checked in the panel data. In this regard, this research performs the Lagrange multiplier (LM) test used by Breusch and Pagan (1980) and the CD test used by Pesaran and M.H. (2004), and the mathematical form of the CD test is as follows:
where
T is the period and
N represents cross-sections.
represents the pairwise linkages of errors between
i and
j. This work uses FMOLS and DOLS methods to determine the long-run values. These methods are efficient in providing the coefficient values. FMOLS is a parametric and DOLS is a non-parametric technique, which can deal with the problems of endogeneity and serial correlation in the panel data.
4. Results and Discussion
Before the empirical analysis, it is compulsory to know the order of integration of the data. The data can be integrated at the level of first difference. Upon the validation of the unit root, the next step can be identified for co-integration. Therefore, this work examines the stationarity property of the variables. For this purpose, first generation unit root tests, as used by [
63,
64], and second generation unit root test of CIPS and CADF are applied. These tests are widely applied and present reliable results. According to
Table 3, almost all variables are stationary at the level and first difference.
For a robustness check, this work applies the second-generation unit root tests, and the findings are in
Table 4. It is shown that some variables also show a mixed order of integration. This means that RE, CO
2 emissions, and globalization are stationary at the level and first difference. After determining the order of integration, this study further estimates the cross-sectional dependence (CD) in the panel data. Panel data may have cross sectional dependence due to similar economic policies. If the CD exists in the panel data, then we can use a co-integration test that can consider the CD in the panel data while providing robust findings.
This work performs two LM and CD tests to discover the presence of cross-sectional dependence.
Table 5 shows that all variables have cross-sectional dependence at the 1% level. This dependence may be due to similar political and economic policies. After the CD test in the panel data, this work moves forward to discover the co-integration level among the variables. If the co-integration is confirmed, then we can proceed further to find out the long- and short-run coefficient values.
For this purpose, this study performs a co-integration test similar to the one used in [
65]. This test is useful for panel co-integration because it considers the cross-sectional dependence among the panel data. According to
Table 6, there exists a strong long-run association among the estimated equation.
After confirming the long-run linkages among the variables, the subsequent method is to highlight the short- and long-run associations. Therefore, this work applied two tests of FMOLS and DOLS. FMOLS is a Fourier method and can deal with the delinquent of serial correlation in the panel data. DOLS is an alternative variational method that can also give robust results for the panel data. The findings of these tests are presented below. This research estimates two equations in which two dependent variables, CO
2 emissions and EF, have been used.
Table 7 shows the results when CO
2 emissions are taken as the dependent variable. RE is negatively associated with CO
2 emissions at a 1% level. This means that a 1% increase in RE will lower CO
2 emissions by 10.55% in South Asian countries. RE is mostly generated from solar and hydro powers, which are considered environmentally friendly. Therefore, RE decreases CO
2 emissions in the long run. This finding is in line with the results of [
2,
36].
The study found that RE is suitable to mitigate climatic pollution. Moreover, it is also compatible with economic growth. RE mostly comes from wind, solar, and hydropower. These sources do not contaminate the environmental quality. Globalization is contaminating the air quality by increasing CO
2 emissions by 6.01%. This is because globalization boosts economic activities, which also increases energy consumption. South Asian countries are developing countries, and they rely mainly on fossil fuels for energy utilization. This result also shows that these countries have not succeeded in importing efficient energy resources from developed countries. These efficient resources can be used in the energy sector to replace the traditional means of generating energy. This finding is not similar to the results of [
66]. They found that globalization is environmentally friendly because it attracts efficient machinery from developed nations. This outcome shows that these countries need to focus on the importing of efficient means of RE production.
It is worth noting that AG is also a contributing factor to environmental degradation, but this impact is insignificant. This means that agricultural activities are not sustainable in South Asian countries. In South Asian countries, farmers are not well equipped with environmental awareness, and they use traditional means of irrigation. This finding is similar to the results of [
17]. They also found that AG is degrading the climate in BRIC nations. Agricultural activities are consuming fossil energy and contributing to environmental degradation.
Table 8 shows the impacts of RE, globalization, and AG on EF in South Asian countries. It can be noted that RE is lowering EF in South Asian countries significantly. RE does not consume biocapacity to provide energy requirements. Globalization is increasing EF; this means that globalization is causing reduced biocapacity because it increases economic activities. These findings are in line with the findings of [
48]. Developing countries are still not able to benefit from globalization. Globalization also imports efficient energy technologies, but these countries are lagging behind in this regard. AG is not sustainable in South Asian countries because it is increasing EF in the long run.
Apart from the analysis of FMOLS and DOLS, this work performs analyses using the augmented mean group (AMG) and common corelated effects mean group (CCEMG). These tests are effective in dealing with the problems of CD and heterogeneity in the panel data. The findings are shown in
Table 9 and
Table 10.
The results show that RE is negatively associated with CO2 emissions and EF. Globalization and agricultural activities are contaminating the environment by increasing CO2 emissions and ecological footprints in South Asian nations. These results validate the results of FMOLS and DOLS tests and indicate the authenticity of the results as effective policy instruments.
5. Conclusions and Recommendations
This work investigates the impacts of RE, globalization, and agriculture on EF and CO2 emissions. For quantitative analysis, this study took annual data from 1990 to 2018 for four South Asian countries. These countries are developing countries and rely mainly on AG. These nations are also facing economic transitions due to globalization. For analysis, this work applies first-generation and second-generation unit root tests. Most of the variables were found to have a mixed order of integration. The presence of cross-sectional dependence among the variables further guides us to perform the Westerlund co-integration test for long-run association. After confirming the long-run associations, this work moves forward to conduct FMOLS and DOLS tests to find the long run coefficient values.
The increasing level of CO2 emissions and EF is creating environmental problems, which are having detrimental effects on human health. Therefore, it has become important to explore the determining factors of environmental degradation. RE, globalization, and AG are considered important factors that affect the sustainable development of any economy. RE is produced mostly from solar, hydro, and wind sources. These sources provide clean energy, which does not produce environmental pollution.
The AG sector plays a fundamental role in increasing economic growth. The AG sector also consumes energy, and developing countries are lagging behind in providing RE to the AG sector.
Globalization has become an important tool to boost economic activity. It enhances import and export across borders. Globalization increases production in industries, which requires more energy. If the energy comes from fossil fuels, it can also contaminate the environmental quality.
In this context, the findings of this work support the theoretical implications in developing countries. RE is improving air quality by reducing CO2 emissions and EF. AG and globalization are creating environmental problems by increasing CO2 emissions and EF.
The findings show that RE consumption is lowering CO2 emissions and EF in the long run. Globalization is increasing CO2 emissions and EF in South Asian countries. Value-added agriculture is also a contributing factor toward environmental degradation, but this link is insignificant.
This study presents some important policy implications for South Asian countries. RE has been proven to be an important alternative for energy consumption. This type of energy does not contaminate air quality. South Asian countries are located such that they receive huge amounts of solar energy. Therefore, these countries need to exploit solar energy to its full capacity. Moreover, these countries need to explore more RE resources to reduce their dependence on non-RE sources.
These countries can make their agricultural sectors sustainable by following efficient farming practices. Environmental awareness should be enhanced among the farmers. Farmers can use animal fertilizers and clean inputs in AG to achieve sustainable agricultural products. Moreover, the inequality for renewable energy use should be eliminated by providing maximum opportunities to the agricultural sectors in these countries. Today, globalization is providing efficient opportunities to nations to import efficient technologies. Therefore, the policymakers must consider their policy instruments regarding external relations. Attention should be given to attracting sustainable technologies for clean energy consumption.
Apart from the contribution of this work, it also has some limitations. This research includes selected South Asian countries because of the availability of data from these areas. Future research should include other developing countries for country-specific analysis. Moreover, future research should be conducted to investigate the impacts of subindices of globalization on EF in developing countries. Moreover, these variables should be used in other blocks of countries to obtain comprehensive results. Another limitation of this study is that the model did not incorporate all the determinants of ecological footprints. Thus, future research should incorporate these determinants.


 ,
, 
