
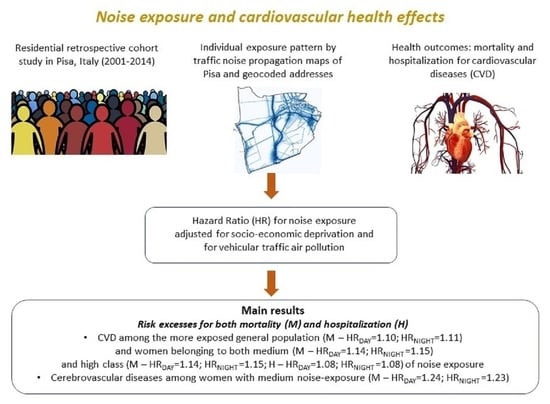
Risk Associations between Vehicular Traffic Noise Exposure and Cardiovascular Diseases: A Residential Retrospective Cohort Study

 ,
,  ,
,  ,
,  ,
,  ,
,  and
and
Abstract
:
1. Introduction
2. Materials and Methods
2.1. Study Design
2.1.1. The Cohort Study
2.1.2. Definition of the Cohort and the Follow-Up Period
2.2. Exposure Assessment
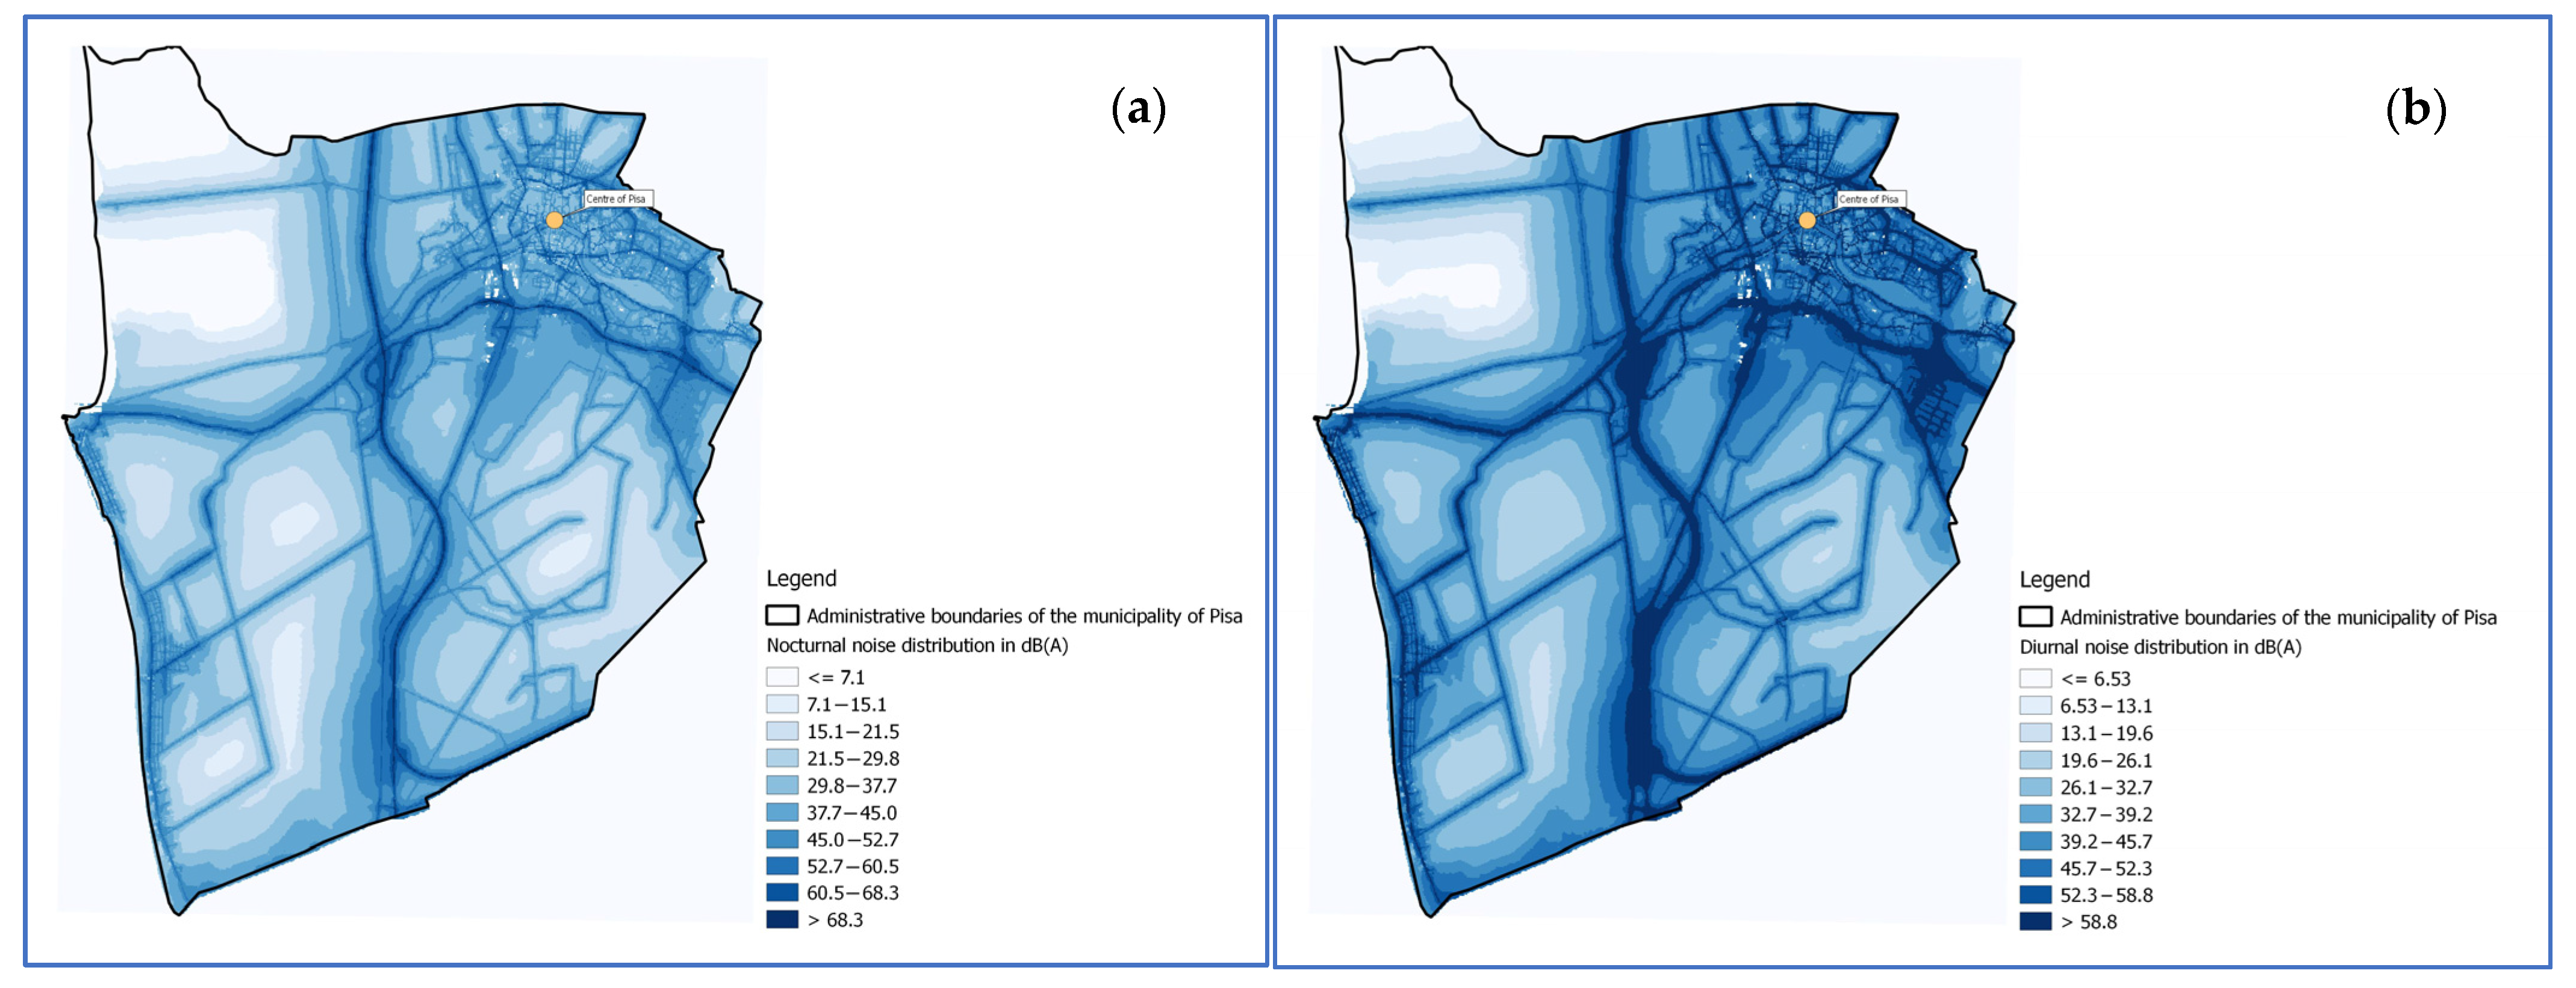
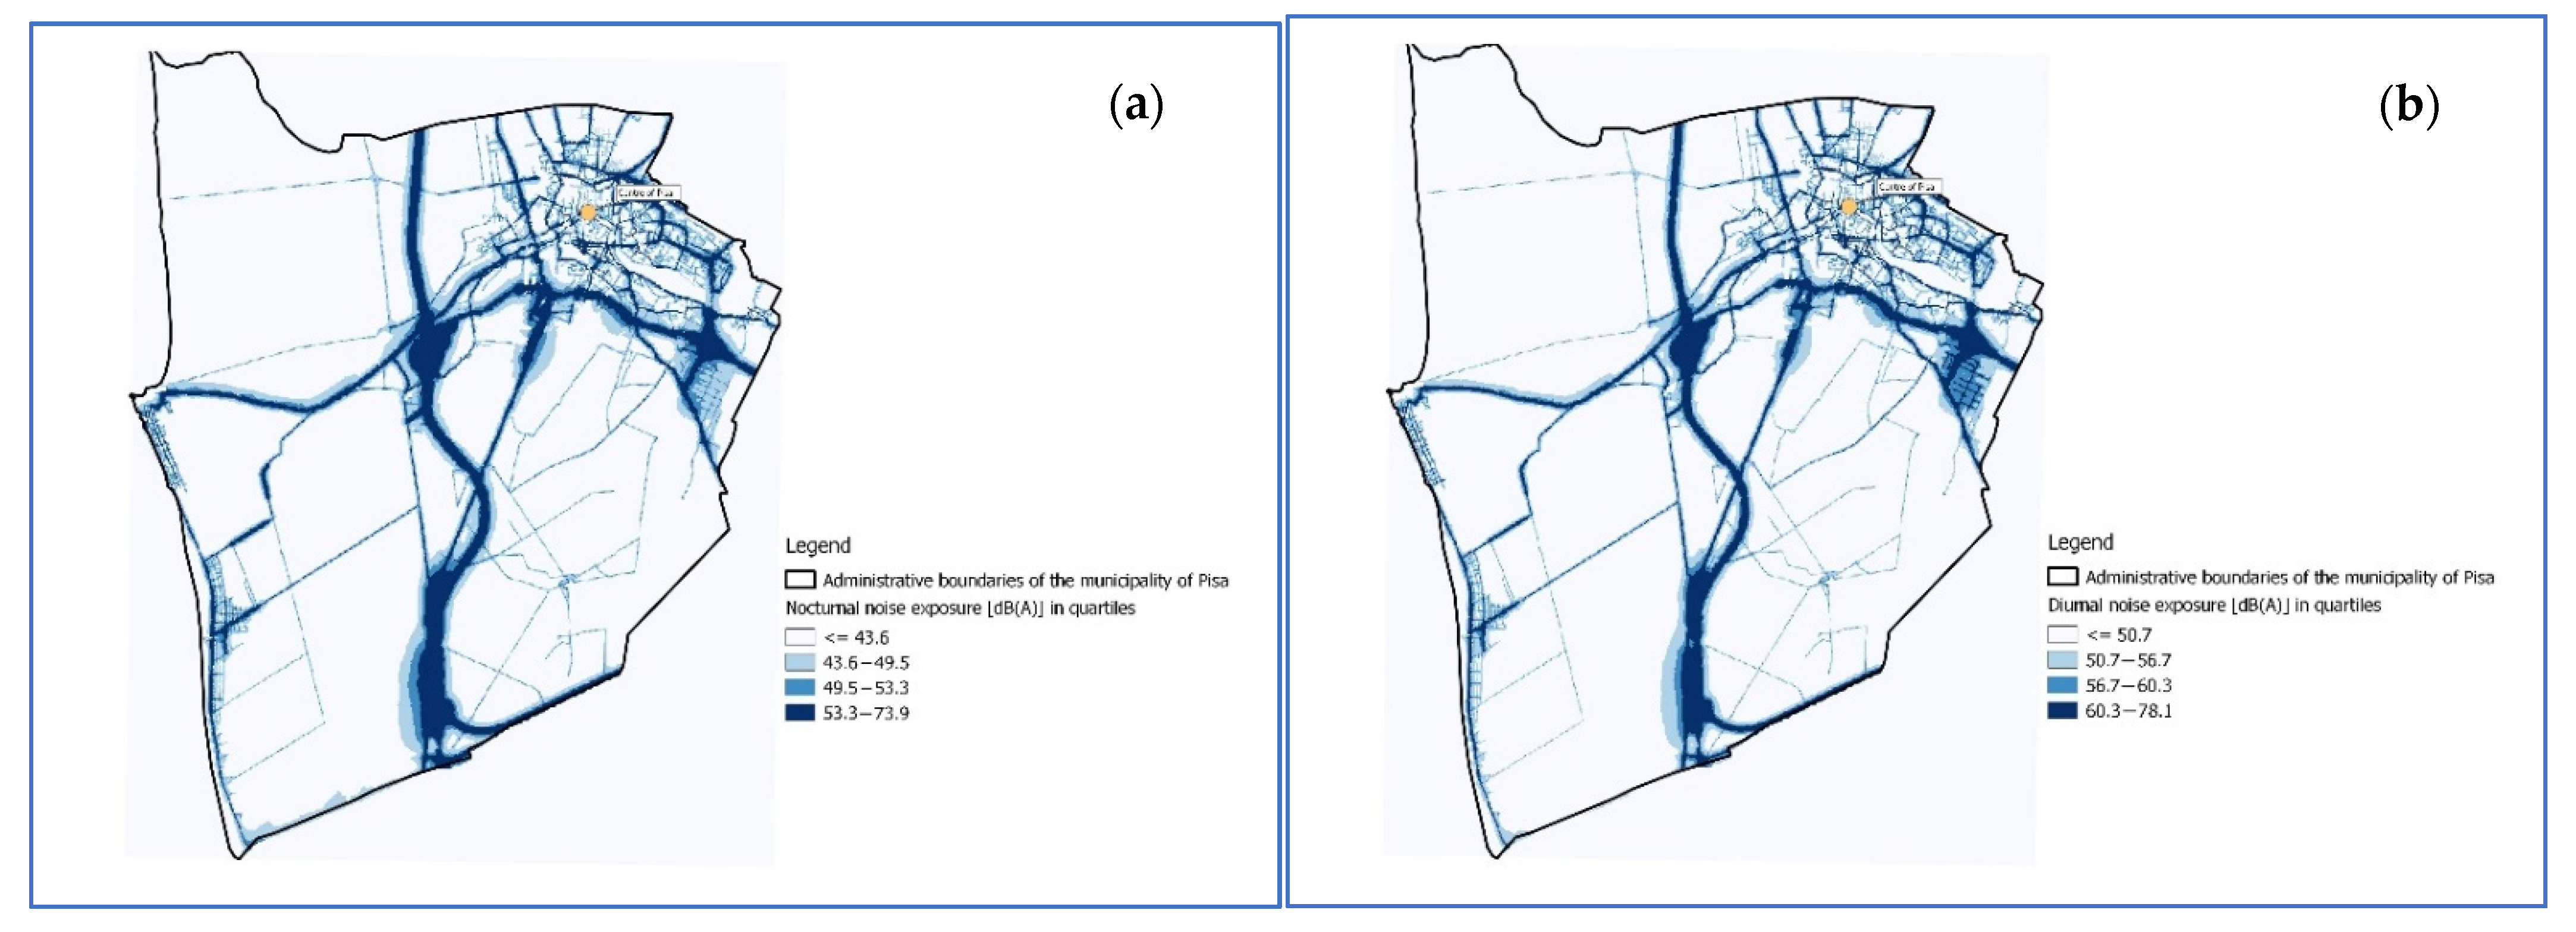
2.2.1. Exposure to Noise
- Class 1 (reference): nighttime <43.7 dB (A); daytime; <50.7 dB (A);
- Class 2: nighttime 43.7–49.5 dB (A); daytime 50.7–56.7 dB (A);
- Class 3: nighttime 49.5–53.3 dB (A); daytime 56.7–60.3 dB (A);
- Class 4: nighttime 53.3–73.9 dB (A); daytime 60.3–78.1 dB (A).
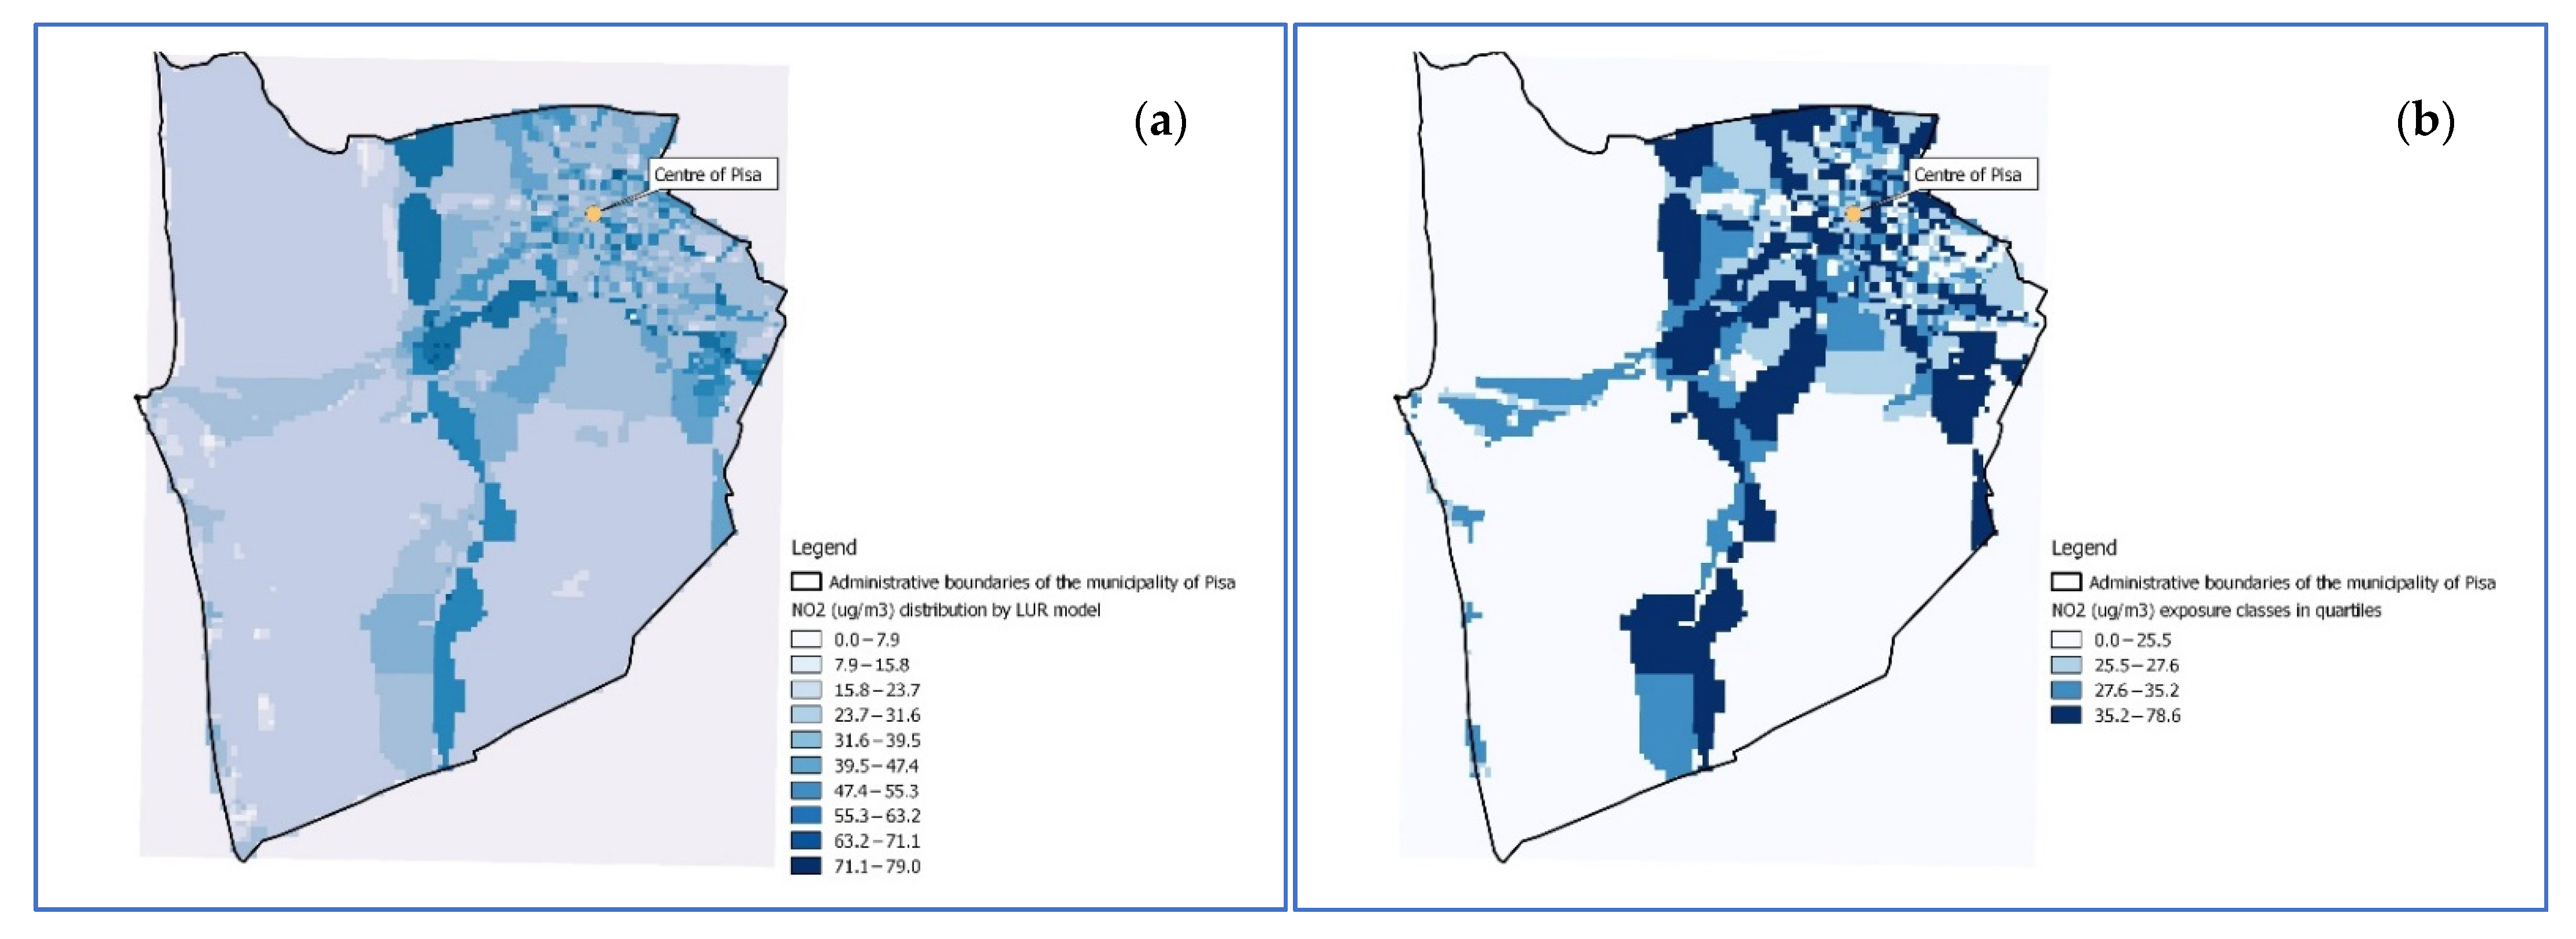
2.2.2. Exposure to Vehicular Traffic Air Pollution
- Class 1 (reference): <25.5 µg/m3;
- Class 2: 25.5–27.6 µg/m3;
- Class 3: 27.6–35.2 µg/m3;
- Class 4: 35.2–78.6 µg/m3.
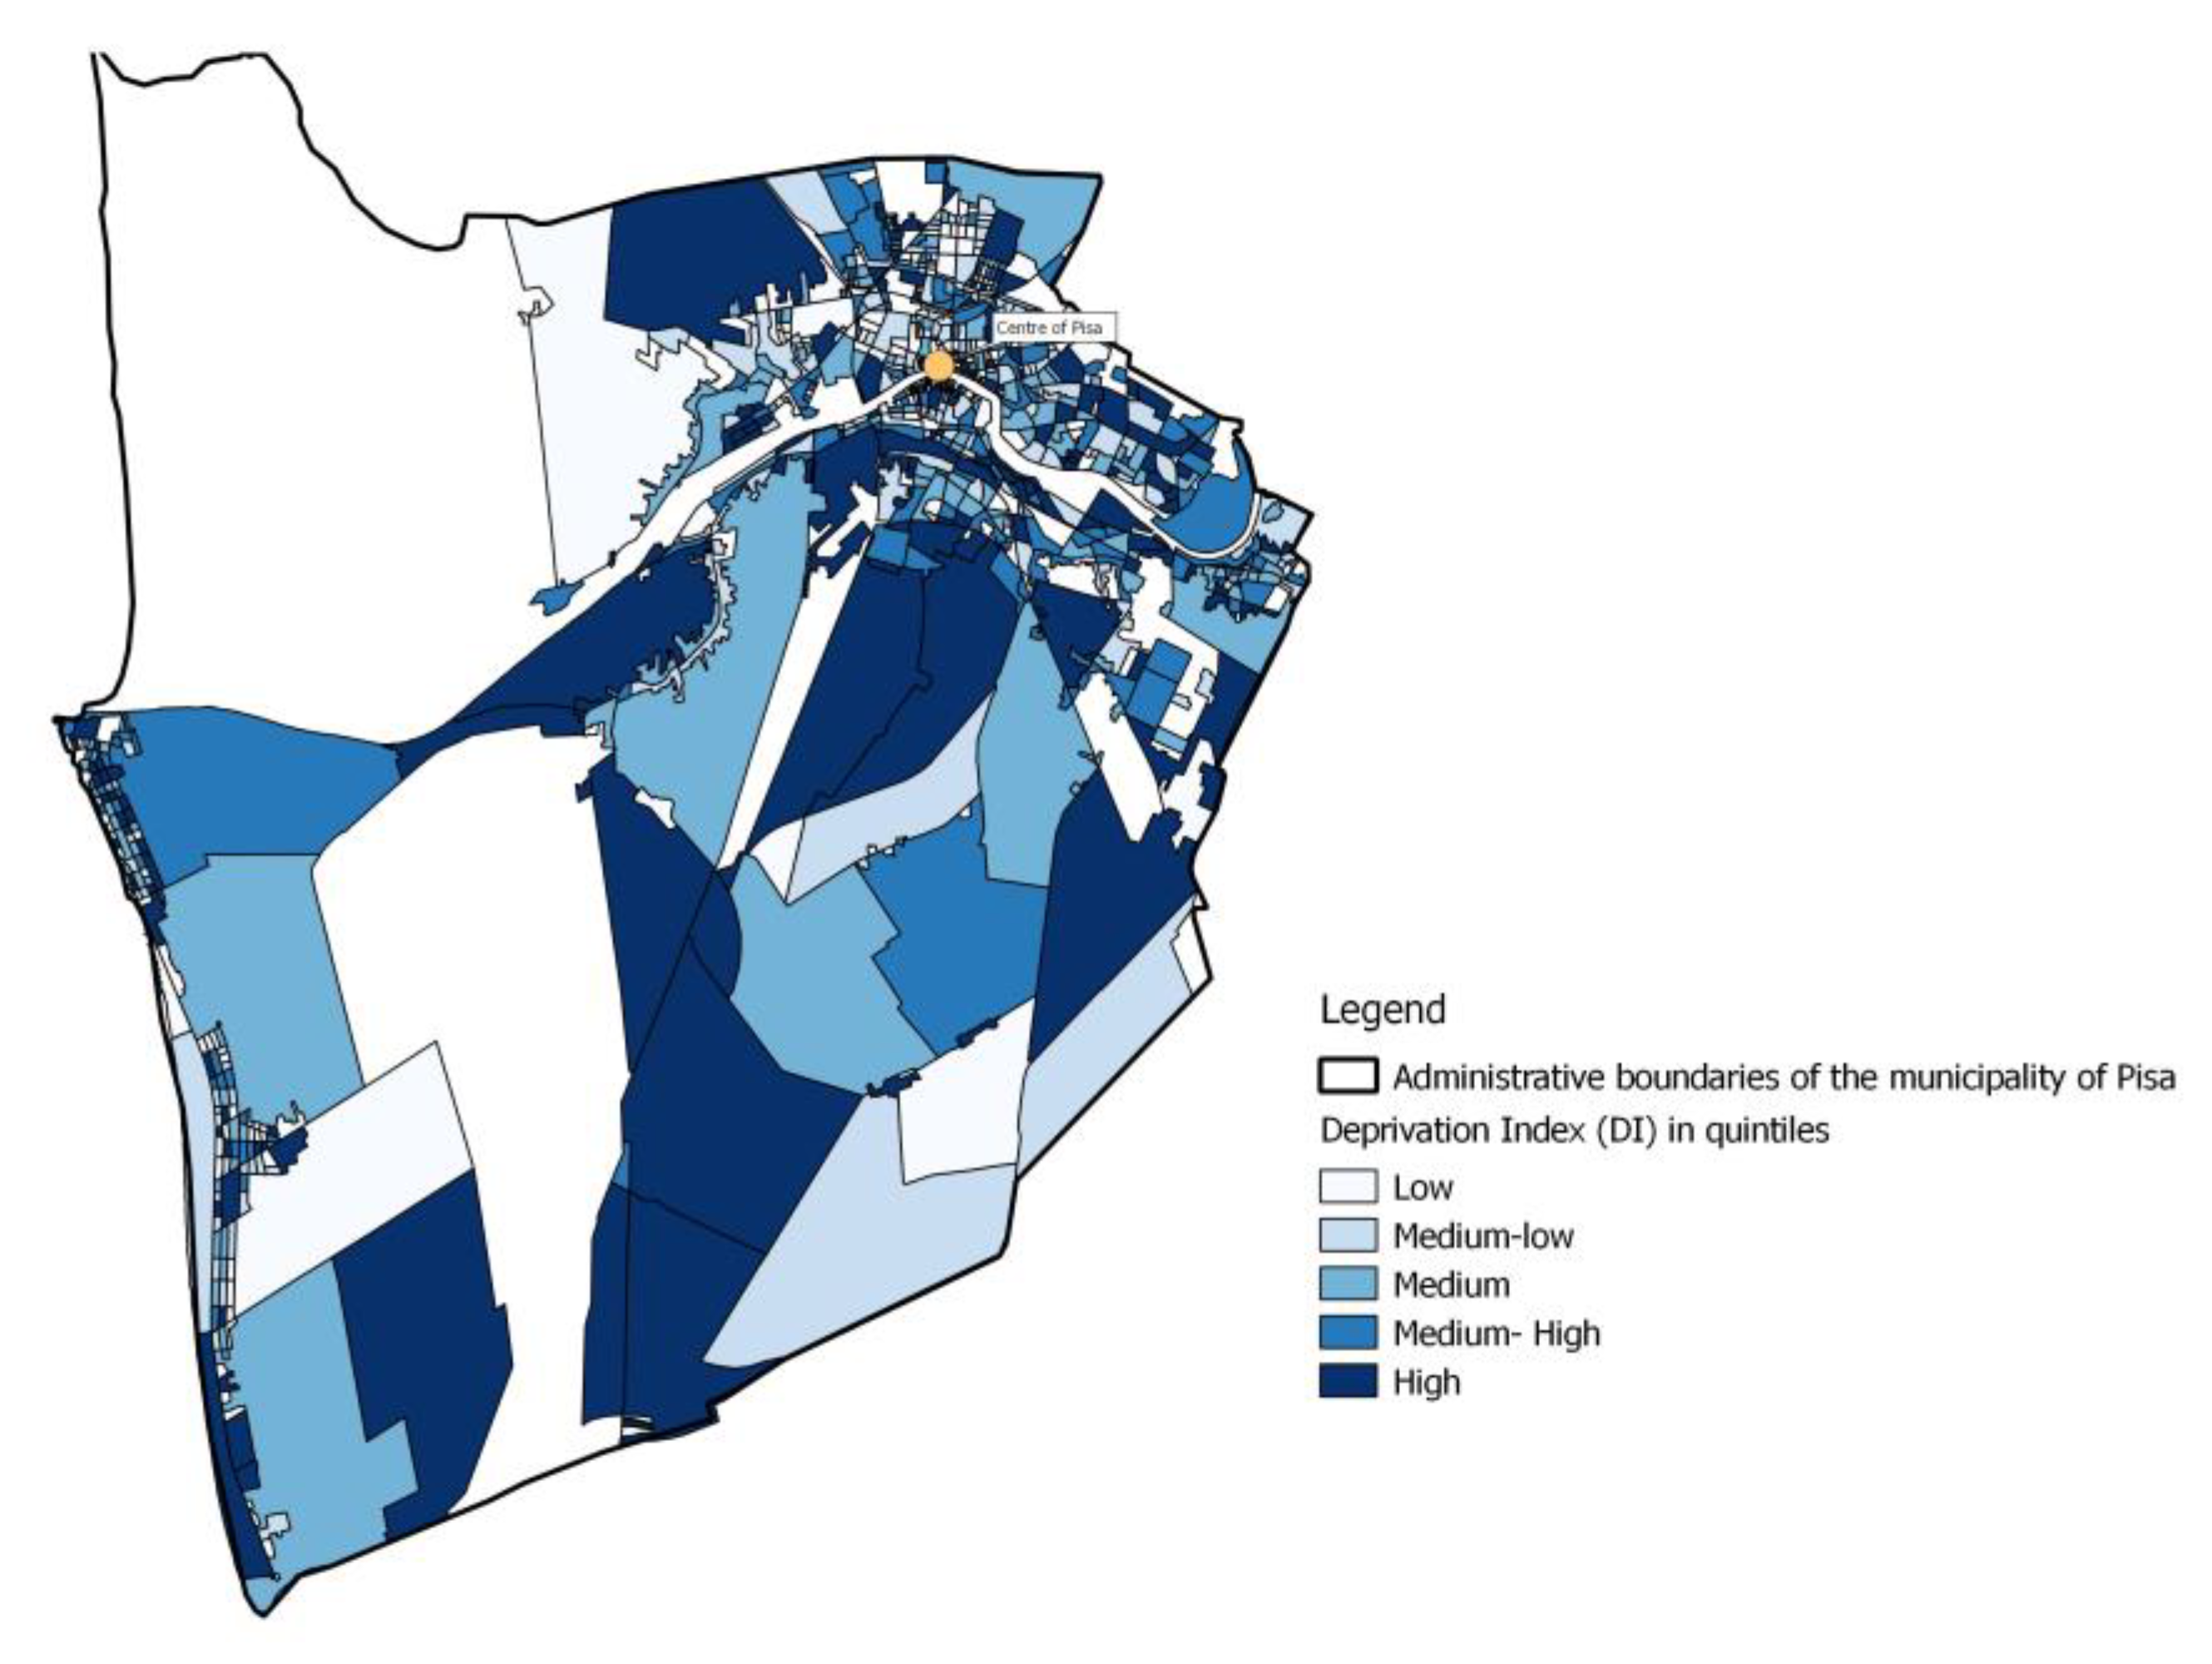
2.2.3. Exposure to Socio-Economic Factors
- Percentage of the population with an education level equal to or lower than the elementary school certificate (failure to reach compulsory schooling);
- Percentage of the active population unemployed or seeking their first job;
- Percentage of occupied rented dwellings;
- Percentage of single-parent families with cohabiting dependent children;
- Population density (number of occupants per 100 m2).
2.3. Health Indicators
- Diseases of the circulatory system (CVD) (International Classification of Diseases IX revision ICD-IX Code–390–495);
- Hypertensive diseases (ICD-IX Code–401–405);
- Ischaemic heart diseases (IHD) (ICD-IX Code–410–414);
- Acute myocardial infarction (AMI) (ICD-IX Code–410);
- Cerebrovascular diseases (ICD-IX Code–430–438);
- Stroke (ICD-IX Code–434, 435, 437, 446).
2.4. Statistical Analyses
3. Results
3.1. Results of Statistical Analyses
3.1.1. Descriptive Analysis—Mortality
3.1.2. Descriptive Analysis—Hospital Admission
3.1.3. Cardiovascular Disease and Noise Exposure—Mortality Analysis
3.1.4. Cardiovascular Disease and Noise Exposure—Hospital Admission Analysis
4. Discussion
5. Conclusions
- Define technical actions within teams of epidemiologists, urban developers, environmental practitioners, administrators, and representatives of the city neighborhoods. A transfer of the present scientific evidence into local decisions should adopt a transparent and layman language;
- Preserve the role of research as an independent source of information and objectively adopting the best scientific approach to provide and interpret results. A “third-party” contribution can move decisions to a greater acceptance;
- Set a permanent observatory for monitoring policy interventions at the city level. The assessment of the impacts of adopted or planned strategies is the best way to add value to research findings and improve the health indicators over time.
Author Contributions
Funding
Institutional Review Board Statement
Informed Consent Statement
Acknowledgments
Conflicts of Interest
References
- European Union Decision 2013/1386—Decision 1386/2013/EU on a General Union Environment Action Programme to 2020 ‘Living Well, within the Limits of Our Planet’ Text with EEA Relevance-EU Monitor. 2013. Available online: https://www.eumonitor.eu/9353000/1/j9vvik7m1c3gyxp/vjs5ga5k98yj (accessed on 11 August 2022).
- World Health Organization. World Health Organization Burden of Disease from Environmental Noise: Quantification of Healthy Life Years Lost in Europe; World Health Organization, Regional Office for Europe: Copenhagen, Denmark, 2011; ISBN 978-92-890-0229-5. [Google Scholar]
- European Environment Agency Environmental Noise in Europe—2020. Available online: https://www.eea.europa.eu/publications/environmental-noise-in-europe (accessed on 11 August 2022).
- World Health Organization Environmental Noise Guidelines for the European Region. 2018. Available online: https://www.who.int/europe/publications/i/item/9789289053563 (accessed on 11 August 2022).
- World Health Organization. International Telecommunication Union Safe Listening Devices and Systems: A WHO-ITU Standard; World Health Organization: Geneva, Switzerland, 2019; ISBN 978-92-4-151527-6. [Google Scholar]
- Basner, M.; Babisch, W.; Davis, A.; Brink, M.; Clark, C.; Janssen, S.; Stansfeld, S. Auditory and Non-Auditory Effects of Noise on Health. Lancet 2014, 383, 1325–1332. [Google Scholar] [CrossRef]
- Basner, M.; McGuire, S. WHO Environmental Noise Guidelines for the European Region: A Systematic Review on Environmental Noise and Effects on Sleep. Int. J. Environ. Res. Public Health 2018, 15, 519. [Google Scholar] [CrossRef]
- Miedema, H.M.E.; Vos, H. Associations between Self-Reported Sleep Disturbance and Environmental Noise Based on Reanalyses of Pooled Data from 24 Studies. Behav. Sleep Med. 2007, 5, 1–20. [Google Scholar] [CrossRef] [PubMed]
- Eze, I.C.; Foraster, M.; Schaffner, E.; Vienneau, D.; Héritier, H.; Pieren, R.; Thiesse, L.; Rudzik, F.; Rothe, T.; Pons, M.; et al. Transportation Noise Exposure, Noise Annoyance and Respiratory Health in Adults: A Repeated-Measures Study. Environ. Int. 2018, 121, 741–750. [Google Scholar] [CrossRef] [PubMed]
- Guski, R.; Schreckenberg, D.; Schuemer, R. WHO Environmental Noise Guidelines for the European Region: A Systematic Review on Environmental Noise and Annoyance. Int. J. Environ. Res. Public Health 2017, 14, 1539. [Google Scholar] [CrossRef]
- Miedema, H.M.; Oudshoorn, C.G. Annoyance from Transportation Noise: Relationships with Exposure Metrics DNL and DENL and Their Confidence Intervals. Environ. Health Perspect. 2001, 109, 409–416. [Google Scholar] [CrossRef] [PubMed]
- Sung, J.H.; Lee, J.; Jeong, K.S.; Lee, S.; Lee, C.; Jo, M.-W.; Sim, C.S. Influence of Transportation Noise and Noise Sensitivity on Annoyance: A Cross-Sectional Study in South Korea. Int. J. Environ. Res. Public Health 2017, 14, 322. [Google Scholar] [CrossRef] [PubMed]
- Muzet, A. Environmental Noise, Sleep and Health. Sleep Med. Rev. 2007, 11, 135–142. [Google Scholar] [CrossRef] [PubMed]
- Park, T.; Kim, M.; Jang, C.; Choung, T.; Sim, K.-A.; Seo, D.; Chang, S.I. The Public Health Impact of Road-Traffic Noise in a Highly-Populated City, Republic of Korea: Annoyance and Sleep Disturbance. Sustainability 2018, 10, 2947. [Google Scholar] [CrossRef]
- Lercher, P.; Evans, G.W.; Meis, M. Ambient Noise and Cognitive Processes among Primary Schoolchildren. Environ. Behav. 2003, 35, 725–735. [Google Scholar] [CrossRef]
- Belojević, G.; Paunović, K. Recent Advances in Research on Non-Auditory Effects of Community Noise. Srp. Arh. Celok. Lek. 2016, 144, 94–98. [Google Scholar] [CrossRef] [PubMed]
- Dimakopoulou, K.; Koutentakis, K.; Papageorgiou, I.; Kasdagli, M.-I.; Haralabidis, A.S.; Sourtzi, P.; Samoli, E.; Houthuijs, D.; Swart, W.; Hansell, A.L.; et al. Is Aircraft Noise Exposure Associated with Cardiovascular Disease and Hypertension? Results from a Cohort Study in Athens, Greece. Occup. Environ. Med. 2017, 74, 830–837. [Google Scholar] [CrossRef] [PubMed]
- Dzhambov, A.M. Long-Term Noise Exposure and the Risk for Type 2 Diabetes: A Meta-Analysis. Noise Health 2015, 17, 23–33. [Google Scholar] [CrossRef] [PubMed]
- Śliwińska-Kowalska, M.; Zaborowski, K. WHO Environmental Noise Guidelines for the European Region: A Systematic Review on Environmental Noise and Permanent Hearing Loss and Tinnitus. Int. J. Environ. Res. Public Health 2017, 14, 1139. [Google Scholar] [CrossRef]
- Prüss-Üstün, A.; Wolf, J.; Corvalán, C.F.; Bos, R.; Neira, M.P. Preventing Disease through Healthy Environments: A Global Assessment of the Burden of Disease from Environmental Risks; World Health Organization: Geneva, Switzerland, 2016; ISBN 978-92-4-156519-6. [Google Scholar]
- European Environment Agency. The European Environment—State and Outlook 2020—Knowledge for Transition to a Sustainable Europe. Available online: https://www.eea.europa.eu/publications/soer-2020 (accessed on 11 August 2022).
- Hänninen, O.; Knol, A.B.; Jantunen, M.; Lim, T.-A.; Conrad, A.; Rappolder, M.; Carrer, P.; Fanetti, A.-C.; Kim, R.; Buekers, J.; et al. Environmental Burden of Disease in Europe: Assessing Nine Risk Factors in Six Countries. Environ. Health Perspect. 2014, 122, 439–446. [Google Scholar] [CrossRef] [PubMed]
- Petri, D.; Licitra, G.; Vigotti, M.A.; Fredianelli, L. Effects of Exposure to Road, Railway, Airport and Recreational Noise on Blood Pressure and Hypertension. Int. J. Environ. Res. Public Health 2021, 18, 9145. [Google Scholar] [CrossRef] [PubMed]
- Romanelli, A.M.; Bianchi, F.; Curzio, O.; Minichilli, F. Mortality and Morbidity in a Population Exposed to Emission from a Municipal Waste Incinerator. A Retrospective Cohort Study. Int. J. Environ. Res. Public Health 2019, 16, 2863. [Google Scholar] [CrossRef]
- Wang, M.; Beelen, R.; Basagana, X.; Becker, T.; Cesaroni, G.; de Hoogh, K.; Dedele, A.; Declercq, C.; Dimakopoulou, K.; Eeftens, M.; et al. Evaluation of Land Use Regression Models for NO2 and Particulate Matter in 20 European Study Areas: The ESCAPE Project. Environ. Sci. Technol. 2013, 47, 4357–4364. [Google Scholar] [CrossRef]
- Caranci, N.; Biggeri, A.; Grisotto, L.; Pacelli, B.; Spadea, T.; Costa, G. The Italian deprivation index at census block level: Definition, description and association with general mortality. Epidemiol. Prev. 2010, 34, 167–176. [Google Scholar]
- Wasserstein, R.L.; Schirm, A.L.; Lazar, N.A. Moving to a World Beyond “p < 0.05”. Am. Stat. 2019, 73, 1–19. [Google Scholar] [CrossRef]
- Héritier, H.; Vienneau, D.; Foraster, M.; Eze, I.C.; Schaffner, E.; Thiesse, L.; Rudzik, F.; Habermacher, M.; Köpfli, M.; Pieren, R.; et al. Transportation Noise Exposure and Cardiovascular Mortality: A Nationwide Cohort Study from Switzerland. Eur. J. Epidemiol. 2017, 32, 307–315. [Google Scholar] [CrossRef] [PubMed]
- Thacher, J.D.; Hvidtfeldt, U.A.; Poulsen, A.H.; Raaschou-Nielsen, O.; Ketzel, M.; Brandt, J.; Jensen, S.S.; Overvad, K.; Tjønneland, A.; Münzel, T.; et al. Long-Term Residential Road Traffic Noise and Mortality in a Danish Cohort. Environ. Res. 2020, 187, 109633. [Google Scholar] [CrossRef] [PubMed]
- Vienneau, D.; Saucy, A.; Schäffer, B.; Flückiger, B.; Tangermann, L.; Stafoggia, M.; Wunderli, J.M.; Röösli, M. SNC study group Transportation Noise Exposure and Cardiovascular Mortality: 15-Years of Follow-up in a Nationwide Prospective Cohort in Switzerland. Environ. Int. 2022, 158, 106974. [Google Scholar] [CrossRef] [PubMed]
- Cai, Y.; Hodgson, S.; Blangiardo, M.; Gulliver, J.; Morley, D.; Fecht, D.; Vienneau, D.; de Hoogh, K.; Key, T.; Hveem, K.; et al. Road Traffic Noise, Air Pollution and Incident Cardiovascular Disease: A Joint Analysis of the HUNT, EPIC-Oxford and UK Biobank Cohorts. Environ. Int. 2018, 114, 191–201. [Google Scholar] [CrossRef]
- Fuks, K.B.; Weinmayr, G.; Basagaña, X.; Gruzieva, O.; Hampel, R.; Oftedal, B.; Sørensen, M.; Wolf, K.; Aamodt, G.; Aasvang, G.M.; et al. Long-Term Exposure to Ambient Air Pollution and Traffic Noise and Incident Hypertension in Seven Cohorts of the European Study of Cohorts for Air Pollution Effects (ESCAPE). Eur. Heart J. 2017, 38, 983–990. [Google Scholar] [CrossRef] [PubMed]
- Van Kempen, E.; Babisch, W. The Quantitative Relationship between Road Traffic Noise and Hypertension: A Meta-Analysis. J. Hypertens. 2012, 30, 1075–1086. [Google Scholar] [CrossRef] [PubMed]
- Babisch, W.; Beule, B.; Schust, M.; Kersten, N.; Ising, H. Traffic Noise and Risk of Myocardial Infarction. Epidemiology 2005, 16, 33–40. [Google Scholar] [CrossRef]
- Belojevic, G.; Saric-Tanaskovic, M. Prevalence of Arterial Hypertension and Myocardial Infarction in Relation to Subjective Ratings of Traffic Noise Exposure. Noise Health 2002, 4, 33–37. [Google Scholar]
- Zeeb, H.; Hegewald, J.; Schubert, M.; Wagner, M.; Dröge, P.; Swart, E.; Seidler, A. Traffic Noise and Hypertension—Results from a Large Case-Control Study. Environ. Res. 2017, 157, 110–117. [Google Scholar] [CrossRef]
- Babisch, W. Updated Exposure-Response Relationship between Road Traffic Noise and Coronary Heart Diseases: A Meta-Analysis. Noise Health 2014, 16, 1–9. [Google Scholar] [CrossRef] [PubMed]
- Gan, W.Q.; Koehoorn, M.; Davies, H.W.; Demers, P.A.; Tamburic, L.; Brauer, M. Long-Term Exposure to Traffic-Related Air Pollution and the Risk of Coronary Heart Disease Hospitalization and Mortality. Environ. Health Perspect. 2011, 119, 501–507. [Google Scholar] [CrossRef]
- Hahad, O.; Prochaska, J.H.; Daiber, A.; Muenzel, T. Environmental Noise-Induced Effects on Stress Hormones, Oxidative Stress, and Vascular Dysfunction: Key Factors in the Relationship between Cerebrocardiovascular and Psychological Disorders. Oxid. Med. Cell. Longev. 2019, 2019, 4623109. [Google Scholar] [CrossRef] [PubMed]
- Halonen, J.I.; Hansell, A.L.; Gulliver, J.; Morley, D.; Blangiardo, M.; Fecht, D.; Toledano, M.B.; Beevers, S.D.; Anderson, H.R.; Kelly, F.J.; et al. Road Traffic Noise Is Associated with Increased Cardiovascular Morbidity and Mortality and All-Cause Mortality in London. Eur. Heart J. 2015, 36, 2653–2661. [Google Scholar] [CrossRef] [PubMed]
- Van Kempen, E.; Casas, M.; Pershagen, G.; Foraster, M. WHO Environmental Noise Guidelines for the European Region: A Systematic Review on Environmental Noise and Cardiovascular and Metabolic Effects: A Summary. Int. J. Environ. Res. Public Health 2018, 15, 379. [Google Scholar] [CrossRef] [PubMed]
- Thacher, J.D.; Poulsen, A.H.; Raaschou-Nielsen, O.; Hvidtfeldt, U.A.; Brandt, J.; Christensen, J.H.; Khan, J.; Levin, G.; Münzel, T.; Sørensen, M. Exposure to Transportation Noise and Risk for Cardiovascular Disease in a Nationwide Cohort Study from Denmark. Environ. Res. 2022, 211, 113106. [Google Scholar] [CrossRef] [PubMed]
- Vienneau, D.; Eze, I.C.; Probst-Hensch, N.; Röösli, M. Association between Transportation Noise and Cardio-Metabolic Diseases: An Update of the WHO Meta-Analysis; Deutsche Gesellschaft für Akustik: Aachen, Germany, 2019. [Google Scholar]
- Vienneau, D.; Schindler, C.; Perez, L.; Probst-Hensch, N.; Röösli, M. The Relationship between Transportation Noise Exposure and Ischemic Heart Disease: A Meta-Analysis. Environ. Res. 2015, 138, 372–380. [Google Scholar] [CrossRef] [PubMed]
- Babisch, W.; Ising, H.; Gallacher, J.E.; Sweetnam, P.M.; Elwood, P.C. Traffic Noise and Cardiovascular Risk: The Caerphilly and Speedwell Studies, Third Phase--10-Year Follow Up. Arch. Environ. Health 1999, 54, 210–216. [Google Scholar] [CrossRef] [PubMed]
- Babisch, W.; Ising, H.; Kruppa, B.; Wiens, D. The Incidence of Myocardial Infarction and Its Relation to Road Traffic Noise—The Berlin Case-Control Studies. Environ. Int. 1994, 20, 469–474. [Google Scholar] [CrossRef]
- Beelen, R.; Hoek, G.; Houthuijs, D.; van den Brandt, P.A.; Goldbohm, R.A.; Fischer, P.; Schouten, L.J.; Armstrong, B.; Brunekreef, B. The Joint Association of Air Pollution and Noise from Road Traffic with Cardiovascular Mortality in a Cohort Study. Occup. Environ. Med. 2009, 66, 243–250. [Google Scholar] [CrossRef]
- Bodin, T.; Björk, J.; Mattisson, K.; Bottai, M.; Rittner, R.; Gustavsson, P.; Jakobsson, K.; Östergren, P.-O.; Albin, M. Road Traffic Noise, Air Pollution and Myocardial Infarction: A Prospective Cohort Study. Int. Arch. Occup. Environ. Health 2016, 89, 793–802. [Google Scholar] [CrossRef]
- Carey, I.M.; Anderson, H.R.; Atkinson, R.W.; Beevers, S.; Cook, D.G.; Dajnak, D.; Gulliver, J.; Kelly, F.J. Traffic Pollution and the Incidence of Cardiorespiratory Outcomes in an Adult Cohort in London. Occup. Environ. Med. 2016, 73, 849–856. [Google Scholar] [CrossRef] [PubMed]
- Selander, J.; Nilsson, M.E.; Bluhm, G.; Rosenlund, M.; Lindqvist, M.; Nise, G.; Pershagen, G. Long-Term Exposure to Road Traffic Noise and Myocardial Infarction. Epidemiology 2009, 20, 272–279. [Google Scholar] [CrossRef]
- Pyko, A.; Andersson, N.; Eriksson, C.; de Faire, U.; Lind, T.; Mitkovskaya, N.; Ögren, M.; Östenson, C.-G.; Pedersen, N.L.; Rizzuto, D.; et al. Long-Term Transportation Noise Exposure and Incidence of Ischaemic Heart Disease and Stroke: A Cohort Study. Occup. Environ. Med. 2019, 76, 201–207. [Google Scholar] [CrossRef] [PubMed]
- Rompel, S.; Schneider, A.; Peters, A.; Kraus, U.; on behalf of the Inger Study Group. Sex/Gender Differences in the Health Effects of Environmental Noise Exposure on Hypertension and Ischemic Heart Disease-A Systematic Review. Int. J. Environ. Res. Public Health 2021, 18, 9856. [Google Scholar] [CrossRef] [PubMed]
- Roswall, N.; Raaschou-Nielsen, O.; Ketzel, M.; Gammelmark, A.; Overvad, K.; Olsen, A.; Sørensen, M. Long-Term Residential Road Traffic Noise and NO2 Exposure in Relation to Risk of Incident Myocardial Infarction—A Danish Cohort Study. Environ. Res. 2017, 156, 80–86. [Google Scholar] [CrossRef] [PubMed]
- Hao, G.; Zuo, L.; Weng, X.; Fei, Q.; Zhang, Z.; Chen, L.; Wang, Z.; Jing, C. Associations of Road Traffic Noise with Cardiovascular Diseases and Mortality: Longitudinal Results from UK Biobank and Meta-Analysis. Environ. Res. 2022, 212, 113129. [Google Scholar] [CrossRef]
- Sørensen, M.; Andersen, Z.J.; Nordsborg, R.B.; Jensen, S.S.; Lillelund, K.G.; Beelen, R.; Schmidt, E.B.; Tjønneland, A.; Overvad, K.; Raaschou-Nielsen, O. Road Traffic Noise and Incident Myocardial Infarction: A Prospective Cohort Study. PLoS ONE 2012, 7, e39283. [Google Scholar] [CrossRef]
- Oh, M.; Shin, K.; Kim, K.; Shin, J. Influence of Noise Exposure on Cardiocerebrovascular Disease in Korea. Sci. Total Environ. 2019, 651, 1867–1876. [Google Scholar] [CrossRef]
- Recio, A.; Linares, C.; Banegas, J.R.; Díaz, J. Road Traffic Noise Effects on Cardiovascular, Respiratory, and Metabolic Health: An Integrative Model of Biological Mechanisms. Environ. Res. 2016, 146, 359–370. [Google Scholar] [CrossRef]
- De Kluizenaar, Y.; van Lenthe, F.J.; Visschedijk, A.J.H.; Zandveld, P.Y.J.; Miedema, H.M.E.; Mackenbach, J.P. Road Traffic Noise, Air Pollution Components and Cardiovascular Events. Noise Health 2013, 15, 388–397. [Google Scholar] [CrossRef] [PubMed]
- Andersson, E.M.; Ögren, M.; Molnár, P.; Segersson, D.; Rosengren, A.; Stockfelt, L. Road Traffic Noise, Air Pollution and Cardiovascular Events in a Swedish Cohort. Environ. Res. 2020, 185, 109446. [Google Scholar] [CrossRef] [PubMed]
- Roswall, N.; Pyko, A.; Ögren, M.; Oudin, A.; Rosengren, A.; Lager, A.; Poulsen, A.H.; Eriksson, C.; Segersson, D.; Rizzuto, D.; et al. Long-Term Exposure to Transportation Noise and Risk of Incident Stroke: A Pooled Study of Nine Scandinavian Cohorts. Environ. Health Perspect. 2021, 129. [Google Scholar] [CrossRef] [PubMed]
- Sørensen, M.; Poulsen, A.H.; Hvidtfeldt, U.A.; Münzel, T.; Thacher, J.D.; Ketzel, M.; Brandt, J.; Christensen, J.H.; Levin, G.; Raaschou-Nielsen, O. Transportation Noise and Risk of Stroke: A Nationwide Prospective Cohort Study Covering Denmark. Int. J. Epidemiol. 2021, 50, 1147–1156. [Google Scholar] [CrossRef]
- Sørensen, M.; Hvidberg, M.; Andersen, Z.J.; Nordsborg, R.B.; Lillelund, K.G.; Jakobsen, J.; Tjønneland, A.; Overvad, K.; Raaschou-Nielsen, O. Road Traffic Noise and Stroke: A Prospective Cohort Study. Eur. Heart J. 2011, 32, 737–744. [Google Scholar] [CrossRef]
- Sørensen, M.; Lühdorf, P.; Ketzel, M.; Andersen, Z.J.; Tjønneland, A.; Overvad, K.; Raaschou-Nielsen, O. Combined Effects of Road Traffic Noise and Ambient Air Pollution in Relation to Risk for Stroke? Environ. Res. 2014, 133, 49–55. [Google Scholar] [CrossRef] [PubMed]
- Cole-Hunter, T.; Dehlendorff, C.; Amini, H.; Mehta, A.; Lim, Y.-H.; Jørgensen, J.T.; Li, S.; So, R.; Mortensen, L.H.; Westendorp, R.; et al. Long-Term Exposure to Road Traffic Noise and Stroke Incidence: A Danish Nurse Cohort Study. Environ. Health 2021, 20, 115. [Google Scholar] [CrossRef] [PubMed]
- Münzel, T.; Gori, T.; Babisch, W.; Basner, M. Cardiovascular Effects of Environmental Noise Exposure. Eur. Heart J. 2014, 35, 829–836. [Google Scholar] [CrossRef] [PubMed]
- Lim, S.S.; Vos, T.; Flaxman, A.D.; Danaei, G.; Shibuya, K.; Adair-Rohani, H.; AlMazroa, M.A.; Amann, M.; Anderson, H.R.; Andrews, K.G.; et al. A Comparative Risk Assessment of Burden of Disease and Injury Attributable to 67 Risk Factors and Risk Factor Clusters in 21 Regions, 1990–2010: A Systematic Analysis for the Global Burden of Disease Study 2010. Lancet 2012, 380, 2224–2260. [Google Scholar] [CrossRef]
- Babisch, W. Cardiovascular Effects of Noise. Noise Health 2011, 13, 201–204. [Google Scholar] [CrossRef]
- Münzel, T.; Sørensen, M.; Gori, T.; Schmidt, F.P.; Rao, X.; Brook, F.R.; Chen, L.C.; Brook, R.D.; Rajagopalan, S. Environmental Stressors and Cardio-Metabolic Disease: Part II-Mechanistic Insights. Eur. Heart J. 2017, 38, 557–564. [Google Scholar] [CrossRef] [PubMed]
- Cai, Y.; Hansell, A.L.; Blangiardo, M.; Burton, P.R.; de Hoogh, K.; Doiron, D.; Fortier, I.; Gulliver, J.; Hveem, K.; Mbatchou, S.; et al. Long-Term Exposure to Road Traffic Noise, Ambient Air Pollution, and Cardiovascular Risk Factors in the HUNT and Lifelines Cohorts. Eur. Heart J. 2017, 38, 2290–2296. [Google Scholar] [CrossRef] [PubMed]
- Kälsch, H.; Hennig, F.; Moebus, S.; Möhlenkamp, S.; Dragano, N.; Jakobs, H.; Memmesheimer, M.; Erbel, R.; Jöckel, K.-H.; Hoffmann, B.; et al. Are Air Pollution and Traffic Noise Independently Associated with Atherosclerosis: The Heinz Nixdorf Recall Study. Eur. Heart J. 2014, 35, 853–860. [Google Scholar] [CrossRef]
- Monrad, M.; Sajadieh, A.; Christensen, J.S.; Ketzel, M.; Raaschou-Nielsen, O.; Tjønneland, A.; Overvad, K.; Loft, S.; Sørensen, M. Residential Exposure to Traffic Noise and Risk of Incident Atrial Fibrillation: A Cohort Study. Environ. Int. 2016, 92–93, 457–463. [Google Scholar] [CrossRef] [PubMed]
- Sørensen, M.; Wendelboe Nielsen, O.; Sajadieh, A.; Ketzel, M.; Tjønneland, A.; Overvad, K.; Raaschou-Nielsen, O. Long-Term Exposure to Road Traffic Noise and Nitrogen Dioxide and Risk of Heart Failure: A Cohort Study. Environ. Health Perspect. 2017, 125, 097021. [Google Scholar] [CrossRef] [PubMed]
- Foraster, M.; Eze, I.C.; Schaffner, E.; Vienneau, D.; Héritier, H.; Endes, S.; Rudzik, F.; Thiesse, L.; Pieren, R.; Schindler, C.; et al. Exposure to Road, Railway, and Aircraft Noise and Arterial Stiffness in the SAPALDIA Study: Annual Average Noise Levels and Temporal Noise Characteristics. Environ. Health Perspect. 2017, 125, 097004. [Google Scholar] [CrossRef] [PubMed]
- Ancona, C.; Badaloni, C.; Mataloni, F.; Bolignano, A.; Bucci, S.; Cesaroni, G.; Sozzi, R.; Davoli, M.; Forastiere, F. Mortality and Morbidity in a Population Exposed to Multiple Sources of Air Pollution: A Retrospective Cohort Study Using Air Dispersion Models. Environ. Res. 2015, 137, 467–474. [Google Scholar] [CrossRef] [PubMed]
- Cordioli, M.; Ranzi, A.; De Leo, G.A.; Lauriola, P. A Review of Exposure Assessment Methods in Epidemiological Studies on Incinerators. J. Environ. Public Health 2013, 2013, 129470. [Google Scholar] [CrossRef] [PubMed]
- Ranzi, A.; Fano, V.; Erspamer, L.; Lauriola, P.; Perucci, C.A.; Forastiere, F. Mortality and Morbidity among People Living Close to Incinerators: A Cohort Study Based on Dispersion Modeling for Exposure Assessment. Environ. Health 2011, 10, 22. [Google Scholar] [CrossRef]
- Sustainable Urban Mobility Plan—2020. Available online: https://www.comune.pisa.it/it/ufficio/pums-piano-urbano-mobilita-sostenibile (accessed on 11 August 2022).
- Linzalone, N.; Coi, A.; Lauriola, P.; Luise, D.; Pedone, A.; Romizi, R.; Sallese, D.; Bianchi, F. Participatory health impact assessment used to support decision-making in waste management planning: A replicable experience from Italy. Waste Manag. 2017, 59, 557–566. [Google Scholar] [CrossRef]


| Cohort | Person-Years | Number of Deaths for CVD | Crude Rate × 1000 Person-Years | 95% CI | ||
|---|---|---|---|---|---|---|
| Total | 985,022 | 4854 | 4.93 | 4.79 | 5.07 | |
| Sex | Women | 518,783 | 2870 | 5.53 | 5.33 | 5.74 |
| Men | 466,239 | 1984 | 4.26 | 4.07 | 4.45 | |
| Age classes (years) | 0–44 | 476,355 | 40 | 0.08 | 0.06 | 0.11 |
| 45–54 | 131,925 | 73 | 0.55 | 0.44 | 0.70 | |
| 55–64 | 135,510 | 191 | 1.41 | 1.22 | 1.62 | |
| 65–74 | 120,543 | 648 | 5.38 | 4.98 | 5.81 | |
| 75–84 | 91,683 | 1942 | 21.18 | 20.26 | 22.15 | |
| 85+ | 29,006 | 1960 | 67.57 | 64.65 | 70.63 | |
| Classes of socio-economic deprivation | Low | 193,035 | 910 | 4.71 | 4.42 | 5.03 |
| Medium-low | 195,292 | 904 | 4.63 | 4.34 | 4.94 | |
| Medium | 201,576 | 992 | 4.92 | 4.62 | 5.24 | |
| Medium-high | 196,028 | 948 | 4.84 | 4.54 | 5.15 | |
| High | 193,552 | 1062 | 5.49 | 5.17 | 5.83 | |
| Classes of exposure to nocturnal noise (dB(A)) | Class 1 (reference): <43.7 | 245,342 | 1074 | 4.38 | 4.12 | 4.65 |
| Class 2: 43.7–49.5 | 252,567 | 1216 | 4.81 | 4.55 | 5.09 | |
| Class 3: 49.5–53.30 | 247,869 | 1249 | 5.04 | 4.77 | 5.33 | |
| Class 4: 53.3–73.9 | 239,220 | 1315 | 5.50 | 5.21 | 5.80 | |
| Classes of exposure to diurnal noise (dB(A)) | Class 1 (reference): <50.7 | 245,621 | 1082 | 4.41 | 4.15 | 4.68 |
| Class 2: 50.7–56.7 | 250,101 | 1187 | 4.75 | 4.48 | 5.02 | |
| Class 3: 56.7–60.3 | 249,401 | 1246 | 5.00 | 4.73 | 5.28 | |
| Class 4:60.3–78.1 | 239,875 | 1339 | 5.58 | 5.29 | 5.89 | |
| Classes of exposure to NO2 (µg/m3) | Class 1 (reference): <25.5 | 210,071 | 912 | 4.34 | 4.07 | 4.63 |
| Class 2: 25.5–27.6 | 215,578 | 1104 | 5.12 | 4.83 | 5.43 | |
| Class 3: 27.6–35.2 | 302,240 | 1484 | 4.91 | 4.67 | 5.17 | |
| Class 4: 35.2–78.6 | 256,716 | 1354 | 5.27 | 5.00 | 5.56 | |
| Cohort | Person-Years | Number of Hospitalizations for CVD | Crude Rate × 1000 Person-Year | 95% CI | ||
|---|---|---|---|---|---|---|
| Sex | Total | 1,107,023 | 13,277 | 11.99 | 11.79 | 12.20 |
| Women | 588,219 | 6257 | 10.64 | 10.38 | 10.90 | |
| Men | 518,804 | 7020 | 13.53 | 13.22 | 13.85 | |
| Age classes (years) | 0–44 | 557,381 | 927 | 1.66 | 1.56 | 1.77 |
| 45–54 | 156,370 | 1061 | 6.79 | 6.39 | 7.21 | |
| 55–64 | 150,762 | 2250 | 14.92 | 14.32 | 15.55 | |
| 65–74 | 128,187 | 3519 | 27.45 | 26.56 | 28.37 | |
| 75–84 | 87,768 | 4099 | 46.70 | 45.30 | 48.16 | |
| 85+ | 26,555 | 1421 | 53.51 | 50.80 | 56.37 | |
| Classes of socio-economic deprivation | Low | 216,732 | 2501 | 11.54 | 11.10 | 12.00 |
| Medium-low | 220,026 | 2530 | 11.50 | 11.06 | 11.96 | |
| Medium | 226,222 | 2639 | 11.67 | 11.23 | 12.12 | |
| Medium-high | 221,501 | 2624 | 11.85 | 11.40 | 12.31 | |
| High | 216,034 | 2931 | 13.57 | 13.09 | 14.07 | |
| Classes of exposure to nocturnal noise (dB(A)) | Class 1 (reference): <43.7 | 276,582 | 3181 | 11.50 | 11.11 | 11.91 |
| Class 2: 43.7–49.5 | 284,178 | 3372 | 11.87 | 11.47 | 12.27 | |
| Class 3: 49.5–53.3 | 279,133 | 3388 | 12.14 | 11.74 | 12.55 | |
| Class 4: 53.3–73.9 | 267,106 | 3336 | 12.49 | 12.07 | 12.92 | |
| Classes of exposure to diurnal noise (dB(A)) | Class 1 (reference): <50.7 | 276,849 | 3181 | 11.49 | 11.10 | 11.90 |
| Class 2: 50.7–56.7 | 280,855 | 3289 | 11.71 | 11.32 | 12.12 | |
| Class 3: 56.7–60.3 | 280,787 | 3473 | 12.37 | 11.96 | 12.79 | |
| Class 4:60.3–78.1 | 268,508 | 3334 | 12.42 | 12.00 | 12.85 | |
| Classes of exposure to NOx (µg/m3) | Class 1 (reference): <25.0 | 237,754 | 2714 | 11.42 | 10.99 | 11.85 |
| Class 2: 25.5–27.6 | 240,157 | 3106 | 12.93 | 12.49 | 13.40 | |
| Class 3: 27.6–35.2 | 339,832 | 4032 | 11.97 | 11.50 | 23.24 | |
| Class 4: 35.2–78.6 | 288,787 | 3423 | 11.85 | 11.46 | 12.26 | |
| Cause (Code ICD-IX) | Gender | Class Exp. | Nocturnal Period | Diurnal Period | ||||||||||||||||
|---|---|---|---|---|---|---|---|---|---|---|---|---|---|---|---|---|---|---|---|---|
| n | HR | p | 95% CI | Trend | p | 95% CI | n | HR | p | 95% CI | Trend | p | 95% CI | |||||||
| Diseases of the Circulatory System (390–459)-CVD | M + W | 2 | 1216 | 1.03 | 0.473 | 0.95 | 1.12 | 1187 | 1.02 | 0.693 | 0.94 | 1.11 | ||||||||
| 3 | 1249 | 1.08 | 0.061 | 1.00 | 1.17 | 1246 | 1.08 | 0.079 | 0.99 | 1.17 | ||||||||||
| 4 | 1315 | 1.11 | 0.015 | 1.02 | 1.20 | 1.006 | 0.003 | 1.002 | 1.010 | 1339 | 1.10 | 0.029 | 1.01 | 1.19 | 1.006 | 0.003 | 1.002 | 1.010 | ||
| M | 2 | 463 | 0.91 | 0.171 | 0.80 | 1.04 | 452 | 0.89 | 0.068 | 0.78 | 1.01 | |||||||||
| 3 | 505 | 0.99 | 0.931 | 0.88 | 1.13 | 507 | 0.99 | 0.902 | 0.88 | 1.12 | ||||||||||
| 4 | 541 | 1.07 | 0.313 | 0.94 | 1.21 | 1.004 | 0.207 | 0.998 | 1.010 | 547 | 1.05 | 0.456 | 0.93 | 1.19 | 1.004 | 0.250 | 0.997 | 1.010 | ||
| W | 2 | 753 | 1.12 | 0.041 | 1.00 | 1.25 | 735 | 1.12 | 0.043 | 1.00 | 1.25 | |||||||||
| 3 | 744 | 1.15 | 0.010 | 1.04 | 1.28 | 739 | 1.14 | 0.015 | 1.03 | 1.27 | ||||||||||
| 4 | 774 | 1.15 | 0.013 | 1.03 | 1.28 | 1.007 | 0.004 | 1.002 | 1.012 | 792 | 1.14 | 0.018 | 1.02 | 1.27 | 1.008 | 0.003 | 1.003 | 1.013 | ||
| Ischaemic Heart Diseases (410–414)-IHD | M + W | 2 | 396 | 0.95 | 0.441 | 0.82 | 1.09 | 388 | 0.93 | 0.293 | 0.80 | 1.07 | ||||||||
| 3 | 424 | 1.03 | 0.702 | 0.89 | 1.18 | 412 | 0.98 | 0.765 | 0.85 | 1.12 | ||||||||||
| 4 | 455 | 1.09 | 0.248 | 0.95 | 1.25 | 1.005 | 0.134 | 0.998 | 1.012 | 467 | 1.07 | 0.319 | 0.94 | 1.23 | 1.005 | 0.170 | 0.998 | 1.011 | ||
| M | 2 | 176 | 0.82 | 0.048 | 0.67 | 1.00 | 178 | 0.82 | 0.052 | 0.67 | 1.00 | |||||||||
| 3 | 208 | 0.96 | 0.689 | 0.79 | 1.17 | 197 | 0.90 | 0.275 | 0.74 | 1.09 | ||||||||||
| 4 | 215 | 1.01 | 0.894 | 0.83 | 1.23 | 1.002 | 0.672 | 0.993 | 1.011 | 222 | 1.02 | 0.868 | 0.84 | 1.23 | 1.001 | 0.858 | 0.991 | 1.010 | ||
| W | 2 | 220 | 1.09 | 0.385 | 0.90 | 1.33 | 210 | 1.04 | 0.670 | 0.86 | 1.27 | |||||||||
| 3 | 216 | 1.11 | 0.322 | 0.91 | 1.35 | 215 | 1.07 | 0.493 | 0.88 | 1.30 | ||||||||||
| 4 | 240 | 1.18 | 0.104 | 0.97 | 1.43 | 1.008 | 0.078 | 0.999 | 1.017 | 245 | 1.14 | 0.176 | 0.94 | 1.39 | 1.009 | 0.068 | 0.999 | 1.018 | ||
| Acute Myocardial Infarction (410)-AMI | M + W | 2 | 147 | 0.97 | 0.813 | 0.77 | 1.23 | 143 | 0.95 | 0.642 | 0.75 | 1.19 | ||||||||
| 3 | 152 | 1.00 | 0.981 | 0.80 | 1.26 | 147 | 0.95 | 0.651 | 0.75 | 1.19 | ||||||||||
| 4 | 148 | 0.99 | 0.902 | 0.78 | 1.25 | 1.001 | 0.854 | 0.990 | 1.012 | 154 | 0.99 | 0.941 | 0.79 | 1.25 | 1.001 | 0.794 | 0.991 | 1.013 | ||
| M | 2 | 71 | 0.90 | 0.510 | 0.65 | 1.24 | 73 | 0.94 | 0.706 | 0.68 | 1.30 | |||||||||
| 3 | 80 | 1.00 | 0.980 | 0.73 | 1.38 | 79 | 0.99 | 0.961 | 0.72 | 1.36 | ||||||||||
| 4 | 82 | 1.06 | 0.705 | 0.77 | 1.46 | 1.005 | 0.554 | 0.989 | 1.020 | 82 | 1.05 | 0.748 | 0.77 | 1.45 | 1.003 | 0.709 | 0.988 | 1.018 | ||
| W | 2 | 76 | 1.06 | 0.725 | 0.76 | 1.48 | 70 | 0.95 | 0.784 | 0.68 | 1.33 | |||||||||
| 3 | 72 | 1.01 | 0.977 | 0.72 | 1.40 | 68 | 0.90 | 0.550 | 0.65 | 1.26 | ||||||||||
| 4 | 66 | 0.91 | 0.587 | 0.64 | 1.29 | 0.997 | 0.743 | 0.982 | 1.013 | 72 | 0.93 | 0.672 | 0.67 | 1.30 | 1.000 | 0.986 | 0.984 | 1.016 | ||
| Cerebrovascular Diseases (430–438) | M + W | 2 | 385 | 1.03 | 0.699 | 0.89 | 1.19 | 387 | 1.06 | 0.456 | 0.91 | 1.23 | ||||||||
| 3 | 403 | 1.12 | 0.129 | 0.97 | 1.29 | 394 | 1.11 | 0.178 | 0.96 | 1.28 | ||||||||||
| 4 | 399 | 1.06 | 0.476 | 0.91 | 1.22 | 1.004 | 0.240 | 0.997 | 1.011 | 407 | 1.05 | 0.480 | 0.91 | 1.22 | 1.004 | 0.307 | 0.997 | 1.010 | ||
| M | 2 | 128 | 0.89 | 0.361 | 0.70 | 1.14 | 126 | 0.85 | 0.201 | 0.67 | 1.09 | |||||||||
| 3 | 138 | 0.96 | 0.710 | 0.75 | 1.21 | 136 | 0.92 | 0.480 | 0.72 | 1.16 | ||||||||||
| 4 | 146 | 1.00 | 0.995 | 0.79 | 1.27 | 1.002 | 0.760 | 0.990 | 1.013 | 146 | 0.95 | 0.665 | 0.75 | 1.20 | 1.000 | 0.997 | 0.989 | 1.012 | ||
| W | 2 | 257 | 1.11 | 0.260 | 0.92 | 1.34 | 261 | 1.20 | 0.059 | 0.99 | 1.45 | |||||||||
| 3 | 265 | 1.23 | 0.028 | 1.02 | 1.48 | 258 | 1.24 | 0.025 | 1.03 | 1.49 | ||||||||||
| 4 | 253 | 1.10 | 0.332 | 0.91 | 1.33 | 1.006 | 0.199 | 0.997 | 1.014 | 261 | 1.13 | 0.192 | 0.94 | 1.37 | 1.006 | 0.191 | 0.997 | 1.014 | ||
| Cause (Code ICD-IX) | Gender | ClassExp. | Nocturnal Period | Diurnal Period | ||||||||||||||||
|---|---|---|---|---|---|---|---|---|---|---|---|---|---|---|---|---|---|---|---|---|
| n | HR | p | 95% CI | Trend | p | 95% CI | n | HR | p | 95% CI | Trend | p | 95% CI | |||||||
| Diseases of the Circulatory System (390–459)-CVD | M + W | 2 | 3345 | 1.00 | 0.959 | 0.95 | 1.05 | 3266 | 0.99 | 0.791 | 0.95 | 1.04 | ||||||||
| 3 | 3364 | 1.01 | 0.808 | 0.96 | 1.06 | 3450 | 1.02 | 0.431 | 0.97 | 1.07 | ||||||||||
| 4 | 3319 | 1.02 | 0.423 | 0.97 | 1.07 | 1.002 | 0.137 | 0.999 | 1.004 | 3312 | 1.00 | 0.899 | 0.96 | 1.05 | 1.001 | 0.259 | 0.999 | 1.004 | ||
| M | 2 | 1785 | 0.98 | 0.454 | 0.91 | 1.04 | 1745 | 0.97 | 0.384 | 0.91 | 1.04 | |||||||||
| 3 | 1775 | 0.97 | 0.388 | 0.91 | 1.04 | 1862 | 1.01 | 0.840 | 0.94 | 1.08 | ||||||||||
| 4 | 1685 | 0.97 | 0.419 | 0.91 | 1.04 | 0.999 | 0.632 | 0.996 | 1.002 | 1649 | 0.94 | 0.082 | 0.88 | 1.01 | 0.999 | 0.448 | 0.996 | 1.002 | ||
| W | 2 | 1560 | 1.03 | 0.454 | 0.96 | 1.10 | 1521 | 1.02 | 0.588 | 0.95 | 1.10 | |||||||||
| 3 | 1589 | 1.05 | 0.163 | 0.98 | 1.13 | 1588 | 1.04 | 0.307 | 0.97 | 1.11 | ||||||||||
| 4 | 1634 | 1.08 | 0.033 | 1.01 | 1.16 | 1.005 | 0.006 | 1.001 | 1.008 | 1663 | 1.08 | 0.041 | 1.00 | 1.16 | 1.004 | 0.011 | 1.001 | 1.008 | ||
| Hypertensive Diseases (401–405) | M + W | 2 | 104 | 1.04 | 0.780 | 0.79 | 1.38 | 95 | 0.92 | 0.579 | 0.69 | 1.23 | ||||||||
| 3 | 107 | 1.08 | 0.593 | 0.82 | 1.43 | 107 | 1.03 | 0.852 | 0.78 | 1.35 | ||||||||||
| 4 | 112 | 1.16 | 0.300 | 0.88 | 1.54 | 1.004 | 0.512 | 0.991 | 1.017 | 117 | 1.15 | 0.308 | 0.88 | 1.52 | 1.005 | 0.429 | 0.992 | 1.019 | ||
| M | 2 | 54 | 1.19 | 0.408 | 0.79 | 1.77 | 49 | 1.06 | 0.779 | 0.71 | 1.59 | |||||||||
| 3 | 51 | 1.13 | 0.557 | 0.75 | 1.70 | 54 | 1.14 | 0.512 | 0.77 | 1.70 | ||||||||||
| 4 | 48 | 1.10 | 0.672 | 0.72 | 1.66 | 1.003 | 0.763 | 0.984 | 1.022 | 49 | 1.08 | 0.707 | 0.72 | 1.64 | 1.004 | 0.661 | 0.985 | 1.024 | ||
| W | 2 | 50 | 0.92 | 0.675 | 0.62 | 1.36 | 46 | 0.81 | 0.307 | 0.55 | 1.21 | |||||||||
| 3 | 56 | 1.05 | 0.820 | 0.71 | 1.53 | 53 | 0.94 | 0.741 | 0.64 | 1.37 | ||||||||||
| 4 | 64 | 1.20 | 0.337 | 0.83 | 1.76 | 1.005 | 0.558 | 0.988 | 1.023 | 68 | 1.20 | 0.329 | 0.83 | 1.73 | 1.006 | 0.520 | 0.988 | 1.024 | ||
| Ischaemic Heart Diseases (410–414)-IHD | M + W | 2 | 923 | 0.94 | 0.194 | 0.86 | 1.03 | 886 | 0.91 | 0.034 | 0.83 | 0.99 | ||||||||
| 3 | 970 | 1.00 | 0.977 | 0.91 | 1.09 | 1005 | 1.01 | 0.892 | 0.92 | 1.10 | ||||||||||
| 4 | 888 | 0.96 | 0.385 | 0.87 | 1.05 | 0.999 | 0.688 | 0.995 | 1.003 | 877 | 0.92 | 0.079 | 0.84 | 1.01 | 0.999 | 0.550 | 0.994 | 1.003 | ||
| M | 2 | 608 | 0.93 | 0.232 | 0.84 | 1.05 | 576 | 0.88 | 0.025 | 0.78 | 0.98 | |||||||||
| 3 | 619 | 0.96 | 0.483 | 0.86 | 1.07 | 651 | 0.98 | 0.662 | 0.87 | 1.09 | ||||||||||
| 4 | 542 | 0.90 | 0.090 | 0.80 | 1.02 | 0.996 | 0.196 | 0.991 | 1.002 | 533 | 0.86 | 0.014 | 0.77 | 0.97 | 0.996 | 0.137 | 0.990 | 1.001 | ||
| W | 2 | 315 | 0.96 | 0.583 | 0.82 | 1.12 | 310 | 0.96 | 0.585 | 0.82 | 1.12 | |||||||||
| 3 | 351 | 1.09 | 0.293 | 0.93 | 1.27 | 354 | 1.08 | 0.353 | 0.92 | 1.25 | ||||||||||
| 4 | 346 | 1.08 | 0.324 | 0.93 | 1.27 | 1.005 | 0.222 | 0.997 | 1.012 | 344 | 1.04 | 0.621 | 0.89 | 1.22 | 1.004 | 0.240 | 0.997 | 1.012 | ||
| Acute Myocardial Infarction (410)-AMI | M + W | 2 | 467 | 0.98 | 0.800 | 0.86 | 1.12 | 451 | 0.96 | 0.502 | 0.84 | 1.09 | ||||||||
| 3 | 478 | 1.00 | 0.955 | 0.88 | 1.14 | 508 | 1.05 | 0.484 | 0.92 | 1.19 | ||||||||||
| 4 | 482 | 1.05 | 0.477 | 0.92 | 1.20 | 1.002 | 0.483 | 0.996 | 1.008 | 464 | 0.98 | 0.798 | 0.86 | 1.12 | 1.002 | 0.606 | 0.995 | 1.008 | ||
| M | 2 | 298 | 0.95 | 0.565 | 0.81 | 1.12 | 278 | 0.89 | 0.154 | 0.76 | 1.05 | |||||||||
| 3 | 296 | 0.94 | 0.463 | 0.80 | 1.11 | 330 | 1.02 | 0.765 | 0.88 | 1.20 | ||||||||||
| 4 | 290 | 0.98 | 0.798 | 0.83 | 1.15 | 0.999 | 0.741 | 0.991 | 1.006 | 274 | 0.90 | 0.225 | 0.76 | 1.07 | 0.998 | 0.620 | 0.990 | 1.006 | ||
| W | 2 | 169 | 1.05 | 0.682 | 0.84 | 1.31 | 173 | 1.10 | 0.417 | 0.88 | 1.36 | |||||||||
| 3 | 182 | 1.14 | 0.234 | 0.92 | 1.42 | 178 | 1.10 | 0.379 | 0.89 | 1.37 | ||||||||||
| 4 | 192 | 1.21 | 0.091 | 0.97 | 1.50 | 1.009 | 0.081 | 0.999 | 1.019 | 190 | 1.15 | 0.199 | 0.93 | 1.43 | 1.009 | 0.097 | 0.998 | 1.019 | ||
| Cerebrovascular Diseases (430–438) | M + W | 2 | 1078 | 0.98 | 0.565 | 0.90 | 1.06 | 1040 | 0.95 | 0.279 | 0.88 | 1.04 | ||||||||
| 3 | 1087 | 0.99 | 0.790 | 0.91 | 1.08 | 1112 | 1.00 | 0.908 | 0.91 | 1.08 | ||||||||||
| 4 | 1083 | 0.99 | 0.861 | 0.91 | 1.08 | 1.002 | 0.451 | 0.998 | 1.006 | 1090 | 0.98 | 0.614 | 0.90 | 1.07 | 1.001 | 0.763 | 0.997 | 1.005 | ||
| M | 2 | 501 | 0.92 | 0.157 | 0.81 | 1.04 | 483 | 0.89 | 0.058 | 0.78 | 1.00 | |||||||||
| 3 | 525 | 0.96 | 0.514 | 0.85 | 1.09 | 545 | 0.97 | 0.605 | 0.86 | 1.09 | ||||||||||
| 4 | 486 | 0.92 | 0.183 | 0.81 | 1.04 | 0.997 | 0.374 | 0.992 | 1.003 | 481 | 0.89 | 0.064 | 0.78 | 1.01 | 0.996 | 0.220 | 0.990 | 1.002 | ||
| W | 2 | 577 | 1.04 | 0.564 | 0.92 | 1.17 | 557 | 1.02 | 0.730 | 0.91 | 1.15 | |||||||||
| 3 | 562 | 1.02 | 0.751 | 0.91 | 1.15 | 567 | 1.02 | 0.715 | 0.91 | 1.15 | ||||||||||
| 4 | 597 | 1.07 | 0.272 | 0.95 | 1.21 | 1.005 | 0.054 | 1.000 | 1.011 | 609 | 1.07 | 0.262 | 0.95 | 1.21 | 1.005 | 0.103 | 0.999 | 1.010 | ||
| Stroke (434,435,437,446) | M + W | 2 | 603 | 0.92 | 0.164 | 0.83 | 1.03 | 581 | 0.91 | 0.107 | 0.81 | 1.02 | ||||||||
| 3 | 626 | 0.96 | 0.441 | 0.86 | 1.07 | 647 | 0.98 | 0.731 | 0.88 | 1.10 | ||||||||||
| 4 | 608 | 0.94 | 0.308 | 0.84 | 1.06 | 1.000 | 0.931 | 0.994 | 1.005 | 613 | 0.94 | 0.262 | 0.84 | 1.05 | 0.999 | 0.744 | 0.994 | 1.004 | ||
| M | 2 | 251 | 0.87 | 0.102 | 0.73 | 1.03 | 247 | 0.87 | 0.115 | 0.73 | 1.03 | |||||||||
| 3 | 287 | 0.98 | 0.785 | 0.83 | 1.15 | 296 | 1.00 | 0.991 | 0.85 | 1.18 | ||||||||||
| 4 | 266 | 0.95 | 0.529 | 0.80 | 1.12 | 0.999 | 0.824 | 0.991 | 1.007 | 266 | 0.94 | 0.476 | 0.79 | 1.12 | 0.999 | 0.757 | 0.991 | 1.007 | ||
| W | 2 | 352 | 0.97 | 0.679 | 0.83 | 1.13 | 334 | 0.94 | 0.457 | 0.81 | 1.10 | |||||||||
| 3 | 339 | 0.94 | 0.446 | 0.81 | 1.10 | 351 | 0.97 | 0.650 | 0.83 | 1.12 | ||||||||||
| 4 | 342 | 0.94 | 0.431 | 0.81 | 1.10 | 1.000 | 0.934 | 0.993 | 1.007 | 347 | 0.94 | 0.394 | 0.80 | 1.09 | 0.999 | 0.878 | 0.992 | 1.007 | ||
| MORTALITY (Period 2001–2012) | ||||||
|---|---|---|---|---|---|---|
| Cause (Code ICD-IX) | Gender | Class of Exposure | Night | Day | ||
| +/- | Trend | +/- | Trend | |||
| Diseases of the Circulatory System (390–459)-CVD | M + W | 2 | ||||
| 3 | + | + | ||||
| 4 | + | t | + | t | ||
| W | 2 | |||||
| 3 | + | + | ||||
| 4 | + | t | + | t | ||
| Ischaemic Heart Diseases (410–414)-IHD | W | 2 | ||||
| 3 | ||||||
| 4 | t | t | ||||
| Cerebrovascular Diseases (430–438) | W | 2 | ||||
| 3 | + | + | ||||
| 4 | ||||||
| HOSPITALIZATION (Period 2001–2014) | ||||||
| Cause (Code ICD-IX) | Sex | Class of Exposure | Night | Day | ||
| +/- | Trend | +/- | Trend | |||
| Diseases of the Circulatory System (390–459)-CVD | M | 2 | ||||
| 3 | ||||||
| 4 | - | |||||
| W | 2 | |||||
| 3 | ||||||
| 4 | + | t | + | t | ||
| Ischaemic Heart Diseases (410–414)-IHD | M + W | 2 | ||||
| 3 | ||||||
| 4 | - | |||||
| M | 2 | |||||
| 3 | ||||||
| 4 | - | - | ||||
| Acute Myocardial Infarction (410)-AMI | W | 2 | ||||
| 3 | ||||||
| 4 | + | t | t | |||
| Cerebrovascular Diseases (430–438) | M | 2 | ||||
| 3 | ||||||
| 4 | - | |||||
| W | 2 | |||||
| 3 | ||||||
| 4 | t | |||||
Publisher’s Note: MDPI stays neutral with regard to jurisdictional claims in published maps and institutional affiliations. |
© 2022 by the authors. Licensee MDPI, Basel, Switzerland. This article is an open access article distributed under the terms and conditions of the Creative Commons Attribution (CC BY) license (https://creativecommons.org/licenses/by/4.0/).
Share and Cite
Bustaffa, E.; Curzio, O.; Donzelli, G.; Gorini, F.; Linzalone, N.; Redini, M.; Bianchi, F.; Minichilli, F. Risk Associations between Vehicular Traffic Noise Exposure and Cardiovascular Diseases: A Residential Retrospective Cohort Study. Int. J. Environ. Res. Public Health 2022, 19, 10034. https://doi.org/10.3390/ijerph191610034
Bustaffa E, Curzio O, Donzelli G, Gorini F, Linzalone N, Redini M, Bianchi F, Minichilli F. Risk Associations between Vehicular Traffic Noise Exposure and Cardiovascular Diseases: A Residential Retrospective Cohort Study. International Journal of Environmental Research and Public Health. 2022; 19(16):10034. https://doi.org/10.3390/ijerph191610034
Chicago/Turabian StyleBustaffa, Elisa, Olivia Curzio, Gabriele Donzelli, Francesca Gorini, Nunzia Linzalone, Marco Redini, Fabrizio Bianchi, and Fabrizio Minichilli. 2022. "Risk Associations between Vehicular Traffic Noise Exposure and Cardiovascular Diseases: A Residential Retrospective Cohort Study" International Journal of Environmental Research and Public Health 19, no. 16: 10034. https://doi.org/10.3390/ijerph191610034
APA StyleBustaffa, E., Curzio, O., Donzelli, G., Gorini, F., Linzalone, N., Redini, M., Bianchi, F., & Minichilli, F. (2022). Risk Associations between Vehicular Traffic Noise Exposure and Cardiovascular Diseases: A Residential Retrospective Cohort Study. International Journal of Environmental Research and Public Health, 19(16), 10034. https://doi.org/10.3390/ijerph191610034