Article

Current and Future Potential of Shellfish and Algae Mariculture Carbon Sinks in China

1
Nanjing Institute of Environmental Sciences, Ministry of Ecology and Environment, Nanjing 210042, China
2
School of Environmental Science and Engineering, Nanjing University of Information Science and Technology, Nanjing 210044, China
3
College of Environment, Hohai University, Nanjing 210024, China
*
Author to whom correspondence should be addressed.
Int. J. Environ. Res. Public Health 2022, 19(14), 8873; https://doi.org/10.3390/ijerph19148873
Submission received: 20 April 2022 / Revised: 28 June 2022 / Accepted: 18 July 2022 / Published: 21 July 2022

Abstract

:
Shellfish and algae mariculture make up an important part of the marine fishery carbon sink. Carbon sink research is necessary to ensure China achieves its goal of carbon neutrality. This study used the material quality assessment method to estimate the carbon sink capacity of shellfish and algae. Product value, carbon storage value, and oxygen release value were used to calculate the economic value of shellfish and algae carbon sequestration. The results showed that the annual average shellfish and algae carbon sink in China was 1.10 million tons from 2003 to 2019, of which shellfish accounted for 91.63%, wherein Crassostrea gigas, Ruditapes philippinarum, and Chlamys farreri were the main contributors. The annual average economic value of China’s shellfish and algae carbon sequestration was USD 71,303.56 million, and the product value was the main contributor, accounting for 99.11%. The carbon sink conversion ratios of shellfish and algae were 8.37% and 5.20%, respectively, thus making shellfish the aquaculture species with the strongest carbon sink capacity and the greatest carbon sink potential. The estimated growth rate in the shellfish and algae removable carbon sink was 33,900 tons/year in China, but this trend was uncertain. The capacity for carbon sequestration and exchange by aquaculture can be improved by expanding breeding space, promoting multi-level comprehensive breeding modes, and marine artificial upwelling projects.

1. Introduction

Global warming is one of the most pressing challenges faced by the sustainable development of human societies, and its root cause is carbon emissions [1]. The Paris Agreement sets a long-term temperature goal of holding the global average temperature increase to well below 2 °C, and efforts are underway to limit this to 1.5 °C above pre-industrial levels [2,3]. Global strategies to achieve the goal of carbon neutralization involve both reducing emissions and increasing CO2 sinks [4].
The ocean is the largest carbon sink on Earth and plays an important role in regulating global climate change [5]. Marine carbon sequestration involves various processes, activities, and mechanisms that absorb CO2 from the atmosphere and fix it in the ocean, retained in marine sediments and organisms. The mechanisms driving the marine carbon sink mainly include physical and biological pumps. The physical pump is mainly dependent on natural processes, e.g., ocean currents, wind, pH, etc., and there is little potential to increase carbon flux through artificial means [6,7]. The biological pump refers to the biological activities that affect “blue carbon”, the carbon stored in marine ecosystems, a system where there is great potential for artificial development. To date, biological carbon storage mechanisms have been broken down into two major categories: the biological pump (BP) and microbial carbon pump (MCP) [8,9,10]. Based on the biological carbon storage mechanisms underlying BP and MCP, good progress has been made in technologies designed to enhance carbon sinks, such as increasing the fishery carbon sink [11,12].
Fisheries have integrated biological carbon sequestration strategies that improve their carbon sink function and emphasize the development of a low-carbon economy [13,14]. Marine primary production is a process in which photosynthetic marine organisms assimilate CO2 into organic matter using light energy. As a primary producer, algae are the initial link and a key component of the marine carbon cycle [15]. Algae convert inorganic carbon from seawater into organic carbon through photosynthesis and absorb nutrients to build their own structures [16]. Algae play important roles in the oceanic carbon sink in two ways. Firstly, through the absorption of dissolved CO2, algae can reduce the partial pressure of CO2, shifting the carbon chemical equilibrium and accelerating the dissolution of atmospheric CO2 into seawater. Secondly, the absorption of nutrients by algae during growth can improve the pH of surface seawater in an aquaculture area and reduce the partial pressure of CO2, further facilitating the diffusion of atmospheric CO2 into seawater. Similarly, filter-feeding shellfish acquire carbon from the ocean through calcification and feeding [17,18]. The marine fishery is essentially an “industrialized blue carbon” pool that serves as a “removable carbon sink”; that is, it promotes the biological absorption of CO2 in water bodies using fishery activities and effectively removes that carbon upon the harvesting of the mariculture organisms. Today, numerous assessment methods exist to quantify removable carbon sinks, including the material quality assessment method [19], remote sensing estimation method [20], model simulation method [21], etc., among which the material quality assessment method is widely used because of its convenience of application and high accuracy. In addition to their carbon sink functions, the culture of marine shellfish and algae also serve environmental supply and regulation functions. Most studies accounting for the economic value accounting of carbon sequestration have focused on the narrow concept of a carbon sink’s economic value, that is, the market value of CO2 storage increment generated by marine biological, abiotic, and other marine activities. Generally, the product value and oxygen release value have been ignored [22,23]. As an ecological resource, the value composition of a marine fishery carbon sink has much in common with the production value composition of an ecosystem [24,25], and its product value, carbon storage value, and oxygen release value should be considered an inseparable whole.
China’s mariculture industry is the largest in the world and plays an important role in coping with climate change. In the present study, first, the carbon sink capacities of shellfish and algae were estimated using the material quality assessment method based on fishery statistics in China from 2003 to 2019. Second, an economic value accounting of shellfish and algae carbon sinks was established based on the accounting method of ecosystem GDP. Third, the economic value of the shellfish and algae carbon sinks was comprehensively calculated using indicators including product value, carbon storage value, and oxygen release value. Fourth, the carbon sink potentials of shellfish and algae cultures were evaluated. Finally, ways to expand the carbon sink capacities of shellfish and algae cultures were proposed with the aim of providing a reference that will help countries fulfill their commitment to carbon neutrality, actively participate in global carbon emission control, and achieve sustainable development.

2. Materials and Methods
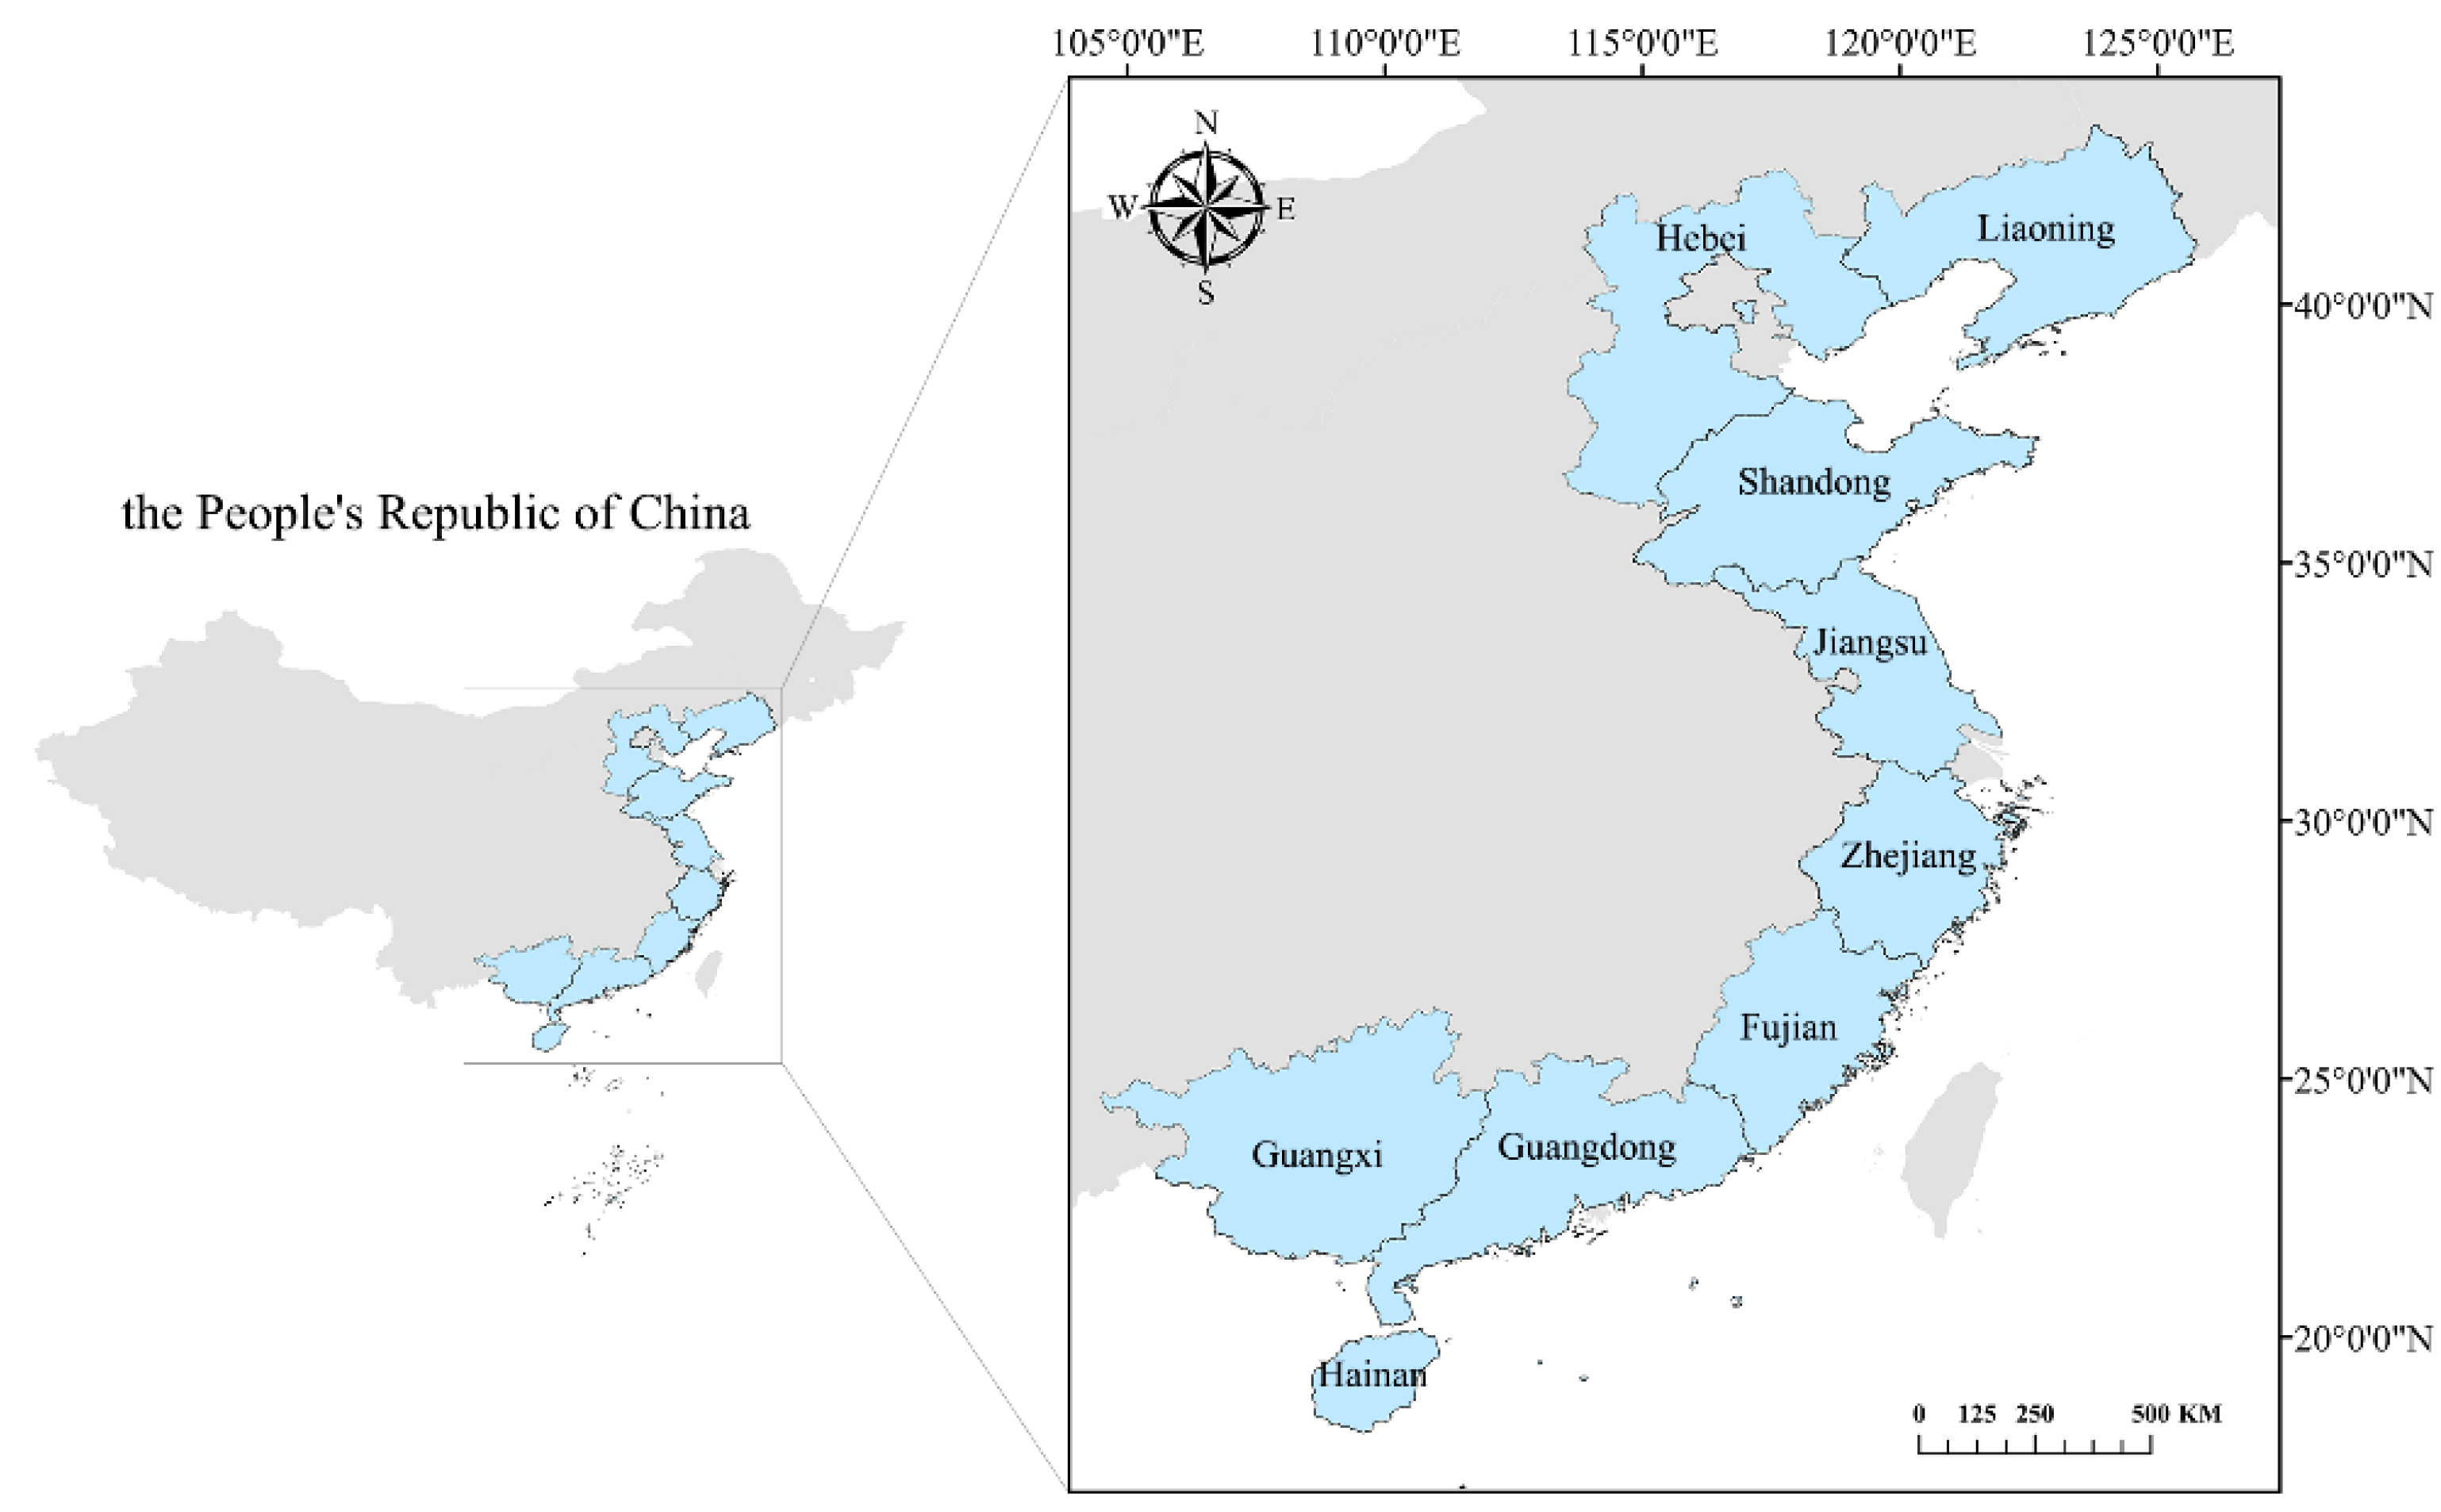
2.1. Data Sources

Data on shellfish and algae mariculture output in China from 2003 to 2019 were taken from the statistical yearbook of China’s fisheries issued by the Ministry of Agriculture and Rural Areas of the People’s Republic of China.
According to the availability of data, this study excluded Hong Kong, Macao, and the Taiwan Province of China. In the statistical yearbook of China’s fisheries, the outputs of shellfish and algae mariculture in Shanghai and Tianjin were 0; therefore, based on the validity of the data, this study also excluded Shanghai and Tianjin. In total, this study retained the data from 9 provinces, including Jiangsu Province, Shandong Province, etc. (Figure 1). Mariculture in China mainly includes fish, shellfish, crustaceans, algae, and others. The mariculture carbon sink in this study was simplified to mainly include shellfish and algae because the bait is used in the cultures of fish and crustaceans, while carbon sink fisheries are non-bait fisheries. The species of shellfish used in mariculture include Crassostrea gigas, Abalone, Busycon canaliculatu, Scapharca subcrenata, Mytilus edulis, Pinna rudis Linnaeus, Chlamys farreri, Ruditapes philippinarum, and Sinonovacula constricta, while those of algae include Laminaria japonica, Undaria pinnatifida Suringar, Porphyra, Gracilaria ferox, Eucheuma muricatum, Gelidium amansii Lamouroux, Hizikia fusiforme, and Enteromorpha prolifra.
The economic value of the shellfish and algae carbon sink from 2003 to 2019 was calculated using the exchange rate of USD to RMB in 2019 (1:6.88). According to the statistics of the National Fisheries Technology Extension Center and the China Society of Fisheries, the average market price of mariculture products in China in 2019 was RMB 43.3/kg, or USD 6.30/kg. Due to the lack of market prices of shellfish and algae from 2003 to 2018, the “production price index of mariculture products” in the Yearbook of China’s Agricultural Product Price Survey published by the National Bureau of Statistics of the People’s Republic of China was used as the price index for derivation and calculation, taking 2003 as the base period.

2.2. Assessment of Carbon Sink Capacity of Shellfish and Algae

The carbon sink capacity of shellfish and algae was evaluated using the material quality assessment method based on the “yield–carbon sink coefficient–carbon sink” relationship of marine organisms. The assessment method for the carbon sink capacity of shellfish and algae is as follows:
C m a r i c u l t u r e = C s h e l l f i s h + C m a c r o a l g a e  
where C m a r i c u l t u r e   represents the total capacity of the carbon sink of shellfish and algae (t/year), C s h e l l f i s h represents the carbon sink capacity of shellfish (t/year), and C m a c r o a l g a e represents the carbon sink capacity of algae (t/year).
The assessment method of the carbon sink capacity of shellfish is as follows:
C s h e l l f i s h = i n ( C B i s h + C Z i s h )
where C B i s h represents carbon sink capacity of the shells of different shellfish (t/year), and C Z i s h represents carbon sink capacity of the soft tissues of different shellfish (t/year).
The assessment method of the carbon sink capacity of shellfish shells is as follows:
C B i s h = P i s h × K i s h × R i s h 1 × C F i s h 1
where P i s h represents the wet weight biomass of different shellfish (t/year), K i s h represents the conversion coefficient between wet weight and dry weight of different shellfish, R i s h 1 represents the proportion of the dry weight made up of shell dry mass for different shellfish, and C F i s h 1 represents the carbon content to dry mass ratio of the shells of different shellfish.
The assessment method of the carbon sink capacity of shellfish soft tissues is as follows:
C Z i s h = P i s h × K i s h × R i s h 2 × C F i s h 2
where R i s h 2 . represents the proportion of dry weight made up of soft tissue dry mass for different shellfish, and C F i s h 2 represents the carbon content ratio of soft tissue to dry mass of different shellfish. The assessment parameters of shellfish carbon sink capacity [13,26,27] are shown in Table 1. Abalone, which is not a filter-feeding shellfish, was not included in the calculation of the carbon sink of shellfish culture.
The assessment method of the carbon sink capacity of algae is as follows:
C m a c r o a l g a e = j n ( P j m a × K j m a × C F j m a )  
where P j m a represents the wet weight biomass of different algae (t/year), K j m a   represents the conversion coefficients between wet weight and dry weight for different algae, and C F j m a represents the carbon content ratio of the dry mass of shells of different algae. The assessment parameters of algae carbon sink capacity [13,28,29,30] are shown in Table 2.

2.3. Accounting for the Economic Value of the Shellfish and Algae Carbon Sinks

The mariculture of shellfish and algae serves multiple functions, acting as supplies of oxygen and commercial products, as a carbon sink, and as a regulator of the carbon system equilibrium. The economic value of the shellfish and algae aquaculture can be divided into the value of the product, the carbon storage value, and the value of the oxygen released by algae during growth, which can be estimated using the ecosystem GDP accounting method. The accounting method for determining the economic value of the shellfish and algae carbon sink is as follows:
V m a r i c u l t u r e = V p + V c + V o
where V m a r i c u l t u r e represents the overall economic value of the shellfish and algae carbon sink of (USD/year), V p represents the product value (USD/year), V c represents the carbon storage value (USD/year), and V o   represents oxygen release value (USD/year).
The market value method adopted to determine product values is as follows:
V p = i n ( Q i × P i )
where Q i represents the yield of a specific shellfish or algae (t/year), and P i represents the market price of that shellfish or algae (USD/t). This study adopted the market prices of mariculture products.
The market value method for assessing carbon storage values is as follows:
V c = C m a r i c u l t u r e × k 1 × P C
where k 1 represents the mass conversion coefficient between carbon and CO2 (44/12), and P C represents the carbon tax rate proposed by the Swedish government (USD 150/t).
The alternative cost method adopted for the value of oxygen release is as follows:
V o = C m a c r o a l g a e × k 2 × C I
where C m a c r o a l g a e represents the carbon sink capacity of algae (t/year), k 2 represents the mass conversion coefficient of carbon and oxygen (32/12), and C I represents the cost of industrial oxygen production (USD/t), which is calculated according to the oxygen production cost of PSA oxygen production equipment (USD 122/t) [31].

3. Results

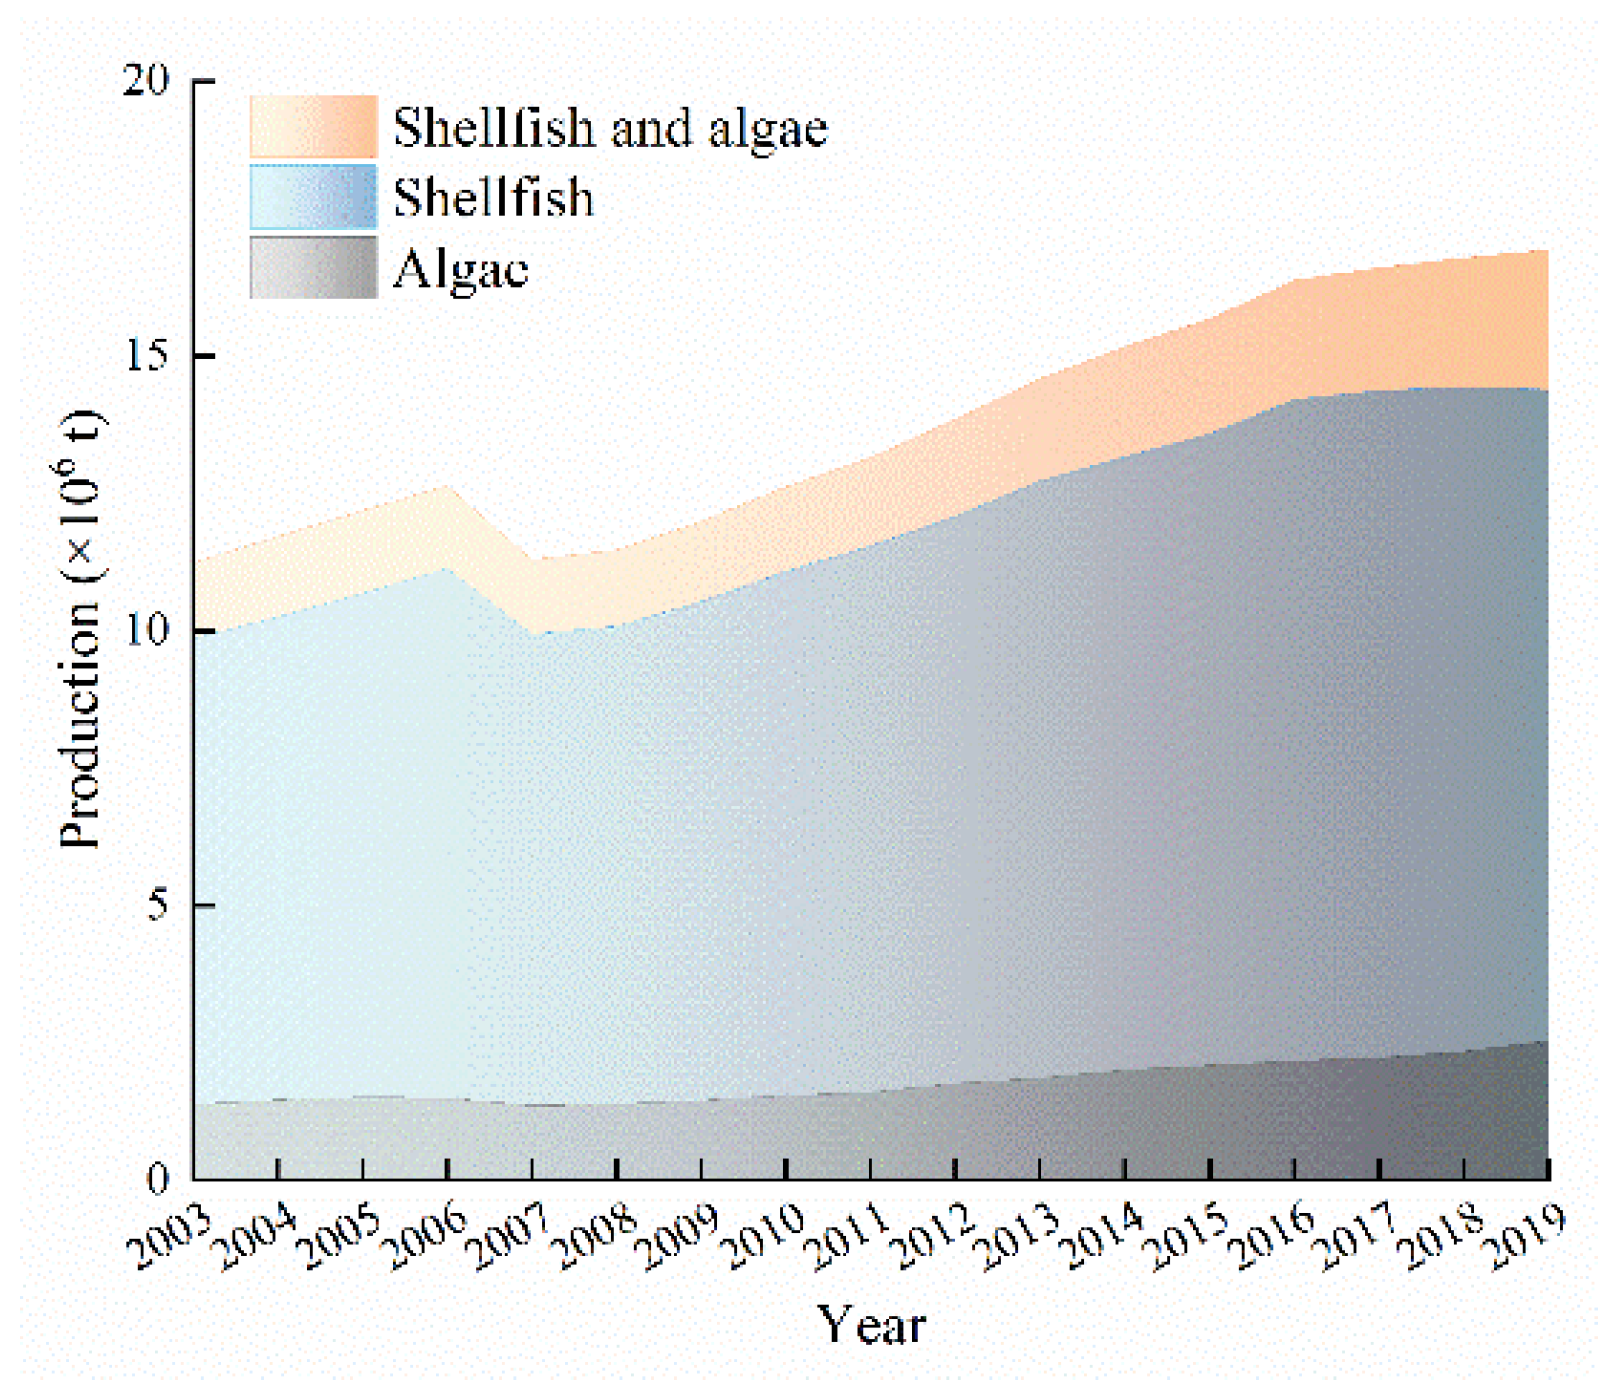
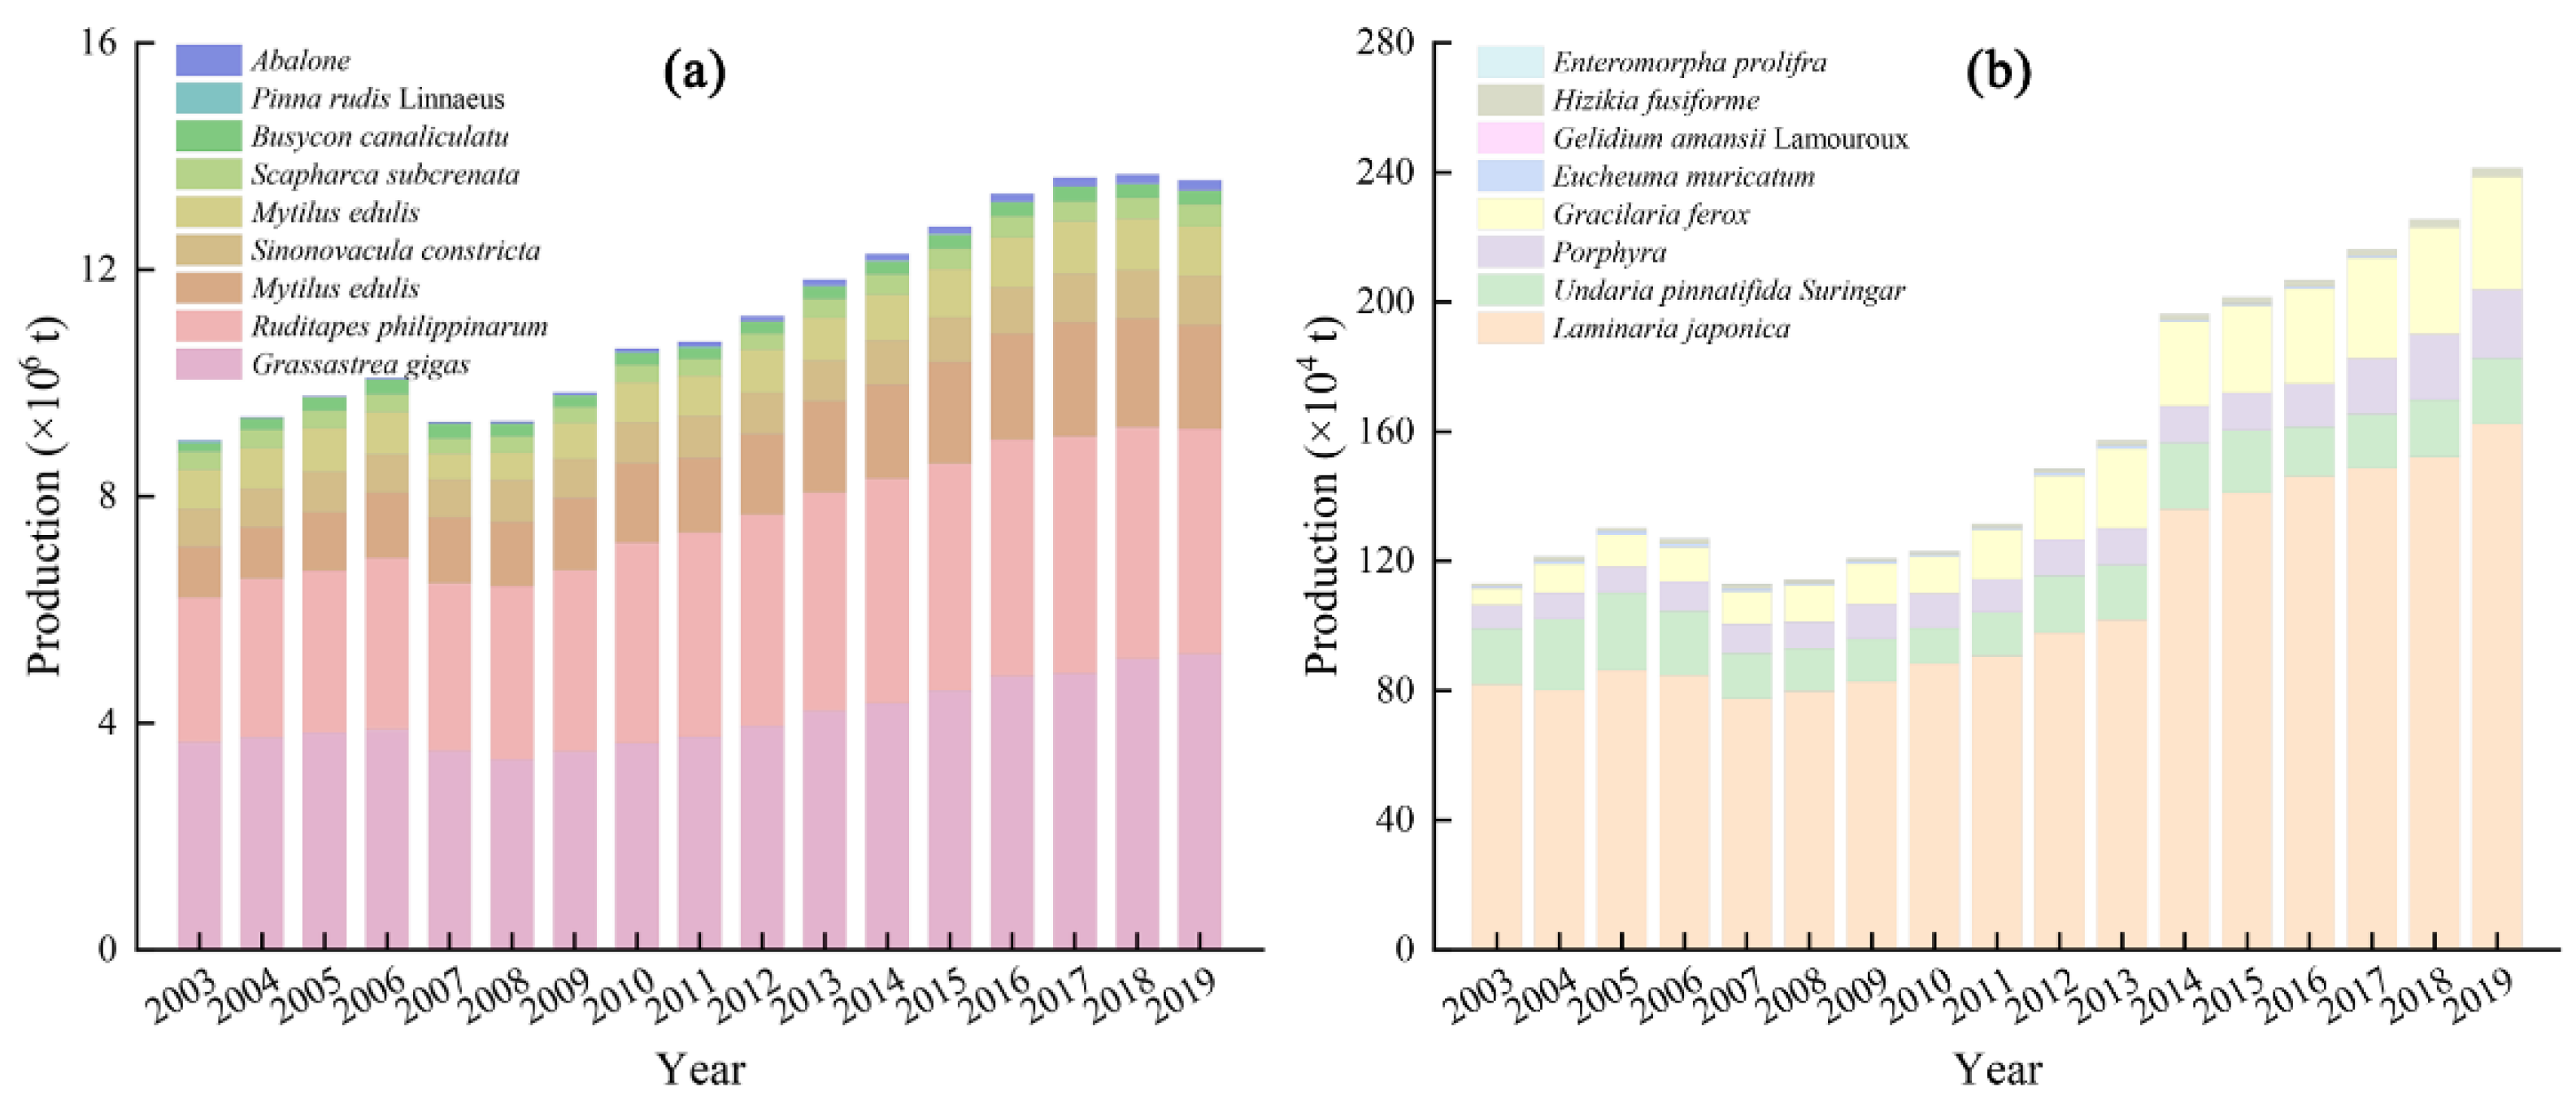
3.1. Status of Shellfish and Algae Culture

The cumulative output of shellfish and algae mariculture in China from 2003 to 2019 exceeded 230 million tons and had an average annual output of 13.78 million tons (Figure 2), increasing by 50.65% from 2003 (11.24 million tons) to 2019 (16.93 million tons). With the exception of 2007, the output increased by varying degrees year after year from 2003 to 2019 with annual growth rates ranging from 0.86% to 5.35% and an average annual growth rate of 3.55%. The highest annual growth rates occurred from 2005 to 2006 and from 2009 to 2014, both of which exceeded 4.00%. Multiple extreme weather events occurred in the coastal areas of China in 2007, including a warm winter and abnormally high temperatures, drought, snow disaster, and extreme temperate storm surge. Specifically, the most serious temperate storm surge disaster to occur in China since 1969 occurred in the Bohai and the Yellow Sea on 3 March 2007, resulting in a 10.64% decrease in the total output of shellfish and algae mariculture, compared with the previous year.
Shellfish mariculture made up the majority of the total output of shellfish and algae mariculture, with an annual average proportion of 87.35%. From 2003 to 2019, the cumulative output of shellfish mariculture in China exceeded 200 million tons, with an average annual output of 12.03 million tons. Crassostrea gigas, Ruditapes philippinarum, and Chlamys farreri were the main species of marine shellfish culture in China (Figure 3a) and together amounted to 80.81% of the total shellfish output.
The average annual output of algae mariculture in China from 2003 to 2019 was 1.78 million tons, accounting for 12.65% of the total output of shellfish and algae mariculture. Laminaria japonica, Undaria pinnatifida Suringar, Porphyra, and Gracilaria ferox were the main algae species cultured in China (Figure 3b) and together accounted for 98.55% of the total output of algae, with Laminaria japonica being most popular and accounting for 68.44% of the algae output.

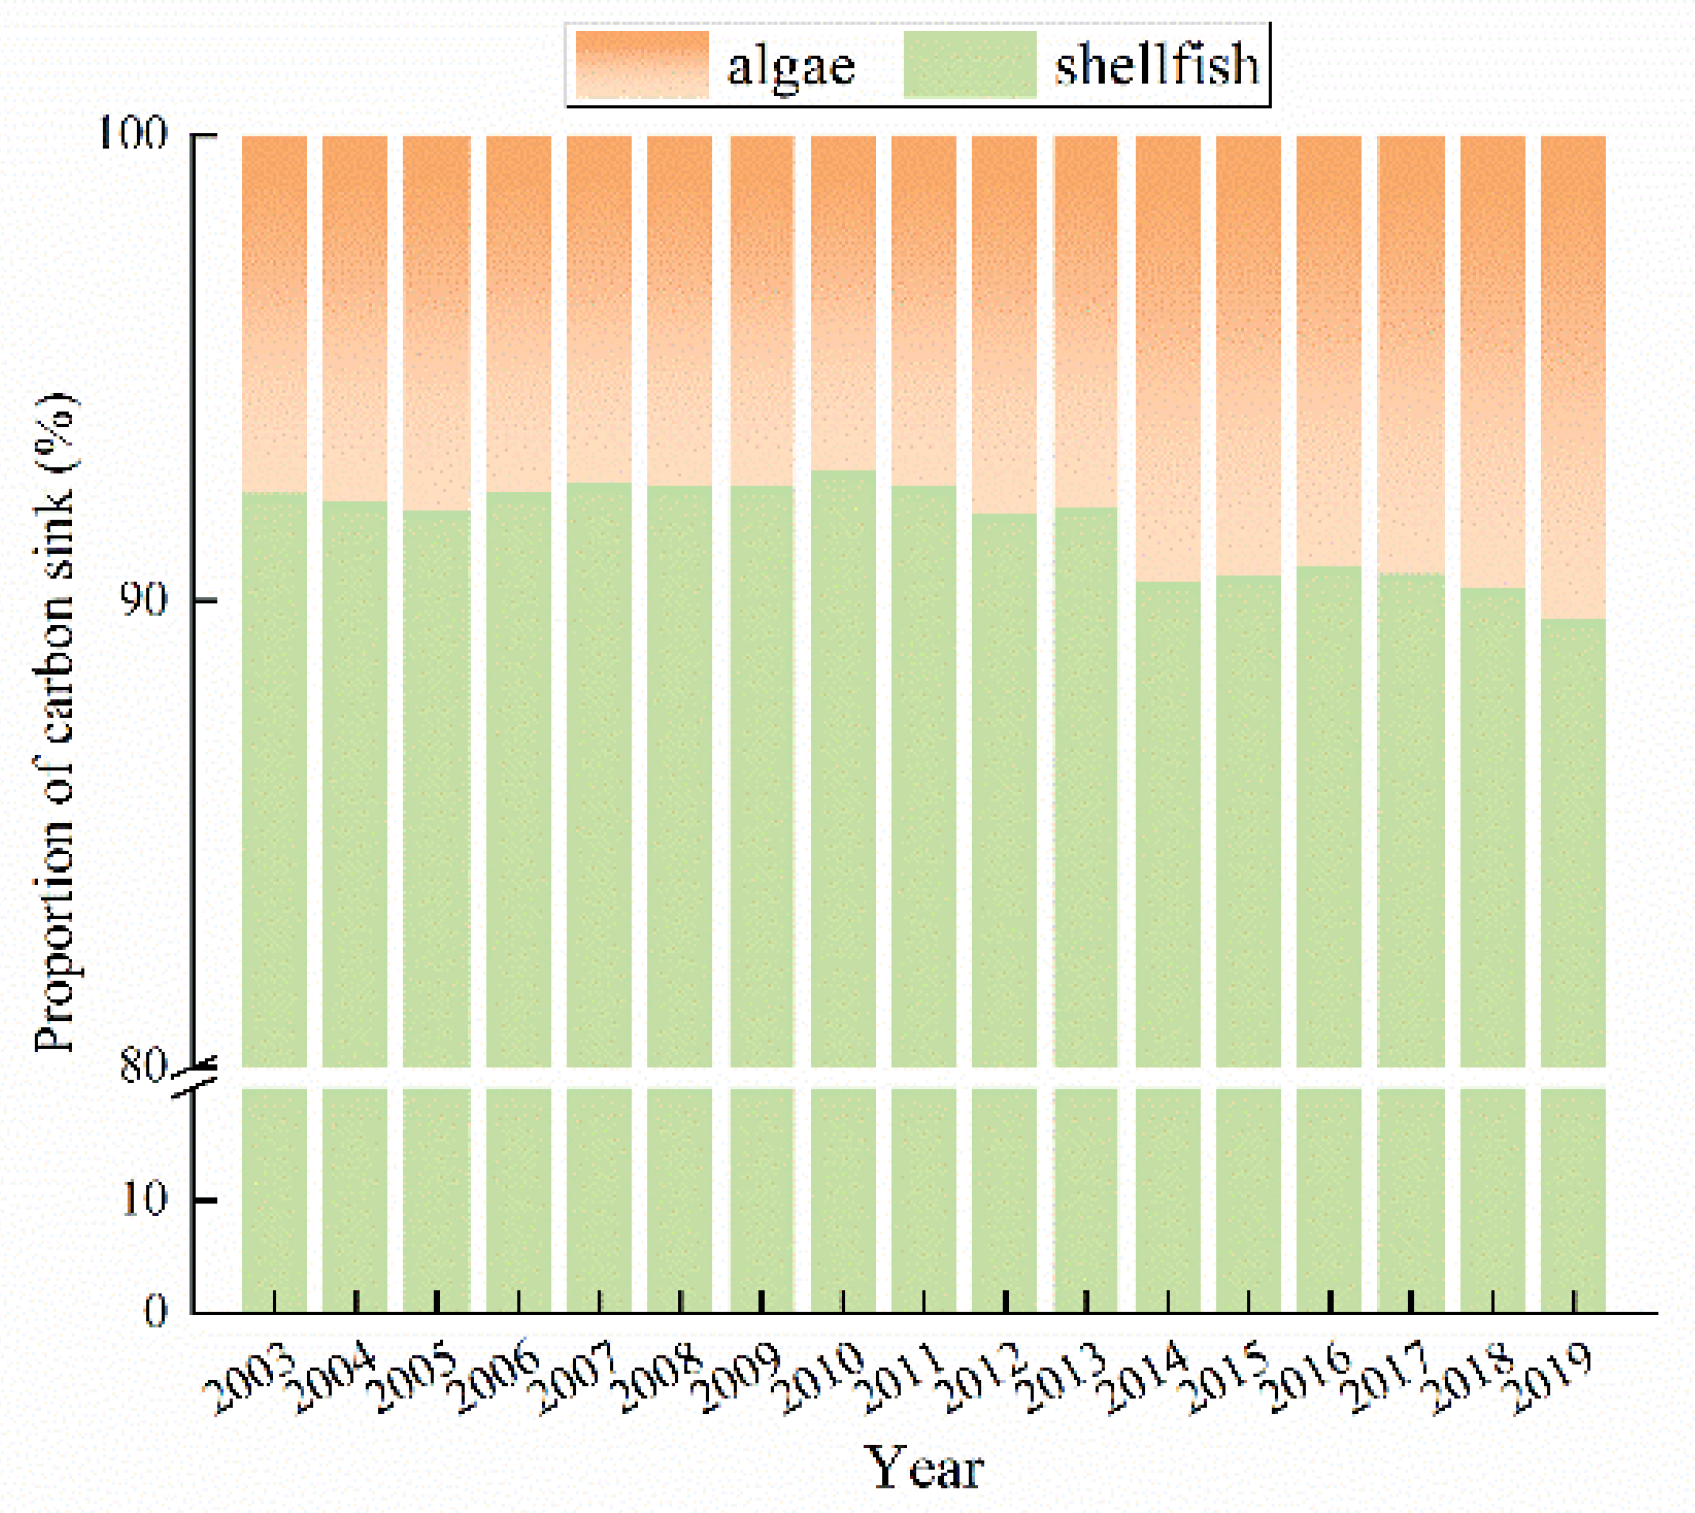
3.2. Carbon Sink Capacity of Shellfish and Algae Mariculture

In total, shellfish and algae mariculture in China from 2003 to 2019 represented a carbon sink that accumulated more than 18 million tons, with an average annual carbon sink of 1.10 million tons (Figure 4). Furthermore, the annually sequestered carbon increased by 54.1% over the study period, from 893,400 tons in 2003 to 1,360,500 tons in 2019. Generally, the carbon sink increased in size each year from 2003 to 2019, except for a period of fluctuation from 2006 to 2010.
Shellfish dominated the total carbon sink comprising shellfish and algae mariculture, accounting for 91.63% of the annual average carbon sequestered; however, this proportion decreased from 2014 to 2019 and dropped to 89.61% in 2019. Conversely, the proportion of the carbon sink contributed by algae mariculture increased from 2014 to 2019. Consistent with the proportion of output, Crassostrea gigas, Ruditapes philippinarum, and Chlamys farreri were the main contributors to the shellfish carbon sink. They represented average annual carbon sinks of 394,900 tons, 224,200 tons, and 147,100 tons, respectively, and their average annual contributions were 39.36%, 22.32%, and 14.44%. Laminaria japonica was the main algal contributor to the carbon sink, responsible for 72.05% on average of all algal sequestration, and sequestering 67,500 tons of carbon on average each year.

3.3. Economic Value of the Shellfish and Algae Carbon Sinks

The cumulative economic value of the shellfish and algae carbon sink in China from 2003 to 2019 exceeded USD 1,210,000 million, and the annual average economic value of the carbon sink was USD 71,303.56 million (Table 3). The economic value of the shellfish and algae carbon sink increased by 201.29%, from USD 35,143.61 million in 2003 to USD 106,637.33 million in 2019, and showed a stable growth trend year after year, except for in 2007. Product value was the main contributor to the total economic value of the carbon sink with an annual average proportion of 99.11%, while the average annual proportions of the carbon storage and oxygen release values were 0.85% and 0.04%, respectively.

4. Discussion

4.1. Carbon Sink Conversion Efficiency of Shellfish and Algae

The shellfish and algae mariculture in China output an average of 13.78 million tons from 2003 to 2019 and represented an average annual carbon sink of 1.10 million tons. These values indicated that there was a problem in the carbon sink conversion efficiency. The conversion ratio of a carbon sink is not only an important basis on which to measure carbon sink capacity but also a comprehensive embodiment of carbon sink technology and the sustainability of the mariculture industry [19,32,33]. In mariculture, when the practices and technologies for carbon separation, fixation, and recovery are developed and enriched, less carbon is lost, and the carbon sink conversion ratio and carbon sink capacity are increased. For example, at the marine biological farm in Shandong Province, China, to maximize its carbon sink role, save breeding space, and improve the quality and output of aquatic products, they use optimized three-dimensional breeding spaces and layered breeding practices. Specifically, the surface layer is used for the in situ restoration of an ecological floating bed, the middle layer is used for raising fish and shrimp, and shellfish and algae are cultured in the bottom layer [34].
The carbon sink conversion ratio of shellfish and algae mariculture in this study was defined as the ratio of the shellfish and algae carbon sink to their total output. The carbon sink calculation in this study can be seen as a removable carbon sink based on aquaculture output and the carbon content in aquaculture organisms, without considering the feed cost and energy cost of shellfish and algae mariculture. The CO2 emissions per unit of protein produced by marine shellfish and algae culture generally compare favorably with most livestock production and some wild-caught fisheries. The lower emission intensity is mostly attributable to a more favorable feed conversion ratio [11]. The primary mariculture organisms in China include macroalgae and filter-feeding shellfish, which do not feed or feed at a low trophic level, making their culture structures relatively stable. In terms of energy costs, “blue” biofuels, such as seaweed biofuels, do not compete for resources with agriculture, as they do not require arable land, freshwater or fertilizer, or herbicide or pesticide applications and are, therefore, in many respects, more environmentally sustainable than current biofuels derived from land crops, which can be considered as another form of emission and energy reduction [16]. Meanwhile, the calculation of removable carbon sink does not consider the process by which shellfish and algae are consumed by consumers. In the case of algae, if used for food, they are quickly reconverted to CO2 and energy, preventing long-term carbon sinks [14]. However, algae-based food systems can replace food or feed production systems with intense CO2 emission footprints because they have much lower life-cycle CO2 emissions. For shellfish, the shell is usually discarded when tissue is consumed and respired, and these shells act as long-term carbon stores.
The carbon sink conversion ratios of shellfish and algae from 2003 to 2019 in China were 8.37% and 5.20%, respectively, which is mainly caused by the fundamental differences in their biological structures [35,36]. As aquatic plants, the conversion coefficient of algae between wet weight and dry weight is 20% because they have higher water content than shellfish; furthermore, their carbon contents are relatively low. For mollusks, soft tissues generally account for less than 10% of the total weight, and they have a high dry weight ratio, large total weight ratio, and high carbon content, leading to a higher carbon sink conversion efficiency than algae. Due to the massive scale of marine aquaculture and the high carbon sink conversion ratio of shellfish, the shellfish aquaculture industry has grown to have the largest carbon sink capacity and greatest potential in China. Notably, the most important factor affecting the carbon sink conversion ratio in aquaculture is how the culture is structured with different marine organisms. Although the algae culture structure has a lower carbon sink conversion ratio, algae play roles in improving water quality, providing oxygen, and facilitating the growth of aquatic animals, and their ecological service and positive external effect on the environment cannot be ignored [37,38]. Therefore, increasing the scale of shellfish and algae mariculture will guarantee the improvement of the mariculture carbon sink [13]. On this basis, optimizing the mariculture structure can further maximize the carbon sink capacity of mariculture.

4.2. Carbon Sink Potential of Shellfish and Algae

The linear trend in the carbon sink capacity of shellfish and algae mariculture year after year was analyzed to evaluate the future carbon sink potential of shellfish and algae mariculture in China (Figure 5a). The slope of the trend line indicated that the shellfish and algae carbon sink grew by 33,900 tons/year, with the growth rates of shellfish and algae being 28,100 tons/year and 4700 tons/year, respectively. In 2020, China promised to adopt more effective policies and measures that strive for peak CO2 emissions by 2030 and to achieve carbon neutrality by 2060. It is assumed that the growth rate of shellfish and algae mariculture production in China will be stable over the next few decades, and as such, the shellfish and algae carbon sink in China will grow to 1,751,700 tons/year in 2030, representing a 27.02% increase over 2019. Over that same period, the forest area of China will reach 196.21 × 10⁶ hectares, with a carbon sink capacity of 230.15 million tons/year [39], so it can be calculated that the carbon sink from harvesting shellfish and algae in 2030 will be equivalent to the carbon fixed by 0.15 × 10⁶ hectares of forest. The carbon sink capacity of wetlands in China is 315.76 tons per hectare [40], which means that the carbon sink achieved by harvesting shellfish and algae in 2030 will be equivalent to the carbon fixed by 5546.93 hectares of wetlands. In 2060, the shellfish and algae carbon sink in China will be 2.77 million tons/year, an increase of 100.88% compared with 2019.
The total output of shellfish and algae mariculture (Figure 5b) and the market price of mariculture products (Figure 5c) were also predicted assuming steady growth. The linear slope indicated that the total output of shellfish and algae mariculture in China increased by 395,100 tons/year. In 2030, the total output of shellfish and algae in China will be 21.29 million tons/year, a 25.75% increase over 2019. In 2060, the total output of shellfish and algae in China will be 33.14 million tons/year, a 95.78% increase over 2019. The market prices of mariculture products in 2030 and 2060 were predicted to be USD 9.02 and USD 15.39, respectively. These prices assumed that the carbon tax rate, cost of industrial oxygen production, and the exchange rate of USD against RMB will remain unchanged. The value of the shellfish and algae carbon sink in 2030 and 2060 will be USD 191,978.44 million and USD 510,046.47 million, respectively. Moreover, the carbon storage value in 2030 and 2060 will be USD 963.42 million and USD 1523.57 million, respectively, and the oxygen release value will be USD 59.49 million and USD 105.35 million, respectively. The economic value of the shellfish and algae carbon sink in 2030 and 2060 will be USD 193,001.35 million and USD 511,675.39 million, respectively. These trends indicate that the potential of the shellfish and algae carbon sink in China is huge and can bring considerable economic benefits and make an important contribution to the grand goal of carbon neutralization in China.
The carbon sink calculation in this study was based on the biomass of harvested shellfish and algae mariculture products, which can be seen as a removable carbon sink based on aquaculture output and the carbon content in aquaculture organisms [41]. The removable carbon sink of algae mainly comes in the form of biomass carbon fixed via photosynthesis, while that of shellfish mainly refers to the calcium carbonate shells and soft tissues formed during shellfish growth. In fact, the carbon fixed by shellfish and algae mariculture includes three main forms: the removable carbon sink, the carbon that remains in seawater in the forms of particulate organic carbon (POC) and dissolved organic carbon (DOC), and carbon buried in sediments [42].
Detrital organic carbon produced during algal growth can be a food source for other organisms through the natural food chain, deposited and buried on the seafloor, or transported to the deep sea through direct sedimentation [43,44,45]. DOC and POC released by macroalgae during growth can enter the food web or form recalcitrant DOC (RDOC) through microbial cycling, which will remain in seawater for a long time [46,47]. Marine shellfish have a great impact on the biogeochemical cycle of carbon because they interact with phytoplankton, particulate organic debris, seawater carbonate system, sedimentation, and burial through the processes of filtration, respiration, calcification, and biological deposition [48]. Cultured shellfish use carbon in the ocean in two main ways: directly converting the HCO 3 in seawater into CaCO3 for shells through calcification and through the synthesis of their own body mass by filtering POC (phytoplankton, microzooplankton, organic debris, microorganisms, etc.) from the water body. Unused organic carbon settles on the seafloor in the form of fecal particles, which accelerates the transportation of organic carbon to the seafloor [49]. Therefore, carbon can be removed from seawater both by harvesting cultured shellfish and through the BP and carbonate pump driven by cultured shellfish. The mechanisms underlying the shellfish and algae mariculture carbon sink are extremely complex [6,7,8,9,10] and have recently been proposed to involve the traditional solubility pump, carbonate pump, BP, and MCP. The fishery carbon sink represented by cultured shellfish and algae has been studied from the initial “removable carbon sink” to the deposition and burial of POC and the formation of RDOC in water. The study of the organic carbon pool in coastal aquaculture areas is particularly important for human beings when exploring the “missing carbon sink” in shallow water [50]. However, scientific measurement methods for the shellfish and algae carbon sink have not yet been fully formed [51,52], so in the present study, we only considered “removable carbon sink”, which, in fact, underestimates the shellfish and algae carbon sink.

4.3. Amplification of Carbon Sink Capacity of Shellfish and Algae

Although carbon sequestration by shellfish and algae culture appears to be growing, it is undeniable that the culture structure and scale of shellfish and algae are subject to various fluctuating factors such as climate, niche, space, and demand, which results in uncertainty in predicting carbon sequestration in the future [16,23]. In particular, conflicts between the industry’s need for space and marine wetland ecological restoration [53] and conservation in coastal provinces, as well as competition with other forms of mariculture, will limit the potential for shellfish and algae culture structure and its development, thereby affecting the potential growth in the carbon sink capacity in the future. However, this study shows that expanding carbon sequestration via shellfish and algae culture should be prioritized because it is an environmentally important industry that produces in-demand products and is economically profitable [48].
The carbon sequestration pathways in an aquaculture environment mainly include the burial of POC from BP processes in the sediment of the aquaculture area, RDOC formed by MCP processes, and carbon deposition into the deep sea [42,46,47]. There are various ways to improve carbon sequestration. For example, the activities of BP and MCP can be enhanced via artificial upwelling and comprehensive culture of shellfish and algae, which will subsequently improve carbon sequestration in offshore and estuarine culture areas. Within the scope of the mariculture industry, there are numerous approaches that can improve the shellfish and algae carbon sink.
(1)
Expand breeding space and improve breeding yield
The amount of removable carbon accumulated in shellfish and algae culture is positively correlated with the yield of cultured shellfish and algae per unit area and the carbon content per organism. Therefore, increasing the yield per unit area and screening for shellfish and algae with higher individual carbon contents are potential ways to improve carbon sequestration. By breeding varieties with high carbon sequestration rates, improving breeding technology and mode, and making rational and efficient use of sea breeding areas, the yield per unit area can be increased, which will increase the amount of removable carbon per unit area. Furthermore, breeding strains that can break out of their conventional growth environments possibly strains with wider temperature tolerance ranges, would broaden the potential growing regions for specific species. This would be another effective way to increase the potential carbon sequestration capacity of shellfish and algae mariculture [54].
(2)
Promote multi-trophic-level, comprehensive breeding models
In a reasonable proportion of shellfish and algae polyculture systems, algae not only absorb nitrogen, phosphorus, and other nutrients released by shellfish metabolism but also absorb CO2 released by shellfish respiration. Shellfish feed by filtering phytoplankton, algal debris, and litter from the seawater. This benefits commercial algae species in two ways: It purifies the water, thus increasing water illumination and providing more energy for algal growth, and it prevents phytoplankton from competing with algae for nutrients, which is conducive to the growth and carbon accumulation of cultured algae [55,56]. Through this shellfish–algae interaction, the carbon sink function of the whole integrated culture system is greatly improved, compared with single species cultures [57,58].
(3)
Implementation of artificial marine upwelling exchange enhancement project
The application of artificial upwelling technology to transport excess nutrients from deep water to surface waters can fully meet the requirements for photosynthetic carbon sequestration and the growth of algae [59]. Appropriate nutrient concentrations not only increase the output of seaweed but also improve the comprehensive effect of the biological and microbial carbon pumps, so as to increase the offshore carbon sink. As a geoengineering system, artificial upwelling can continuously transport the deep-water layer from below the true light layer into the euphotic zone where algal growth can occur. When saline seawater is brought to the true light layer, it not only increases the total nutrient concentrations but also compensates for imbalances in the proportions of nitrogen, phosphorus, silicon, and iron caused by biological growth, utilization, and release. These nutrients are conducive to photosynthesis by algae and phytoplankton, which increases production and the aquaculture carbon sink, as well as the organic carbon output to the deep sea by increasing the efficiency of the biological pump [60,61].
In addition to technology, policies should be implemented to guide market players to expand the scale of shellfish and algae breeding, support innovative breeding modes, improve the degree of intensive breeding, actively explore the diversification of shellfish and algae processing, improve storage and consumption modes, and cultivate and expand the consumer market for shellfish and algae products. At the same time, we should carry out research on the pricing mechanisms and standard formulations of fishery carbon sequestration and explore the establishment of a fishery carbon sequestration listing and trading system to promote the paid ecological service of aquaculture fishery carbon sequestration and realize the full carbon sequestration potential of these marine fisheries.

5. Conclusions

Based on the “yield–carbon sink coefficient–carbon sink” relationship of marine organisms, in this study, we evaluated the capacity and potential of the shellfish and algae carbon sink in China. The economic value of shellfish and algae carbon sink was comprehensively calculated using important indicators, i.e., product value, carbon storage value, and oxygen release value. Shellfish contributed 91.63% to the total shellfish and algae carbon sink. The main shellfish species were Crassostrea gigas, Ruditapes philippinarum, and Chlamys farreri, contributing averages of 39.36%, 22.32%, and 14.44% to the annual carbon sequestration capacity, respectively. The annual average economic value of the shellfish and algae carbon sink in China was USD 71,303.56 million, and the product value constituted most of the total, accounting for 99.11% on average. The carbon sink conversion ratios of shellfish and algae in China were 8.37% and 5.20%, respectively, which meant that the shellfish aquaculture industry had the strongest carbon sink capacity in China, along with the greatest growth potential. The growth rate of the removable carbon sink of shellfish and algae culture in China was 33,900 tons/year during the study period, but this trend is not guaranteed. In the future, the capacity for carbon sequestration and exchange by aquaculture practices can be improved by expanding breeding spaces, promoting multi-level, comprehensive breeding modes, and marine artificial upwelling projects. This study provides an important reference that will help countries realize carbon neutrality commitment, as well as actively drive movement toward global carbon emission governance and sustainable development.

Author Contributions

Conceptualization, Q.L.; data curation, Q.L.; formal analysis, Q.L.; investigation, M.Y.; methodology, F.H.; resources, A.Z.; supervision, A.Z.; validation, J.M. and M.Y.; visualization, D.P.; writing—original draft preparation, Q.L.; writing—review and editing, J.M. and F.H. All authors have read and agreed to the published version of the manuscript.

Funding

This research was funded by the Ecological Environment Scientific Research Project of Jiangsu Province (No. JSZC-G2021-291), Major Science and Technology Program for Water Pollution Control and Treatment (No. 2017ZX07301006), The Special basic research service for the Central Level Public Welfare Research Institute (No. GYZX210517), and The Special Fund of Chinese Central Government for Basic Scientific Research Operations in Commonweal Research Institute (No. GYZX220405).

Institutional Review Board Statement

Not applicable.

Informed Consent Statement

Not applicable.

Data Availability Statement

The data and software generated or used during the study appear in the submitted article.

Acknowledgments

We would like to express our deepest thanks to Linkai Huang and Jian Shui for their assistance during data collection and collation.

Conflicts of Interest

The authors declare no conflict of interest. The funders had no role in the design of the study; in the collection, analyses, or interpretation of data; in the writing of the manuscript; or in the decision to publish the results.

References

  1. Frame, D.J. Assessment of the first consensus prediction on climate change. Nat. Clim. Change 2013, 3, 357–359. [Google Scholar] [CrossRef]
  2. Schleussner, C.; Rogelj, J.; Schaeffer, M.; Lissner, T.; Licker, R.; Fischer, E.M.; Knutti, R.; Levermann, A.; Frieler, K.; Hare, W. Science and policy characteristics of the Paris Agreement temperature goal. Nat. Clim. Change 2016, 6, 827–835. [Google Scholar] [CrossRef] [Green Version]
  3. Peters, G.P.; Andrew, R.M.; Canadell, J.G.; Fuss, S.; Jackson, R.B.; Korsbakken, J.I.; Le Quéré, C.; Nakicenovic, N. Key indicators to track current progress and future ambition of the Paris Agreement. Nat. Clim. Change 2017, 7, 118–122. [Google Scholar] [CrossRef]
  4. Wan, B.; Tian, L.; Fu, M.; Zhang, G. Green development growth momentum under carbon neutrality scenario. J. Clean. Prod. 2021, 316, 128327. [Google Scholar] [CrossRef]
  5. Macreadie, P.I. The future of Blue Carbon science. Nat. Commun. 2019, 10, 3998. [Google Scholar] [CrossRef] [Green Version]
  6. Pautova, L.A. The biological calcium carbonate pump in the Norwegian and Barents Seas; regulation mechanisms. Dokl. Earth Sci. 2020, 490, 46–50. [Google Scholar] [CrossRef]
  7. Hamme, R.C. Using noble gases to assess the ocean’s carbon pumps. Annu. Rev. Mar. Sci. 2019, 11, 75–103. [Google Scholar] [CrossRef]
  8. Barange, M. The cost of reducing the north atlantic ocean biological carbon pump. Front. Mar. Sci. 2017, 3, 290. [Google Scholar] [CrossRef] [Green Version]
  9. Jiao, N. Microbial production of recalcitrant dissolved organic matter: Long-term carbon storage in the global ocean. Nat. Rev. Microbiol. 2010, 8, 593–599. [Google Scholar] [CrossRef] [Green Version]
  10. Chisholm, S.W. Stirring times in the Southern Ocean. Nature 2000, 407, 685–686. [Google Scholar] [CrossRef]
  11. Jones, A.R.; Alleway, H.K.; McAfee, D.; Reis-Santos, P.; Theuerkauf, S.J.; Jones, R.C. Climate-friendly seafood: The potential for emissions reduction and carbon capture in marine aquaculture. Bioscience 2022, 72, 123–143. [Google Scholar] [CrossRef] [PubMed]
  12. Ahmed, N.; Ward, J.D.; Thompson, S.; Saint, C.P.; Diana, J.S. Blue-green water nexus in aquaculture for resilience to climate change. Rev. Fish. Sci. Aquac. 2018, 26, 139–154. [Google Scholar] [CrossRef]
  13. Ren, W. Study on the removable carbon sink estimation and decomposition of influencing factors of mariculture shellfish and algae in China—A two-dimensional perspective based on scale and structure. Environ. Sci. Pollut. Res. 2021, 28, 21528–21539. [Google Scholar] [CrossRef] [PubMed]
  14. Zhang, Y.; Zhang, J.; Liang, Y.; Li, H.; Li, G.; Chen, X.; Zhao, P.; Jiang, Z.; Zou, D.; Liu, X.; et al. Carbon sequestration processes and mechanisms in coastal mariculture environments in China. Sci. China Earth Sci. 2017, 60, 2097–2107. [Google Scholar] [CrossRef]
  15. Pessarrodona, A. Carbon assimilation and transfer through kelp forests in the NE Atlantic is diminished under a warmer ocean climate. Glob. Change Biol. 2018, 24, 4386–4398. [Google Scholar] [CrossRef] [Green Version]
  16. Duarte, C.M.; Wu, J.; Xiao, X.; Bruhn, A.; Krause-Jensen, D. Can seaweed farming play a role in climate change mitigation and adaptation? Front. Mar. Sci. 2017, 4, 100. [Google Scholar] [CrossRef]
  17. Fodrie, F.J. Oyster reefs as carbon sources and sinks. Proc. R. Soc. B Biol. Sci. 2017, 284, 20170891. [Google Scholar] [CrossRef]
  18. Bertolini, C.; Bernardini, I.; Brigolin, D.; Matozzo, V.; Milan, M.; Pastres, R. A bioenergetic model to address carbon sequestration potential of shellfish farming: Example from Ruditapes philippinarum in the Venice lagoon. ICES J. Mar. Sci. 2021, 78, 2082–2091. [Google Scholar] [CrossRef]
  19. Hu, C.; Wang, M.; Lapointe, B.E.; Brewton, R.A.; Hernandez, F.J. On the Atlantic pelagic Sargassum’s role in carbon fixation and sequestration. Sci. Total Environ. 2021, 781, 146801. [Google Scholar] [CrossRef]
  20. Wang, M.; Hu, C.; Cannizzaro, J.; English, D.; Han, X.; Naar, D.; Lapointe, B.; Brewton, R.; Hernandez, F. Remote Sensing of Sargassum Biomass, Nutrients, and Pigments. Geophys. Res. Lett. 2018, 45, 12359–12367. [Google Scholar] [CrossRef]
  21. Mueller, K. Differing methods of accounting ocean carbon sequestration efficiency. J. Geophys. Res. 2004, 109, C12018. [Google Scholar] [CrossRef] [Green Version]
  22. Suplicy, F.M. A review of the multiple benefits of mussel farming. Rev. Aquacult. 2020, 12, 204–223. [Google Scholar] [CrossRef]
  23. Filgueira, R.; Guyondet, T.; Bacher, C.; Comeau, L.A. Informing Marine Spatial Planning (MSP) with numerical modelling: A case-study on shellfish aquaculture in Malpeque Bay (Eastern Canada). Mar. Pollut. Bull. 2015, 100, 200–216. [Google Scholar] [CrossRef] [Green Version]
  24. Song, J.; Zhang, Z.; Chen, L.; Wang, D.; Liu, H.; Wang, Q.; Wang, M.; Yu, D. Changes in ecosystem services values in the south and north Yellow Sea between 2000 and 2010. Ocean. Coast. Manag. 2021, 202, 105497. [Google Scholar] [CrossRef]
  25. Soloviy, I.; Kuryltsiv, R.; Hernik, J.; Kryshenyk, N.; Kuleshnyk, T. Integrating ecosystem services valuation into land use planning: Case of the ukrainian agricultural landscapes. Forests 2021, 12, 1465. [Google Scholar] [CrossRef]
  26. Zan, X.; Xu, B.; Zhang, C.; Ren, Y. Annual variations of biogenic element contents of manila clam (Ruditapes philippinarum) bottom-cultivated in Jiaozhou Bay, China. J. Ocean Univ. China 2014, 13, 637–646. [Google Scholar] [CrossRef]
  27. Lapointe, B.E.; Littler, M.M.; Littler, D.S. Nutrient availability to marine macroalgae versus carbonate-rich coastal waters in siliciclastic. Estuaries 1992, 15, 75–82. [Google Scholar] [CrossRef]
  28. Ge, C.; Wang, H.; Kan, M.; Chai, Y. Carbon sequestration within silica bodies extracted from kelp cultured in the East China Sea. Silicon Neth 2017, 9, 613–618. [Google Scholar] [CrossRef]
  29. Schiener, P.; Black, K.D.; Stanley, M.S.; Green, D.H. The seasonal variation in the chemical composition of the kelp species Laminaria digitata, Laminaria hyperborea, Saccharina latissima and Alaria esculenta. J. Appl. Phycol. 2015, 27, 363–373. [Google Scholar] [CrossRef]
  30. Aller-Rojas, O.; Moreno, B.; Aponte, H.; Zavala, J. Carbon storage estimation of Lessonia trabeculata kelp beds in Southern Peru: An analysis from the San Juan de Marcona region. Carbon Manag. 2020, 11, 525–532. [Google Scholar] [CrossRef]
  31. Šulc, R.; Ditl, P. A technical and economic evaluation of two different oxygen sources for a small oxy-combustion unit. J. Clean. Prod. 2021, 309, 127427. [Google Scholar] [CrossRef]
  32. Paraguay-Delgado, F.; Carreno-Gallardo, C.; Estrada-Guel, L.; Zabala-Arceo, A.; Alexander Martinez-Rodriguez, H.; Lardizabal-Gutierrez, D. Pelagic Sargassum spp. capture CO2 and produce calcite. Environ. Sci. Pollut. Res. 2020, 27, 25794–25800. [Google Scholar] [CrossRef] [PubMed]
  33. Muller-Karger, F.E. The importance of continental margins in the global carbon cycle. Geophys. Res. Lett. 2005, 32, L01602. [Google Scholar] [CrossRef] [Green Version]
  34. Sun, L.; Liu, H.; Gao, Y.; Jiang, Z.; Lin, F.; Chang, L.; Zhang, Y. Food web structure and ecosystem attributes of integrated multi-trophic aquaculture waters in Sanggou Bay. Aquacult. Rep. 2020, 16, 100279. [Google Scholar] [CrossRef]
  35. Clark, M.S.; Peck, L.S.; Arivalagan, J.; Backeljau, T.; Berland, S.; Cardoso, J.C.R.; Caurcel, C.; Chapelle, G.; De Noia, M.; Dupont, S.; et al. Deciphering mollusc shell production: The roles of genetic mechanisms through to ecology, aquaculture and biomimetics. Biol. Rev. 2022, 95, 1812–1837. [Google Scholar] [CrossRef] [PubMed]
  36. Gundersen, H. Variation in population structure and standing stocks of kelp along multiple environmental gradients and implications for ecosystem services. Front. Mar. Sci 2021, 8, 578629. [Google Scholar] [CrossRef]
  37. Theuerkauf, S.J.; Barrett, L.T.; Alleway, H.K.; Costa Pierce, B.A.; St. Gelais, A.; Jones, R.C. Habitat value of bivalve shellfish and seaweed aquaculture for fish and invertebrates: Pathways, synthesis and next steps. Rev. Aquacult. 2022, 14, 54–72. [Google Scholar] [CrossRef]
  38. Zheng, Y.; Jin, R.; Zhang, X.; Wang, Q.; Wu, J. The considerable environmental benefits of seaweed aquaculture in China. Stoch. Environ. Res. Risk Assess. 2019, 33, 1203–1221. [Google Scholar] [CrossRef]
  39. Zhang, C.; Ju, W.; Chen, J.; Fang, M.; Wu, M.; Chang, X.; Wang, T.; Wang, X. Sustained biomass carbon sequestration by China’s forests from 2010 to 2050. Forests 2018, 9, 689. [Google Scholar] [CrossRef] [Green Version]
  40. Xiao, D.; Deng, L.; Kim, D.G.; Huang, C.; Tian, K. Carbon budgets of wetland ecosystems in China. Glob. Change Biol. 2019, 25, 2061–2076. [Google Scholar] [CrossRef]
  41. Jiao, N.; Liang, Y.; Zhang, Y.; Liu, J.; Zhang, Y.; Zhang, R.; Zhao, M.; Dai, M.; Zhai, W.; Gao, K.; et al. Carbon pools and fluxes in the China Seas and adjacent oceans. Sci. China Earth Sci. 2018, 61, 1535–1563. [Google Scholar] [CrossRef]
  42. Gao, G.; Gao, L.; Jiang, M.; Jian, A.; He, L. The potential of seaweed cultivation to achieve carbon neutrality and mitigate deoxygenation and eutrophication. Environ. Res. Lett. 2022, 17, 14018. [Google Scholar] [CrossRef]
  43. Pedersen, M.F. Carbon sequestration potential increased by incomplete anaerobic decomposition of kelp detritus. Mar. Ecol. Prog. Ser. 2021, 660, 53–67. [Google Scholar] [CrossRef]
  44. Krause-Jensen, D. Substantial role of macroalgae in marine carbon sequestration. Nat. Geosci. 2016, 9, 737–742. [Google Scholar] [CrossRef]
  45. Bourque, A.S. Impacts of physical disturbance on ecosystem structure in subtropical seagrass meadows. Mar. Ecol. Prog. Ser. 2015, 540, 27–41. [Google Scholar] [CrossRef] [Green Version]
  46. Jiao, N.; Robinson, C.; Azam, F.; Thomas, H.; Baltar, F.; Dang, H.; Hardman-Mountford, N.J.; Johnson, M.; Kirchman, D.L.; Koch, B.P.; et al. Mechanisms of microbial carbon sequestration in the ocean: Future research directions. Biogeosciences 2014, 11, 5285–5306. [Google Scholar] [CrossRef] [Green Version]
  47. Kieber, D.J.; Keene, W.C.; Frossard, A.A.; Long, M.S.; Maben, J.R.; Russell, L.M.; Kinsey, J.D.; Tyssebotn, I.M.B.; Quinn, P.K.; Bates, T.S. Coupled ocean-atmosphere loss of marine refractory dissolved organic carbon. Geophys. Res. Lett. 2016, 43, 2765–2772. [Google Scholar] [CrossRef] [Green Version]
  48. Tang, Q.; Zhang, J.; Fang, J. Shellfish and seaweed mariculture increase atmospheric CO2 absorption by coastal ecosystems. Mar. Ecol. Prog. Ser. 2011, 424, 97–104. [Google Scholar] [CrossRef] [Green Version]
  49. Crawford, C.M.; Macleod, C.K.A.; Mitchell, I.M. Effects of shellfish farming on the benthic environment. Aquaculture 2003, 224, 117–140. [Google Scholar] [CrossRef] [Green Version]
  50. Paine, E.R.; Schmid, M.; Boyd, P.W.; Diaz Pulido, G.; Hurd, C.L. Rate and fate of dissolved organic carbon release by seaweeds: A missing link in the coastal ocean carbon cycle. J. Phycol. 2021, 57, 1375–1391. [Google Scholar] [CrossRef]
  51. Lovelock, C.E. Dimensions of Blue Carbon and emerging perspectives. Biol. Lett. 2019, 15, 20180781. [Google Scholar] [CrossRef] [PubMed]
  52. Gagern, A.; Manley, J.; Kapsenberg, L. Ocean-based carbon dioxide removal: A new frontier in the blue economy. Mar. Technol. Soc. J. 2022, 56, 40–48. [Google Scholar] [CrossRef]
  53. Lu, F.; Hu, H.; Sun, W.; Zhu, J.; Liu, G.; Zhou, W.; Zhang, Q.; Shi, P.; Liu, X.; Wu, X.; et al. Effects of national ecological restoration projects on carbon sequestration in China from 2001 to 2010. Proc. Natl. Acad. Sci. USA 2018, 115, 4039–4044. [Google Scholar] [CrossRef] [Green Version]
  54. Gjedrem, T.; Rye, M. Selection response in fish and shellfish: A review. Rev. Aquacult. 2018, 10, 168–179. [Google Scholar] [CrossRef]
  55. Li, H.; Zhang, Y.; Liang, Y.; Chen, J.; Zhu, Y.; Zhao, Y.; Jiao, N. Impacts of maricultural activities on characteristics of dissolved organic carbon and nutrients in a typical raft-culture area of the Yellow Sea, North China. Mar. Pollut. Bull. 2018, 137, 456–464. [Google Scholar] [CrossRef] [PubMed]
  56. Han, T.; Shi, R.; Qi, Z.; Huang, H.; Liang, Q.; Liu, H. Interactive effects of oyster and seaweed on seawater dissolved inorganic carbon systems: Implications for integrated multi-trophic aquaculture. Aquacult. Environ. Interact. 2017, 9, 469–478. [Google Scholar] [CrossRef] [Green Version]
  57. Zhang, J.; Wu, W.; Ren, J.S.; Lin, F. A model for the growth of mariculture kelp Saccharina japonica in Sanggou Bay, China. Aquacult. Environ. Interact. 2016, 8, 273–283. [Google Scholar] [CrossRef] [Green Version]
  58. Reid, G.K.; Lefebvre, S.; Filgueira, R.; Robinson, S.M.C.; Broch, O.J.; Dumas, A.; Chopin, T.B.R. Performance measures and models for open-water integrated multi-trophic aquaculture. Rev. Aquacult. 2019, 12, 47–75. [Google Scholar] [CrossRef]
  59. Baumann, M.; Taucher, J.; Paul, A.J.; Heinemann, M.; Vanharanta, M.; Bach, L.T.; Spilling, K.; Ortiz, J.; Aristegui, J.; Hernandez-Hernandez, N.; et al. Effect of intensity and mode of artificial upwelling on particle flux and carbon export. Front. Mar. Sci. 2021, 8, 742142. [Google Scholar] [CrossRef]
  60. Pan, Y.; Fan, W.; Huang, T.; Wang, S.; Chen, C.A. Evaluation of the sinks and sources of atmospheric CO2 by artificial upwelling. Sci. Total Environ. 2015, 511, 692–702. [Google Scholar] [CrossRef]
  61. Fan, W.; Zhang, Z.; Yao, Z.; Xiao, C.; Zhang, Y.; Zhang, Y.; Liu, J.; Di, Y.; Chen, Y.; Pan, Y. A sea trial of enhancing carbon removal from Chinese coastal waters by stimulating seaweed cultivation through artificial upwelling. Appl. Ocean Res. 2020, 101, 102260. [Google Scholar] [CrossRef]
Figure 1. Map of China’s coastal areas. The shellfish and algae mariculture production in Hong Kong, Macao, Taiwan Province, Shanghai, and Tianjin were not included due to data availability and validity concerns.
Ijerph 19 08873 g001
Figure 2. Cumulative output of shellfish and algae mariculture in China from 2003 to 2019.
Ijerph 19 08873 g002
Figure 3. Output of (a) shellfish mariculture and (b) algae mariculture in China from 2003 to 2019.
Ijerph 19 08873 g003
Figure 4. Proportion contributions to the fisheries carbon sink by shellfish and algae in China from 2003 to 2019.
Ijerph 19 08873 g004
Figure 5. (a) Linear trend of the total shellfish and algae carbon sink over time; (b) linear trend of the total shellfish and algae mariculture production over time; (c) linear trend of the production price index of mariculture products over time.
Ijerph 19 08873 g005
Table 1. Assessment parameters of shellfish carbon sink capacity.
Species K i s h   ( % ) Dry Mass Specific Gravity Carbon Contents (%)
R i s h 1   ( % ) R i s h 2   ( % ) C F i s h 1   ( % ) C F i s h 2   ( % )
Crassostrea gigas65.1093.866.1412.6845.89
Busycon canaliculatu64.2187.9112.0911.9844.99
Scapharca subcrenata64.2153.4746.5311.2945.86
Mytilus edulis75.2891.538.4711.7644.40
Pinna rudis Linnaeus64.2188.5911.4111.4443.87
Chlamys farreri63.8985.6514.3511.4043.90
Ruditapes philippinarum52.5598.021.9811.5244.90
Sinonovacula constricta70.4896.743.2613.2444.99
Table 2. Assessment parameters of algae carbon sink capacity.
Species K j m a   ( % ) C F j m a   ( % )
Laminaria japonica20.0031.20
Undaria pinnatifida Suringar20.0030.70
Porphyra20.0027.39
Gracilaria ferox20.0020.60
Others 120.0027.76
1 Other algae include Eucheuma muricatum, Gelidium amansii Lamouroux, Hizikia fusiforme, and Enteromorpha prolifra.
Table 3. Economic value of the shellfish and algae carbon sink from 2003 to 2019.
YearMarket Price of Mariculture ProductsEconomic Value/Million DollarsProduct ValueCarbon Storage ValueOxygen Release Value
Value Quantity/Million DollarsProportion /%Value Quantity/Million DollarsProportion /%Value Quantity/Million DollarsProportion/%
20033.1335,657.3735,143.6198.56491.391.3822.370.06
20043.4140,469.9939,934.9998.68511.251.2623.740.06
20053.5543,805.8143,247.3698.73532.981.2225.470.06
20063.8248,839.9448,269.1998.83546.021.1224.730.05
20074.2047,992.3047,472.3098.92498.051.0421.950.05
20084.5052,073.6751,554.2199.00497.310.9622.150.04
20094.4353,593.2153,046.0298.98523.830.9823.360.04
20104.8762,096.8661,511.4899.06561.500.9023.880.04
20115.4371,993.0171,400.7899.18566.890.7925.340.04
20125.4976,604.5975,982.6999.19593.450.7728.450.04
20135.5381,263.0380,603.5999.19629.560.7729.880.04
20145.6386,168.1285,464.4399.18666.010.7737.680.04
20155.6989,912.1189,180.5199.19692.930.7738.670.04
20165.9397,814.0697,052.3499.22722.180.7439.550.04
20176.39106,873.66106,092.2799.27740.120.6941.270.04
20186.48109,571.06108,780.9899.28747.130.6842.950.04
20196.30107,431.64106,637.3399.26748.280.7046.030.04
Total/1,212,160.441,201,374.08/10,268.89/517.47/
The average market price of mariculture products in China in 2019 was USD 6.30/kg. The “production price index of mariculture products” in the Yearbook of China’s agricultural product price survey published by the National Bureau of Statistics of the People’s Republic of China was used as the price index for deriving and calculating prices for other years, taking 2003 as the base period.
Publisher’s Note: MDPI stays neutral with regard to jurisdictional claims in published maps and institutional affiliations.

