
Investigations Concerning the Influence of Sleep Disorders on Postural Stability in Young Men


Abstract
:1. Introduction
- Patients with poor and good sleep quality will have different results on the corresponding CDP tests;
- Poor sleep quality negatively affects the functioning of the balance systems.
2. Materials and Methods
2.1. Recruitment and Selection
2.2. Measurement Procedure
2.3. Statistical Analysis
3. Results
4. Discussion
5. Conclusions
Author Contributions
Funding
Institutional Review Board Statement
Informed Consent Statement
Data Availability Statement
Conflicts of Interest
Abbreviations
| EG | experimental group |
| CG | control group |
References
- Veeramachaneni, K.; Slavish, D.C.; Dietch, J.R.; Kelly, K.; Taylor, D.J. Intraindividual Variability in Sleep and Perceived Stress in Young Adults. Sleep Health 2019, 5, 572–579. [Google Scholar] [CrossRef] [PubMed]
- Graham, C.D.; Kyle, S.D. A preliminary investigation of sleep quality in functional neurological disorders: Poor sleep appears common, and is associated with functional impairment. J. Neurol. Sci. 2017, 15, 163–166. [Google Scholar] [CrossRef] [PubMed] [Green Version]
- Maheshwari, G.; Shaukat, F. Impact of Poor Sleep Quality on the Academic Performance of Medical Students. Cureus 2019, 11, e4357. [Google Scholar] [CrossRef] [Green Version]
- Han, B.; Chen, W.Z.; Li, Y.C.; Chen, J.; Zeng, Z.Q. Sleep and hypertension. Sleep Breath. 2020, 24, 351–356. [Google Scholar] [CrossRef] [PubMed] [Green Version]
- Wu, L.; He, Y.; Jiang, B.; Liu, M.; Wang, J.; Zhang, D.; Wang, Y.; Zeng, J.; Yao, Y. Association between sleep duration and the prevalence of hypertension in an elderly rural population of China. Sleep Med. 2016, 27–28, 92–98. [Google Scholar] [CrossRef] [PubMed]
- Ogilvie, R.P.; Patel, S.R. The epidemiology of sleep and obesity. Sleep Health 2017, 3, 383–388. [Google Scholar] [CrossRef] [PubMed]
- Antza, C.; Kostopoulos, G.; Mostafa, S.; Nirantharakumar, K.; Tahrani, A. The links between sleep duration, obesity and type 2 diabetes mellitus. J. Endocrinol. 2022, 252, 125–141. [Google Scholar] [CrossRef] [PubMed]
- Bonanno, L.; Metro, D.; Papa, M.; Finzi, G.; Maviglia, A.; Sottile, F.; Corallo, F.; Manasseri, L. Assessment of sleep and obesity in adults and children. Obs. Study 2019, 98, e17642. [Google Scholar] [CrossRef]
- Xiao, M.; Huang, G.; Feng, L.; Luan, X.; Wang, Q.; Ren, W.; Chen, S.; He, J. Impact of sleep quality on post-stroke anxiety in stroke patients. Brain Behav. 2020, 10, e01716. [Google Scholar] [CrossRef]
- Redline, S.; Yenokyan, G.; Gottlieb, D.J.; Shahar, E.; O’Connor, G.T.; Resnick, H.E.; Diener-West, M.; Sanders, M.H.; Wolf, P.A.; Geraghty, E.M.; et al. Obstructive Sleep Apnea–Hypopnea and Incident Stroke. Am. J. Respir. Crit. Care Med. 2010, 182, 269–277. [Google Scholar] [CrossRef]
- Asarnow, L.D.; Mirchandaney, R. Sleep and Mood Disorders Among Youth. Child Adolesc. Psychiatr. Clin. N. Am. 2021, 30, 251–268. [Google Scholar] [CrossRef] [PubMed]
- Morphy, H.; Dunn, K.M.; Lewis, M.; Boardman, H.F.; Croft, P.F. Epidemiology of insomnia: A longitudinal study in a UK population. Sleep 2007, 30, 274–280. [Google Scholar] [PubMed] [Green Version]
- Furtado, F.; Gonçalves, B.; Abranches, I.; Abrantes, A.; Forner-Cordero, A. Chronic Low Quality Sleep Impairs Postural Control in Healthy Adults. PLoS ONE 2016, 11, e0163310. [Google Scholar] [CrossRef] [Green Version]
- Ahrberg, K.; Dresler, M.; Niedermaier, S.; Genzel, L. The interaction between sleep quality and academic performance. J. Psychiatr. Res. 2012, 46, 1618–1622. [Google Scholar] [CrossRef] [PubMed]
- Basta, D.; Rossi-Izquierdo, M.; Soto-Varela, A.; Ernst, A. Mobile posturography: Posturographic analysis of daily-life mobility. Otol. Neurotol. 2013, 34, 288–297. [Google Scholar] [CrossRef] [Green Version]
- Montesinos, L.; Castaldo, R.; Cappuccio, F.; Pecchia, L. Day-to-day variations in sleep quality affect standing balance in healthy adults. Sci. Rep. 2018, 8, 17504. [Google Scholar] [CrossRef] [PubMed]
- Vereeck, L.; Wuyts, F.; Truijen, S.; Van de Heyning, P. Clinical assessment of balance: Normative data, and gender and age effects. Int. J. Audiol. 2008, 47, 67–75. [Google Scholar] [CrossRef]
- Petró, B.; Papachatzopoulou, A.; Kiss, R.M. Devices and tasks involved in the objective assessment of standing dynamic balancing-A systematic literature review. PLoS ONE 2017, 12, e0185188. [Google Scholar]
- Visser, J.E.; Carpenter, M.G.; Van der Kooij, H.; Bloem, B.R. The clinical utility of posturography. Clin. Neurophysiol. 2008, 119, 2424–2436. [Google Scholar] [CrossRef]
- NeuroCom International. Balance Manager Systems; Clinical Interpretation Guide; NeuroCom International, Inc.: Clakamas, OR, USA, 2008. [Google Scholar]
- Fabbri, M.; Beracci, A.; Martoni, M.; Meneo, D.; Tonetti, L.; Natale, V. Measuring Subjective Sleep Quality: A Review. Int. J. Environ. Res. Public Health 2021, 18, 1082. [Google Scholar] [CrossRef]
- García, A.; Varela, A.; Pérez, S. Is it possible to shorten examination time in posture control studies? Acta Otorrinolaringol. Esp. 2015, 66, 154–158. [Google Scholar] [CrossRef]
- Al-Rasheed, A.; Ibrahim, A. Does the poor sleep quality affect the physical activity level, postural stability, and isometric muscle strength in Saudi adolescents? A comparative study. Saudi Med. J. 2020, 41, 94–97. [Google Scholar] [CrossRef] [PubMed]
- Peterka, R.J.; Loughlin, P.J. Dynamic regulation of sensorimotor integration in human postural control. J. Neurophysiol. 2004, 91, 410–423. [Google Scholar] [CrossRef] [PubMed] [Green Version]
- Feldman, A.G. The Relationship Between Postural and Movement Stability. Adv. Exp. Med. Biol. 2016, 957, 105–120. [Google Scholar]
- Batuk, I.T.; Batuk, M.O.; Aksoy, S. Evaluation of the postural balance and visual perception in young adults with acute sleep deprivation. J. Vestib. Res. 2020, 30, 383–391. [Google Scholar] [CrossRef]
- Pérez, N.; Martin, E.; Garcia-Tapia, R. Dizziness: Relating the Severity of Vertigo to the Degree of Handicap by Measuring Vestibular Impairment. Otolaryngol. Head Neck Surg. 2003, 128, 372–381. [Google Scholar] [CrossRef]
- Almojali, A.; Almalki, A.; Alothman, A.; Masuadi, E.; Alaqeel, M. The prevalence and association of stress with sleep quality among medical students. J. Epidemiol. Glob. Health 2017, 7, 169–174. [Google Scholar] [CrossRef]
- Ołpińska-Lischka, M.; Kujawa, K.; Maciaszek, J. Differences in the Effect of Sleep Deprivation on the Postural Stability among Men and Women. Int. J. Environ. Res. Public Health 2021, 18, 3796. [Google Scholar] [CrossRef]
- Fabbri, M.; Martoni, M.; Esposito, M.; Brighetti, G.; Natale, V. Postural control after a night without sleep. Neuropsychologia 2006, 44, 2520–2525. [Google Scholar] [CrossRef]
- Liaw, M.Y.; Chen, C.L.; Pei, Y.C.; Leong, C.P.; Lau, Y.C. Comparison of the static and dynamic balance performance in young, middle-aged, and elderly healthy people. Change Gung Med. J. 2009, 32, 297–304. [Google Scholar]
- Carmo Aprigio, P.S.; de Jesus, I.R.T.; Porto, C.; Lemos, T.; de Sá Ferreira, A. Lower limb muscle fatigability is not associated with changes in movement strategies for balance control in the upright stance. Hum. Mov. Sci. 2020, 70, 102588. [Google Scholar] [CrossRef] [PubMed]
- Greve, J.M.; Mutlu Cuğ, M.; Dülgeroğlu, D.; Brech, G.C.; Alonso, A. Relationship between Anthropometric Factors, Gender, and Balance under Unstable Conditions in Young Adults. Biomed Res. Int. 2013, 2013, 850424. [Google Scholar] [CrossRef] [PubMed]
- Berger, W.; Trippel, M.; Discher, M.; Dietz, V. Influence of Subjects’ Height on the Stabilization of Posture. Acta Oto-Laryngol. 1992, 112, 22–30. [Google Scholar] [CrossRef]
- Kolic, J.; O’Brien, K.; Bowles, K.A.; Iles, R.; Williams, C.M. Understanding the impact of age, gender, height and body mass index on children’s balance. Acta Paediatr. 2020, 109, 175–182. [Google Scholar] [CrossRef] [PubMed]
- Cheng, S.; Ma, J.; Sun, J.; Wang, J.; Xiao, X.; Wang, Y.; Hu, W. Differences in sensory reweighting due to loss of visual and proprioceptive cues in postural stability support among sleep-deprived cadet pilots. Gait Posture 2018, 63, 97–103. [Google Scholar] [CrossRef]
- Tanwar, T.; Veqar, Z.; Ghrouz, A.; Spence, D.; Pandi-Perumal, S. Is poor sleep quality associated with a deterioration in postural control? Sleep Sci. 2021, 14, 207–213. [Google Scholar]

| Condition | Vision | Platform | Disturbance | Using |
|---|---|---|---|---|
| SOT1 | Eyes open | Fixed | Somatosensation | |
| SOT 2 | Eyes closed | Fixed | Vision | Somatosensation |
| SOT 3 | Eyes open, Swaying visual surround | Fixed | Vision | Somatosensation |
| SOT 4 | Eyes open | Swaying | Somatosensation | Vision |
| SOT 5 | Eyes closed | Swaying | Somatosensation, Vision | Vestibular |
| SOT 6 | Eyes open, Swaying visual surround | Swaying | Somatosensation, Vision | Vestibular |
| Demographic Characteristic | CG (49 Persons) | EG (27 Persons) | |||
|---|---|---|---|---|---|
| Mean | SD | Mean | SD | p | |
| Height (cm) | 180.41 | 3.64 | 179.78 | 3.46 | 0.46 |
| Age (year) | 20.51 | 1.04 | 20.63 | 0.93 | 0.62 |
| CG | EG | ||||
|---|---|---|---|---|---|
| Test | Mean (SD) | Med (IRQ) | Mean (SD) | Med (IRQ) | p |
| ES1 [%] | 94.44 (2.42) | 95.00 (2.00) | 94.41 (1.69) | 95.00 (3.00) | 0.57 |
| ES2 [%] | 93.54 (2.38) | 94.00 (2.00) | 93.30 (2.92) | 94.00 (4.67) | 0.87 |
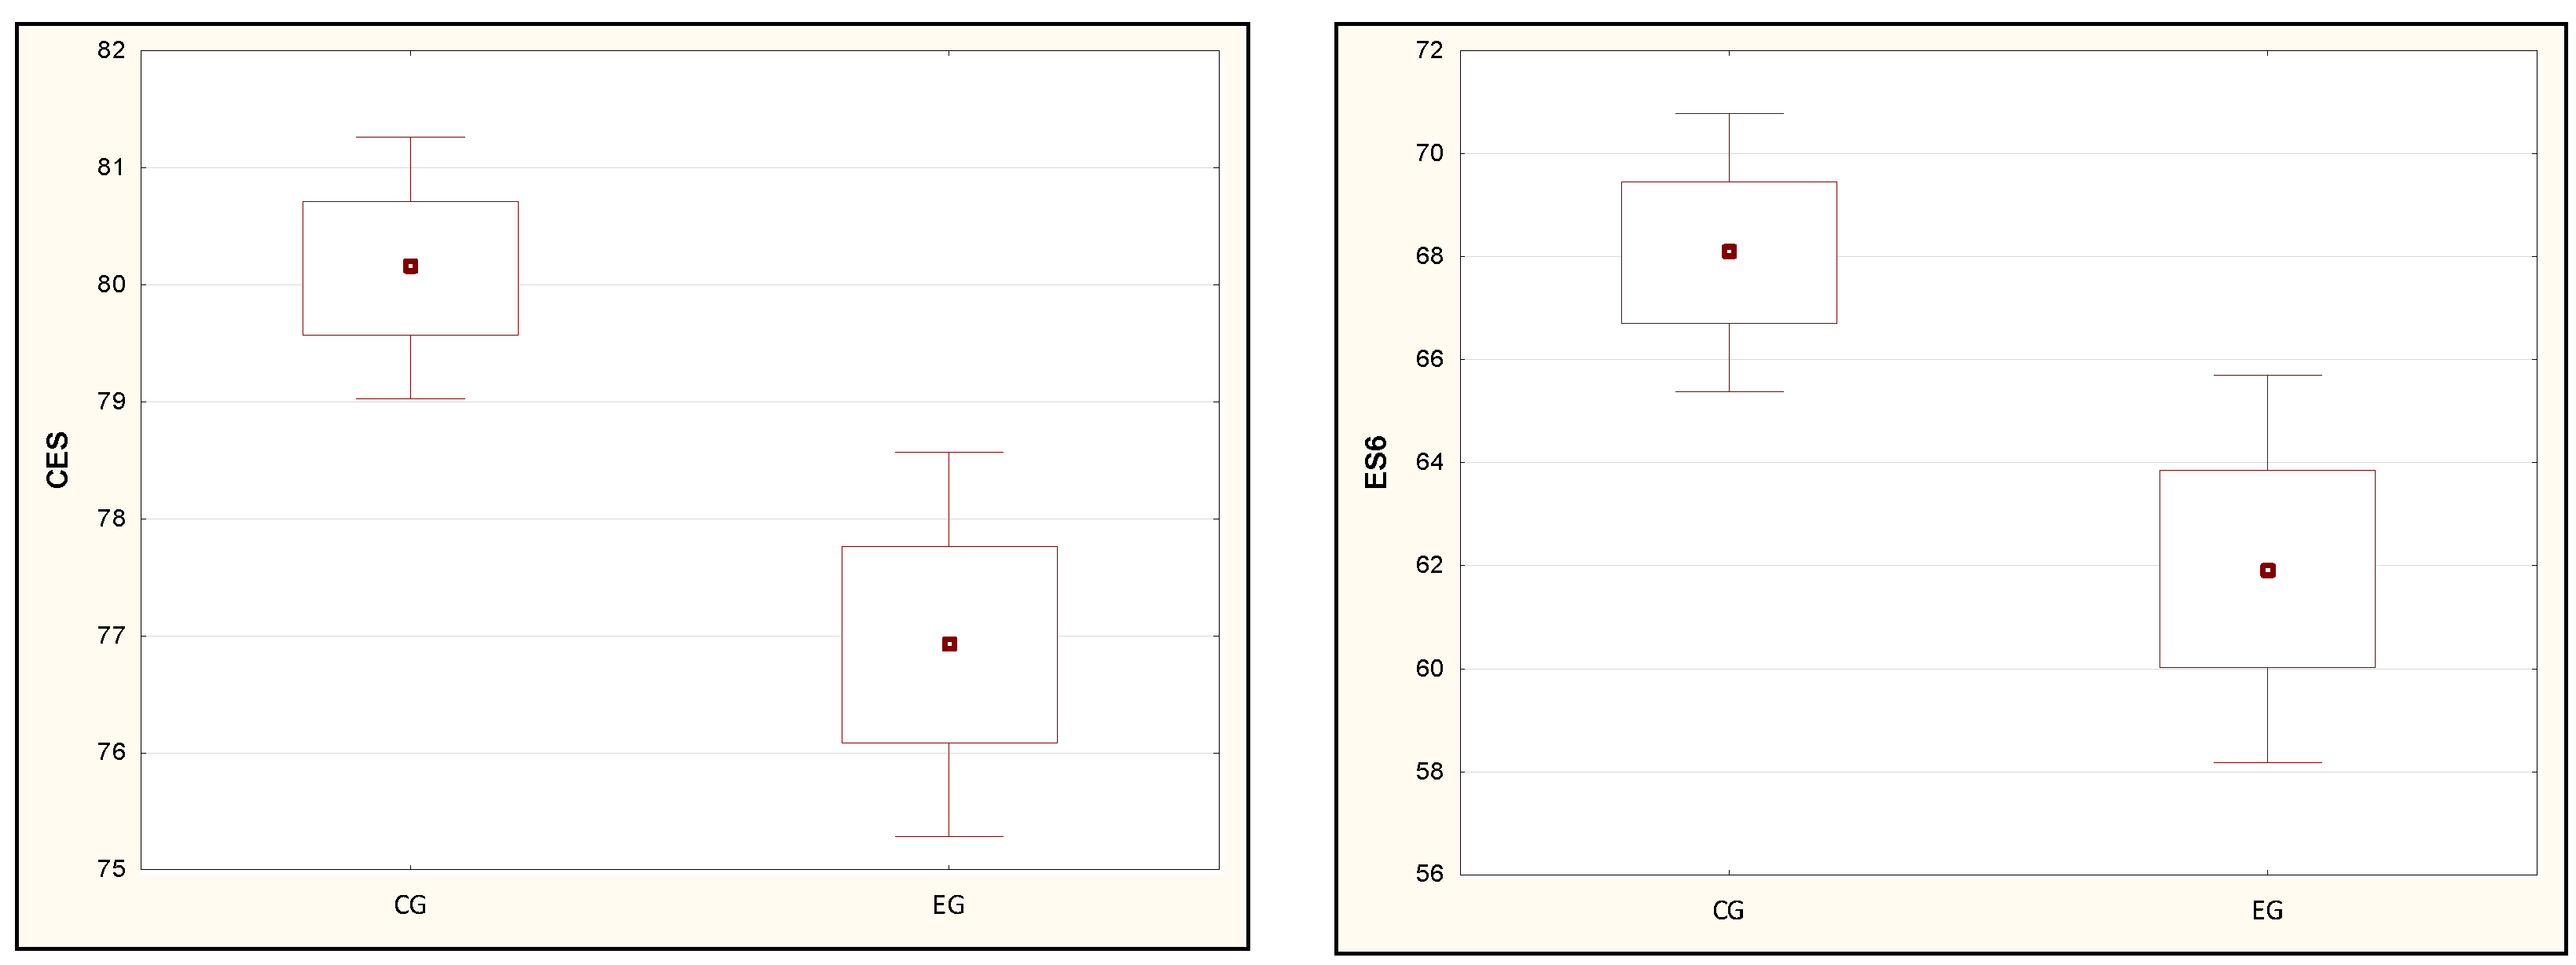
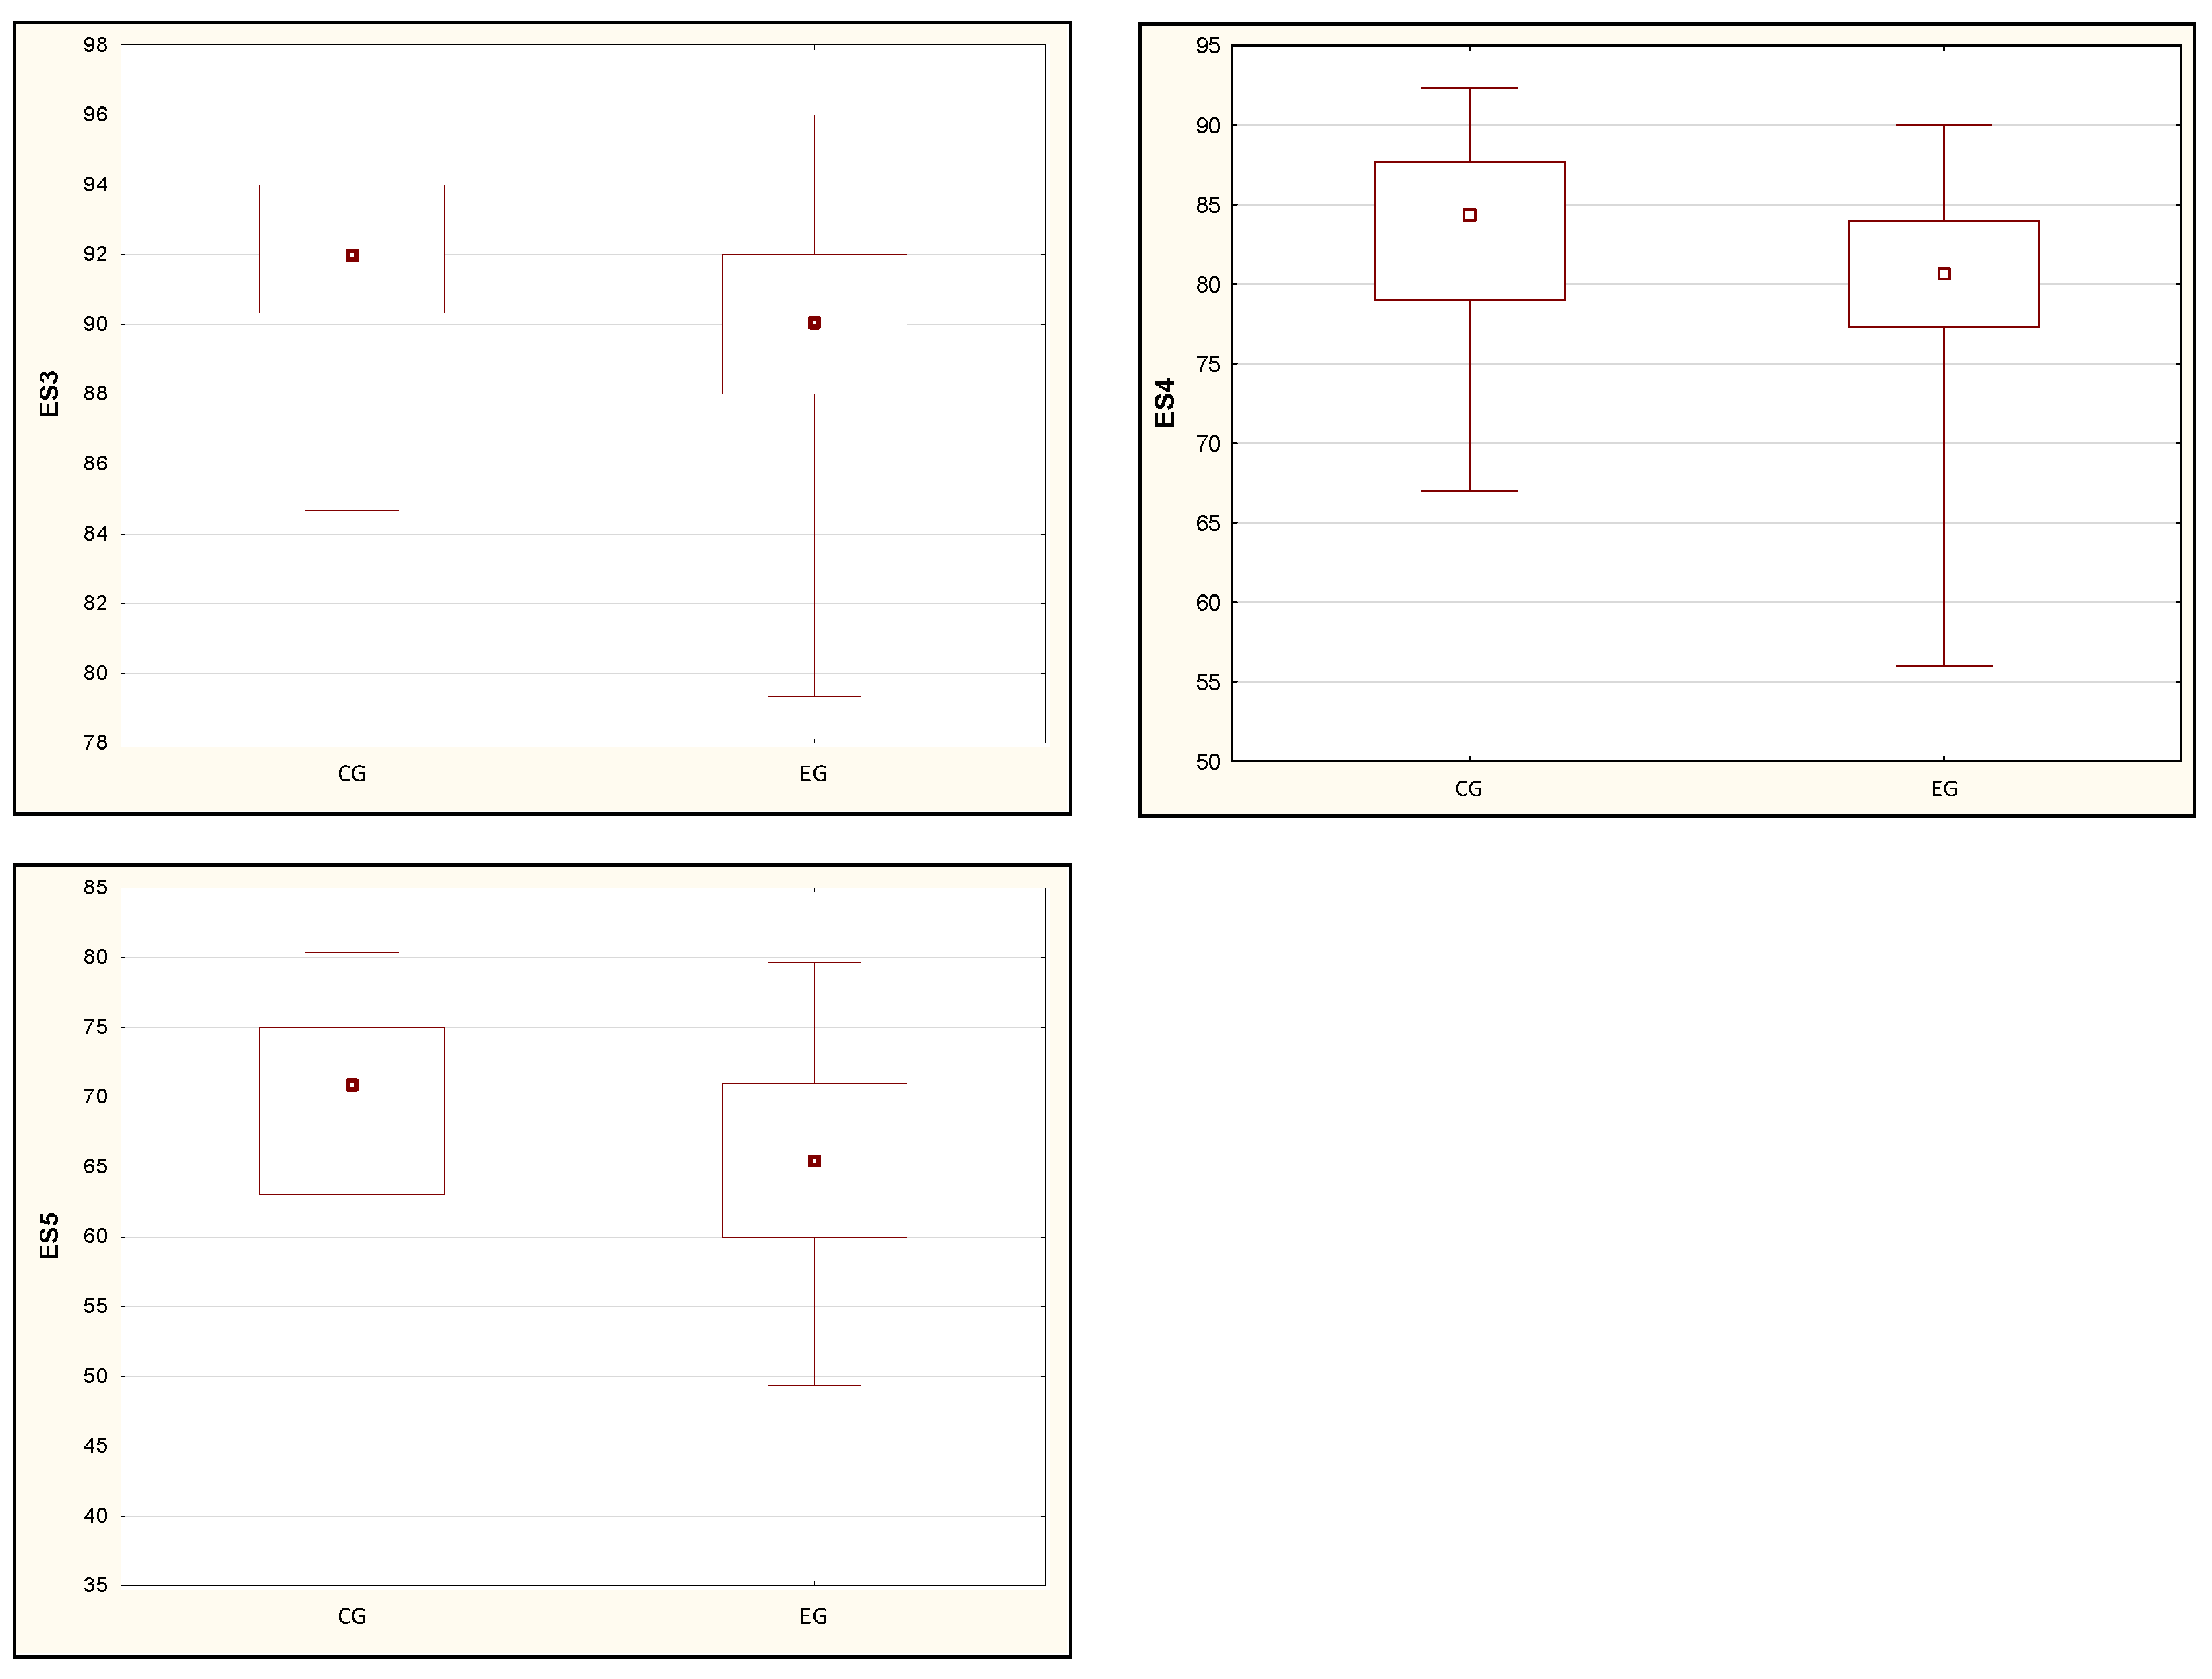
| ES3 [%] | 91.96 (3.00) | 92.00 (3.67) | 90.09 (3.82) | 90.00 (4.00) | 0.04 * |
| ES4 [%] | 83.16 (6.01) | 84.33 (8.67) | 79.36 (7.61) | 80.67 (6.67) | 0.03 * |
| ES5 [%] | 68.15 (9.09) | 71.00 (12.00) | 64.80 (6.99) | 65.33 (11.00) | 0.02 * |
| ES6 [%] | 68.08 (9.64) | 67.67 (14.00) | 61.94 (9.96) | 62.00 (12.33) | 0.01 ** |
| CES [%] | 80.14 (3.99) | 80.00 (6.00) | 76.93 (4.35) | 77.00 (8.00) | 0.01 ** |
| CG | EG | ||||
|---|---|---|---|---|---|
| Test | Mean (SD) | Med (IRQ) | Mean (SD) | Med (IRQ) | p |
| SOM [%] | 98.63 (1.83) | 99.00 (2.00) | 98.44 (2.52) | 99.00 (2.00) | 0.88 |
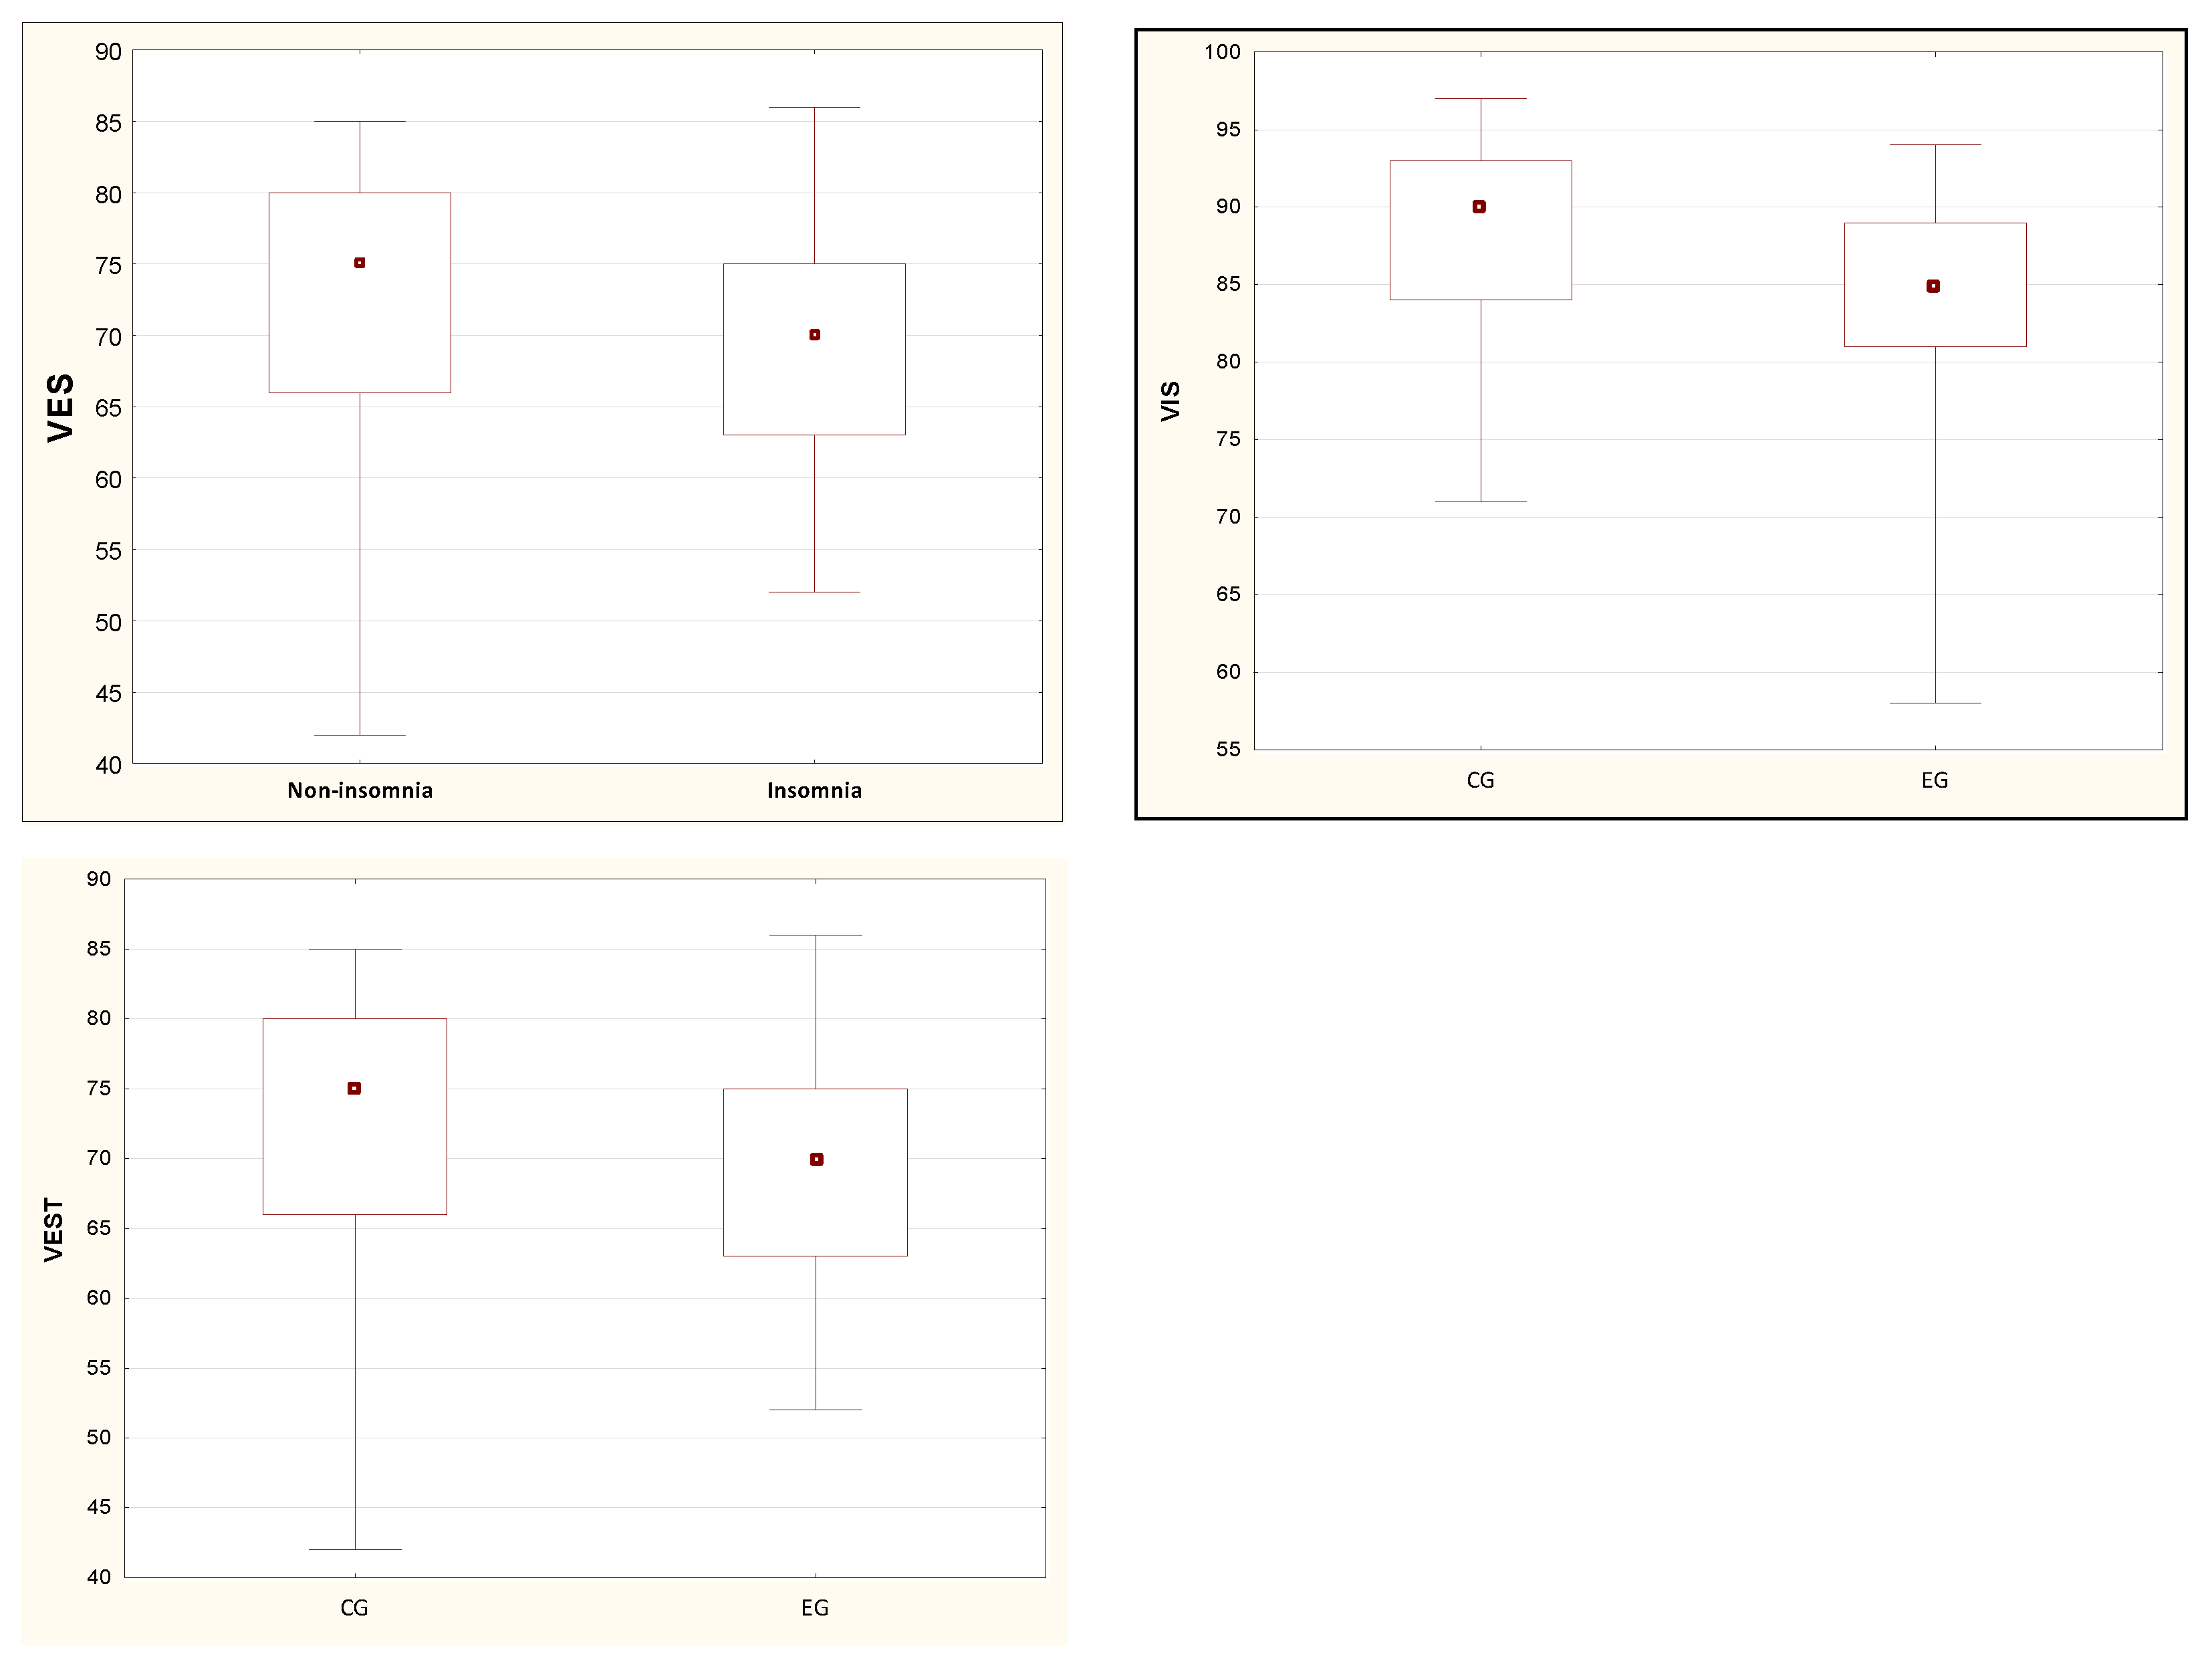
| VIS [%] | 88.18 (6.56) | 90.00 (9.00) | 84.15 (8.18) | 85.00 (8.00) | 0.03 * |
| VEST [%] | 72.06 (9.31) | 75.00 (14.00) | 68.70 (7.53) | 70.00 (12.00) | 0.03 * |
| PREF [%] | 96.71 (4.26) | 99.00 (6.00) | 95.30 (5.59) | 97.00 (5.00) | 0.17 |
| CG | EG | ||||
|---|---|---|---|---|---|
| Test | Mean (SD) | Med (IRQ) | Mean (SD) | Med (IRQ) | p |
| MS1 [%] | 95.17 (2.11) | 96.00 (2.67) | 94.89 (1.90) | 95.00 (2.00) | 0.31 |
| MS2 [%] | 94.48 (2.47) | 95.00 (2.00) | 94.57 (1.81) | 95.00 (3.00) | 0.84 |
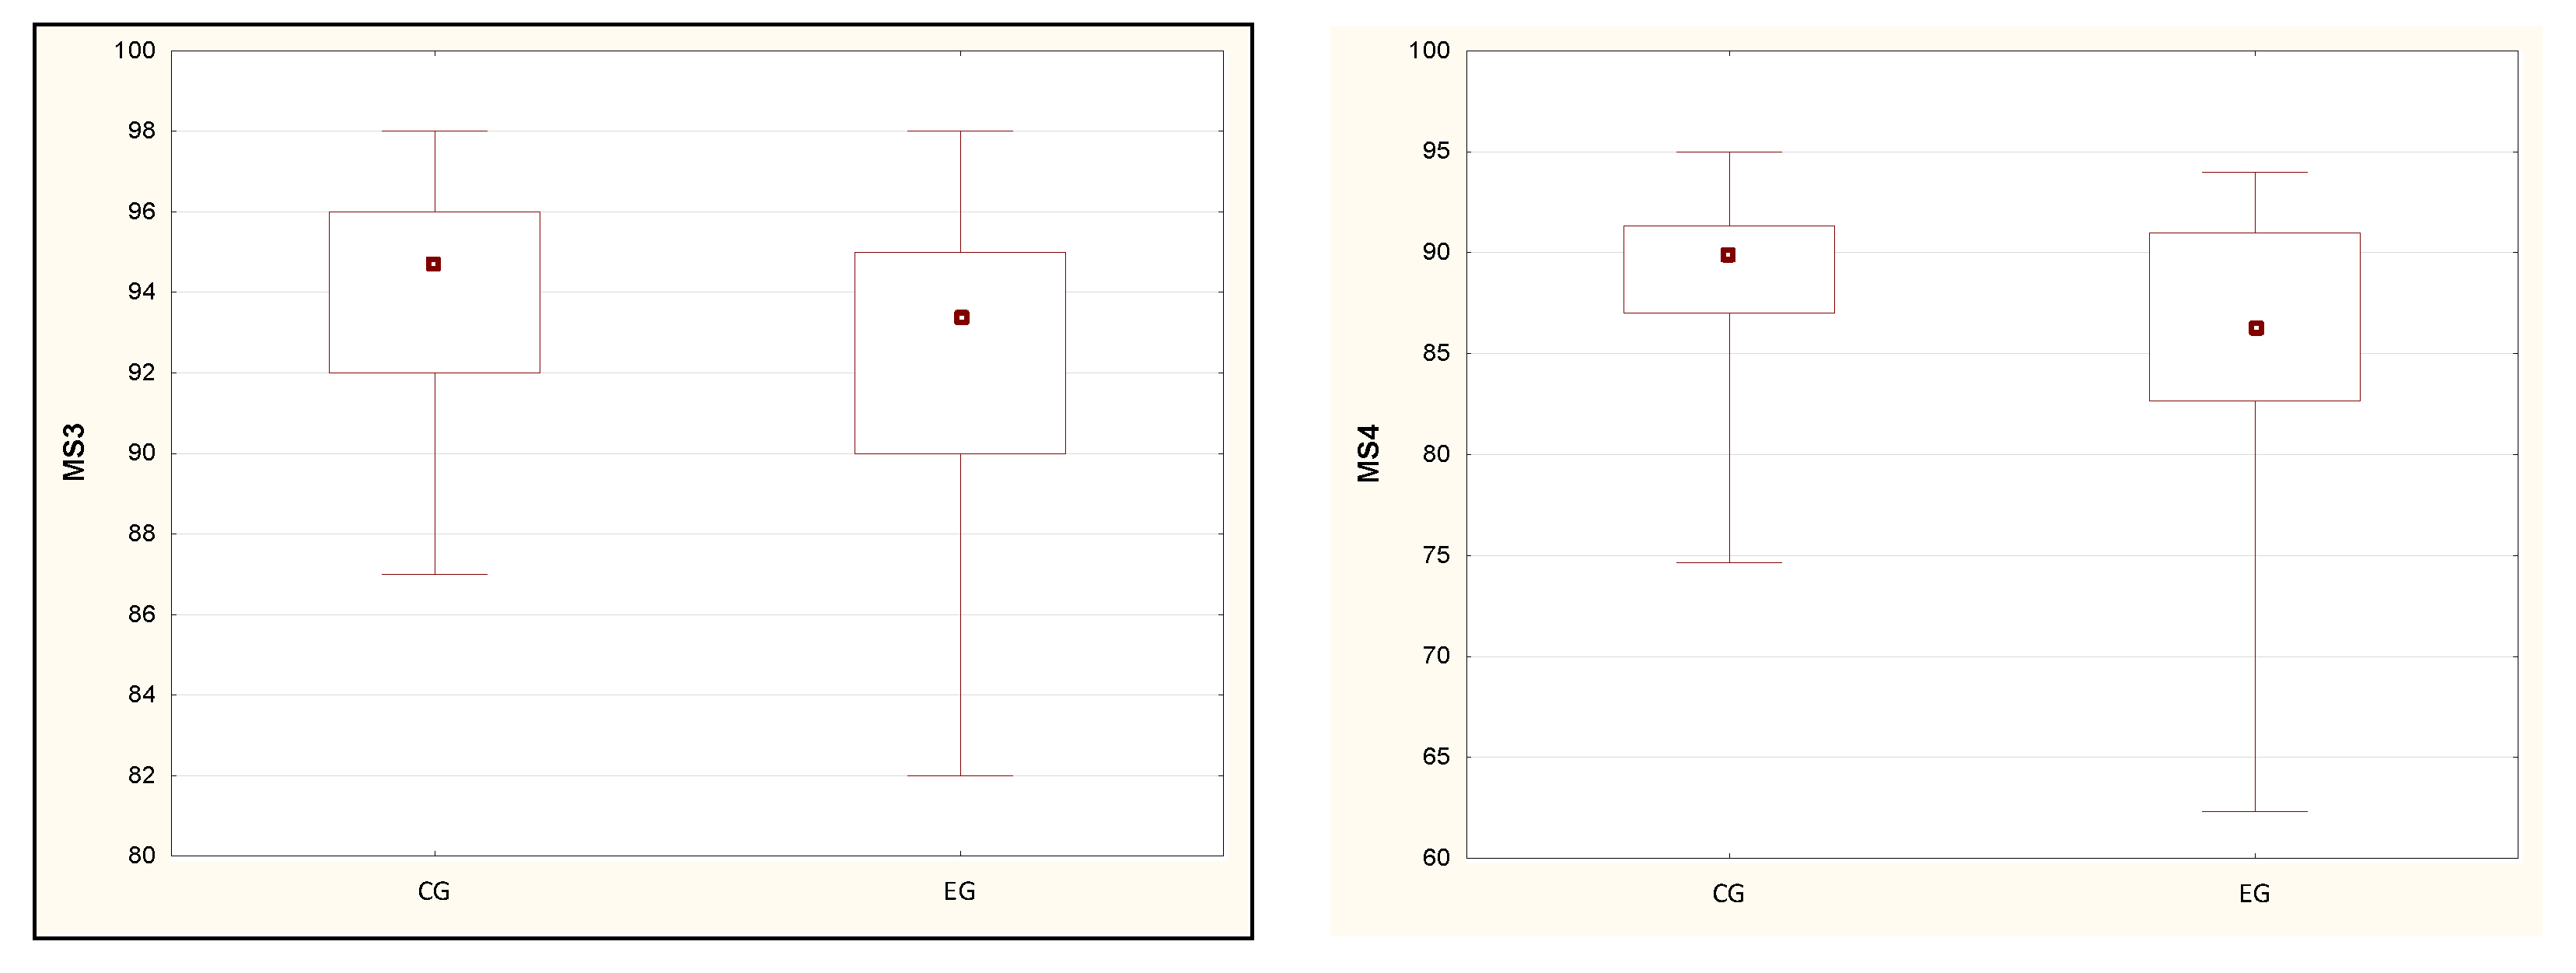
| MS3 [%] | 94.04 (2.69) | 94.67 (4.00) | 92.02 (4.03) | 93.33 (5.00) | 0.02 * |
| MS4 [%] | 88.68 (4.43) | 90.00 (4.33) | 85.38 (6.58) | 86.33 (8.33) | 0.01 * |
| MS5 [%] | 77.80 (6.96) | 80.00 (7.00) | 74.72 (8.65) | 77.00 (14.33) | 0.15 |
| MS6 [%] | 81.69 (5.60) | 84.00 (7.00) | 79.57 (6.51) | 81.00 (9.33) | 0.16 |
| CG | EG | ||||
|---|---|---|---|---|---|
| Test | Mean (SD) | Med (IRQ) | Mean (SD) | Med (IRQ) | p |
| LSB [ms] | 142.45 (10.41) | 140.00 (15.00) | 141.11 (10.13) | 140.00 (20.00) | 0.58 |
| LMB [ms] | 135.61 (10.88) | 135.00 (15.00) | 133.33 (8.66) | 135.00 (15.00) | 0.25 |
| LLB [ms] | 129.49 (13.88) | 130.00 (10.00) | 128.52 (8.41) | 125.00 (10.00) | 0.61 |
| LB [ms] | 135.84 (8.50) | 137.00 (7.00) | 134.26 (7.13) | 133.00 (14.00) | 0.37 |
| LSF [ms] | 142.96 (10.39) | 145.00 (10.00) | 141.85 (12.18) | 140.00 (20.00) | 0.54 |
| LMF [ms] | 137.45 (8.95) | 135.00 (15.00) | 138.70 (11.98) | 140.00 (20.00) | 0.71 |
| LLF [ms] | 130.51 (10.13) | 130.00 (10.00) | 131.30 (8.61) | 130.00 (5.00) | 0.84 |
| LF [ms] | 136.98 (9.46) | 137.00 (10.00) | 137.26 (9.36) | 135.00 (13.00) | 0.90 |
| LC [ms] | 133.84 (9.56) | 134.00 (10.00) | 133.56 (8.08) | 132.00 (14.00) | 0.88 |
| CG | EG | ||||
|---|---|---|---|---|---|
| Test | Mean (SD) | Med (IRQ) | Mean (SD) | Med (IRQ) | p |
| ADTU1 | 84.12 (20.22) | 80.00 (25.00) | 82.74 (18.83) | 81.00 (32.00) | 0.94 |
| ADTU2 | 65.92 (15.63) | 63.00 (20.00) | 66.37 (14.26) | 66.00 (17.00) | 0.57 |
| ADTU3 | 63.39 (13.88) | 60.00 (18.00) | 60.33 (12.74) | 62.00 (23.00) | 0.35 |
| ADTU4 | 56.96 (10.39) | 56.00 (15.00) | 55.44 (12.40) | 55.00 (17.00) | 0.69 |
| ADTU5 | 55.20 (8.95) | 55.00 (12.00) | 53.59 (10.95) | 52.00 (14.00) | 0.50 |
| ADTD1 | 48.90 (10.13) | 47.00 (13.00) | 49.78 (9.86) | 50.00 (15.00) | 0.45 |
| ADTD2 | 41.20 (8.50) | 40.00 (13.00) | 45.04 (10.96) | 43.00 (16.00) | 0.15 |
| ADTD3 | 37.92 (9.46) | 37.00 (10.00) | 40.52 (12.56) | 38.00 (14.00) | 0.47 |
| ADTD4 | 36.73 (9.56) | 35.00 (10.00) | 37.81 (9.31) | 35.00 (10.00) | 0.47 |
| ADTD5 | 36.04 (8.25) | 36.00 (9.00) | 37.70 (8.43) | 37.00 (13.00) | 0.34 |
Publisher’s Note: MDPI stays neutral with regard to jurisdictional claims in published maps and institutional affiliations. |
© 2022 by the authors. Licensee MDPI, Basel, Switzerland. This article is an open access article distributed under the terms and conditions of the Creative Commons Attribution (CC BY) license (https://creativecommons.org/licenses/by/4.0/).
Share and Cite
Tetych, A.; Olchowik, G.; Warchoł, J. Investigations Concerning the Influence of Sleep Disorders on Postural Stability in Young Men. Int. J. Environ. Res. Public Health 2022, 19, 8809. https://doi.org/10.3390/ijerph19148809
Tetych A, Olchowik G, Warchoł J. Investigations Concerning the Influence of Sleep Disorders on Postural Stability in Young Men. International Journal of Environmental Research and Public Health. 2022; 19(14):8809. https://doi.org/10.3390/ijerph19148809
Chicago/Turabian StyleTetych, Anna, Grażyna Olchowik, and Jan Warchoł. 2022. "Investigations Concerning the Influence of Sleep Disorders on Postural Stability in Young Men" International Journal of Environmental Research and Public Health 19, no. 14: 8809. https://doi.org/10.3390/ijerph19148809
APA StyleTetych, A., Olchowik, G., & Warchoł, J. (2022). Investigations Concerning the Influence of Sleep Disorders on Postural Stability in Young Men. International Journal of Environmental Research and Public Health, 19(14), 8809. https://doi.org/10.3390/ijerph19148809