Abstract
Air pollution affects health, but much of the focus to this point has been on outdoor air. Higher indoor pollution is anticipated due to increasingly energy-efficient and less leaky buildings together with more indoor activities. Studies of indoor air pollution focusing on children and people with respiratory disease from the database Web of Science (1991–2021) were systemically reviewed according to the PRISMA guidelines, with 69 studies included in the final selection. Emissions from building materials affected indoor air quality, and ventilation also had an influence. The main indoor air pollutants are Volatile Organic Compounds (VOCs) and Particulate Matter (PM). PM sources included smoking, cooking, heating, candles, and insecticides, whereas sources of coarse particles were pets, housework and human movements. VOC sources included household products, cleaning agents, glue, personal care products, building materials and vehicle emissions. Formaldehyde levels were particularly high in new houses. Personal exposure related to both indoor and outdoor pollutant levels, highlighting home characteristics and air exchange rates as important factors. Temperature, humidity, educational level, air purifiers and time near sources were also related to personal exposure. There was an association between PM and Fractional exhaled Nitric Oxide (FeNO), lung function, oxygen saturation, childhood asthma and symptoms of chronic obstructive pulmonary disease (COPD) patients. High VOCs were associated with upper airways and asthma symptoms and cancer. Effective interventional studies for PM in the future might focus on human behavior together with air purifiers and increased ventilation, whereas VOC interventions might center more on building materials and household products, alongside purification and ventilation.
1. Introduction
The top three causes of death worldwide according to a World Health Organization (WHO) report are cardiovascular, respiratory and neonatal conditions. chronic obstructive pulmonary disease (COPD) was the third leading cause of death globally in 2000 and contributed to 6% of all deaths, with lower respiratory tract infection being the fourth leading cause of death. If all lung diseases such as COPD, lower respiratory diseases, lung cancer and tuberculosis are combined, it becomes the leading global cause of death [1]. Air pollutants, dust, chemicals and socioeconomic status have all been associated with the development, flare-ups and/or progressions of lung diseases, such as asthma and COPD [2].
Due to the rapid development of technology, urbanization and increased population, air pollution has become a hot topic, in particular because of the effects on health. However, much of the focus has been on outdoor air pollution, which is anticipated to decrease in the coming years if public health interventions have their desired effect [3]. One effect of reducing outdoor pollution is likely to be that indoor air pollution will make an increasing contribution to human exposure, due also to increasingly energy-efficient buildings with less ventilation and more indoor activities overall. However, there are many gaps in our understanding of where, when, and how people are exposed to peak concentrations of pollutants in indoor environments [3,4].
Some of the most important sources of indoor air pollution are Volatile Organic Compounds (VOCs) and Particulate Matter (PM). There are a variety of VOCs emitted from modern household products (e.g., paints, lacquers, cleaning liquids, furnishings, copiers, printers, glues, adhesives or permanent markers). These include non-methane hydrocarbons, halocarbons, benzene, toluene, ethylbenzene, meta-, para- and ortho-xylenes and oxygenated VOCs. There is evidence that these compounds affect human health; for instance, benzene increases the risk of cancer [5]. In addition, multiple outdoor air pollution studies have shown that PM can also affect the health of people [6]. PM is a mix of very small particles and liquid droplets consisting of acids, organic chemicals, metals and dust particles [7], and is typically described by particle size: in particular, PM0.1 (droplets or particles of less than 0.1 microns; also referred to as ultrafine particles, UFP), PM2.5 (<2.5 microns; fine) and PM10 (<10 microns; coarse) based on their aerodynamic equivalent diameters (see Figure 1). Particles greater than 10 microns may be natural (e.g., volcanoes, dust storms) or man-made (e.g., construction), and are mostly filtered out in the nose and airway [8]. Currently, fine particles (PM2.5) are most prominent in respiratory health research, but smaller sizes, in particular ultrafine particles (PM0.1), may cause more toxicities as they penetrate cell membranes [9].
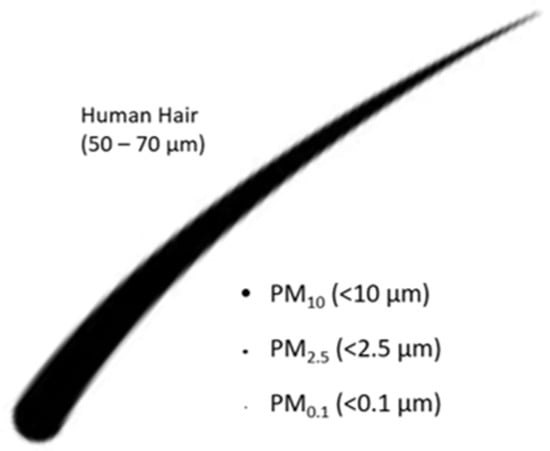
Figure 1.
Illustration of the most important size classes of Particulate Matter (PM).
Some people are more prone to the ill effects of pollution, and these may be termed vulnerable groups (VGs), such as children (age 0–16) [10] and people with pre-existing respiratory disease. Children’s immune and respiratory systems are still developing such that they are vulnerable to exposure to airborne environmental pollutants. People with existing lung problems may have greater sensitivity to pollutants or less reserve to cope with ill effects. Air pollution reduces the life expectancy of VGs by an average of several months (ranging from three days to 11.5 years) [11], and a single exposure can exacerbate diseases of VGs within hours or days [12]. Indoor air pollutants are potentially the most relevant for VGs as they spend particularly long periods of time indoors. Indoor exposures may also vary with demographic factors associated with poor lung health; for instance, children who live in houses with poor ventilation experience more polluted air than present outside [10]. Since a systematic review of outdoor exposures with respect to respiratory health [13] has already been completed, we chose here to systematically review studies of indoor air pollution in VGs to understand how best to focus new studies and design interventions for prevention of future exposure.
2. Methods
This systematic review was carried out according to the PRISMA guidelines [14].
2.1. Search Strategy
The Web of Science Core Collection was searched for the years 1991 to 2021 using the search strategy shown in Figure 2, including studies in any language. Eligible articles are summarized in Table 1.
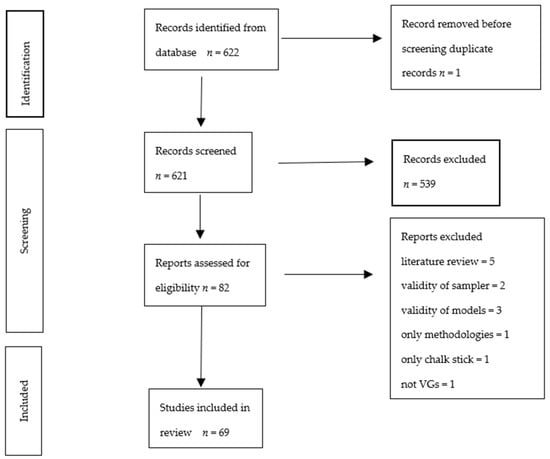
Figure 2.
Preferred Reporting Items for Systematic reviews and Meta-Analyses (PRISMA) flow chart of study selection and inclusion.

Table 1.
Overview of studies eligible for inclusion in the systematic review.
82 studies were available from the literature search, as shown in Figure 2, when focusing the search terms for personal exposure of the selected VGs on our target locations homes, nurseries, hospitals and transport spaces as well as on our target pollutants, VOCs, UFP, PM1, and PM2.5, in relation to pre-existing conditions/COPD; of these 82 studies, 13 were excluded based on either article type or inaccurate methods regarding air quality measurement or modelling. Sixty-nine studies were thus included in the final review.
2.2. Study Selection and Quality Assessment
Initial study selection was carried out by two independent reviewers (JB and CP). If there was disagreement, a referral was made to a third reviewer. Initially, the studies were screened by title and abstract. Subsequently, the full text was read against the inclusion and exclusion criteria. The studies were then divided into groups of VOCs, UFP, PM1, PM2.5 and PM10 (while PM10 was not one of our search terms, many studies reporting results on the PM classes of our focus also reported closely related PM10 findings that we included in the discussion if relevant). Quality assessment of the studies was carried out by two authors (TZM and EH) according to the Joanna Briggs Institute Critical Appraisal Tool. The initial draft of this review was written by TZM with subsequent input from all co-authors.
3. Results
3.1. Main Studies Characteristics
Studies originated from around the world with 23 studies from Asia, 22 studies from Europe, 20 studies from North America, three studies from the southcentral Americas and one study from Africa. There were two systematic reviews and two randomized control trials, while the others were observational (cohort, case-control or cross-sectional) studies. Various samplers were used to measure indoor air pollutant levels and personal exposure. Characteristics of the studies are summarized in Table 2.
Table 2.
Overview of the characteristics of the studies included (in alphabetical order of the first author of each study).
3.2. Study Quality
The studies were generally of low risk of bias. They were of high quality, with omissions most common in areas of identification of co-founding factors. The studies showed both positive and negative correlations with lung disease. However, the literature was slightly biased towards positive studies. Further details are provided in the Supplementary Materials (Tables S1 and S2).
3.3. Main Findings
Emissions from building materials of various types were found to affect indoor air quality significantly and ventilation also had a major influence [48]. Studies reported a range of relatively well-defined sources, but they were less clear on the health effects.
3.3.1. Particulate Matter (PM)
Sources
Household and transport environments were both found to contain abundant black carbon and UFP [79]. Sources of PM2.5 were identified to be smoking, cooking, heating, candles, and insecticides, whereas sources of coarse particles were pets, housework and peoples’ movements [6]. One study identified the main source of polycyclic aromatic hydrocarbons to be the combustion of coal and gasoline for heating [49]. The concentration of black carbon was also noted to be high during the use of charcoal grills and candles [30].
The composition of particulate matter was found to depend on transport modes; iron was mostly found in studies of PM around railways, likely due to the friction of rail wheels and brakes. Zinc and copper were associated with car and bus travel due to particles from brake and tire wear [54]. PM composed of organic and elemental carbon was also found near traffic, likely because organic and elemental carbon has adhesive properties and sticks to coarse particles such as those described above. The high mineral concentration of PM in schools, more so than in homes, was associated with proximity to busy roads and high human occupancy levels [55]. All of these findings highlight the key environmental influences for indoor air pollution.
Personal exposure depended on indoor contact with animals, mold, cooking activities and aerosol use [25], and was also seasonal, such that in winter, indoor levels of PM2.5 and PM10 were the highest. This is likely due to an increased usage of heaters together with poorer ventilation of houses in winter as people tend to keep windows closed to stay warm. Personal exposure to these particles will thus also increase. Personal exposure also related significantly to indoor and outdoor pollutant levels, which highlighted home characteristics and air exchange rates as important factors for personal exposures. In addition, environmental temperature, humidity, educational level, usage of air purifiers, time near sources and concentration of black carbon also influenced the level of personal exposure [60,61,80].
Children in urban and suburban areas had the highest exposures to UFP in contrast to children in rural areas [58]. Children are exposed to PM more in schools than homes, likely related to the number of people present indoors, in addition to outdoor infiltration [55]. UFP is highest during eating and cooking activities [57]. PM2.5 and PM10 concentrations in schools are more than double those at home, which highlights the importance of cleaning activities and the density of occupation [36]. Canteen environments have the highest UFP level, whereas libraries have the lowest, which shows the association with cooking and the number of occupants [67].
Exposure to PM depends on the height of the buildings as well. The level of exposure is low in children who study on higher floors, which is likely due to good ventilation [78]. Furthermore, there is infiltration of outdoor PM to indoor, which is compounded by indoor smoking [53] and the usage of mosquito repellents, which cause more indoor exposure.
Associations between indoor and outdoor PM are stronger in schools near main or small roads than for those away from traffic. PM2.5 and the number of particles is high during rush hour traffic but sometimes reach their peak in relation to human activities such as smoking and using mowers. The indoor number of particles is occasionally affected by cooking, cleaning and floor polishing, which illustrates that human activities lead to high levels of these particles [39]. Participants spend 85% of their time indoors and the highest indoor exposure to UFP is reached during sleeping, highlighting the importance of controlling indoor air pollution [75]. Air filtration can significantly lower the PM level in houses with smokers, which is promising for future studies [17].
Health Effects
There is an association between Fractional exhaled Nitric Oxide (FeNO) and PM2.5 and PM10 exposure in asthma patients, with a significant increase in FeNO levels in exposed asthma patients. The strongest association was found between FeNO and two-day average PM concentration. The association of elemental carbon and NO2 with asthma was weak [32]. However, there was no association between asthma and spirometry, oxygen saturation, heart rate, or blood pressure [44].
When it comes to PM2.5 exposure and force expiratory volume in one second (FEV1), peak expiratory flow rate (PEFR) and maximal mid-expiratory flow (MMEF), it was found that FEV1 reduction occurred with exposure to PM2.5 in adult COPD patients. In asthmatic children not taking inhaled corticosteroids or montelukast, a drop in FEV1, PEFR and MMEF was noted [68]. There was a significant reduction in PEFR and a rise in symptoms such as cough and sputum when COPD patients were exposed to PM2.5 [26].
In a randomized cross-over study, there was a relationship between lung function test and lung-deposited particle surface area concentration (PSC), size-specific particle number concentration (PNC), and particle mass concentration (PMC) of PM1, PM2.5 and PM10 from candles burning, the toasting of bread and the frying of sausages. PMC from candle burning and frying sausages and PM2.5 and PSC from candle burning decreased lung function, but PMC from toasting bread and the PNC of UFP were not associated with lung function changes [66].
Short-term exposure to PM caused an acute decline in blood oxygen saturation which was most obvious in the first three hours but became less obvious after three hours in both COPD patients and healthy people. However, the reduction in blood oxygen saturation was more significant in COPD patients than in healthy subjects [74].
There was a relationship between childhood asthma and women exposed to PM2.5, and black carbon and nicotine during pregnancy [77]. In addition, black carbon from combustion is strongly associated with high systolic blood pressure [22].
3.3.2. Volatile Organic Compounds (VOCs)
Sources
The sources of VOCs reported in the included studies were household products, cleaning agents, glue, personal care products, building materials, solvents, smoking and vehicle emissions. Formaldehyde levels were particularly high in new houses with new furniture [6,69,70]. The four most reported VOCs were toluene, m-/p-xylene, alpha-pinene and delta-limonene [63]. Toluene is the most abundant aromatic hydrocarbon [70]. N-hexane, 1,1,1-trichloroethane, benzene, toluene, ethylbenzene, m-, p-xylene, dodecane and hexadecane are hazardous air pollutants that cause cancer as well as eye and skin irritation [18].
Most VOCs come from indoor sources in urban, semirural and residential areas, but there was an outdoor influence in industrial areas. Alkanes and aromatic compounds were found in all areas with variable chemical distributions. C9-C11 alkanes, toluene and xylenes were mostly found indoors, contributed to by human activities such as renovations, painting and cleaning. Hexane, heptane and benzene dominated outdoor industrial areas but also influenced indoor air [50]. High levels of o-xylene and ethylbenzene were identified in winter [51]; formaldehyde, acetaldehyde and toluene concentrations were found to be the highest in bedrooms [35]. One study reported differences in the concentrations of specific VOCs between the ground floor and basement levels (e.g., higher amounts of nonanal and 2-butoxyethanol at basement levels, but more naphthalene and 2-ethylhexan-1-ol at ground floor levels), likely because of the extensive use and storage of household cleaning products, deodorizers and solvents at both ground floor and basement levels in these study locations, and emissions from vehicles more easily infiltrating into the ground floor and basement levels compared with higher floors [70]. Previous works have found that VOC levels in basements often exceeded those on ground floor living spaces because basements in residential locations are commonly used for chemical storage. Interestingly, VOCs, CO, and CO2 were not linked to cooking, unlike PM10 and PM2.5 [29].
Socioeconomic factors influenced the personal exposure to VOCs; for example, parental education, age, and type of housing had a slight contribution [18].
Health Effects
High VOC and CO levels were associated with worsening asthma symptoms [28]. Children living close to industrial sites had more exposure to VOCs, and there was a significant association with school absence because of sore throat, cough and cold. O-xylene emitted from industrial activity had a clear association with respiratory symptoms [27]. Lifetime cancer risk was associated with benzene exposure [50]. There is an association between VOCs and childhood acute leukemia. Benzene, in particular, is a relevant carcinogen causing leukemia [40].
4. Discussion
We found an abundance of studies describing potential sources of indoor air pollution; however, studies of the health effects were comparatively less common and may be a fruitful area for future research.
The sources of PM were mainly related to the burning of materials, friction of metals in transportation and cleaning activities spreading these particles. PM is thus particularly abundant near stoves and transportation. Personal exposure to these particles depends on the duration of time people spend near these sources. The density of occupation and degree or type of cleaning activities appeared to influence PM exposure markedly, as shown by the higher personal exposure in schools and canteens compared to private homes. This highlighted that people’s movements and activities spread the particles, thereby causing elevated personal exposures. Furthermore, indoor PM levels were high in winter, which is likely due to less frequent ventilation and the usage of heaters, and personal exposure was affected proportionately.
In addition, the composition of PM, such as iron near subways, zinc, and copper near cars and buses highlights the environment’s influence on indoor PM. Children in rural areas have less personal exposure than their counterparts in urban areas, which again highlights the influence of the environment on indoor air pollution. The ventilation of houses also strongly affects the indoor pollutant levels. This should be considered in future housing projects when choosing the appropriate locations and designs for housing. More studies are required to investigate how good quality housing can reduce personal exposure. In one RCT, air purifiers reduced levels of personal exposure, but many more studies are needed to prove this hypothesis. If it is proven to work, air purification could become one of the key mitigation strategies to tackle indoor air pollution. Studies looking into the usage of air purifiers to improve airway problems in VGs should be particularly encouraged.
Human activities, behavior and education level are associated with personal exposure to air pollutants. However, there is no study looking into the level of personal exposure vs change of behavior (e.g., changing cooking stoves from open fire to conventional gas/electric or induction hob). There is a clustered RCT about cookstove interventions to improve infant health in Ghana. Liquefied petroleum gas (LPG) cookstoves or improved biomass cookstoves were introduced for pregnant women to see if there was any improvement in infant health. The studies resulted in no improvement in birth weight and in the risk of severe pneumonia in the first 12 months. The researchers concluded that the effect could be due to a lower-than-expected reduction of air pollutants [82]. The effects of changing the human behavior of VGs on indoor air pollution and health should be investigated in the future.
A few studies have investigated the association between upper airway symptoms, lung function test, PEFR, FeNO and oxygen saturation with personal exposure to PM. This is consistent with PM causing inflammation in the airways affecting lung function and FeNO. Stronger evidence is required to draw firm conclusions on this topic. Similarly, larger studies are needed to prove the link between PM and cardiovascular diseases such as high blood pressure and coronary artery disease.
VOCs are mainly related to household products, home renovations, smoking, and the use of solvents. Therefore, VOC levels are high in the areas where these products are extensively used and stored, especially on the ground floor or in basements. Emissions from vehicles infiltrate ground floor and basement levels more easily than high floors, which compounded VOC levels both on ground floors and in basements. There is also a seasonal variation of VOC levels. They are generally high in winter and are likely due to the poor ventilation of homes in winter. Although the main sources of VOCs are indoors, there is some outdoor influence in industrial areas. Socioeconomic factors and level of education have also an influence on personal exposure to VOCs. Interestingly, VOC exposure is not related to cooking.
VOC exposure appears to irritate the airways, causing upper airway symptoms such as the common cold, cough and sore throat. It also increases asthma exacerbation rates likely due to a similar mechanism. There is an association between VOCs and cancer, and benzene specifically increases the risk of leukemia, but stronger evidence is needed. Interventions to change human behavior and the use of indoor air purifiers should be a focus in the future.
Strength and Limitations
The articles in question were searched extensively using an appropriate search strategy from a large database without limitation to language and reviewed systematically. A quality check was performed using the Joanna Briggs Institute Critical Appraisal Tool. It should be noted that the chosen database (Web of Science) focusses on peer-reviewed literature and will not generally include work released e.g., as grey literature. The search terms also did not encompass all potential VGs.
5. Conclusions
Indoor air pollution sources are varied, with significant differences seen between urban and rural areas and between public locations (e.g., schools) and private homes, the latter being less well studied. PM are mainly associated with cooking, heating and metal frictions, whereas VOCs are mostly associated with household products, personal care products and building materials. The exposure route is mainly the respiratory tract, as these particles and volatile compounds mostly enter the body via inhalation. Other possible exposure routes are via the skin and eyes [18]. The effects on health are likely, based on a small number of relevant studies together with extrapolation from the outdoor air pollution literature, but are relatively poorly reported. It is very likely that VOCs cause upper airway irritation and that PM causes inflammation of the airways affecting lung function and FeNO. Interventional studies for PM in the future might focus on reducing sources related to human behavior together with air purifiers and increased ventilation, whereas VOC studies might need to center more on building materials and air purification and ventilation.
Supplementary Materials
The following are available online at https://www.mdpi.com/article/10.3390/ijerph19148752/s1, Table S1. Quality Report [15,16,17,18,19,20,21,22,23,24,25,26,27,28,29,30,31,32,33,34,35,36,37,38,39,40,41,42,43,44,45,46,47,48,49,50,51,52,53,54,55,56,57,58,59,60,61,62,63,64,65,66,67,68,69,70,71,73,74,75,76,77,78,80,81,83], Table S2. Joanna Briggs Institute Critical Appraisal Tools.
Author Contributions
Conceptualization, C.P. and A.M.T.; methodology, J.E.B., C.P. and A.M.T.; validation, T.Z.M. and E.H.; formal analysis, T.Z.M.; writing—original draft preparation, T.Z.M.; writing—review and editing, C.P., A.M.T. and T.Z.M.; visualization, E.H. and T.Z.M.; funding acquisition, C.P. and A.M.T. All authors have read and agreed to the published version of the manuscript.
Funding
The authors are grateful for support from the Natural Environment Research Council, NERC, who funded the CleanAir4V project (grant number NE/V002414/1).
Institutional Review Board Statement
Not applicable.
Informed Consent Statement
Not applicable.
Conflicts of Interest
The authors declare no conflict of interest.
Abbreviations
| BC | black carbon |
| CO | carbon monoxide |
| FeNO | Fractional exhaled Nitric Oxide |
| FEV1 | Force Expiratory Volume in 1 s |
| MMEF | Maximal Mid-Expiratory Flow |
| NO2 | nitrogen dioxide |
| PEFR | Peak Expiratory Flow Rate |
| PMC | Particle Mass Concentration |
| PM | Particulate Matter |
| PM0.1 | PM smaller than 0.1 microns |
| PM1 | PM smaller than 1 micron |
| PM2.5 | PM smaller than 2.5 microns |
| PM10 | PM smaller than 10 microns |
| PNC | size-specific Particle Number Concentration |
| PRISMA | Preferred Reporting Items for Systematic reviews and Meta-Analyses |
| PSC | Particle Surface area Concentration |
| RCT | Randomized Control Trial |
| UFP | Ultrafine particles |
| WHO | World Health Organization |
References
- World Health Organization. Top Ten Causes of Death. Available online: https://www.who.int/news-room/fact-sheets/detail/the-top-10-causes-of-death (accessed on 25 February 2022).
- The Battle for Breath—The Impact of Lung Disease in the UK; British Lung Foundation: London, UK, 2016; Available online: https://www.blf.org.uk/policy/the-battle-for-breath-2016 (accessed on 25 February 2022).
- Air Pollution Exposure is Shifting from Outdoor to Indoor—Here’s Why. Available online: https://mybreezzz.com/2021/11/18/air-pollution-exposure-is-shifting (accessed on 20 December 2021).
- Pfrang, C.; Shi, Z.; Harrison, R.; Turner, A.; Walasek, L.; Meyer, C.; Harris, N.R.P.; Doherty, R.; Luo, Z.; Meng, J. Air Pollution Solutions for Vulnerable Groups (CleanAir4V); NERC Proposal for Grant Reference NE/V002414/1; University of Birmingham: Birmingham, UK, 2020. [Google Scholar]
- Chuanqi, L.; Qianqian, L. Environmental impact and health risk assessment of volatile organic compound emissions during different seasons in Beijing. J. Environ. Sci. 2020, 93, 1–12. [Google Scholar]
- Vardoulakis, S.; Giagloglou, E.; Steinle, S.; Davis, A.; Sleeuwenhoek, A.; Galea, K.S.; Dixon, K.; Crawford, J.O. Indoor Exposure to Selected Air Pollutants in the Home Environment: A Systematic Review. Int. J. Environ. Res. Public Health 2020, 17, 8972. [Google Scholar] [CrossRef] [PubMed]
- US Environmental Protection Agency. Particulate Matter: Air & Radiation. 2011. Available online: http://www.epa.gov/pm/ (accessed on 7 November 2021).
- Anderson, J.O.; Thundiyil, J.G.; Stolbach, A. Clearing the air: A review of the effects of particulate matter air pollution on human health. J. Med. Toxicol. Off. J. Am. Coll. Med. Toxicol. 2012, 8, 166–175. [Google Scholar] [CrossRef]
- World Health Report; World Health Organization: Geneva, Switzerland, 2002; Available online: https://apps.who.int/iris/handle/10665/42510 (accessed on 25 February 2022).
- RCPCH. Inside Story: Health Effects of Indoor Air Quality on Children and Young People. 2020. Available online: https://www.rcpch.ac.uk/resources/inside-story-health-effects-indoor (accessed on 25 February 2022).
- COMEAP. Committee on the Medical Effects of Air Pollutants. 2010. Available online: https://www.gov.uk/government/groups/committee-on-the-medical-effects (accessed on 25 February 2022).
- WHO. Review of Evidence on Health Aspects of Air Pollution. 2013. Available online: www.euro.who.int/__data/assets/pdf_file/0020/182432/e96762-final.pdf (accessed on 25 February 2022).
- Li, J.; Sun, S. Major air pollutants and risk of COPD exacerbations: A systematic review and meta-analysis. Int. J. Chronic Obstr. Pulm. Dis. 2016, 11, 3079–3091. [Google Scholar] [CrossRef] [PubMed]
- Page, M.; McKenzie, J. The PRISMA 2020 statement: An updated guideline for reporting systematic reviews. BMJ 2021, 372, n71. [Google Scholar] [CrossRef] [PubMed]
- Adgate, J.L.; Church, T.R.; Ryan, A.D.; Ramachandran, G.; Fredrickson, A.L.; Stock, T.H.; Morandi, M.T.; Sexton, K. Outdoor, indoor, and personal exposure to VOCs in children. Environ. Health Perspect. 2004, 112, 1386–1392. [Google Scholar] [CrossRef] [PubMed]
- Adgate, J.L.; Eberly, L.E.; Stroebel, C.; Pellizzari, E.D.; Sexton, K. Personal, indoor, and outdoor VOC exposures in a probability sample of children. J. Expo. Anal. Environ. Epidemiol. 2004, 14, S4–S13. [Google Scholar] [CrossRef]
- Batterman, S.; Godwin, C.; Jia, C. Long duration tests of room air filters in cigarette smokers’ homes. Environ. Sci. Technol. 2005, 39, 7260–7268. [Google Scholar] [CrossRef]
- Byun, H.; Ryu, K.; Jang, K.; Bae, H.; Kim, D.; Shin, H.; Chu, J.; Yoon, C. Socioeconomic and personal behavioral factors affecting children’s exposure to VOCs in urban areas in Korea. J. Environ. Monit. 2010, 12, 524–535. [Google Scholar] [CrossRef]
- Broich, A.V.; Gerharz, L.E.; Klemm, O. Personal monitoring of exposure to particulate matter with a high temporal resolution. Environ. Sci. Pollut. Res. 2012, 19, 2959–2972. [Google Scholar] [CrossRef]
- Buonanno, G.; Marini, S.; Morawska, L.; Fuoco, F.C. Individual dose and exposure of Italian children to ultrafine particles. Sci. Total Environ. 2012, 438, 271–277. [Google Scholar] [CrossRef] [PubMed]
- Buonanno, G.; Stabile, L.; Morawska, L.; Russi, A. Children exposure assessment to ultrafine particles and black carbon: The role of transport and cooking activities. Atmos. Environ. 2013, 79, 53–58. [Google Scholar] [CrossRef]
- Baumgartner, J.; Zhang, Y.; Schauer, J.J.; Haung, W.; Wang, Y.; Ezzati, M. Highway proximity and black carbon from cookstoves as a risk factor for higher blood pressure in rural China. Proc. Natl. Acad. Sci. USA 2014, 111, 13229–13234. [Google Scholar] [CrossRef]
- Branco, P.T.; Alvim-Ferraz, M.C.; Martins, F.G.; Sousa, S.I. Indoor air quality in urban nurseries at Porto city: Particulate matter assessment. Atmos. Environ. 2014, 84, 133–143. [Google Scholar] [CrossRef]
- Beko, G.; Kjeldsen, B.U.; Olsen, Y.; Schipperijn, J.; Wierzbicka, A.; Karottki, D.G.; Toftum, J.; Loft, S.; Clausen, G. Contribution of various microenvironments to the daily personal exposure to ultrafine particles: Personal monitoring coupled with GPS tracking. Atmos. Environ. 2015, 110, 122–129. [Google Scholar] [CrossRef]
- Cortez-Lugo, M.; Moreno-Macias, H.; Holguin-Molina, F.; Chow, J.C.; Watson, J.G.; Gutierrez-Avedoy, V.; Mandujano, F.; Hernandez-Avila, M.; Romieu, I. Relationship between indoor, outdoor, and personal fine particle concentrations for individuals with COPD and predictors of indoor-outdoor ratio in Mexicocity. J. Expo. Sci. Environ. Epidemiol. 2008, 18, 109–115. [Google Scholar] [CrossRef]
- Cortez-Lugo, M.; Ramirez-Aguilar, M.; Perez-Padilla, R.; Sansores, M.R.; Ramirez-Venegas, A.; Barraza-Villarreal, A. Effect of Personal Exposure to PM2.5 on Respiratory Health in a Mexican Panel of Patients with COPD. Int. J. Environ. Res. Public Health 2015, 12, 10635–10647. [Google Scholar] [CrossRef] [PubMed]
- Cipolla, M.; Bruzzone, M.; Stagnaro, E.; Ceppi, M.; Izzotti, A.; Culotta, C.; Piccardo, M.T. Health Issues of Primary School Students Residing in Proximity of an Oil Terminal with Environmental Exposure to Volatile Organic Compounds. BioMed Res. Int. 2016, 2016, 4574138. [Google Scholar] [CrossRef]
- Cleary, E.; Asher, M.; Olawoyin, R.; Zhang, K. Assessment of indoor air quality exposures and impacts on respiratory outcomes in River Rouge and Dearborn, Michigan. Chemosphere 2017, 187, 320–329. [Google Scholar] [CrossRef]
- Cheung, P.K.; Jim, C.Y.; Siu, C.T. Air quality impacts of open-plan cooking in tiny substandard homes in Hong Kong. Air Qual. Atmos. Health 2019, 12, 865–878. [Google Scholar] [CrossRef]
- Cunha-Lopes, I.; Martins, V.; Faria, T.; Correia, C.; Almeida, S.M. Children’s exposure to sized-fractioned particulate matter and black carbon in an urban environment. Build. Environ. 2019, 155, 187–194. [Google Scholar] [CrossRef]
- Curto, A.; Donaire-Gonzalez, D.; Manaca, M.N.; Gonzalez, R.; Sacoor, C.; Rivas, L.; Gascon, M.; Wellenius, G.A.; Querol, X.; Sunyer, J.; et al. Predictors of personal exposure to black carbon among women in southern semi-rural Mozambique. Environ. Int. 2019, 131, 104962. [Google Scholar] [CrossRef] [PubMed]
- Delfino, R.J.; Staimer, N.; Gillen, D.; Tjoa, T.; Sioutas, C.; Fung, K.; George, S.C.; Kleinman, M.T. Personal and ambient air pollution is associated with increased exhaled nitric oxide in children with asthma. Environ. Health Perspect. 2006, 114, 1736–1743. [Google Scholar] [CrossRef] [PubMed]
- Diapouli, E.; Chaloulakou, A.; Spyrellis, N. Levels of ultrafine particles in different microenvironments—Implications to children exposure. Sci. Total Environ. 2007, 388, 128–136. [Google Scholar] [CrossRef] [PubMed]
- Diapouli, E.; Chaloulakou, A.; Mihalopoulos, N.; Spyrellis, N. Indoor and outdoor PM mass and number concentrations at schools in the Athens area. Environ. Monit. Assess. 2007, 136, 13–20. [Google Scholar] [CrossRef] [PubMed]
- Fang, L.; Norris, C.; Johnson, K.; Cui, X.; Sun, J.; Teng, Y.; Tian, E.; Xu, W.; Li, Z.; Mo, J.; et al. Toxic volatile organic compounds in 20 homes in Shanghai: Concentrations, inhalation health risks, and the impacts of household air cleaning. Build. Environ. 2019, 157, 309–318. [Google Scholar] [CrossRef]
- Faria, T.; Martins, V.; Correia, C.; Canha, N.; Diapouli, E.; Manousakas, M.; Eleftheriadis, K.; Ameida, S.M. Children’s exposure and dose assessment to particulate matter in Lisbon. Build. Environ. 2020, 171, 106666. [Google Scholar] [CrossRef]
- Gokhale, S.; Kohajda, T.; Schlink, W. Source apportionment of human personal exposure to volatile organic compounds in homes, offices and outdoors by chemical mass balance and genetic algorithm receptor models. Sci. Total Environ. 2008, 407, 122–138. [Google Scholar] [CrossRef]
- Goyal, R.; Khare, M. Indoor-outdoor concentrations of RSPM in classroom of a naturally ventilated school building near an urban traffic roadway. Atmos. Environ. 2009, 43, 6026–6038. [Google Scholar] [CrossRef]
- Guo, H.; Morawska, L.; He, C.; Zhang, Y.L.; Ayoko, G.; Cao, M. Characterization of particle number concentrations and PM2.5 in a school: Influence of outdoor air pollution on indoor air. Environ. Sci. Pollut. Res. 2010, 17, 1268–1278. [Google Scholar] [CrossRef]
- Gao, Y.; Zhang, Y.; Kamijima, M.; Sakai, K.; Khalequzzaman, M.; Nakajima, T.; Shi, R.; Wang, X.; Chen, D.; Ji, X.; et al. Quantitative assessments of indoor air pollution and the risk of childhood acute leukemia in Shanghai. Environ. Pollut. 2014, 187, 81–89. [Google Scholar] [CrossRef] [PubMed]
- Garcia-Hernandez, C.; Ferrero, A.; Estarlich, M.; Ballester, F. Exposure to ultrafine particles in children until 18 years of age: A systematic review. Indoor Air 2019, 30, 7–23. [Google Scholar] [CrossRef] [PubMed]
- Habil, M.; Taneja, A. Children’s Exposure to Indoor Particulate Matter in Naturally Ventilated Schools in India. Indoor Built Environ. 2011, 20, 430–448. [Google Scholar] [CrossRef]
- Hoang, T.; Castorina, R.; Gaspar, F.; Maddalena, R.; Jenkins, P.L.; Zhang, Q.; McKone, T.E.; Benfenati, E.; Shi, A.Y.; Bradman, A. VOC exposures in California early childhood education environments. Indoor Air 2017, 27, 609–621. [Google Scholar] [CrossRef] [PubMed]
- Jansen, K.L.; Larson, T.V.; Koenig, J.Q.; Mar, T.F.; Fields, C.; Stewart, J.; Lippmann, M. Associations between health effects and particulate matter and black carbon in subjects with respiratory disease. Environ. Health Perspect. 2005, 113, 1741–1746. [Google Scholar] [CrossRef]
- Jeong, H.; Park, D. Characteristics of elementary school children’s daily exposure to black carbon (BC) in Korea. Atmos. Environ. 2017, 154, 179–188. [Google Scholar] [CrossRef]
- Jeong, H.; Park, D. Characteristics of peak concentrations of black carbon encountered by elementary school children. Sci. Total Environ. 2018, 637, 418–430. [Google Scholar] [CrossRef]
- Kearney, J.; Wallace, L.; MacNeil, M.; Xu, X.; VanRyswyk, K.; You, H.; Kulka, R.; Wheeler, A.J. Residential indoor and outdoor ultrafine particles in Windsor, Ontario. Atmos. Environ. 2011, 45, 7583–7593. [Google Scholar] [CrossRef]
- Kalimeri, K.; Saraga, D. Indoor air quality investigation of the school environment and estimated health risks: Two-season measurements in primary schools in Kozani, Greece. Atmos. Pollut. Res. 2016, 7, 1128–1142. [Google Scholar] [CrossRef]
- Liu, Y.W.; Qin, N.; Liang, W.; Chen, X.; Hou, R.; Kang, Y.; Guo, Q.; Cao, S.; Suan, X. Polycycl. Aromatic Hydrocarbon Exposure of Children in Typical Household Coal Combustion Environments: Seasonal Variations, Sources, and Carcinogenic Risks. Int. J. Environ. Res. Public Health 2020, 17, 6520. [Google Scholar] [CrossRef]
- Massolo, L.; Rehwagen, M.; Porta, A.; Ronco, A.; Herbarth, O.; Mueller, A. Indoor-Outdoor Distribution and Risk Assessment of Volatile Organic Compounds in the Atmosphere of Industrial and Urban Areas. Environ. Toxicol. 2010, 25, 339–349. [Google Scholar] [CrossRef] [PubMed]
- Mainka, A.; Kozielska, B. Assessment of the BTEX concentrations and health risk in urban nursery schools in Gliwice, Poland. Aims Environ. Sci. 2016, 3, 858–870. [Google Scholar] [CrossRef]
- Mazaheri, M.; Clifford, S.; Jayaratne, R.; Megat, M.; Megat, A.; Fuoco, F.; Buonanno, G.; Morawska, L. School Children’s Personal Exposure to Ultrafine Particles in the Urban Environment. Environ. Sci. Technol. 2014, 48, 113–120. [Google Scholar] [CrossRef] [PubMed]
- Mazaheri, M.; Lin, W.; Clifford, S.; Yue, D.; Zhai, Y.; Xu, M.; Rizza, V.; Morawska, L. Characteristics of school children’s personal exposure to ultrafine particles in Heshan, Pearl River Delta, China—A pilot study. Environ. Int. 2019, 132, 105134. [Google Scholar] [CrossRef] [PubMed]
- Martins, V.; Correia, C.; Cunha-Lopes, I.; Faria, T.; Diapouli, E.; Manousakas, M.I.; Eleftheriadis, K.; Almeida, S.M. Chemical characterisation of particulate matter in urban transport modes. J. Environ. Sci. 2020, 100, 51–61. [Google Scholar] [CrossRef]
- Martins, V.; Faria, T.; Diapouli, E.; Manousakas, M.I.; Eletheriadis, K.; Viana, M.; Almeida, S.M. Relationship between indoor and outdoor size-fractionated particulate matter in urban microenvironments: Levels, chemical composition and sources. Environ. Res. 2020, 183, 109203. [Google Scholar] [CrossRef]
- Phillips, M.L.; Esmen, N.A.; Hall, T.A.; Lynch, R. Determinants of exposure to volatile organic compounds in four Oklahoma cities. J. Expo. Anal. Environ. Epidemiol. 2005, 15, 35–46. [Google Scholar] [CrossRef][Green Version]
- Paunescu, A.C.; Attoui, M.; Bouallala, S.; Sunyer, J.; Momas, I. Personal measurement of exposure to black carbon and ultrafine particles in schoolchildren from PARIS cohort (Paris, France). Indoor Air 2017, 27, 766–779. [Google Scholar] [CrossRef]
- Pacitto, A.; Stabile, L.; Russo, S.; Buonanno, G. Exposure to Submicron Particles and Estimation of the Dose Received by Children in School and Non-School Environments. Atmosphere 2020, 11, 485. [Google Scholar] [CrossRef]
- Raaschou-Nielsen, O.; Lohse, C.; Thomsen, B.L.; Skov, H.; Osle, J.H. Ambient air levels and the exposure of children to benzene, toluene, and xylenes in Denmark. Environ. Res. 1997, 75, 149–159. [Google Scholar] [CrossRef]
- Rojas-Bracho, L.; Suh, H.; Koutrakis, P. Relationships among personal, indoor, and outdoor fine and coarse particle concentrations for individuals with COPD. J. Expo. Anal. Environ. Epidemiol. 2000, 10, 294–306. [Google Scholar] [CrossRef] [PubMed]
- Rojas-Bracho, L.; Suh, H.H.; Catalano, P.J.; Koutrakis, P. Personal exposures to particles and their relationships with personal activities for chronic obstructive pulmonary disease patients living in Boston. J. Air Waste Manag. Assoc. 2004, 54, 207–217. [Google Scholar] [CrossRef] [PubMed]
- Rufo, J.C.; Madureira, J.; Paciencia, I.; Slenzakova, K.; Pereira, M.C.; Pereira, C.; Teixeira, J.P.; Pinto, M.; Moreira, A.; Fernandes, E.O. Exposure Of Children To Ultrafine Particles In Primary Schools In Portugal. J. Toxicol. Environ. Health Part A 2015, 78, 904–914. [Google Scholar] [CrossRef] [PubMed]
- Shendell, D.G.; Winer, A.M.; Stock, T.H.; Thomas, H.; Zhang, L.; Zhang, J.; Maberti, S.; Colome, S.D. Air concentrations of VOCs in portable and traditional classrooms: Results of a pilot study in Los Angeles County. J. Expo. Anal. Environ. Epidemiol. 2004, 14, 44–59. [Google Scholar] [CrossRef] [PubMed]
- Sexton, K.; Adgate, J.L.; Church, T.R.; Ashley, D.L.; Needham, L.L.; Ramachandran, G.; Fredrickson, A.L.; Ryan, A.D. Children’s exposure to volatile organic compounds as determined by longitudinal measurements in blood. Environ. Health Perspect. 2005, 113, 342–349. [Google Scholar] [CrossRef]
- Sohn, H.; Lee, K. Impact of smoking on in-vehicle fine particle exposure during driving. Atmos. Environ. 2010, 44, 3465–3468. [Google Scholar] [CrossRef]
- Soppa, V.J.; Schins, R.P.; Henning, F.; Hellack, B.; Quass, U.; Kaminski, H.; Kuhlbusch, T.A.; Hoffmann, B.; Weinmayr, G. Respiratory Effects of Fine and Ultrafine Particles from Indoor Sources—A Randomized Sham-Controlled Exposure Study of Healthy Volunteers. Int. J. Environ. Res. Public Health 2014, 11, 6871–6889. [Google Scholar] [CrossRef]
- Slezakova, K.; de Oliveira Fernandes, E.; Pereira, M.C. Assessment of ultrafine particles in primary schools: Emphasis on different indoor microenvironments. Environ. Pollut. 2019, 246, 885–895. [Google Scholar] [CrossRef]
- Trenga, C.A.; Sullivan, J.H.; Schildcrout, J.S.; Shepherd, K.P.; Shapiro, G.G.; Liu, L.S.; Kaufman, J.D.; Koenig, J.Q. Effect of particulate air, pollution on lung function in adult and paediatric subjects in a Seattle panel study. Chest 2006, 129, 1614–1622. [Google Scholar] [CrossRef]
- Tran, T.D.; Nguyen, T.X.; Nguyen, H.T.; Vo, H.T.; Nghiem, D.T.; Le, T.H.; Dao, D.S.; Van Nguyen, N. Seasonal Variation, Sources, and Health Risk Assessment of Indoor/Outdoor BTEX at Nursery Schools in Hanoi, Vietnam. Water Air Soil Pollut. 2020, 231, 273. [Google Scholar] [CrossRef]
- Vu, D.C.; Ho, T.L.; Vo, P.H.; Bayati, M.; Davis, A.N.; Gulseven, Z.; Carlo, G.; Palermo, F.; McElroy, J.A.; Nagel, S.C.; et al. Assessment of indoor volatile organic compounds in Head Start child care facilities. Atmos. Environ. 2019, 215, 116900. [Google Scholar] [CrossRef]
- Weisel, C.P.; Zhang, J.; Turpin, B.J.; Morandi, M.T.; Colome, S.; Stock, T.H.; Spektor, D.M.; Korn, L.; Winer, A.; Alimokhtari, S.; et al. Relationship of Indoor, Outdoor and Personal Air (RIOPA) Study: Study design, methods and quality assurance/control results. J. Expo. Anal. Environ. Epidemiol. 2005, 15, 123–137. [Google Scholar] [CrossRef] [PubMed]
- Weichenthal, S.; Dufresne, A.; Infanate-Rivard, C. Indoor nitrogen dioxide and VOC exposures: Summary of evidence for an association with childhood asthma and a case for the inclusion of indoor ultrafine particle measures in future studies. Indoor Built Environ. 2008, 16, 387–399. [Google Scholar] [CrossRef]
- Wangchuk, T.; Mazaheri, M.; Clifford, S.; Dudzinska, M.R.; He, C.; Buonanno, G.; Morawska, L. Children’s personal exposure to air pollution in rural villages in Bhutan. Environ. Res. 2015, 140, 691–698. [Google Scholar] [CrossRef] [PubMed]
- Xia, X.; Qiu, H.; Kwok, T.; Ko, F.W.; Man, C.L.; Ho, K. Time course of blood oxygen saturation responding to short-term fine particulate matter among elderly healthy subjects and patients with chronic obstructive pulmonary disease. Sci. Total Environ. 2020, 723, 138022. [Google Scholar] [CrossRef]
- Yang, F.; Lau, C.F.; Tong, V.W.; Zhang, K.K.; Westerdahl, D.; Ng, S.; Ning, Z. Assessment of personal integrated exposure to fine particulate matter of urban residents in Hong Kong. J. Air Waste Manag. Assoc. 2019, 69, 47–57. [Google Scholar] [CrossRef]
- Zhu, Y.F.; Hinds, W.C.; Krudysz, M.; Kuhn, T.; Froines, J.; Sioutas, C. Penetration of freeway ultrafine particles into indoor environments. J. Aerosol Sci. 2005, 36, 303–322. [Google Scholar] [CrossRef]
- Zamora, M.L.; Pulczinski, J.C.; Johnson, N.; Garcia-Hernandez, R.; Rule, A.; Carrillo, G.; Zietsman, J.; Sandragorsian, B.; Vallamsundar, S.; Askariyeh, M.H.; et al. Maternal exposure to PM2.5 in south Texas, a pilot study. Sci. Total Environ. 2018, 628–629, 1497–1507. [Google Scholar] [CrossRef]
- Zhang, L.J.; Guo, C.; Jia, X.; Xu, H.; Pan, M.; Xu, D.; Shen, X.; Zhang, J.; Tan, J.; Qian, H.; et al. Personal exposure measurements of school-children to fine particulate matter (PM2.5) in winter of 2013, Shanghai, China. PLoS ONE 2018, 13, e0193586. [Google Scholar] [CrossRef]
- Zhou, Y.; Shao, Y.; Yuan, Y.; Liu, J.; Zou, X.; Bai, P.; Zhan, M.; Zhang, P.; Vlaanderen, J.; Vermeulen, R.; et al. Personal black carbon and ultrafine particles exposures among high school students in urban China. Environ. Pollut. 2020, 265, 114825. [Google Scholar] [CrossRef]
- Zhou, H.C.; Lin, J.; Shen, Y.; Deng, F.; Gao, Y.; Liu, Y.; Dong, H.; Zhang, Y.; Sun, Q.; Fang, J.; et al. Personal black carbon exposure and its determinants among elderly adults in urban China. Environ. Int. 2020, 138, 105607. [Google Scholar] [CrossRef] [PubMed]
- Zusman, M.; Gassett, A.J.; Kirwa, K.; Barr, R.G.; Cooper, C.B.; Han, M.K.; Kanner, R.E.; Koehler, K.; Ortega, V.E.; Paine, R.; et al. Modeling residential indoor concentrations of PM2.5, NO2, NOx, and secondhand smoke in the Subpopulations and Intermediate Outcome Measures in COPD (SPIROMICS) Air study. Indoor Air 2020, 31, 702–716. [Google Scholar] [CrossRef] [PubMed]
- Jack, D.; Ae-Ngibise, K. A cluster randomised trial of cookstove interventions to improve infant health in Ghana. BMJ Global Health. 2021, 6, e005599. [Google Scholar] [CrossRef] [PubMed]
- De Kluizenaar, Y.; Kuijpers, E.; Eekhout, I.; Voogt, M.; Vermeulen, R.C.; Hoek, G.; Sterkenburg, R.P.; Pierik, F.H.; Duyzer, J.H.; Meijer, E.W.; et al. Personal exposure to UFP in different micro-environments and time of day. Build. Environ. 2017, 122, 237–246. [Google Scholar] [CrossRef]
Publisher’s Note: MDPI stays neutral with regard to jurisdictional claims in published maps and institutional affiliations. |
© 2022 by the authors. Licensee MDPI, Basel, Switzerland. This article is an open access article distributed under the terms and conditions of the Creative Commons Attribution (CC BY) license (https://creativecommons.org/licenses/by/4.0/).