
Comparative Study of Sampling and Measurement Methods for the Development of CH4 Emission Factors at MSW Incinerators


Abstract
:1. Introduction
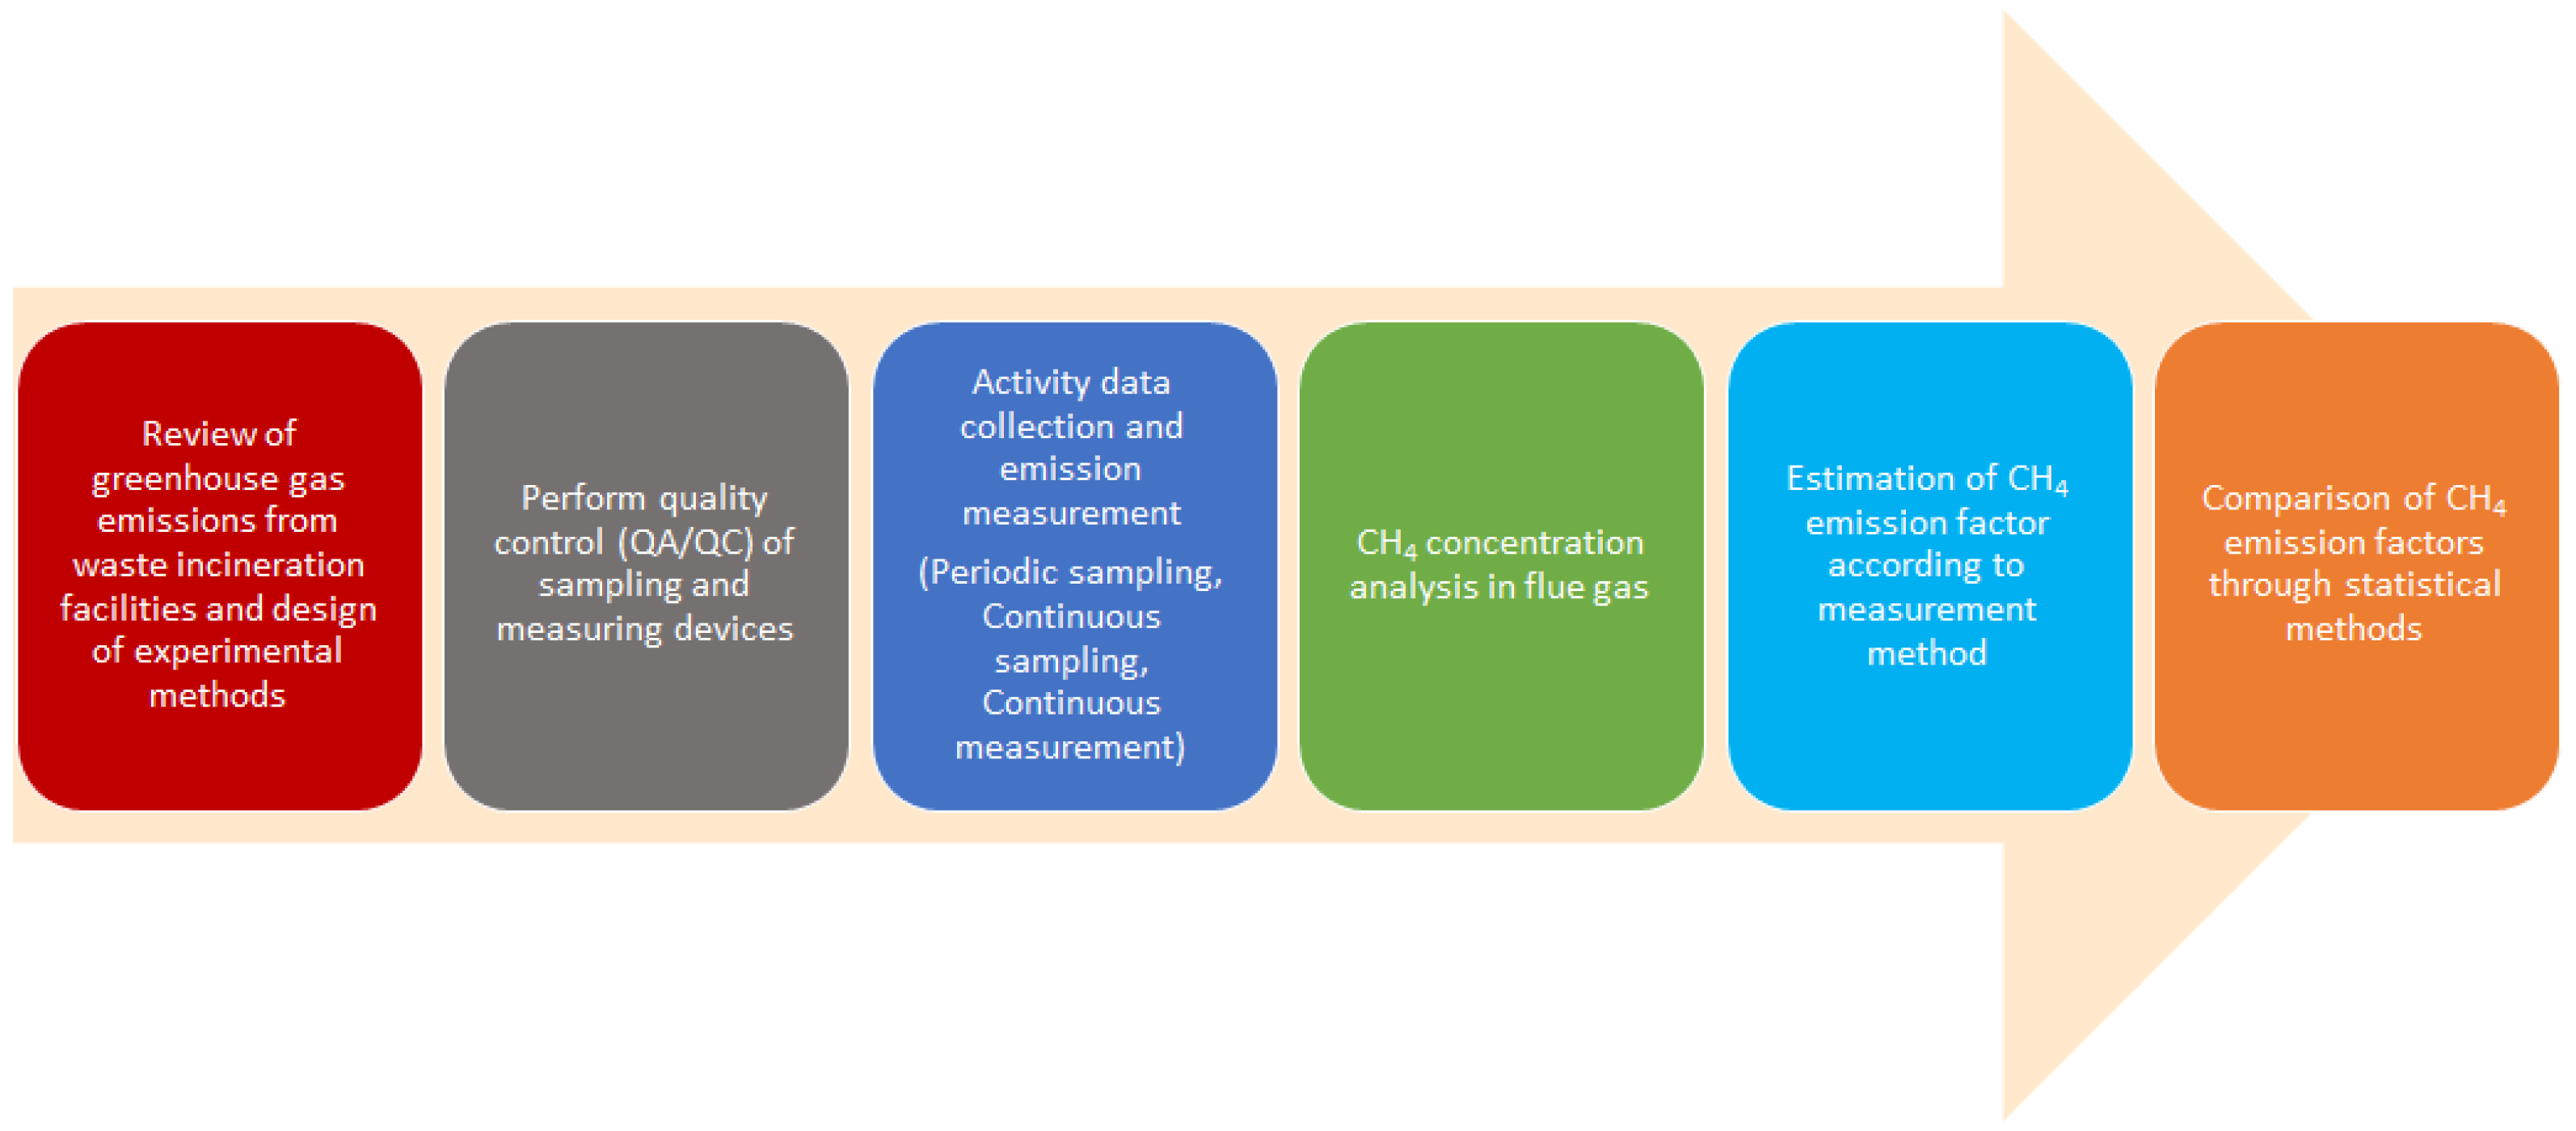
2. Methods
2.1. Selection of Facilities
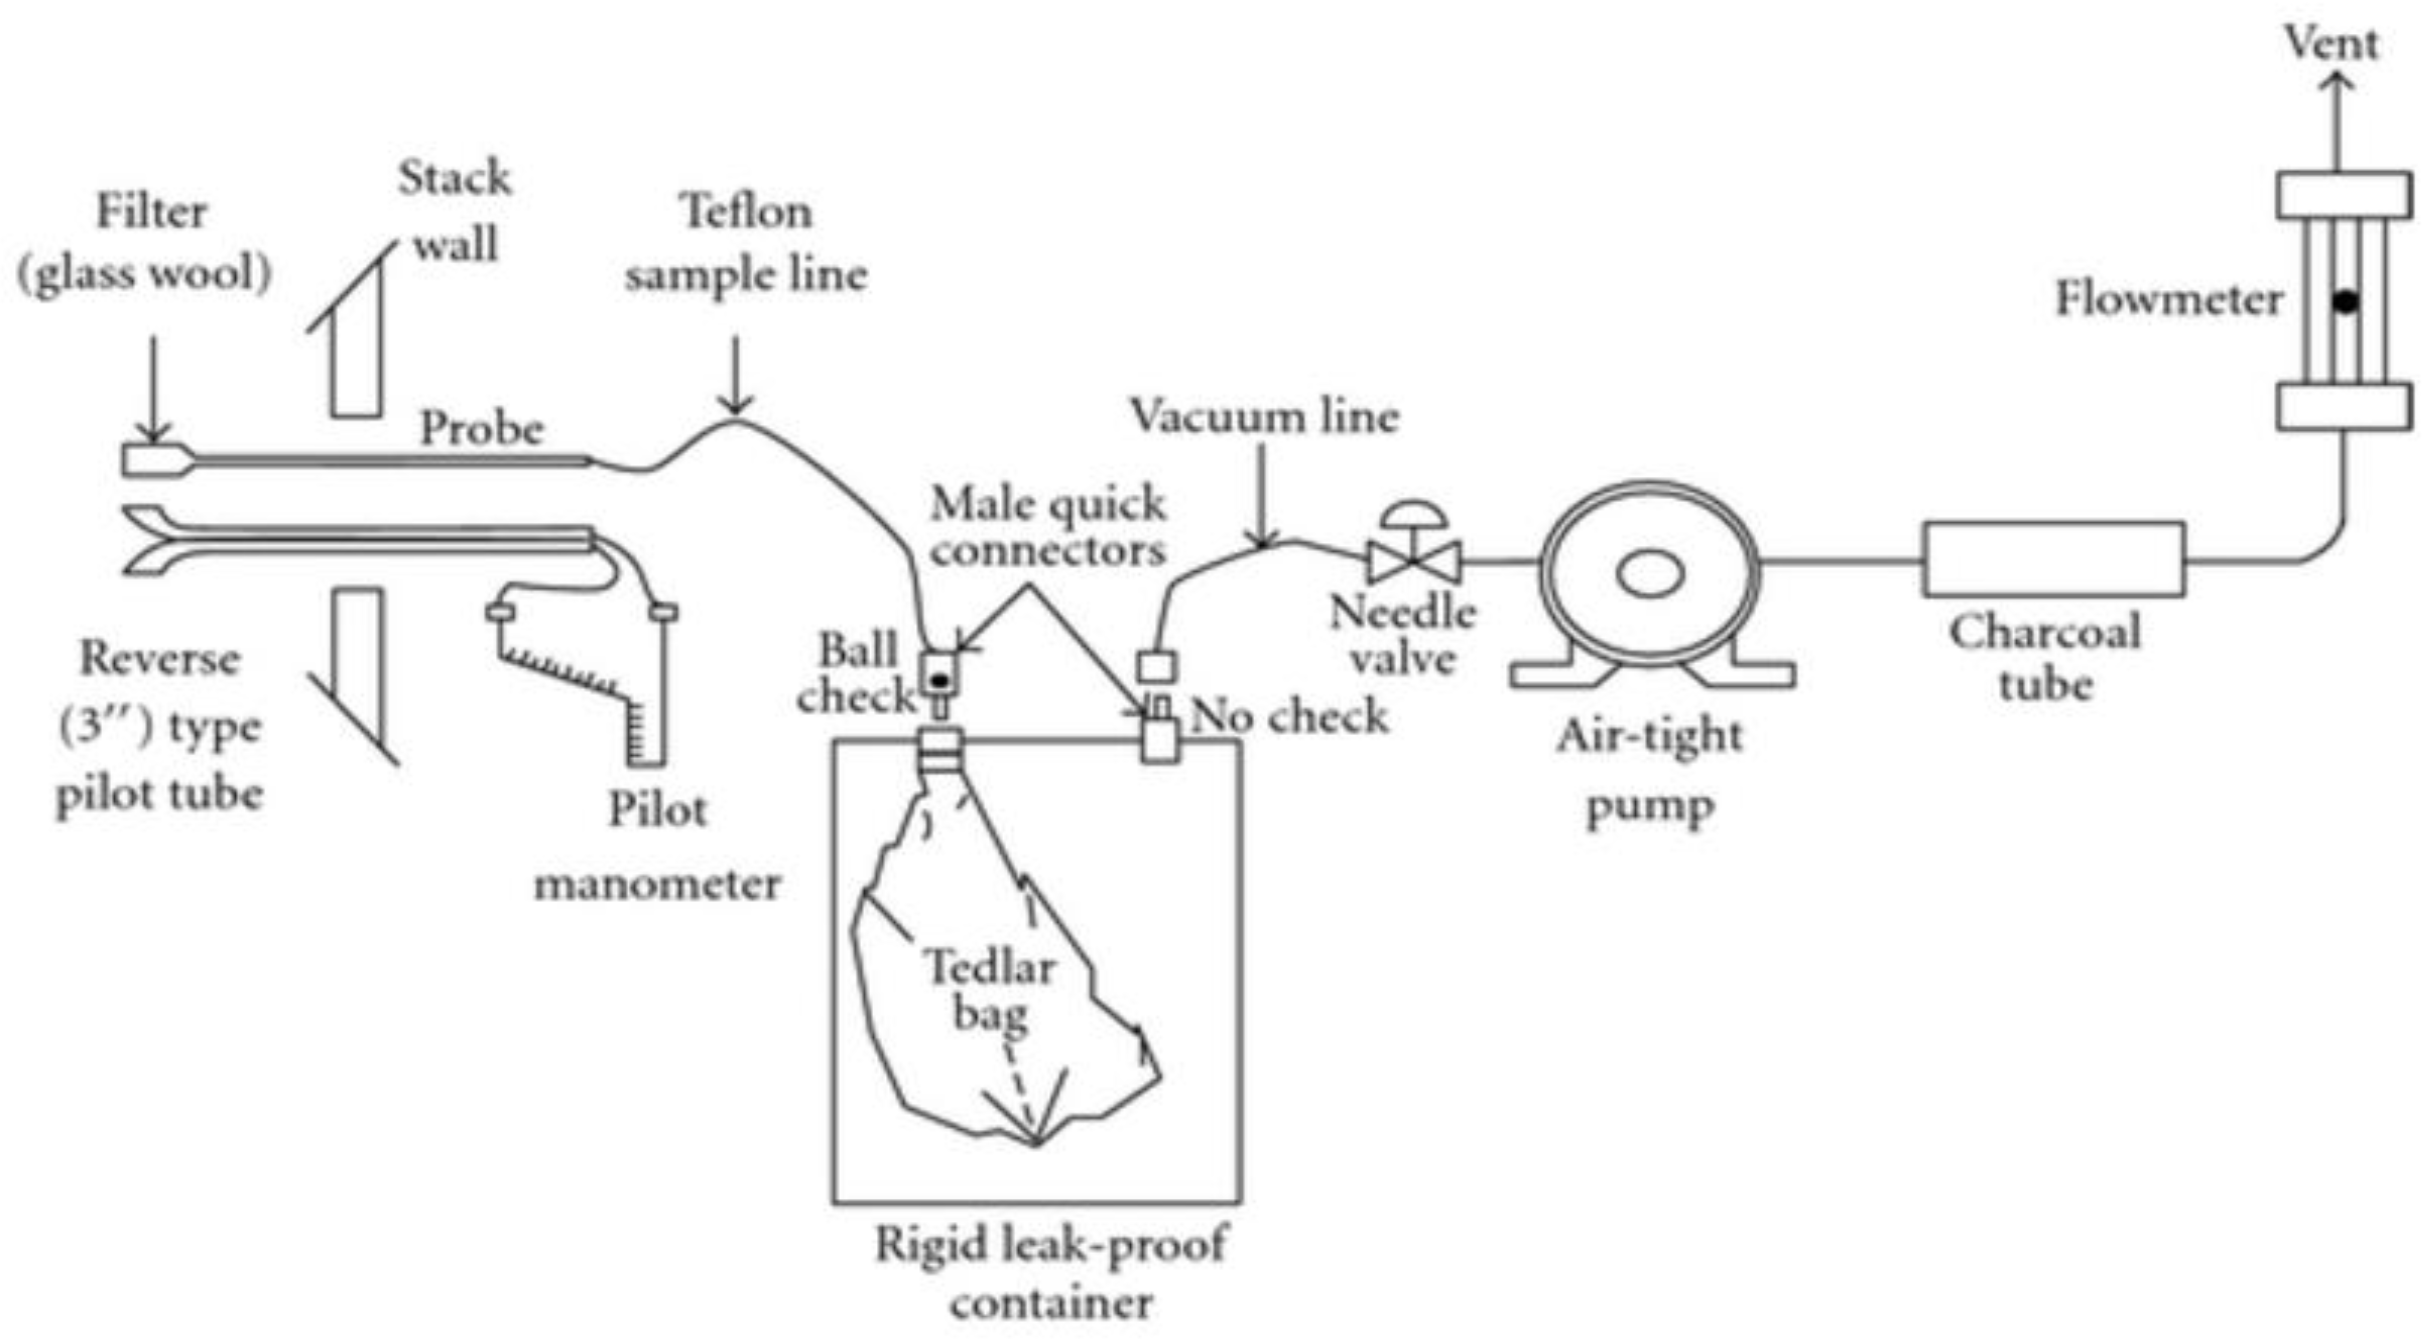
2.2. Sampling and Measurement Methods
2.2.1. Periodic Sampling Method
2.2.2. Continuous Sampling Method
2.2.3. Continuous Measurement Method
2.3. Analysis of CH4 Concentration Using Bag Sampling Gas
2.4. Estimation of CH4 Emission Factor at MSW Incinerator
2.5. Statistical Test of CH4 Emission Factor
3. Results
3.1. CH4 Concentrations after Sampling and Measurement
3.2. CH4 Emission Factor Based on Different Sampling Methods
3.3. Statistical Comparison of Sampling Methods
4. Conclusions
- The CH4 concentration measurement methodology was reviewed for the stoker incineration facility, and an appropriate method was suggested so that it can be referred to when developing an emission factor.
- Statistical characteristics of CH4 concentration data for each CH4 measurement method are presented so that the relevant person in charge and researchers can refer to them when reviewing the methodology.
- It can be used as basic data when developing the CH4 emission factor of the stoker incineration method among domestic waste incineration facilities by revealing the CH4 emission factor values and differences by various measurement methods for the stoker incineration facility.
Author Contributions
Funding
Institutional Review Board Statement
Informed Consent Statement
Data Availability Statement
Acknowledgments
Conflicts of Interest
References
- Ministry of Environment. National Waste Generation and Treatment Status. Available online: https://www.index.go.kr/potal/main/EachDtlPageDetail.do?idx_cd=1477 (accessed on 2 March 2022).
- MOA (Ministry of Environment). The 5th (2016–2017) National Waste Statistics Survey 2017; Ministry of Environment: Sejong, Korea, 2017.
- GIR (Greenhouse Gas Inventory and Research Center). National Greenhouse Gas Inventory Report of Korea (2020); Greenhouse Gas Inventory and Research Center: Cheongju, Korea, 2020. [Google Scholar]
- Sangkyu, Y. A Study on the Effect of Mixedly Incinerating Large Waste in Domestic Waste Incinerator on the Air Pollutants. Master’s Thesis, Korea National University of Transportation, Chungju, Korea, 2013. [Google Scholar]
- Jeongwoo, L.; Seongmin, K.; Seungjin, K.; Soyoung, K.; Seehyung, L.; Eui-Chan, J. Development of non-CO2 emission factors from MSW pyrolysis melting treatment in Korea. Environ. Earth Sci. 2015, 74, 4157–4162. [Google Scholar]
- Seongmin, K.; Joonyoung, R.; Eui-chan, J. Seasonal Variation Analysis Method of GHG at Municipal Solid Waste Incinerator. Sustainability 2020, 12, 7425. [Google Scholar]
- Jeongwoo, L. Developing New Methodology of Non-CO2 Emissions in Waste Incineration Facilities. Ph.D. Thesis, Sejong University, Seoul, Korea, 2016. [Google Scholar]
- Kyung-Ho, N.; Il-Seok, S.; Si-Lim, C.; Jae-In, Y.; Ik-Beom, P.; Jin-Gil, K. The Development of Emission Factors of Greenhouse Gas from Middle and Small-Scaled RPF Incineration Facility by Concentration Measurement and Fuel Composition. J. Korean Soc. Atmos. Environ. 2012, 28, 423–434. [Google Scholar]
- Young-Kee, J.; Jung, K.; Kwan, K. Variation of Greenhouse Gas (CO2) Emission Factors and Emissions by Waste Incineration. J. Korean Soc. Environ. Eng. 2008, 30, 243–249. [Google Scholar]
- Kum Lok, H. Greenhouse Gas Emission Factors for Wastewater Treatment and Waste Incineration Facility. Ph.D. Thesis, Seoul National University, Seoul, Korea, 2017. [Google Scholar]
- Xiaojun, W.; Mingsheng, J.; Xiangyu, L.; Ying, X.; Xin, Y.; Chih Ming, K.; Shaohua, C. A comparison of CH4, N2O and CO2 emissions from three different cover types in a municipal solid waste landfill. J. Air Waste Manag. Assoc. 2017, 67, 507–515. [Google Scholar]
- Magaly, B.; Antonia, G. Accounting Greenhouse Gas Emissions from Municipal Solid Waste Treatment by Composting: A Case of Study Bolivia. Eng 2021, 2, 267–277. [Google Scholar]
- Peter, W.T.; James, B.; Angelina, C.; Adam, C.; Andrew, D.; Meg, D.; Ahmed, K.; Kathryn, M.; Alastair, W.; Kirsten, R.; et al. The health impacts of waste incineration: A systematic review. Epidemiology 2019, 44, 40–48. [Google Scholar]
- Raman, S.; Meenakshi, S.; Ratika, S.; Vivek, S. The impact of incinerators on human health and environment. Rev. Environ. Health 2013, 28, 67–72. [Google Scholar]
- Young-jae, J.; Jiyun, W.; Hwa-Soo, L.; Eui-chan, J. A Comparative Study of CH4 Emission Factor of Combined Cycle Power Plant by Sampling Method. J. Clim. Change Res. 2019, 10, 213–219. [Google Scholar]
- Sang-Min, C.; Jong-Kwon, I.; Ji-Hyoung, H.; Sue-Been, L.; Kyung-Duk, Z. The Estimation of Emission Factor of N2O and CH4 Measurement from Stacks in the Waste Incinerators and Cement Production Plants. J. Environ. Health Sci. 2007, 33, 217–226. [Google Scholar]
- Harris, E.; Zeyer, K.; Kegel, R.; Müller, B.; Emmenegger, L.; Mohn, J. Nitrous oxide and methane emissions and nitrous oxide isotopic composition from waste incinerateon in Switzerland. Waste Manag. 2015, 35, 135–140. [Google Scholar] [CrossRef] [PubMed]
- Zhihua, F.; Junfeng, Z.; Cheng-Wei, F.; David, P. The MMT Bag for Emission Source Sampling: Design and Evaluation. J. Air Waste Manag. Assoc. 2001, 51, 60–68. [Google Scholar]
- Chang-Sang, C.; Jae-Hwan, S.; Ki-Kyo, L.; Tae-Mi, Y.; Seung-Jin, K.; Seul-Ki, L.; Eui-chan, J. Development of methane and nitrous oxide emission factors for the biomass fired circulating fluidized bed combustion power plant. Sci. World J. 2012, 2012, 989242. [Google Scholar]
- EPA (United States Environmental Protection Agency). Method 18—Measurement of Gaseous Organic Compound Emissions by Gas Chromatography; United States Environmental Protection Agency: Washingon, DC, USA, 2019.
- Na-eun, K.; Se Wook, H.; Byeong Eun, M.; Gyeong Mun, C.; Yean-Jung, K.; Yong Joo, K.; Dong-cheol, S.; Hyeon Tae, K. Comparison of Carbon Dioxide Emission according to the Year of Use of the Grain Dryer. J. Agric. Life Sci. 2021, 55, 113–120. [Google Scholar]
- Seehyung, L.; Jinsu, K.; Ok Hum, K.; Jeongwoo, L.; Seongho, L.; Eui-chan, J. Development of Non-CO2 Greenhouse Gas Emission Factors for the B-C Oil Fired Boiler Power Plants. J. Korean Soc. Atmos. Environ. 2011, 27, 41–49. [Google Scholar]
- Jae Hun, J.; Joon Young, R.; Hwa Su, L.; Eui-chan, J. Development of Non-CO2 Emission Factor of Wood Chip Fired Fluidized Bed Combustion. J. Clim. Change Res. 2019, 10, 221–226. [Google Scholar]
- Soyoung, K.; Chang-Sang, C.; Seungjin, K.; Seongmin, K.; Hyeongi, Y.; Eui-chan, J. Comparison of N2O Emissions by Greenhouse Gas Emission Estimation Method. J. Clim. Change Res. 2015, 6, 175–184. [Google Scholar]
- ASTM D7459-08; Standard Practice for Collection of Integrated Samples for the Speciation of Biomass (Biogenic) and Fossil-Derived Carbon Dioxide Emitted from Stationary Emissions Sources. American Society for Testing and Materials: Chicago, IL, USA, 2021.
- US EPA (United States Environmental Protection Agency). GHG Mandatory Reporting Rule Rinal Rule; United States Environmental Protection Agency: Washington, DC, USA, 2007.
- US EPA (United States Environmental Protection Agency). Guidelines for CEMS Performance Specifications and Quality Assurance Requirements for Municipal Waste Combustion Facilities; United States Environmental Protection Agency: Washington, DC, USA, 1990.
- ISO 11564:1998; Stationary Source Emissions—Determination of the Mass Concentration of Nitrogen Oxides—Naphthylethylenediamine Photometric Method. ISO (International Organization for Standardization): Geneva, Switzerland, 1998.
- Korean Law Information Center. Available online: https://www.law.go.kr/LSW/admRulLsInfoP.do?admRulSeq=2100000071990 (accessed on 30 December 2016).
- Ghasemi, A.; Zahediasl, S. Normality tests for statistical analysis: A guide for non-statisticians. Int. J. Endocrinol. Metab. 2012, 10, 486–489. [Google Scholar] [CrossRef] [Green Version]
- Ali, Z.; Bala Bhaskar, S. Basic statistical tools in research and data analysis. Indian J. Anaesth. 2016, 60, 662–669. [Google Scholar] [CrossRef]
- Haksik, L.; Jihoon, L. Statistical Package for the Social Sciences Manual; Jyphyunjae: Seoul, Korea, 2011. [Google Scholar]
- Blanca, J.; Alarcón, R.; Arnau, J.; Bono, R.; Bendayan, R. Non-normal data: Is ANOVA still a valid option? Psicothema 2017, 29, 552–557. [Google Scholar]
- Maria, B.; Rafael, A.; Jaume, A.; Roser, B.; Rebecca, B. Effect of variance ratio on ANOVA robustness: Might 1.5 be the limit? Behav. Res. Methods 2018, 50, 937–962. [Google Scholar]
- Vladimir, G.; Mariya, N. Logical Contradictions in the One-Way ANOVA and Tukey–Kramer Multiple Comparisons Tests with More Than Two Groups of Observations. Symmetry 2021, 13, 1387. [Google Scholar]
- Yoonkwon, Y. Sports Statistics Using SPSS Statistics; Idambooks: Paju, Korea, 2012. [Google Scholar]
- Gerald, K. Keller’s Economics and Statistics (Practical Use of Excel); Cengage Learning Korea: Seoul, Korea, 2018. [Google Scholar]


| Site | Incinerator | Incineration (Ton/Day) | Air Pollution Prevention Facility | Description |
|---|---|---|---|---|
| A MSW incinerator | Stoker | 400 | Electrostatic precipitator | Particulate matter prevents |
| Bag filter | Particulate matter prevents | |||
| Wet scrubber | Hazardous gases and particulate matter prevents | |||
| Selective catalytic reduction | Nitrogen oxide prevents |
| No. | Input CH4 Concentration(ppm) (A) | Output CH4 Concentration(ppm) (B) | Difference [(A − B)/A] |
|---|---|---|---|
| 1 | 0.5 | 0.49 | 2% |
| 2 | 0.5 | 0.49 | 2% |
| 3 | 0.5 | 0.49 | 2% |
| 4 | 0.5 | 0.48 | 4% |
| 5 | 0.5 | 0.48 | 4% |
| Mean | 3% | ||
| Characteristic | Continuous Measurement Specifications | |
|---|---|---|
| Detector | FID | |
| Cycle time | 3 min | |
| Gas consumption | Zero air: dry and clean, methane free, 2.5 bar, 250 mL/min. Hydrogen: 3.5 bar 25 mL/min | |
| Measuring rage | Methane | 0.01–10 |
| TNMHC | 0.01–10 | |
| Repeatability | <1% of full scale | |
| linearity | <1% of full scale | |
| No. | Peak Area | Concentration (ppm) |
|---|---|---|
| 1 | 6634 | 0.50 |
| 2 | 6649 | 0.50 |
| 3 | 6640 | 0.50 |
| 4 | 6583 | 0.49 |
| 5 | 6488 | 0.49 |
| 6 | 6494 | 0.49 |
| 7 | 6560 | 0.49 |
| 8 | 6495 | 0.49 |
| 9 | 6593 | 0.49 |
| 10 | 6503 | 0.49 |
| Mean | 6564 | 0.49 |
| SE (standard error) | 20.62 | 0.00 |
| RSE (relative standard error) (%) | 0.31 | 0.31 |
| 1 | 2 | 3 | 4 | 5 | 6 | Mean | n | |
|---|---|---|---|---|---|---|---|---|
| Periodic sampling | 0.416 | 0.432 | 0.385 | 0.482 | 0.598 | 0.681 | 0.499 | 54 |
| Continuous sampling | 0.403 | 0.399 | 0.392 | 0.532 | 0.555 | 0.676 | 0.493 | 6 |
| Continuous measurement | 0.322 | 0.379 | 0.364 | 0.489 | 0.554 | 0.511 | 0.437 | 2160 |
| Periodic Sampling | Continuous Sampling | Continuous Measurement |
|---|---|---|
| 0.236 | 0.237 | 0.209 |
| Normality Test Result | Shapiro–Wilk | |||
|---|---|---|---|---|
| Statistic | Degree of Freedom, DF | Sig. | ||
| Sampling method | Periodic sampling | 0.902 | 6 | 0.386 |
| Continuous sampling | 0.871 | 6 | 0.228 | |
| Continuous measurement | 0.976 | 6 | 0.931 | |
| Hypothesis Test | Content |
|---|---|
| Null hypothesis (H0): | the distribution of CH4 emission factor based on the three methods is the same. |
| Alternative hypothesis (H1): | the distribution of CH4 emission factor based on the three methods is different. |
| Hypothesis Test | Null Hypothesis | Test | Sig. | Decision |
|---|---|---|---|---|
| Sampling method | The distribution of CH4 emission factor is the same across categories of sampling method | Independent samples Kruskal–Wallis test | 0.796 | Reject the null hypothesis |
Publisher’s Note: MDPI stays neutral with regard to jurisdictional claims in published maps and institutional affiliations. |
© 2022 by the authors. Licensee MDPI, Basel, Switzerland. This article is an open access article distributed under the terms and conditions of the Creative Commons Attribution (CC BY) license (https://creativecommons.org/licenses/by/4.0/).
Share and Cite
Kang, S.; Woo, J.; Jeon, E.-c. Comparative Study of Sampling and Measurement Methods for the Development of CH4 Emission Factors at MSW Incinerators. Int. J. Environ. Res. Public Health 2022, 19, 8647. https://doi.org/10.3390/ijerph19148647
Kang S, Woo J, Jeon E-c. Comparative Study of Sampling and Measurement Methods for the Development of CH4 Emission Factors at MSW Incinerators. International Journal of Environmental Research and Public Health. 2022; 19(14):8647. https://doi.org/10.3390/ijerph19148647
Chicago/Turabian StyleKang, Seongmin, Jiyun Woo, and Eui-chan Jeon. 2022. "Comparative Study of Sampling and Measurement Methods for the Development of CH4 Emission Factors at MSW Incinerators" International Journal of Environmental Research and Public Health 19, no. 14: 8647. https://doi.org/10.3390/ijerph19148647
APA StyleKang, S., Woo, J., & Jeon, E.-c. (2022). Comparative Study of Sampling and Measurement Methods for the Development of CH4 Emission Factors at MSW Incinerators. International Journal of Environmental Research and Public Health, 19(14), 8647. https://doi.org/10.3390/ijerph19148647