
Ciprofloxacin and Trimethoprim Adsorption/Desorption in Agricultural Soils


 ,
,  ,
,  ,
,  and
and 
Abstract
:1. Introduction
2. Materials and Methods
2.1. Soil Samples
2.2. Chemicals and Reagents
2.3. Adsorption/Desorption Experiments
2.4. Quantification of the Antibiotics CIP and TRI
2.5. Statistical Analysis and Data Treatment
3. Results
3.1. Soil Characteristics
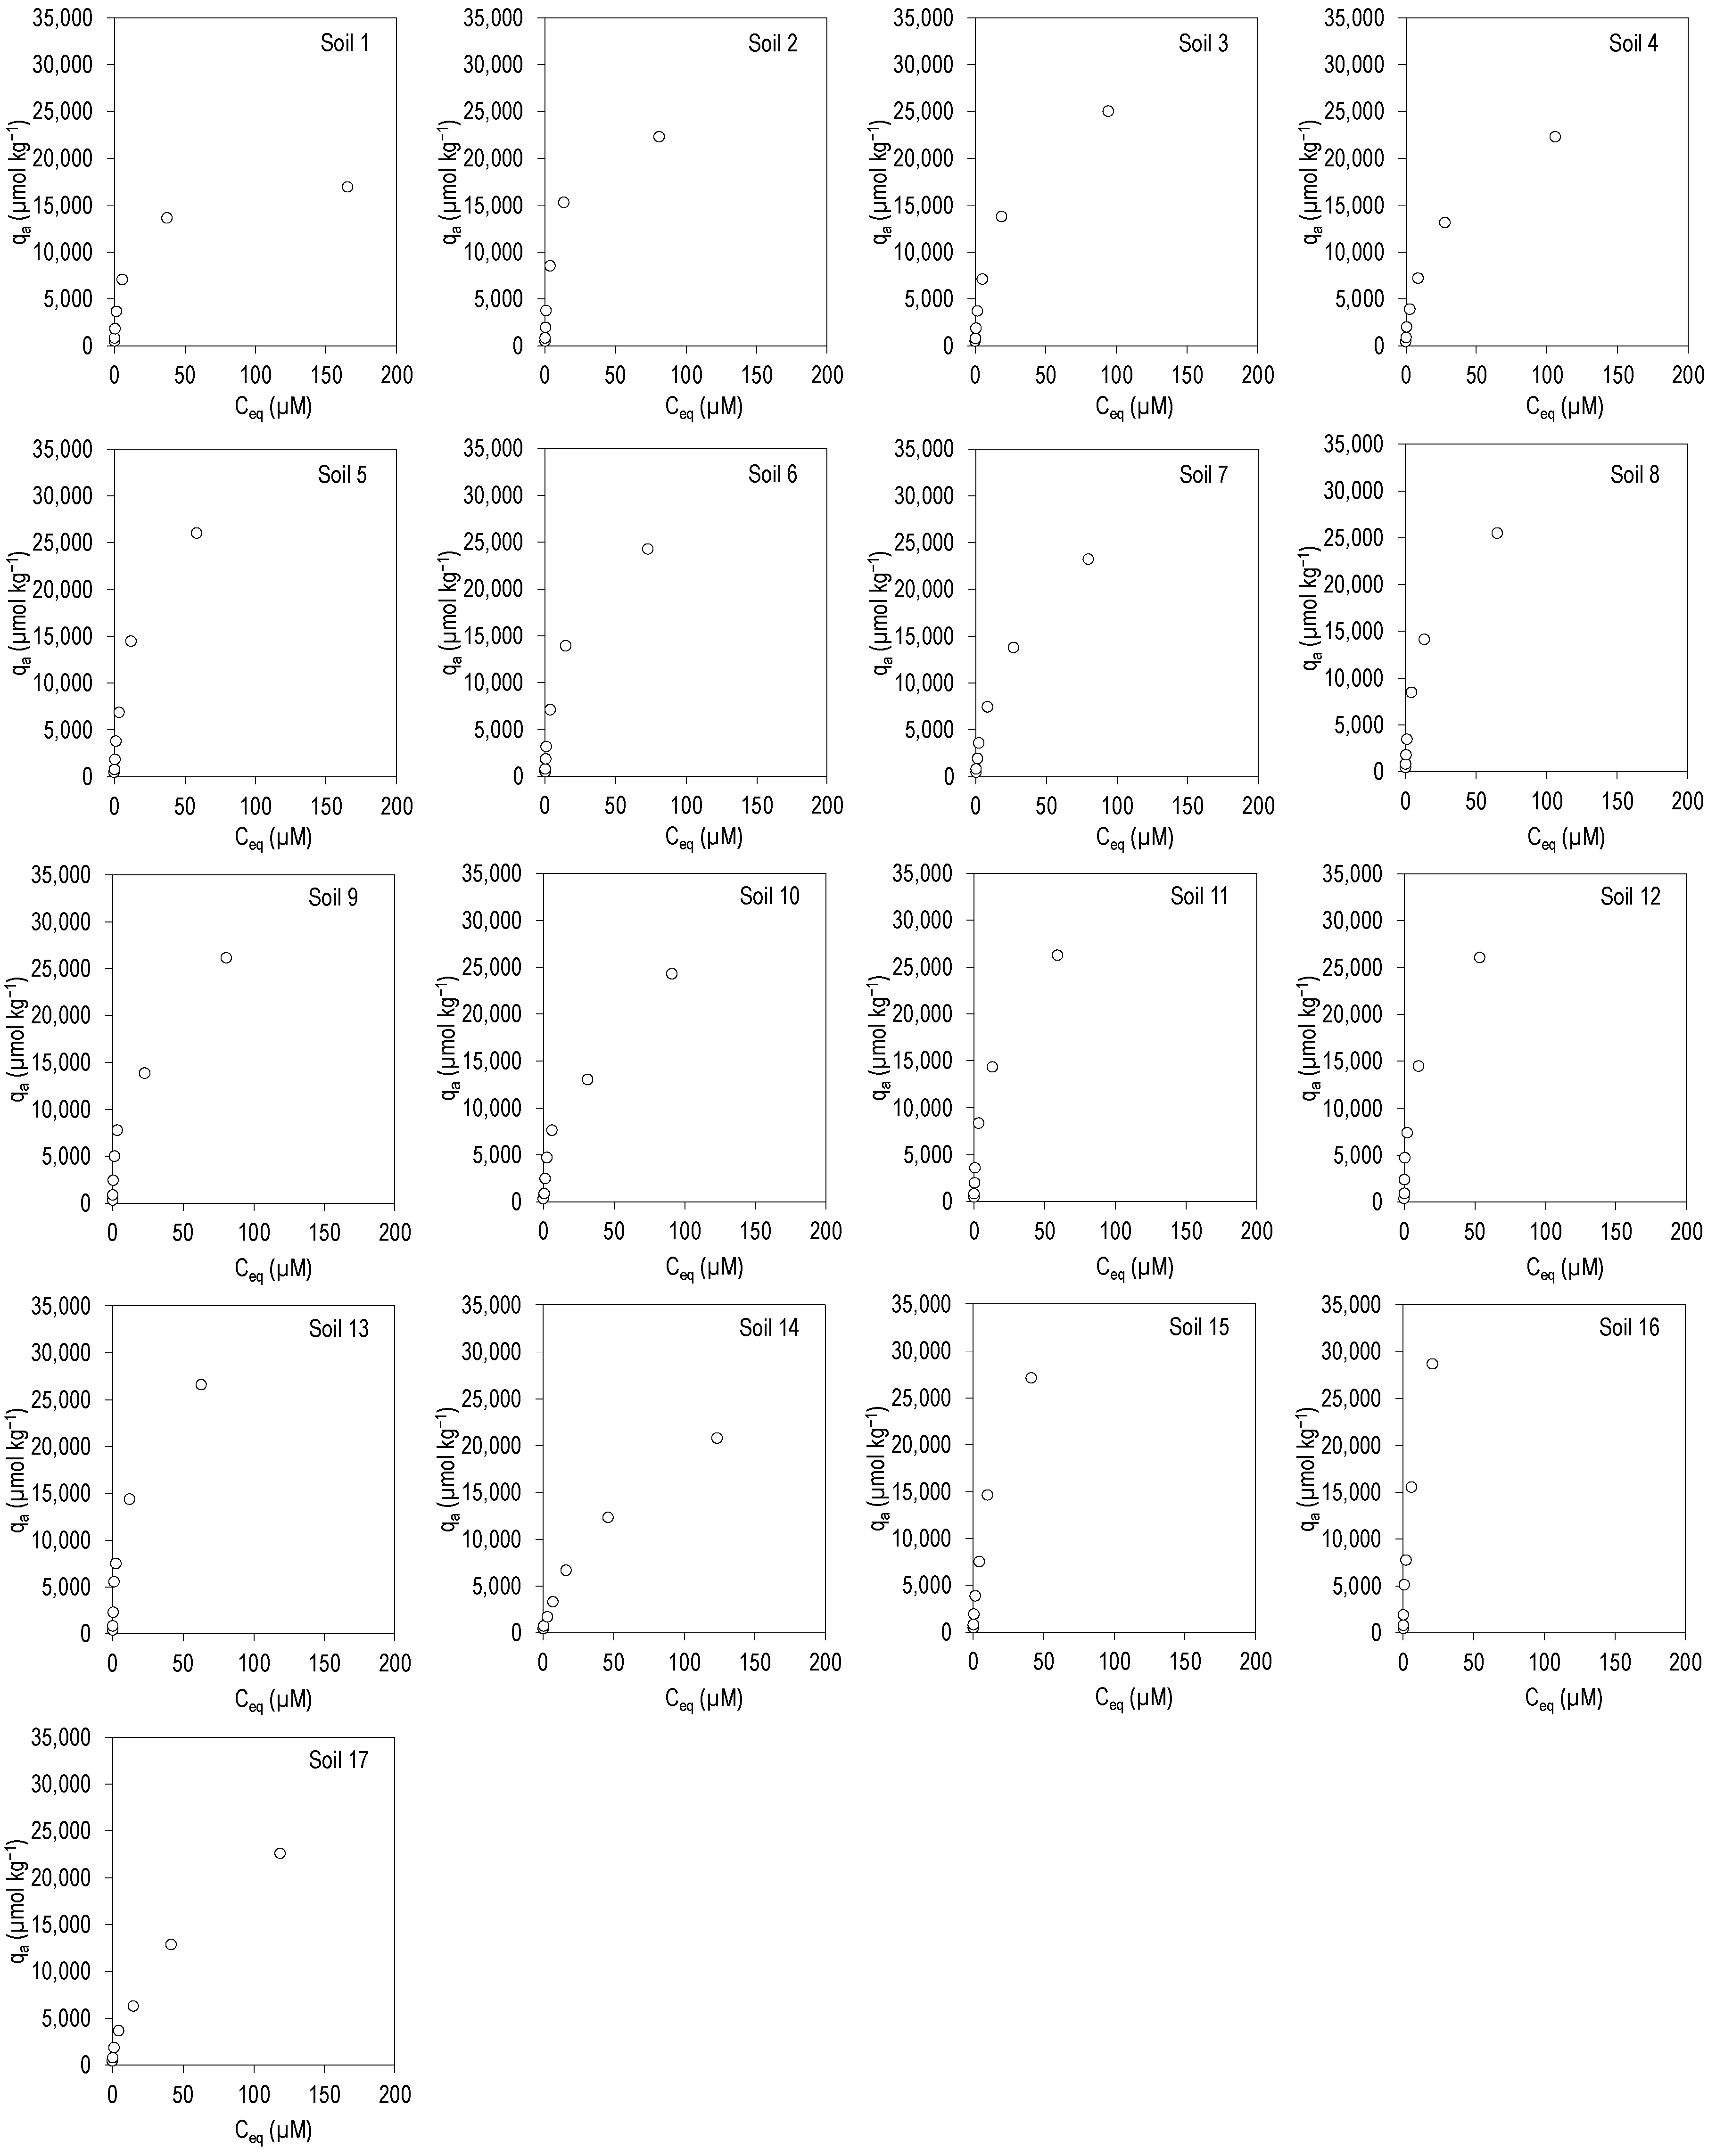
3.2. CIP and TRI Adsorption
3.3. Desorption of CIP and TRI
4. Discussion
5. Conclusions
Supplementary Materials
Author Contributions
Funding
Institutional Review Board Statement
Informed Consent Statement
Data Availability Statement
Conflicts of Interest
References
- Aydın, S.; Ulvi, A.; Bedük, F.; Aydın, M.E. Pharmaceutical residues in digested sewage sludge: Occurrence, seasonal variation and risk assessment for soil. Sci. Total Environ. 2022, 817, 152864. [Google Scholar] [CrossRef] [PubMed]
- Ezzariai, A.; Hafidi, M.; Khadra, A.; Aemig, Q.; El Fels, L.; Barret, M.; Merlina, G.; Patureau, D.; Pinelli, E. Human and veterinary antibiotics during composting of sludge or manure: Global perspectives on persistence, degradation, and resistance genes. J. Hazard. Mater. 2018, 359, 465–481. [Google Scholar] [CrossRef] [PubMed]
- Ji, X.; Shen, Q.; Liu, F.; Ma, J.; Xu, G.; Wang, Y.; Wu, M. Antibiotic resistance gene abundances associated with antibiotics and heavy metals in animal manures and agricultural soils adjacent to feedlots in Shanghai; China. J. Hazard. Mater. 2012, 235–236, 178–185. [Google Scholar] [CrossRef] [PubMed]
- Mejías, C.; Martín, J.; Santos, J.L.; Aparicio, I.; Alonso, E. Occurrence of pharmaceuticals and their metabolites in sewage sludge and soil: A review on their distribution and environmental risk assessment. Trends Environ. Anal. Chem. 2021, 30, e00125. [Google Scholar] [CrossRef]
- Michael, I.; Rizzo, L.; McArdell, C.S.; Manaia, C.M.; Merlin, C.; Schwartz, T.; Dagot, C.; Fatta-Kassinos, D. Urban wastewater treatment plants as hotspots for the release of antibiotics in the environment: A review. Water Res. 2013, 47, 957–995. [Google Scholar] [CrossRef] [Green Version]
- Palacio, D.A.; Urbano, B.F.; Rivas, B.L. Water-soluble polymers with the ability to remove amoxicillin as emerging pollutant from water. Environ. Technol. Innov. 2021, 23, 101589. [Google Scholar] [CrossRef]
- Berges, J.; Moles, S.; Ormad, M.P.; Mosteo, R.; Gómez, J. Antibiotics removal from aquatic environments: Adsorption of enrofloxacin, trimethoprim, sulfadiazine, and amoxicillin on vegetal powdered activated carbon. Environ. Sci. Pollut. Res. 2020, 28, 8442–8452. [Google Scholar] [CrossRef]
- Stylianou, M.; Christou, A.; Michael, C.; Agapiou, A.; Papanastasiou, P.; Fatta-Kassinos, D. Adsorption and removal of seven antibiotic compounds present in water with the use of biochar derived from the pyrolysis of organic waste feed-stocks. J. Environ. Chem. Eng. 2021, 9, 105868. [Google Scholar] [CrossRef]
- Riaz, L.; Mahmood, T.; Khalid, A.; Rashid, A.; Siddique, M.B.A.; Kamal, A.; Coyne, M. Fluoroquinolones (FQs) in the environment: A review on their abundance, sorption and toxicity in soil. Chemosphere 2018, 191, 104–720. [Google Scholar] [CrossRef]
- Food and Agriculture Organization of the United Nations (FAO). Available online: https://www.fao.org/faostat/en/#rankings/commodities_by_country (accessed on 16 June 2022).
- Hu, X.; Zhou, Q.; Luo, Y. Occurrence and source analysis of typical veterinary antibiotics in manure, soil, vegetables and groundwater from organic vegetable bases, northern China. Environ. Pollut. 2010, 158, 2992–2998. [Google Scholar] [CrossRef]
- Guo, Y.; Xiao, X.; Zhao, Y.; Liu, J.; Zhou, J.; Sun, B.; Liang, Y. Antibiotic resistance genes in manure-amended paddy soils across eastern China: Occurrence and influencing factors. Front. Environ. Sci. Eng. 2021, 16, 1–11. [Google Scholar] [CrossRef]
- Cerqueira, F.; Matamoros, V.; Bayona, J.M.; Berendonk, T.U.; Elsinga, G.; Hornstra, L.M.; Piña, B. Antibiotic resistance gene distribution in agricultural fields and crops. A soil-to-food analysis. Environ. Res. 2019, 177, 108608. [Google Scholar] [CrossRef] [PubMed]
- Prosser, R.S.; Sibley, P.K. Human health risk assessment of pharmaceuticals and personal care products in plant tissue due to biosolids and manure amendments, and wastewater irrigation. Environ. Int. 2015, 75, 223–233. [Google Scholar] [CrossRef]
- Yu, C.; Pang, H.; Wang, J.-H.; Chi, Z.-Y.; Zhang, Q.; Kong, F.-T.; Xu, Y.-P.; Li, S.-Y.; Che, J. Occurrence of antibiotics in waters, removal by microalgae-based systems, and their toxicological effects: A review. Sci. Total Environ. 2021, 813, 151891. [Google Scholar] [CrossRef]
- Christou, A.; Agüera, A.; Bayona, J.M.; Cytryn, E.; Fotopoulos, V.; Lambropoulou, D.; Manaia, C.M.; Michael, C.; Revitt, M.; Schröder, P.; et al. The potential implications of reclaimed wastewater reuse for irrigation on the agricultural environment: The knowns and unknowns of the fate of antibiotics and antibiotic resistant bacteria and resistance genes—A review. Water Res. 2017, 123, 448–467. [Google Scholar] [CrossRef] [PubMed] [Green Version]
- Rath, S.; Fostier, A.H.; Pereira, L.A.; Dioniso, A.C.; Ferreira, F.D.O.; Doretto, K.M.; Peruchi, L.M.; Viera, A.; Neto, O.F.D.O.; Bosco, S.M.D.; et al. Sorption behaviors of antimicrobial and antiparasitic veterinary drugs on subtropical soils. Chemosphere 2018, 214, 111–122. [Google Scholar] [CrossRef]
- Tan, K.H. Soil Sampling, Preparation, and Analysis; Marcel Dekker: New York, NY, USA, 1996. [Google Scholar]
- Sumner, M.E.; Miller, W.P. Cation exchange capacity and exchange coefficients. In Methods of Soil Analysis. Part 3. Chemical Methods; Bingham, J.M., Ed.; ASA-SSSA: Madison, WI, USA, 1996. [Google Scholar]
- Bertsch, P.M.; Bloom, P.R. Aluminium. In Methods of Soil Analysis Part 3. Chemical Methods; Sparks, D.L., Ed.; ASA-SSSA: Madison, WI, USA, 1996; pp. 517–550. [Google Scholar]
- Gad-Allah, T.A.; Ali, M.E.; Badawy, M.I. Photocatalytic oxidation of ciprofloxacin under simulated sunlight. J. Hazard. Mater. 2010, 186, 751–755. [Google Scholar] [CrossRef]
- Ghirardini, A.; Grillini, V.; Verlicchi, P. A review of the occurrence of selected micropollutants and microorganisms in different raw and treated manure—Environmental risk due to antibiotics after application to soil. Sci. Total Environ. 2019, 707, 136118. [Google Scholar] [CrossRef]
- Kodešová, R.; Grabic, R.; Kočárek, M.; Klement, A.; Golovko, O.; Fér, M.; Nikodem, A.; Jakšík, O. Pharmaceuticals’ sorptions relative to properties of thirteen different soils. Sci. Total Environ. 2015, 511, 435–443. [Google Scholar] [CrossRef]
- Rodríguez-López, L.; Cela-Dablanca, R.; Núñez-Delgado, A.; Álvarez-Rodríguez, E.; Fernández-Calviño, D.; Arias-Estévez, M. Photodegradation of Ciprofloxacin, Clarithromycin and Trimethoprim: Influence of pH and Humic Acids. Molecules 2021, 26, 3080. [Google Scholar] [CrossRef]
- Giles, C.H.; Smith, D.; Huitson, A. A general treatment and classification of the solute adsorption isotherm. I. Theoretical. J. Colloid Interface Sci. 1974, 47, 755–765. [Google Scholar] [CrossRef]
- Leal, R.M.P.; Alleoni, L.R.F.; Tornisielo, V.L.; Regitano, J.B. Sorption of fluoroquinolones and sulfonamides in 13 Brazilian soils. Chemosphere 2013, 92, 979–985. [Google Scholar] [CrossRef] [PubMed] [Green Version]
- Conkle, J.L.; Lattao, C.; White, J.R.; Cook, R.L. Competitive sorption and desorption behavior for the three fluoroquinolone antibiotics in a wastewater treatment wetland soil. Chemosphere 2010, 80, 1353–1359. [Google Scholar] [CrossRef] [PubMed]
- Uslu, M.; Yediler, A.; Balcıoğlu, I.A.; Schulte-Hostede, S. Analysis and Sorption Behavior of Fluoroquinolones in Solid Matrices. Water Air Soil Pollut. 2007, 190, 55–63. [Google Scholar] [CrossRef]
- Nowara, A.; Burhenne, A.J.; Spiteller, M. Binding of Fluoroquinolone Carboxylic Acid Derivatives to Clay Minerals. J. Agric. Food Chem. 1997, 45, 1459–1463. [Google Scholar] [CrossRef]
- Wang, S.; Wang, H. Adsorption behavior of antibiotic in soil environment: A critical review. Front. Environ. Sci. Eng. 2015, 9, 565–574. [Google Scholar] [CrossRef]
- Vasudevan, D.; Bruland, G.L.; Torrance, B.S.; Upchurch, V.G.; MacKay, A.A. pH-dependent ciprofloxacin sorption to soils: Interaction mechanisms and soil factors influencing sorption. Geoderma 2009, 151, 68–76. [Google Scholar] [CrossRef]
- Movasaghi, Z.; Yan, B.; Niu, C. Adsorption of ciprofloxacin from water by pretreated oat hulls: Equilibrium, kinetic, and thermodynamic studies. Ind. Crop. Prod. 2018, 127, 237–250. [Google Scholar] [CrossRef]
- Peng, X.; Hu, F.; Lam, F.L.-Y.; Wang, Y.; Liu, Z.; Dai, H. Adsorption behavior and mechanisms of ciprofloxacin from aqueous solution by ordered mesoporous carbon and bamboo-based carbon. J. Colloid Interface Sci. 2015, 460, 349–360. [Google Scholar] [CrossRef]
- Sidhu, H.; D’Angelo, E.; O’Connor, G. Retention-release of ciprofloxacin and azithromycin in biosolids and biosolids-amended soils. Sci. Total Environ. 2019, 650, 173–183. [Google Scholar] [CrossRef]
- Williams, M.; Ong, P.L.; Williams, D.B.; Kookana, R.S. Estimating the sorption of pharmaceuticals based on their pharmacological distribution. Environ. Toxicol. Chem. 2009, 28, 2572–2579. [Google Scholar] [CrossRef]
- Zhang, Y.-L.; Lin, S.-S.; Dai, C.-M.; Shi, L.; Zhou, X.-F. Sorption-desorption and transport of trimethoprim and sulfonamide antibiotics in agricultural soil: Effect of soil type, dissolved organic matter, and pH. Environ. Sci. Pollut. Res. 2014, 21, 5827–5835. [Google Scholar] [CrossRef] [PubMed]
- Peng, F.-J.; Ying, G.-G.; Liu, Y.-S.; Su, H.-C.; He, L.-Y. Joint antibacterial activity of soil-adsorbed antibiotics trimethoprim and sulfamethazine. Sci. Total Environ. 2015, 506–507, 58–65. [Google Scholar] [CrossRef] [PubMed]
- Kocárek, M.; Kodesová, R.; Vondrácková, L.; Golovko, O.; Fér, M.; Klement, A.; Nikodem, A.; Jaksík, O.; Grabic, R. Sim-ultaneous sorption of four ionisable pharmaceuticals in different horizons of three soil types. Environ. Pollut. 2016, 218, 563–573. [Google Scholar] [CrossRef] [PubMed]
- Franklin, A.M.; Williams, C.; Andrews, D.M.; Watson, J.E. Sorption and desorption behavior of four antibiotics at concentrations simulating wastewater reuse in agricultural and forested soils. Chemosphere 2022, 289, 133038. [Google Scholar] [CrossRef]
- Salihi, E.C.; Mahramanlıoğlu, M. Equilibrium and kinetic adsorption of drugs on bentonite: Presence of surface active agents effect. Appl. Clay Sci. 2014, 101, 381–389. [Google Scholar] [CrossRef]
- Conde-Cid, M.; Fernández-Calviño, D.; Núñez-Delgado, A.; Fernández-Sanjurjo, M.J.; Arias-Estévez, M.; Álvarez-Rodríguez, E. Estimation of adsorption/desorption Freundlich’s affinity coefficients for oxytetracycline and chloro-tetracycline from soil properties: Experimental data and pedotransfer functions. Ecotox. Environ. Safe. 2020, 196, 110584. [Google Scholar] [CrossRef]
- Conde-Cid, M.; Fernández-Calviño, D.; Fernández-Sanjurjo, M.; Núñez-Delgado, A.; Álvarez-Rodríguez, E.; Arias-Estévez, M. Adsorption/desorption and transport of sulfadiazine, sulfachloropyridazine, and sulfamethazine, in acid agricultural soils. Chemosphere 2019, 234, 978–986. [Google Scholar] [CrossRef]
- Cela-Dablanca, R.; Barreiro, A.; López, L.R.; Santás-Miguel, V.; Arias-Estévez, M.; Núñez-Delgado, A.; Álvarez-Rodríguez, E.; Fernández-Sanjurjo, M.J. Relevance of sorption in bio-reduction of amoxicillin taking place in forest and crop soils. Environ. Res. 2022, 208, 112753. [Google Scholar] [CrossRef]
- Teixidó, M.; Medeiros, J.; Beltran, J.L.; Prat, M.-D.; Granados, M. Sorption of Enrofloxacin and Ciprofloxacin in Agricultural Soils: Effect of Organic Matter. Adsorpt. Sci. Technol. 2014, 32, 153–163. [Google Scholar] [CrossRef]


| Common Name | Chemical Structure | Chemical Formula | Molecular Weight (g mol−1) | Log KOW | pKa | Water Solubility (mg L−1) |
|---|---|---|---|---|---|---|
| Ciprofloxacin 1 |  | C17H18FN3O3 | 331.34 | 0.28 | 6.09–8.74 | 36,000 |
| Trimethoprim 2 | 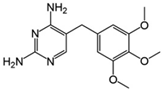 | C14H18N4O3 | 290.32 | 0.91 | 6.16–7.16 | 400 |
| Soil | pHw | pHKCl | Cae | Mge | Nae | Ke | Ale | eCEC | SOC | TSN | Sand | Silt | Clay |
|---|---|---|---|---|---|---|---|---|---|---|---|---|---|
| cmol(c) kg−1 | % | ||||||||||||
| 1 | 5.7 | 5.0 | 3.15 | 0.32 | 1.48 | 0.43 | <0.1 | 5.43 | 1.0 | 0.11 | 48 | 30 | 22 |
| 2 | 5.6 | 4.8 | 3.38 | 0.26 | 1.83 | 0.50 | <0.1 | 6.02 | 1.6 | 0.18 | 44 | 34 | 23 |
| 3 | 6.1 | 5.3 | 6.33 | 1.48 | 18.00 | 11.40 | <0.1 | 37.23 | 2.8 | 0.23 | 61 | 21 | 18 |
| 4 | 5.6 | 4.9 | 4.74 | 1.07 | 1.64 | 11.91 | 0.16 | 19.52 | 3.7 | 0.26 | 69 | 17 | 14 |
| 5 | 6.1 | 5.5 | 8.43 | 1.56 | 2.46 | 10.12 | <0.1 | 22.58 | 4.4 | 0.37 | 50 | 30 | 20 |
| 6 | 5.7 | 4.9 | 13.40 | 1.09 | 2.32 | 0.55 | <0.10 | 17.36 | 4.8 | 0.40 | 58 | 20 | 21 |
| 7 | 5.5 | 4.2 | 6.55 | 0.37 | 2.60 | 0.27 | 0.72 | 10.51 | 6.6 | 0.49 | 66 | 13 | 21 |
| 8 | 7.1 | 6.5 | 8.11 | 0.51 | 0.08 | 0.37 | <0.1 | 9.09 | 2.4 | 0.14 | 67 | 10 | 22 |
| 9 | 7.3 | 6.5 | 10.53 | 1.04 | 0.44 | 0.27 | <0.1 | 12.32 | 3.6 | 0.22 | 67 | 20 | 12 |
| 10 | 5.8 | 4.8 | 5.73 | 0.83 | 0.17 | 1.13 | 0.74 | 8.60 | 4.0 | 0.30 | 62 | 18 | 20 |
| 11 | 5.0 | 4.8 | 4.58 | 0.67 | 0.10 | 0.17 | 0.43 | 5.94 | 2.0 | 0.21 | 46 | 32 | 22 |
| 12 | 5.7 | 5.2 | 6.18 | 0.77 | −0.01 | 0.28 | 0.24 | 7.47 | 2.6 | 0.25 | 44 | 34 | 22 |
| 13 | 5.3 | 5.1 | 5.35 | 0.67 | 0.02 | 0.44 | 0.40 | 6.88 | 2.7 | 0.27 | 43 | 32 | 25 |
| 14 | 8.0 | 7.8 | 39.44 | 2.07 | 0.60 | 0.69 | <0.1 | 42.81 | 5.0 | 0.33 | 50 | 28 | 23 |
| 15 | 6.4 | 6.5 | 21.65 | 1.60 | 0.16 | 0.93 | <0.1 | 24.35 | 5.6 | 0.53 | 59 | 24 | 17 |
| 16 | 6.1 | 6.0 | 18.81 | 1.60 | 0.08 | 0.33 | <0.1 | 20.84 | 7.7 | 0.63 | 63 | 24 | 12 |
| 17 | 5.4 | 5.1 | 4.85 | 0.39 | 0.13 | 0.38 | 0.89 | 6.63 | 3.2 | 0.23 | 61 | 18 | 21 |
| CIP | ||||||||
| Freundlich | Langmuir * | Linear | ||||||
| KF(ads) | n(ads) | R2 | KL(ads) | qm(ads) | R2 | Kd(ads) | R2 | |
| Minimum | 1150 | 0.33 | 0.937 | 0.010 | 17,264 | 0.946 | 90 | 0.840 |
| Maximum | 5086 | 0.60 | 0.998 | 0.140 | 40,722 | 0.998 | 1322 | 0.976 |
| Mean | 3334 | 0.48 | 0.983 | 0.073 | 30,236 | 0.986 | 364 | 0.937 |
| Median | 3422 | 0.47 | 0.988 | 0.080 | 29,985 | 0.992 | 297 | 0.938 |
| TRI | ||||||||
| Freundlich | Langmuir | Linear | ||||||
| KF(ads) | n(ads) | R2 | KL(ads) | qm(ads) | R2 | Kd(ads) | R2 | |
| Minimum | 29 | 0.62 | 0.963 | 0.007 | 1297 | 0.983 | 10 | 0.978 |
| Maximum | 125 | 0.84 | 0.999 | 0.036 | 4460 | 0.999 | 48 | 0.999 |
| Mean | 57 | 0.74 | 0.991 | 0.019 | 2209 | 0.991 | 19 | 0.991 |
| Median | 52 | 0.74 | 0.993 | 0.019 | 1818 | 0.994 | 19 | 0.991 |
| C0 (µmol L−1) | |||||||
|---|---|---|---|---|---|---|---|
| Soil | 5 | 10 | 25 | 50 | 100 | 200 | 400 |
| 1 | 12.0 (2.5) | 17.5 (2.1) | 37.5 (2.1) | 96.0 (2.6) | 327.1 (4.6) | 1093.6 (8.1) | 2077.1 (12.3) |
| 2 | 10.6 (2.2) | 12.6 (1.6) | 24.8 (1.3) | 49.5 (1.3) | 235.1 (2.7) | 556.1 (3.7) | 1181.3 (5.3) |
| 3 | 13.5 (3.0) | 14.6 (1.9) | 26.8 (1.5) | 82.8 (2.2) | 270.1 (3.8) | 754.7 (5.5) | 2228.4 (8.9) |
| 4 | 12.5 (2.9) | 21.0 (2.5) | 47.8 (2.4) | 201.1 (5.2) | 380.1 (5.3) | 855.7 (6.5) | 1527.6 (6.9) |
| 5 | 12.9 (2.7) | 14.0 (1.8) | 24.0 (1.3) | 60.2 (1.6) | 160.4 (2.3) | 533.8 (3.7) | 1766.1 (6.8) |
| 6 | 11.8 (2.5) | 12.4 (1.6) | 22.4 (1.2) | 40.8 (1.3) | 178.7 (2.5) | 472.6 (3.4) | 1520.8 (6.2) |
| 7 | 13.4 (2.8) | 17.6 (2.2) | 54.5 (2.8) | 99.9 (2.8) | 337.7 (4.5) | 784.0 (5.7) | 1240.1 (5.4) |
| 8 | 12.9 (3.0) | 16.2 (1.9) | 28.3 (1.6) | 79.9 (2.3) | 275.6 (3.3) | 633.0 (4.4) | 2267.5 (9.0) |
| 9 | 12.7 (3.6) | 19.4 (2.2) | 30.1 (1.2) | 69.1 (1.4) | 197.1 (2.5) | 997.7 (7.2) | 4056.7 (15.5) |
| 10 | 11.7 (3.4) | 25.9 (3.0) | 95.2 (3.8) | 156.2 (3.3) | 359.0 (4.7) | 1339.0 (10.3) | 3969.2 (16.3) |
| 11 | 11.4 (2.6) | 13.7 (1.8) | 25.9 (1.3) | 43.9 (1.2) | 163.9 (2.0) | 573.9 (4.0) | 1632.9 (6.2) |
| 12 | 11.4 (3.2) | 14.6 (1.7) | 30.5 (1.3) | 69.7 (1.5) | 121.8 (1.6) | 526.2 (3.6) | 1779.1 (6.7) |
| 13 | 15.6 (4.2) | 19.5 (2.3) | 29.0 (1.3) | 57.7 (1.0) | 120.8 (1.6) | 570.6 (4.0) | 2691.4 (10.1) |
| 14 | 26.2 (6.1) | 44.9 (5.9) | 189.9 (11.3) | 402.2 (12.2) | 911.0 (13.7) | 2215.2 (18.0) | 4668.0 (22.4) |
| 15 | 12.8 (3.0) | 15.8 (2.0) | 32.4 (1.7) | 85.0 (2.2) | 268.9 (3.6) | 536.8 (3.7) | 1744.0 (6.4) |
| 16 | 11.4 (2.5) | 13.1 (1.6) | 18.2 (0.9) | 53.9 (1.0) | 100.7 (1.3) | 309.1 (2.0) | 904.1 (3.2) |
| 17 | 0.0 (0.0) | 42.1 (5.6) | 134.5 (7.4) | nd | 462.1 (7.4) | 1033.0 (8.0) | 2078.9 (9.2) |
| Mean | 3.0 | 2.5 | 2.6 | 3.0 | 4.0 | 6.0 | 9.2 |
| Median | 2.9 | 2.0 | 1.5 | 2.2 | 3.3 | 4.4 | 6.9 |
| Minimum | 0.0 | 1.6 | 0.9 | 1.0 | 1.3 | 2.0 | 3.2 |
| Maximum | 6.1 | 5.9 | 11.3 | 12.2 | 13.7 | 18.0 | 22.4 |
| CIP | ||||||||
| Freundlich | Langmuir * | Linear | ||||||
| KF(des) | n(des) | R2 | KL(des) | qm(des) | R2 | Kd(des) | R2 | |
| Minimum | 1089 | 0.42 | 0.966 | 0.010 | 18,154 | 0.958 | 270 | 0.921 |
| Maximum | 6234 | 0.89 | 0.999 | 0.210 | 99,941 | 0.999 | 2336 | 0.999 |
| Mean | 3688 | 0.60 | 0.989 | 0.106 | 40,902 | 0.989 | 946 | 0.962 |
| Median | 4029 | 0.56 | 0.990 | 0.120 | 31,691 | 0.992 | 964 | 0.960 |
| TRI | ||||||||
| Freundlich | Langmuir | Linear | ||||||
| KF(des) | n(des) | R2 | KL(des) | qm(des) | R2 | Kd(des) | R2 | |
| Minimum | 26 | 0.60 | 0.951 | 0.047 | 353 | 0.954 | 29 | 0.968 |
| Maximum | 138 | 1.28 | 0.998 | 0.315 | 1558 | 0.999 | 109 | 0.999 |
| Mean | 78 | 0.83 | 0.983 | 0.120 | 903 | 0.985 | 54 | 0.987 |
| Median | 78 | 0.82 | 0.988 | 0.091 | 836 | 0.988 | 48 | 0.988 |
| C0 (µmol L−1) | |||||||
|---|---|---|---|---|---|---|---|
| Soil | 2.5 | 5 | 10 | 20 | 30 | 40 | 50 |
| 1 | 30.3 (54.4) | 49.6 (54.0) | 89.3 (59.9) | 171.0 (69.8) | 223.5 (70.3) | 289.1 (67.1) | 373.3 (70.6) |
| 2 | 20.7 (35.1) | 43.2 (41.3) | 89.5 (46.0) | 170.6 (52.2) | 243.8 (54.6) | 345.8 (59.5) | 380.4 (61.0) |
| 3 | 35.4 (55.9) | 61.3 (51.1) | 118.3 (52.1) | 221.2 (52.7) | 323.4 (63.0) | 421.3 (59.7) | 526.2 (58.9) |
| 4 | 21.0 (35.0) | 42.7 (40.6) | 81.3 (43.3) | 167.9 (49.2) | 234.6 (52.0) | 305.5 (52.0) | 400.4 (52.8) |
| 5 | 33.8 (41.4) | 65.5 (45.1) | 125.8 (50.7) | 239.3 (49.6) | 342.1 (50.8) | 439.9 (55.7) | 549.2 (53.9) |
| 6 | 35.2 (36.5) | 69.1 (40.5) | 129.8 (46.4) | 255.8 (50.4) | 344.2 (50.7) | 461.1 (56.6) | 573.2 (55.3) |
| 7 | 21.1 (28.8) | 43.6 (32.8) | 92.8 (40.6) | 172.9 (40.4) | 253.2 (45.5) | 332.2 (48.1) | 429.2 (51.0) |
| 8 | 35.0 (42.0) | 65.3 (44.5) | 125.1 (48.8) | 237.3 (53.3) | 353.9 (55.7) | 466.1 (58.5) | 564.3 (60.4) |
| 9 | 44.4 (53.2) | 80.7 (54.7) | 141.4 (56.8) | 238.8 (57.5) | 350.6 (60.6) | 431.9 (61.4) | 526.7 (64.3) |
| 10 | 39.9 (64.8) | 83.5 (59.6) | 114.9 (60.2) | 218.4 (65.9) | 306.3 (62.9) | 413.3 (66.4) | 450.7 (66.8) |
| 11 | 31.6 (53.4) | 55.8 (53.9) | 107.7 (57.7) | 204.0 (63.0) | 304.5 (67.2) | 392.3 (69.0) | 502.5 (71.2) |
| 12 | 45.0 (65.6) | 76.5 (59.5) | 126.6 (61.7) | 242.2 (65.2) | 333.5 (59.1) | 453.5 (64.6) | 508.6 (65.8) |
| 13 | 40.6 (63.8) | 69.8 (62.8) | 114.2 (66.2) | 203.9 (65.4) | 303.2 (62.8) | 375.4 (66.4) | 433.6 (67.6) |
| 14 | 65.2 (71.4) | 73.9 (66.7) | 111.2 (71.4) | 172.2 (72.7) | 240.5 (74.9) | 326.8 (65.0) | 382.1 (66.5) |
| 15 | 44.1 (35.3) | 104.0 (59.8) | 166.7 (47.0) | 247.8 (52.9) | 391.5 (50.3) | 494.5 (53.9) | 556.6 (55.8) |
| 16 | 77.0 (51.0) | 123.5 (59.2) | 177.9 (42.8) | 280.2 (43.6) | 433.1 (41.2) | 551.6 (43.8) | 689.2 (43.4) |
| 17 | 35.9 (44.7) | 47.3 (45.1) | 128.1 (51.6) | 166.1 (58.8) | 270.8 (51.3) | 341.3 (49.6) | 363.2 (50.4) |
| Mean | 49.0 | 51.2 | 53.1 | 56.6 | 57.2 | 58.7 | 59.7 |
| Median | 51.0 | 53.9 | 51.6 | 53.3 | 55.7 | 59.5 | 60.4 |
| Minimum | 28.8 | 32.8 | 40.6 | 40.4 | 41.2 | 43.8 | 43.4 |
| Maximum | 71.4 | 66.7 | 71.4 | 72.7 | 74.9 | 69.0 | 71.2 |
| CIP | |||||
|---|---|---|---|---|---|
| Variable | KF(ads) | n(ads) | KL(ads) | qm(ads) | Kd(ads) |
| pHH2O | −0.280 | 0.351 | −0.281 | 0.193 | 0.009 |
| pHKCl | −0.174 | 0.458 | −0.203 | 0.375 | 0.194 |
| Cae | −0.296 | 0.640 ** | −0.307 | 0.464 | 0.255 |
| Mge | −0.107 | 0.540 * | −0.289 | 0.519 * | 0.371 |
| Nae | −0.071 | −0.142 | −0.145 | −0.125 | −0.179 |
| Ke | −0.128 | −0.051 | −0.230 | −0.075 | −0.154 |
| Ale | −0.405 | 0.290 | −0.462 | 0.158 | −0.205 |
| eCEC | −0.333 | 0.484 * | −0.418 | 0.332 | 0.095 |
| SOC | −0.115 | 0.738 ** | −0.379 | 0.729 ** | 0.605 * |
| TSN | 0.080 | 0.643 ** | −0.178 | 0.736 ** | 0.708 ** |
| Sand | −0.349 | 0.411 | −0.593 * | 0.326 | 0.107 |
| Silt | 0.446 | −0.365 | 0.632 ** | −0.218 | 0.081 |
| Clay | −0.090 | −0.270 | 0.177 | −0.393 | −0.479 |
| TRI | |||||
| pHH2O | 0.110 | 0.026 | 0.198 | 0.357 | 0.186 |
| pHKCl | 0.211 | 0.040 | 0.219 | 0.482 | 0.287 |
| Cae | 0.292 | −0.053 | 0.558 * | 0.442 | 0.279 |
| Mge | 0.321 | 0.175 | 0.075 | 0.588 * | 0.438 |
| Nae | −0.164 | 0.322 | −0.335 | 0.307 | 0.032 |
| Ke | −0.234 | 0.557 * | −0.552 * | 0.518 * | 0.085 |
| Ale | −0.179 | −0.193 | −0.376 | −0.386 | −377 |
| eCEC | 0.099 | 0.291 | −0.088 | 0.677 ** | 0.283 |
| SOC | 0.641 ** | −0.191 | 0.373 | 0.168 | 0.458 |
| TSN | 0.745 ** | −0.276 | 0.439 | 0.199 | 0.579 * |
| Sand | 0.320 | −0.021 | 0.034 | 0.312 | 0.255 |
| Silt | −0.192 | 0.035 | −0.014 | −0.251 | −0.155 |
| Clay | −0.465 | −0.002 | −0.064 | −0.266 | −0.358 |
| CIP | |||||
|---|---|---|---|---|---|
| Variable | KF(des) | n(des) | KL(des) | qm(des) | Kd(des) |
| pHH2O | −0.189 | −0.156 | −0.153 | −0.319 | −0.350 |
| pHKCl | −0.087 | −0.133 | −0.084 | −0.321 | −0.235 |
| Cae | −0.193 | 0.105 | −0.257 | −0.154 | −0.038 |
| Mge | −0.009 | 0.017 | −0.194 | −0.212 | 0.079 |
| Nae | −0.088 | 0.042 | −0.179 | −0.015 | −0.009 |
| Ke | −0.189 | 0.226 | −0.307 | 0.158 | 0.022 |
| Ale | −0.397 | 0.420 | −0.382 | 0.589 * | −0.126 |
| eCEC | −0.273 | 0.198 | −0.413 | −0.068 | −0.026 |
| SOC | −0.009 | 0.373 | −0.303 | 0.321 | 0.499 * |
| TSN | 0.172 | 0.285 | −0.146 | 0.240 | 0.621 ** |
| Sand | −0.317 | 0.400 | −0.501 * | 0.466 | 0.104 |
| Silt | 0.418 | −0.414 | 0.553 * | −0.494 * | 0.034 |
| Clay | −0.122 | −0.116 | 0.075 | −0.145 | −0.354 |
| TRI | |||||
| pHH2O | −0.244 | 0.482 * | −0.268 | 0.239 | −0.042 |
| pHKCl | −0.354 | 0.611 ** | −0.393 | 0.363 | 0.021 |
| Cae | −0.237 | 0.712 ** | −0.389 | 0.625 * | 0.173 |
| Mge | −0.182 | 0.640 ** | −0.664 * | 0.852 ** | 0.274 |
| Nae | 0.054 | −0.053 | 0.350 | 0.049 | −0.009 |
| Ke | 0.137 | 0.004 | −0.294 | 0.531 | 0.145 |
| Ale | 0.018 | 0.014 | 0.001 | −0.160 | 0.069 |
| eCEC | −0.131 | 0.595 * | −0.457 | 0.845 ** | 0.207 |
| SOC | 0.440 | 0.388 | −0.278 | 0.614 * | 0.751 ** |
| TSN | 0.437 | 0.301 | −0.264 | 0.660 * | 0.725 ** |
| Sand | 0.508 * | −0.009 | −0.181 | 0.220 | 0.517 * |
| Silt | −0.502 * | 0.075 | 0.114 | −0.123 | −0.377 |
| Clay | −0.291 | −0.097 | 0.302 | −0.345 | −0.554 * |
Publisher’s Note: MDPI stays neutral with regard to jurisdictional claims in published maps and institutional affiliations. |
© 2022 by the authors. Licensee MDPI, Basel, Switzerland. This article is an open access article distributed under the terms and conditions of the Creative Commons Attribution (CC BY) license (https://creativecommons.org/licenses/by/4.0/).
Share and Cite
Rodríguez-López, L.; Santás-Miguel, V.; Cela-Dablanca, R.; Núñez-Delgado, A.; Álvarez-Rodríguez, E.; Pérez-Rodríguez, P.; Arias-Estévez, M. Ciprofloxacin and Trimethoprim Adsorption/Desorption in Agricultural Soils. Int. J. Environ. Res. Public Health 2022, 19, 8426. https://doi.org/10.3390/ijerph19148426
Rodríguez-López L, Santás-Miguel V, Cela-Dablanca R, Núñez-Delgado A, Álvarez-Rodríguez E, Pérez-Rodríguez P, Arias-Estévez M. Ciprofloxacin and Trimethoprim Adsorption/Desorption in Agricultural Soils. International Journal of Environmental Research and Public Health. 2022; 19(14):8426. https://doi.org/10.3390/ijerph19148426
Chicago/Turabian StyleRodríguez-López, Lucía, Vanesa Santás-Miguel, Raquel Cela-Dablanca, Avelino Núñez-Delgado, Esperanza Álvarez-Rodríguez, Paula Pérez-Rodríguez, and Manuel Arias-Estévez. 2022. "Ciprofloxacin and Trimethoprim Adsorption/Desorption in Agricultural Soils" International Journal of Environmental Research and Public Health 19, no. 14: 8426. https://doi.org/10.3390/ijerph19148426
APA StyleRodríguez-López, L., Santás-Miguel, V., Cela-Dablanca, R., Núñez-Delgado, A., Álvarez-Rodríguez, E., Pérez-Rodríguez, P., & Arias-Estévez, M. (2022). Ciprofloxacin and Trimethoprim Adsorption/Desorption in Agricultural Soils. International Journal of Environmental Research and Public Health, 19(14), 8426. https://doi.org/10.3390/ijerph19148426