
Torso Shape Improves the Prediction of Body Fat Magnitude and Distribution


Abstract
:1. Introduction
2. Materials and Methods
2.1. Participants
2.2. Data Acquisition
- Anthropometrics of the torso:
- ○
- Waist girth (minimum girth in torso),
- ○
- Stomach girth (maximum girth between waist and hips),
- ○
- Hip girth (greatest posterior protuberance of the buttocks),
- ○
- Chest girth (maximum girth of upper torso/bust),
- ○
- Torso length (vertical distance between xiphoid process and hip).
- Maximum girths of left and right thighs,
- Maximum girths of left and right biceps,
- 3D shape parameters of the torso,
- Volumes of the torso and limbs,
- Surface areas of the torso and limbs,
- The anthropometric index WHT.5R (.
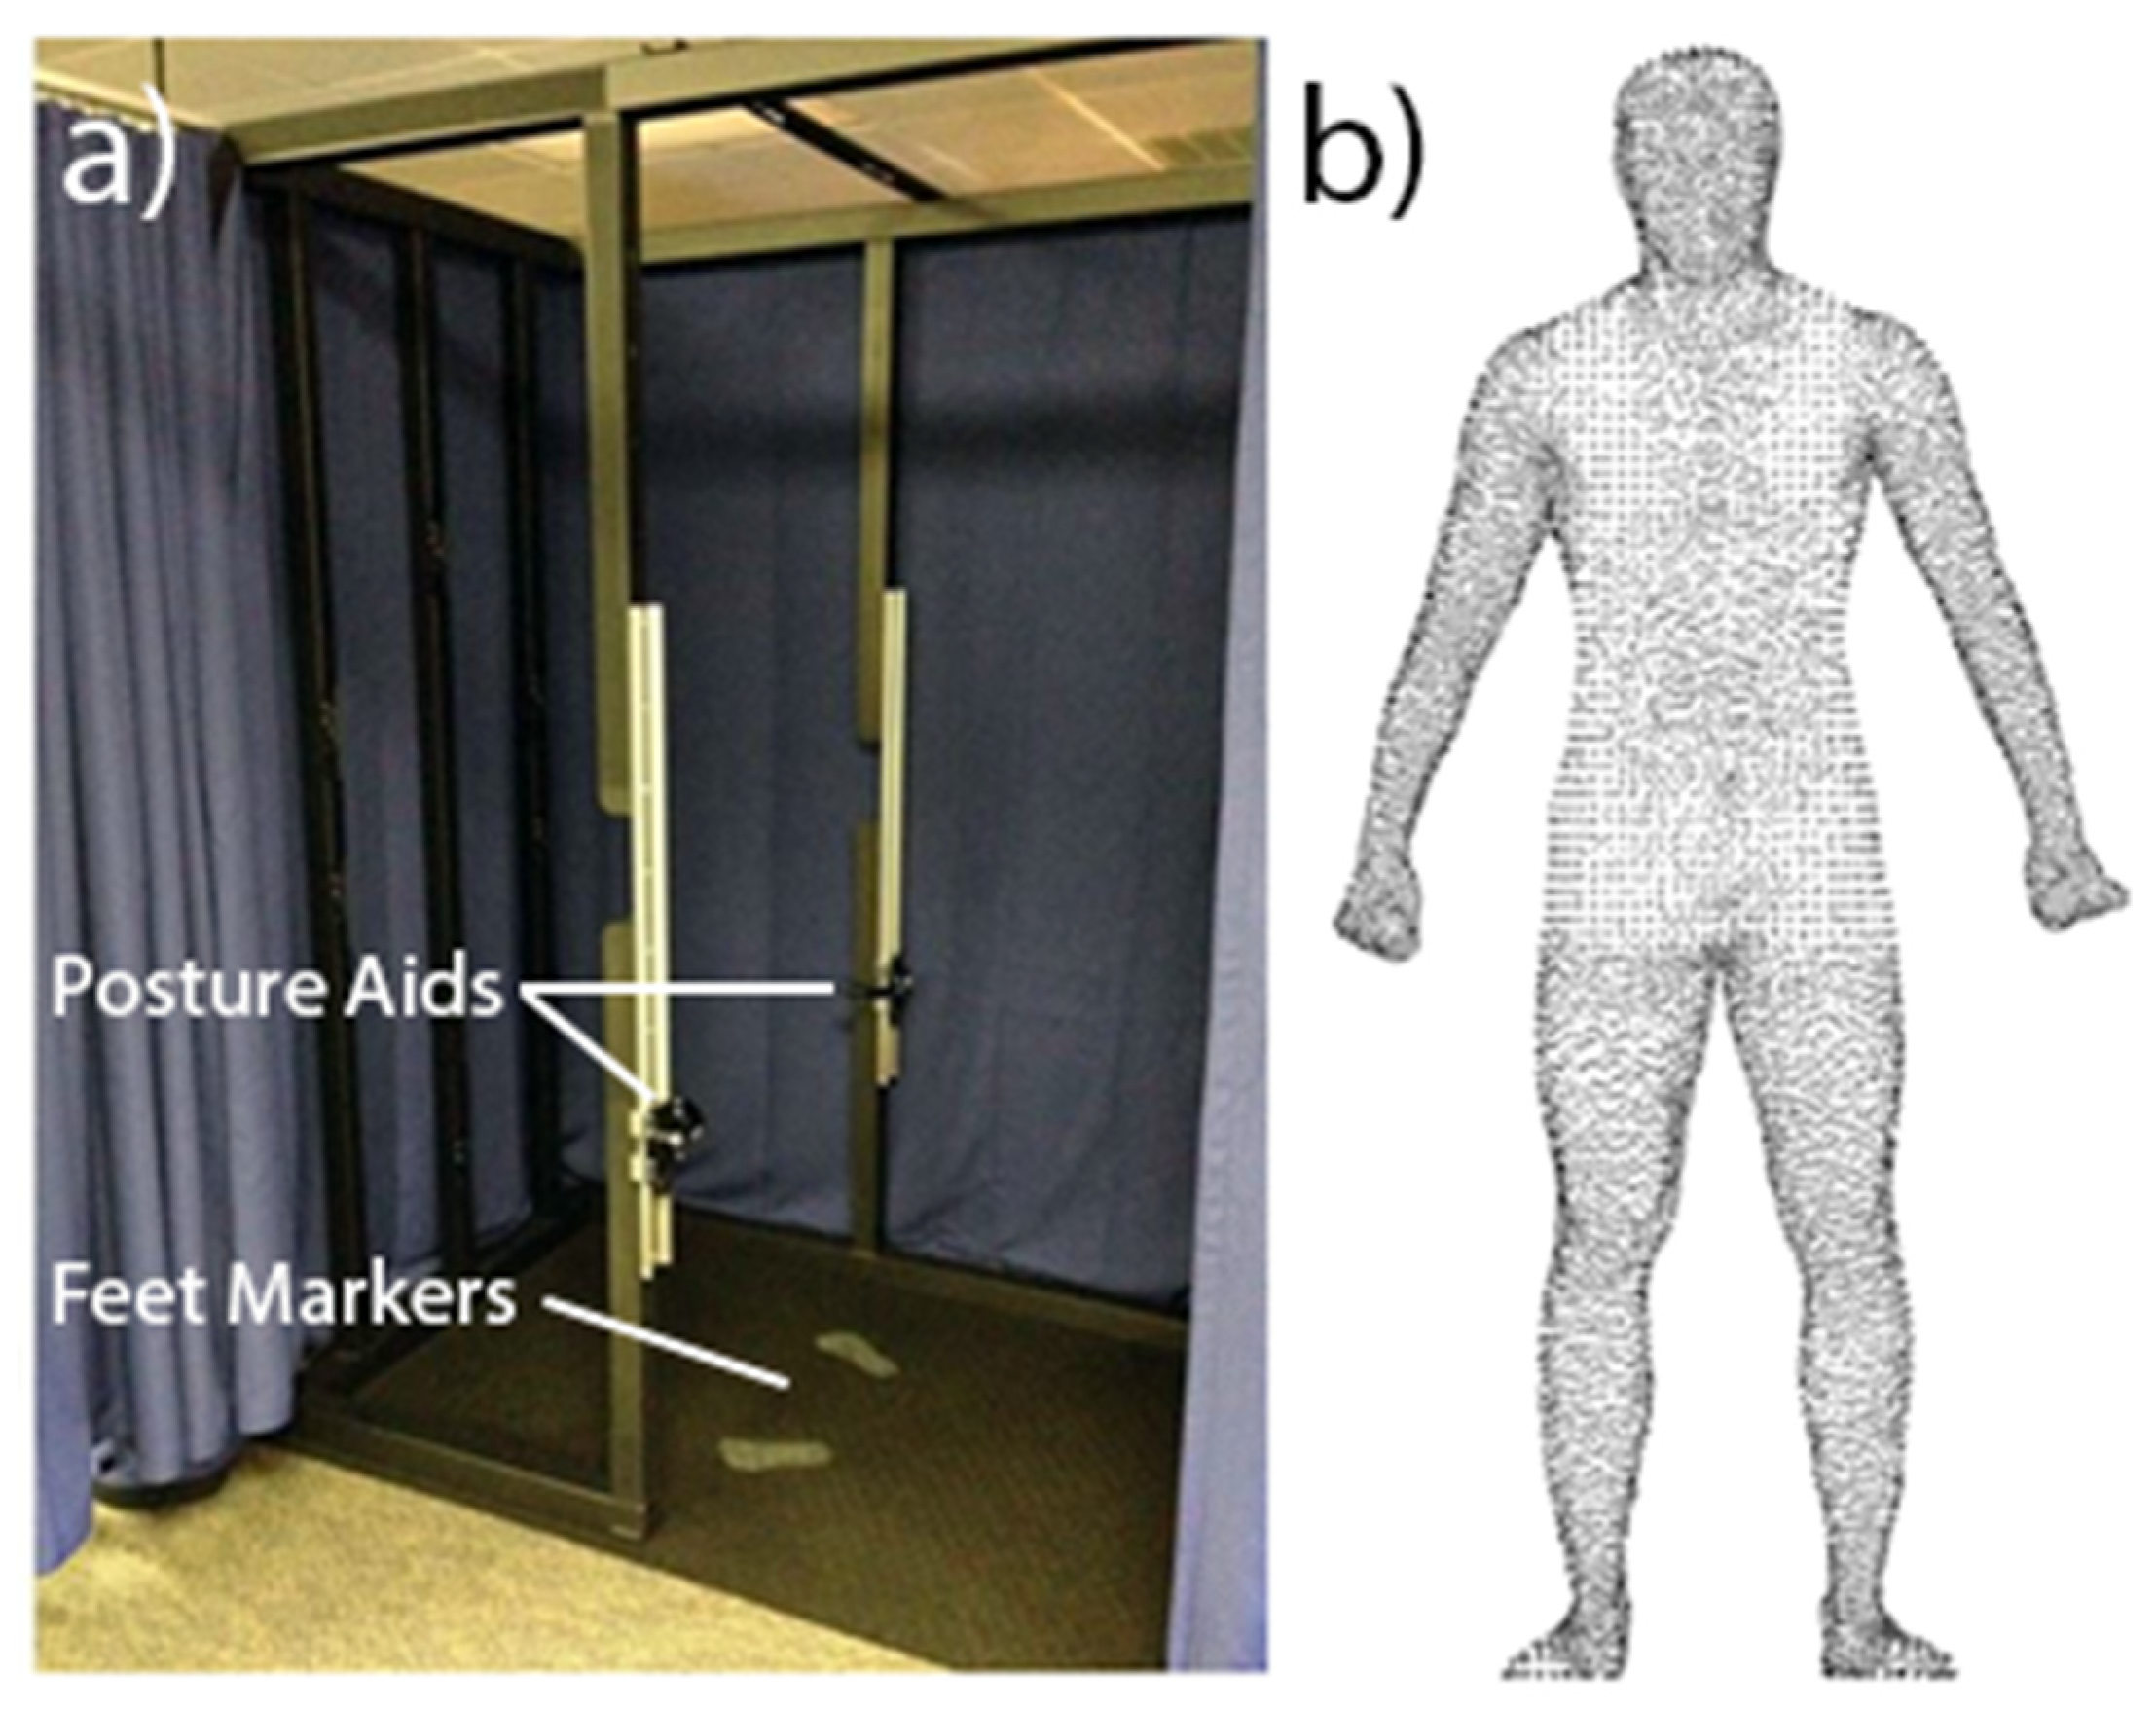
2.2.1. 3D Imaging
2.2.2. Whole-Body Air Displacement Plethysmography (ADP)
2.2.3. Bioelectrical Impedance Analysis (BIA)
2.3. Data Analysis
2.3.1. Body Measures
2.3.2. 3D Imaging Data Post-Processing
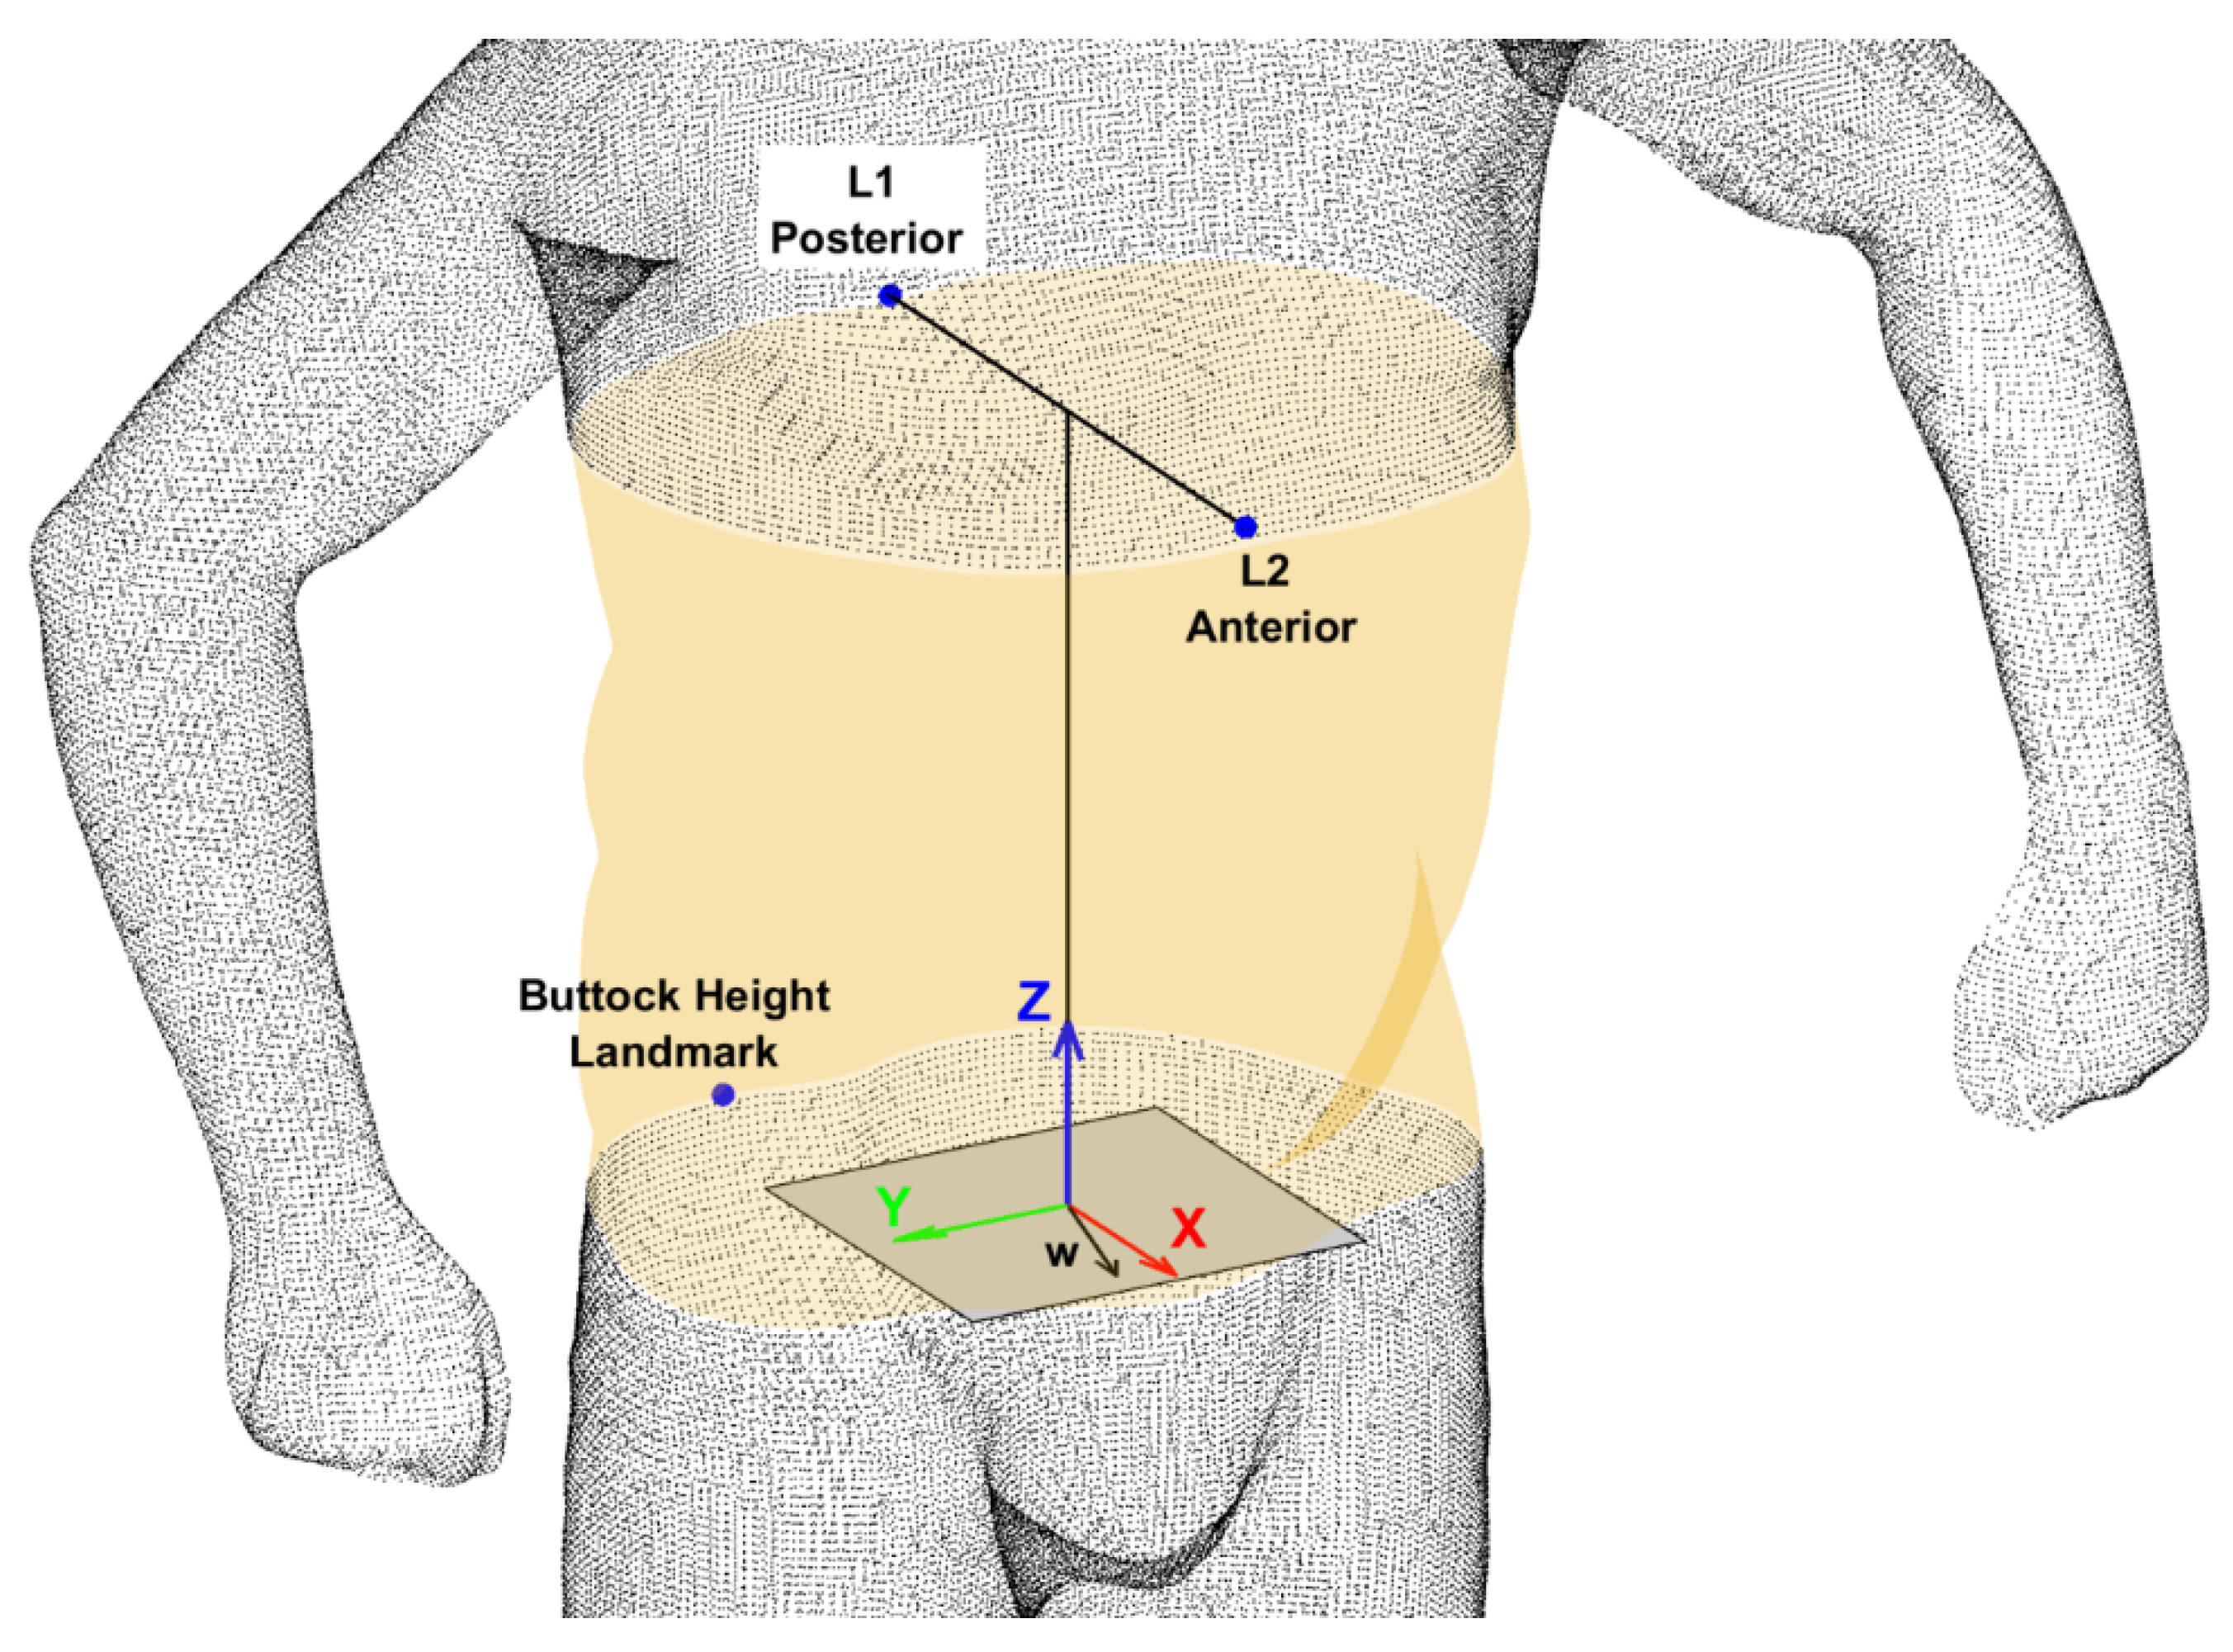
2.3.3. Torso Shape Feature Extraction
2.4. Statistical Analysis
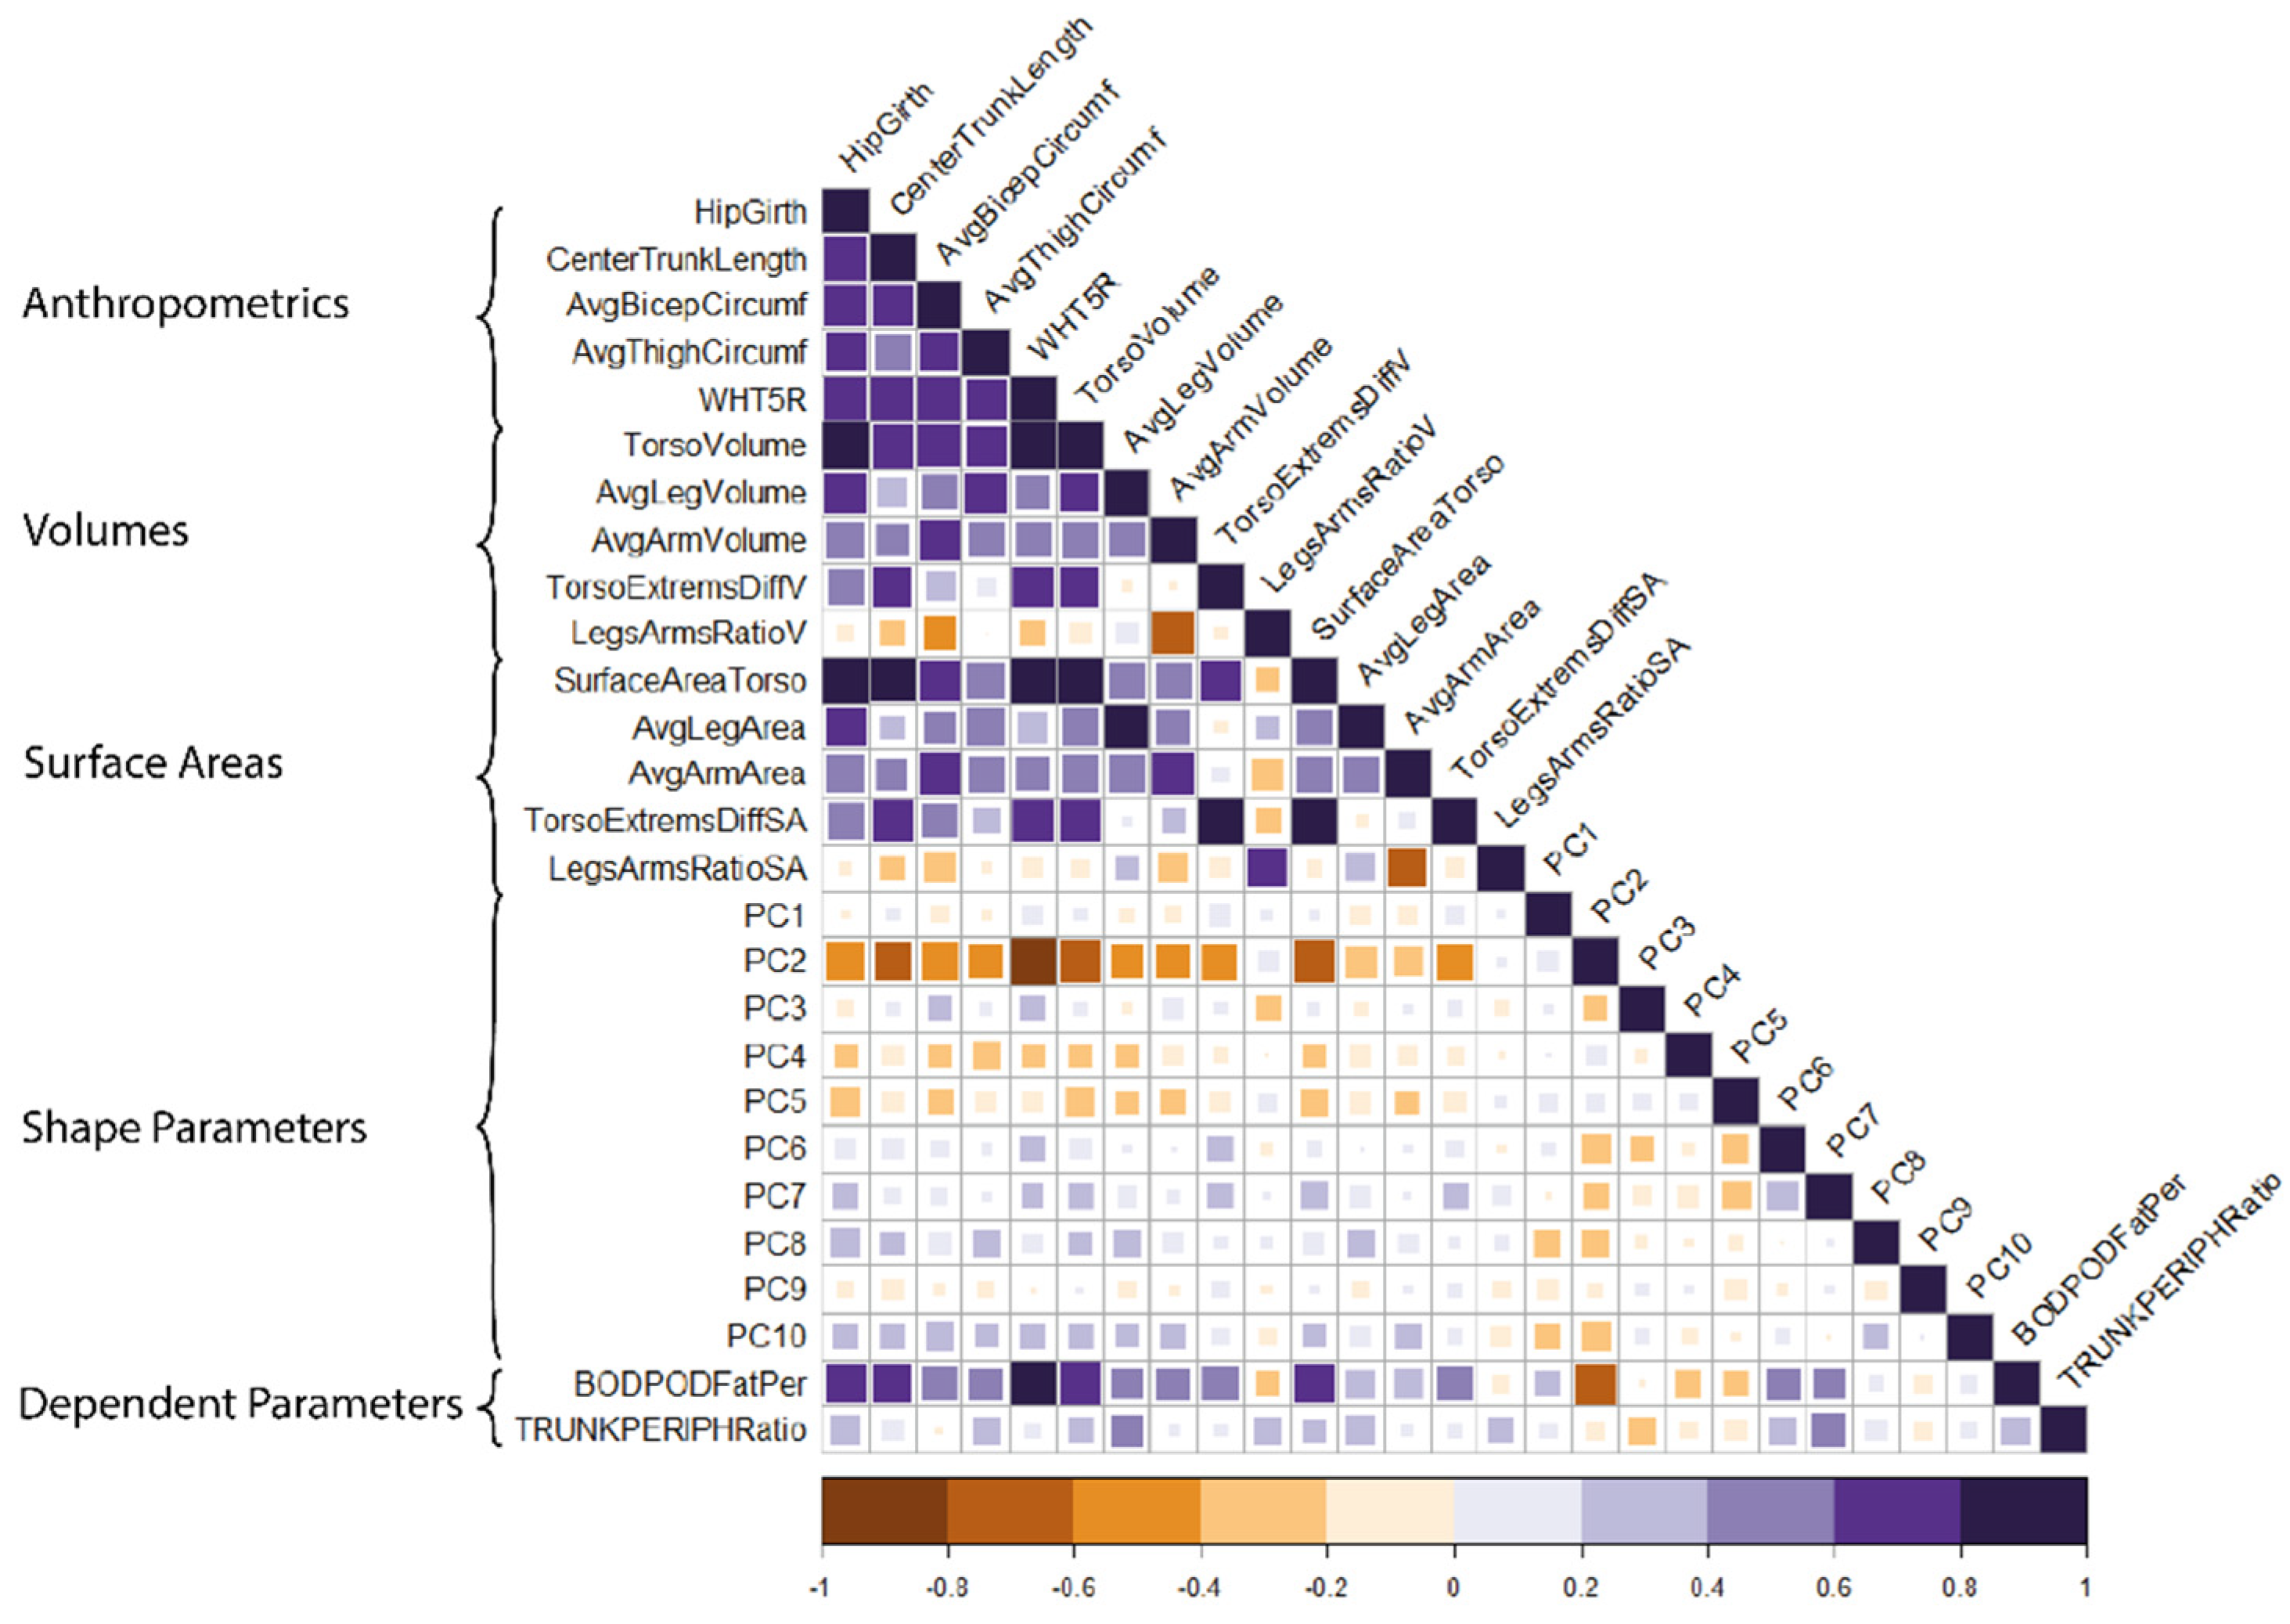
2.4.1. Selection of Independent Parameters
2.4.2. Linear Regression Models
- Shape only: 10 shape parameters of the torso;
- Anthropometrics and volumes: 5 measures of the torso and limbs, 5 volumes of the torso and limbs;
- Anthropometrics and surface areas: 5 measures of the torso and limbs, 5 surface areas of the torso and limbs;
- Anthropometrics and shape: 5 measures of the torso and limbs, 5 ‘best performing’ shape parameters of the torso;
- Volumes and shape: 5 volumes of the torso and limbs, 5 ‘best performing’ shape parameters of the torso;
- Surface areas and shape: 5 surface areas of the torso and limbs, 5 ‘best performing’ shape parameters of the torso.
2.4.3. Stepwise Regression Procedure
2.4.4. Model Performance
3. Results
3.1. Subsets of Shape Parameters
3.2. Performance of Predictive Models
3.3. The Relative Weights of Terms in Each Model
4. Discussion
Limitations
5. Conclusions
- Body shape improves the performance of anthropometric regression models.
- When predicting proportions of fat, larger-scale shape parameters are important for prediction (denoted as a lower-order parameter PC2, for example).
- When predicting distribution of fat, smaller-scale shape parameters are important for prediction (denoted as a higher-order parameter PC7, for example).
- Fat distribution is difficult to predict using size or shape alone but combining them increases predictive performance.
- Future research should investigate correlations between shape parameters and metabolic health risk.
Author Contributions
Funding
Institutional Review Board Statement
Informed Consent Statement
Data Availability Statement
Acknowledgments
Conflicts of Interest
References
- Piché, M.-E.; Poirier, P.; Lemieux, I.; Després, J.-P. Overview of Epidemiology and Contribution of Obesity and Body Fat Distribution to Cardiovascular Disease: An Update. Prog. Cardiovasc. Dis. 2018, 61, 103–113. [Google Scholar] [CrossRef] [PubMed]
- Bastien, M.; Poirier, P.; Lemieux, I.; Després, J.-P. Overview of Epidemiology and Contribution of Obesity to Cardiovascular Disease. Prog. Cardiovasc. Dis. 2014, 56, 369–381. [Google Scholar] [CrossRef] [PubMed]
- Okorodudu, D.O.; Jumean, M.F.; Montori, V.M.; Romero-Corral, A.; Somers, V.K.; Erwin, P.J.; Lopez-Jimenez, F. Diagnostic performance of body mass index to identify obesity as defined by body adiposity: A systematic review and meta-analysis. Int. J. Obes. 2010, 34, 791–799. [Google Scholar] [CrossRef] [Green Version]
- Karelis, A.D.; St-Pierre, D.H.; Conus, F.; Rabasa-Lhoret, R.; Poehlman, E.T. Metabolic and Body Composition Factors in Subgroups of Obesity: What Do We Know? J. Clin. Endocrinol. Metab. 2004, 89, 2569–2575. [Google Scholar] [CrossRef]
- Goodpaster, B.H.; Krishnaswami, S.; Harris, T.B.; Katsiaras, A.; Kritchevsky, S.B.; Simonsick, E.M.; Nevitt, M.; Holvoet, P.; Newman, A.B. Obesity, Regional Body Fat Distribution, and the Metabolic Syndrome in Older Men and Women. Arch. Internal Med. 2005, 165, 777–783. [Google Scholar] [CrossRef] [PubMed] [Green Version]
- Kissebah, A.H.; Vydelingum, N.; Murray, R.; Evans, D.J.; Kalkhoff, R.K.; Adams, P.W. Relation of Body Fat Distribution to Metabolic Complications of Obesity. J. Clin. Endocrinol. Metab. 1982, 54, 254–260. [Google Scholar] [CrossRef] [PubMed]
- Neeland, I.J.; Poirier, P.; Després, J.-P. Cardiovascular and Metabolic Heterogeneity of Obesity: Clinical Challenges and Implications for Management. Circulation 2018, 137, 1391–1406. [Google Scholar] [CrossRef]
- Wells, J.C.; Cole, T.J.; Treleaven, P. Age-variability in Body Shape Associated with Excess Weight: The UK National Sizing Survey. Obesity 2008, 16, 435–441. [Google Scholar] [CrossRef]
- Swainson, M.G.; Batterham, A.; Tsakirides, C.; Rutherford, Z.; Hind, K. Prediction of whole-body fat percentage and visceral adipose tissue mass from five anthropometric variables. PLoS ONE 2017, 12, e0177175. [Google Scholar] [CrossRef]
- World Health Organization. Waist Circumference and Waist-Hip Ratio: Report of a WHO Expert Consultation, Geneva, Switzerland, 8–11 December 2008; World Health Organization: Geneva, Switzerland, 2011. [Google Scholar]
- Coutinho, T.; Goel, K.; de Sá, D.C.; Carter, R.E.; Hodge, D.O.; Kragelund, C.; Kanaya, A.M.; Zeller, M.; Park, J.S.; Kober, L.; et al. Combining Body Mass Index with Measures of Central Obesity in the Assessment of Mortality in Subjects with Coronary Disease. J. Am. Coll. Cardiol. 2013, 61, 553–560. [Google Scholar] [CrossRef] [Green Version]
- Wilson, O.W.; Zou, Z.H.; Bopp, M.; Bopp, C.M. Comparison of obesity classification methods among college students. Obes. Res. Clin. Pract. 2019, 13, 430–434. [Google Scholar] [CrossRef] [PubMed]
- Sookoian, S.; Pirola, C.J. Systematic review with meta-analysis: Risk factors for non-alcoholic fatty liver disease suggest a shared altered metabolic and cardiovascular profile between lean and obese patients. Aliment. Pharmacol. Ther. 2017, 46, 85–95. [Google Scholar] [CrossRef] [PubMed] [Green Version]
- Bhat, G.; Baba, C.S.; Pandey, A.; Kumari, N.; Choudhuri, G. Insulin resistance and metabolic syndrome in nonobese Indian patients with non-alcoholic fatty liver disease. Trop. Gastroenterol. 2013, 34, 18–24. [Google Scholar] [CrossRef] [PubMed]
- Niriella, M.A.; Kasturiratne, A.; Pathmeswaran, A.; De Silva, S.T.; Perera, K.R.; Subasinghe, S.K.C.E.; Kodisinghe, S.K.; Piyaratna, T.A.C.L.; Vithiya, K.; Dassanayaka, A.S.; et al. Lean non-alcoholic fatty liver disease (lean NAFLD): Characteristics, metabolic outcomes and risk factors from a 7-year prospective, community cohort study from Sri Lanka. Hepatol. Int. 2018, 13, 314–322. [Google Scholar] [CrossRef]
- Wells, J.C.K.; Ruto, A.; Treleaven, P. Whole-body three-dimensional photonic scanning: A new technique for obesity research and clinical practice. Int. J. Obes. 2008, 32, 232–238. [Google Scholar] [CrossRef] [Green Version]
- Heymsfield, S.B.; Bourgeois, B.; Ng, B.K.; Sommer, M.J.; Li, X.; Shepherd, J. Digital anthropometry: A critical review. Eur. J. Clin. Nutr. 2018, 72, 680–687. [Google Scholar] [CrossRef]
- Löffler-Wirth, H.; Willscher, E.; Ahnert, P.; Wirkner, K.; Engel, C.; Loeffler, M.; Binder, H. Novel Anthropometry Based on 3D-Bodyscans Applied to a Large Population Based Cohort. PLoS ONE 2016, 11, e0159887. [Google Scholar] [CrossRef]
- Jaeschke, L.; Steinbrecher, A.; Pischon, T. Measurement of Waist and Hip Circumference with a Body Surface Scanner: Feasibility, Validity, Reliability, and Correlations with Markers of the Metabolic Syndrome. PLoS ONE 2015, 10, e0119430. [Google Scholar] [CrossRef] [Green Version]
- Wells, J.C.K.; Treleaven, P.; Cole, T.J. BMI compared with 3-dimensional body shape: The UK National Sizing Survey. Am. J. Clin. Nutr. 2007, 85, 419–425. [Google Scholar] [CrossRef] [Green Version]
- Ng, B.K.; Sommer, M.J.; Wong, M.C.; Pagano, I.; Nie, Y.; Fan, B.; Kennedy, S.; Bourgeois, B.; Kelly, N.; Liu, Y.E.; et al. Detailed 3-dimensional body shape features predict body composition, blood metabolites, and functional strength: The Shape Up! studies. Am. J. Clin. Nutr. 2019, 110, 1316–1326. [Google Scholar] [CrossRef] [PubMed] [Green Version]
- Ruto, A.; Lee, M.; Buxton, B. Comparing Principal and Independent Modes of Variation in 3D Human Torso Shape Using PCA and ICA; ICA Research Network International Workshop: Liverpool, UK, 2006; Volume 1. [Google Scholar]
- Lu, Y.; McQuade, S.; Hahn, J.K. 3D Shape-based Body Composition Prediction Model Using Machine Learning. In Proceedings of the Annual International Conference of the IEEE Engineering in Medicine and Biology Society, EMBS, Honolulu, HI, USA, 18–21 July 2018; Volume 2018, pp. 3999–4002. [Google Scholar] [CrossRef]
- Thelwell, M.; Chiu, C.; Bullas, A.; Hart, J.; Wheat, J.; Choppin, S. How shape-based anthropometry can complement traditional anthropometric techniques: A cross-sectional study. Sci. Rep. 2020, 10, 12125. [Google Scholar] [CrossRef] [PubMed]
- Thelwell, M.; Bullas, A.; Kühnapfel, A.; Hart, J.; Ahnert, P.; Wheat, J.; Loeffler, M.; Scholz, M.; Choppin, S. Modelling of human torso shape variation inferred by geometric morphometrics. PLoS ONE 2022, 17, e0265255. [Google Scholar] [CrossRef]
- ISO 20685-1; 3-D Scanning Methodologies for Internationally Compatible Anthropometric Databases. ISO: Geneva, Switzerland, 2018.
- Dempster, P.; Aitkens, S. A new air displacement method for the determination of human body composition. Med. Sci. Sports Exerc. 1995, 27, 1692–1697. [Google Scholar] [CrossRef]
- Siri, W.E. Body composition from fluid spaces and density: Analysis of methods. Tech. Meas. Body Compos. 1961, 61, 223–244. [Google Scholar]
- Schutte, J.E.; Townsend, E.J.; Hugg, J.; Shoup, R.F.; Malina, R.M.; Blomqvist, C.G. Density of lean body mass is greater in blacks than in whites. J. Appl. Physiol. 1984, 56, 1647–1649. [Google Scholar] [CrossRef] [PubMed] [Green Version]
- Brožek, J.; Grande, F.; Anderson, J.T.; Keys, A. Densitometric analysis of body composition: Revision of some quantitative assumptions. Ann. N. Y. Acad. Sci. 1963, 110, 113–140. [Google Scholar] [CrossRef] [PubMed]
- Watts, K.; Hwaung, P.; Grymes, J.; Cottam, S.H.; Heymsfield, S.B.; Thomas, D.M. Allometric models of adult regional body lengths and circumferences to height: Insights from a three-dimensional body image scanner. Am. J. Hum. Biol. 2020, 32, e23349. [Google Scholar] [CrossRef]
- Thelwell, M.; Bullas, A.; Kuehnapfel, A.; Hart, J.; Ahnert, P.; Wheat, J.; Loeffler, M.; Scholz, M.; Choppin, S. Scaling exponents of human torso size measures according to allometric power law. 2022; in review. [Google Scholar]
- Wicke, J.; Dumas, G.A. Influence of the Volume and Density Functions Within Geometric Models for Estimating Trunk Inertial Parameters. J. Appl. Biomech. 2010, 26, 26–31. [Google Scholar] [CrossRef]
- Choppin, S.; Clarkson, S.; Bullas, A.; Thelwell, M.; Heller, B.; Wheat, J. Anatomical and principal axes are not aligned in the torso: Considerations for users of geometric modelling methods. J. Biomech. 2020, 114, 110151. [Google Scholar] [CrossRef]
- Clarkson, S.; Wheat, J.; Heller, B.; Choppin, S. Assessing the suitability of the microsoft kinect for calculating person specific body segment parameters. In Computer Vision—ECCV 2014 Workshops; Agapito, L., Bronstein, M., Rother, C., Eds.; Lecture Notes in Computer Science (Including Subseries Lecture Notes in Artificial Intelligence and Lecture Notes in Bioinformatics); Springer: Cham, Switzerland, 2015; Volume 8925. [Google Scholar] [CrossRef] [Green Version]
- Adams, D.C.; Rohlf, F.J.; Slice, D.E. A field comes of age: Geometric morphometrics in the 21st century. Hystrix Ital. J. Mammal. 2013, 24, 7–14. [Google Scholar] [CrossRef]
- Nimon, K.F.; Oswald, F.L. Understanding the Results of Multiple Linear Regression. Organ. Res. Methods 2013, 16, 650–674. [Google Scholar] [CrossRef] [Green Version]
- Ballester, A.; Parrilla, E.; Piérola, A.; Uriel, J.; Pérez, C.; Piqueras, P.; Nácher, B.; Vivas, J.A.; Alemany, S. Data-driven three-dimensional reconstruction of human bodies using a mobile phone app. Int. J. Digit. Hum. 2017, 1, 361–388. [Google Scholar] [CrossRef]

| Mean (SD) | Min. | Max. | |
|---|---|---|---|
| Number of participants, n = 93 | |||
| Physical characteristics | |||
| Age (years) | 43.1 (7.4) | 28 | 58 |
| Height (cm) | 177.9 (6.8) | 160.8 | 196.9 |
| Weight (kg) | 82.9 (13.3) | 57.4 | 124.1 |
| BMI (kg/m2) | 26.2 (3.9) | 20.3 | 38.3 |
| WHR (cm/cm) | 0.87 (0.06) | 0.76 | 1.01 |
| Total body fat (%) | 21.02 (7.82) | 6.55 | 42.86 |
| Trunk:peripheral fat ratio (kg/kg) | 1.57 (0.22) | 0.84 | 2.09 |
| Demographics | |||
| Ethnicity: n (%) | |||
| White | 80 (86.0%) | ||
| Asian or Asian British | 6 (6.5%) | ||
| Black, African, Black British or Caribbean | 1 (1.1%) | ||
| Mixed or multiple ethnic groups | 4 (4.3%) |
| Independent Parameters | Shape Parameters Used When Predicting: | |
|---|---|---|
| Proportion of Body Fat | Distribution of Body Fat | |
| Anthropometrics and Shape | 1 2 4 6 7 | 1 4 5 6 7 |
| Volume and Shape | 1 2 3 4 5 | 3 4 5 7 8 |
| Surface Area and Shape | 1 2 3 5 7 | 3 4 5 7 10 |
| Model | Adj. R2 | RMSE | Cross-Val RMSE |
|---|---|---|---|
| Shape only | 0.8331 | 3.19 | 3.79 |
| Anthropometrics and Surface Area | 0.7365 | 4.01 | 4.35 |
| Anthropometrics and Volume | 0.7390 | 4.00 | 4.27 |
| Anthropometrics and Shape | 0.8463 | 2.93 | 3.11 |
| Shape and S.A. | 0.8096 | 3.41 | 3.63 |
| Shape and Volume | 0.8482 | 3.05 | 3.35 |
| Model | Adj. R2 | RMSE | Cross-Val RMSE |
|---|---|---|---|
| Shape only | 0.4904 | 0.160 | 0.181 |
| Anthropometrics and S.A. | 0.5321 | 0.153 | 0.167 |
| Anthropometrics and Volume | 0.5673 | 0.147 | 0.157 |
| Anthropometrics and Shape | 0.7864 | 0.103 | 0.122 |
| Shape and S.A. | 0.6776 | 0.127 | 0.144 |
| Shape and Volume | 0.6676 | 0.129 | 0.142 |
| Model | Model Term | Relative Weight | p |
|---|---|---|---|
| Shape Only | PC2 | 41.0 | <<0.001 |
| (26 terms) | PC7 | 8.6 | 0.006 |
| PC1 | 7.3 | <<0.001 | |
| Anthropometrics and S.A. | WHT.5R | 32.5 | <<0.001 |
| (17 terms) | Torso S.A. | 12.7 | 0.003 |
| Torso:Limbs S.A. | 9.17 | 0.004 | |
| Anthropometrics and Volume | WHT.5R | 23.1 | <<0.001 |
| (16 terms) | Avg. Bicep Girth | 5.6 | <<0.001 |
| Avg. Thigh Girth | 3.9 | 0.04 | |
| Anthropometrics and Shape | PC2 | 16.8 | <<0.001 |
| (21 terms) | Hip Girth | 10.0 | 0.004 |
| PC6 | 8.8 | <0.001 | |
| Shape and S.A. | PC2 | 32.5 | <<0.001 |
| (19 terms) | Torso S.A. | 11.18 | 0.04 |
| PC7 | 9.41 | <<0.001 | |
| Shape and Volume | PC2 | 22.5 | <<0.001 |
| (25 terms) | Torso:Limbs Volume | 11.3 | 0.02 |
| Torso Volume | 9.9 | 0.05 |
| Model | Model Term | Relative Weight | p |
|---|---|---|---|
| Shape Only | PC7 | 16.63 | 0.009 |
| (24 terms) | PC3 | 14.81 | <0.001 |
| PC3 PC8 | 9.65 | 0.005 | |
| Anthropometrics and S.A. | Hip Girth | 12.0 | 0.027 |
| (17 terms) | Avg. Bicep Girth | 11.3 | <<0.001 |
| Torso S.A. | 10.0 | 0.007 | |
| Anthropometrics and Volume | Hip Girth | 11.02 | 0.035 |
| (16 terms) | Avg. Bicep Girth | 10.82 | <<0.001 |
| Torso Volume | 10.20 | < 0.001 | |
| Anthropometrics and Shape | PC7 | 11.6 | 0.004 |
| (29 terms) | Hip Girth | 10.7 | <<0.001 |
| Avg. Thigh Girth | 10.2 | <<0.001 | |
| Shape and S.A. | PC7 | 15.3 | <<0.001 |
| (25 terms) | PC3 | 11.0 | <<0.001 |
| PC4 Torso S.A. | 10.2 | <<0.001 | |
| Shape and Volume | PC7 | 15.7 | <0.001 |
| (23 terms) | PC3 | 10.9 | <<0.001 |
| PC4 Torso Volume | 10.2 | <<0.001 |
Publisher’s Note: MDPI stays neutral with regard to jurisdictional claims in published maps and institutional affiliations. |
© 2022 by the authors. Licensee MDPI, Basel, Switzerland. This article is an open access article distributed under the terms and conditions of the Creative Commons Attribution (CC BY) license (https://creativecommons.org/licenses/by/4.0/).
Share and Cite
Choppin, S.; Bullas, A.; Thelwell, M. Torso Shape Improves the Prediction of Body Fat Magnitude and Distribution. Int. J. Environ. Res. Public Health 2022, 19, 8302. https://doi.org/10.3390/ijerph19148302
Choppin S, Bullas A, Thelwell M. Torso Shape Improves the Prediction of Body Fat Magnitude and Distribution. International Journal of Environmental Research and Public Health. 2022; 19(14):8302. https://doi.org/10.3390/ijerph19148302
Chicago/Turabian StyleChoppin, Simon, Alice Bullas, and Michael Thelwell. 2022. "Torso Shape Improves the Prediction of Body Fat Magnitude and Distribution" International Journal of Environmental Research and Public Health 19, no. 14: 8302. https://doi.org/10.3390/ijerph19148302
APA StyleChoppin, S., Bullas, A., & Thelwell, M. (2022). Torso Shape Improves the Prediction of Body Fat Magnitude and Distribution. International Journal of Environmental Research and Public Health, 19(14), 8302. https://doi.org/10.3390/ijerph19148302