
Optimal Strategy on Radiation Estimation for Calculating Universal Thermal Climate Index in Tourism Cities of China


 ,
,  ,
,
Abstract
:1. Introduction
2. Materials and Methods
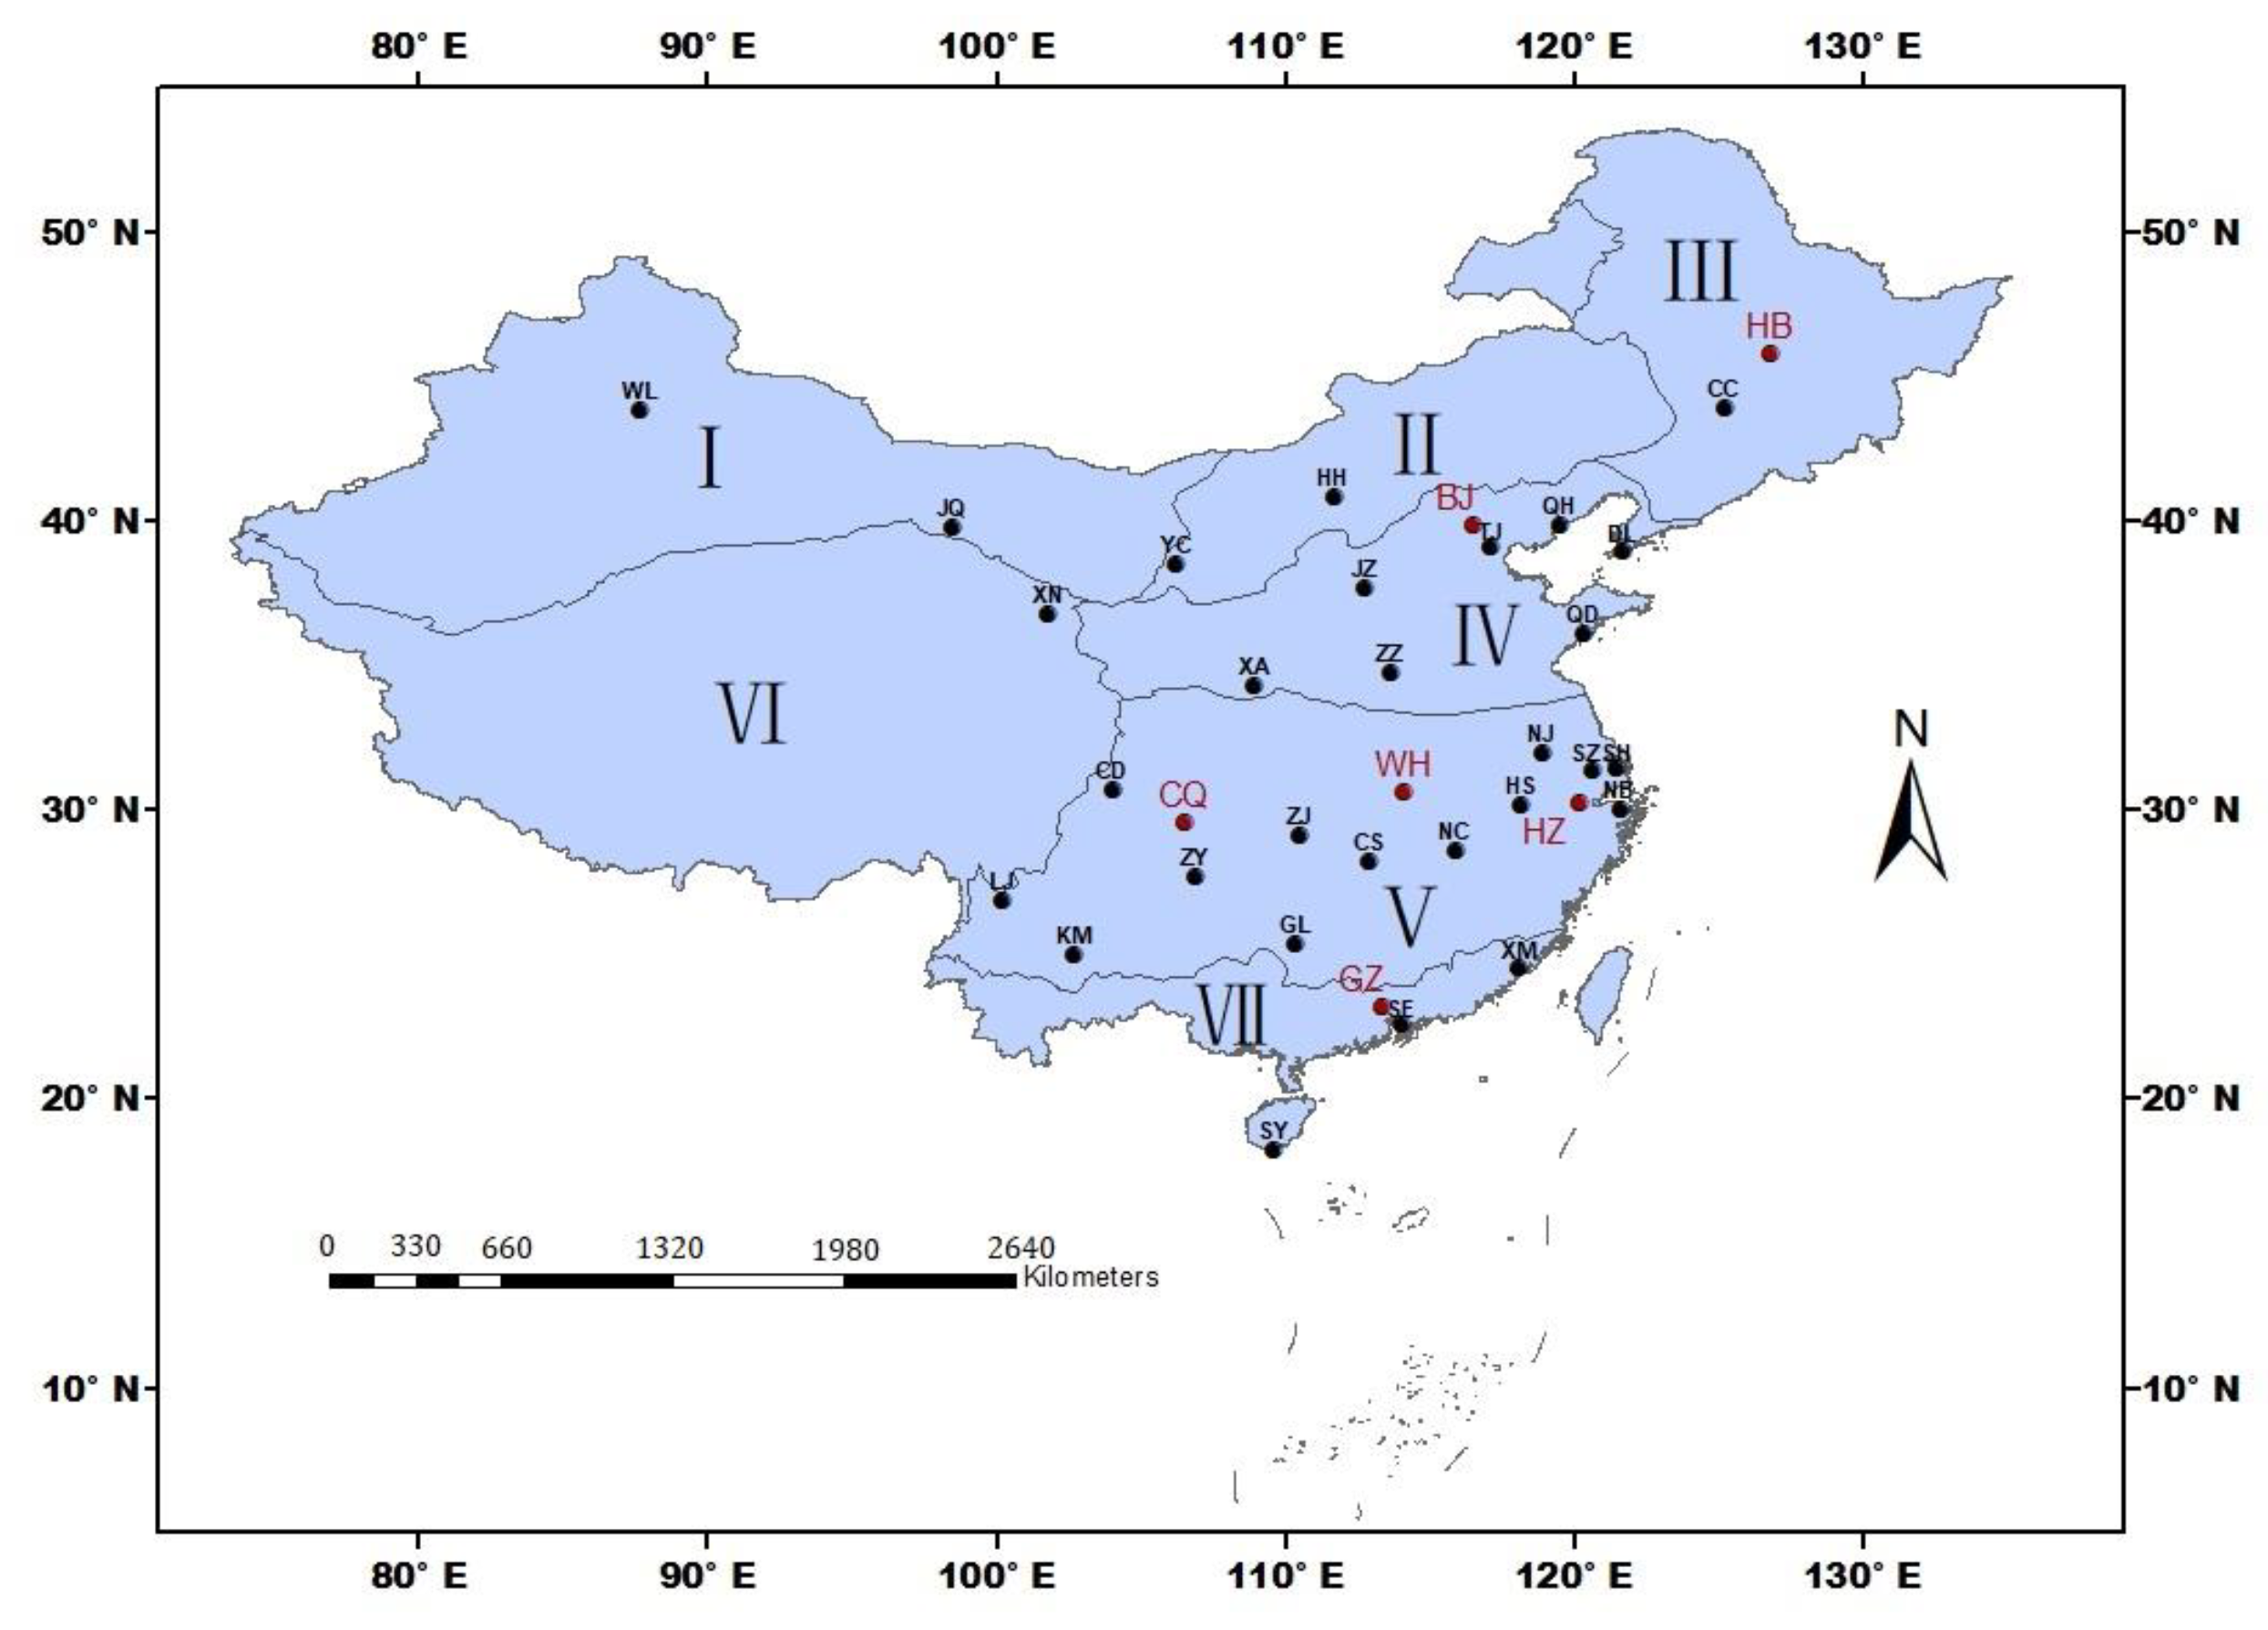
2.1. Database
2.2. Calculation of UTCI
2.3. Estimation of Solar Radiation
2.3.1. Angstrom Model
2.3.2. Ogelman Model
2.3.3. Bristow Model
2.3.4. Hargreaves Model
2.3.5. BP Neural Network
2.3.6. Support Vector Machine
2.4. Statistical Analysis
3. Results
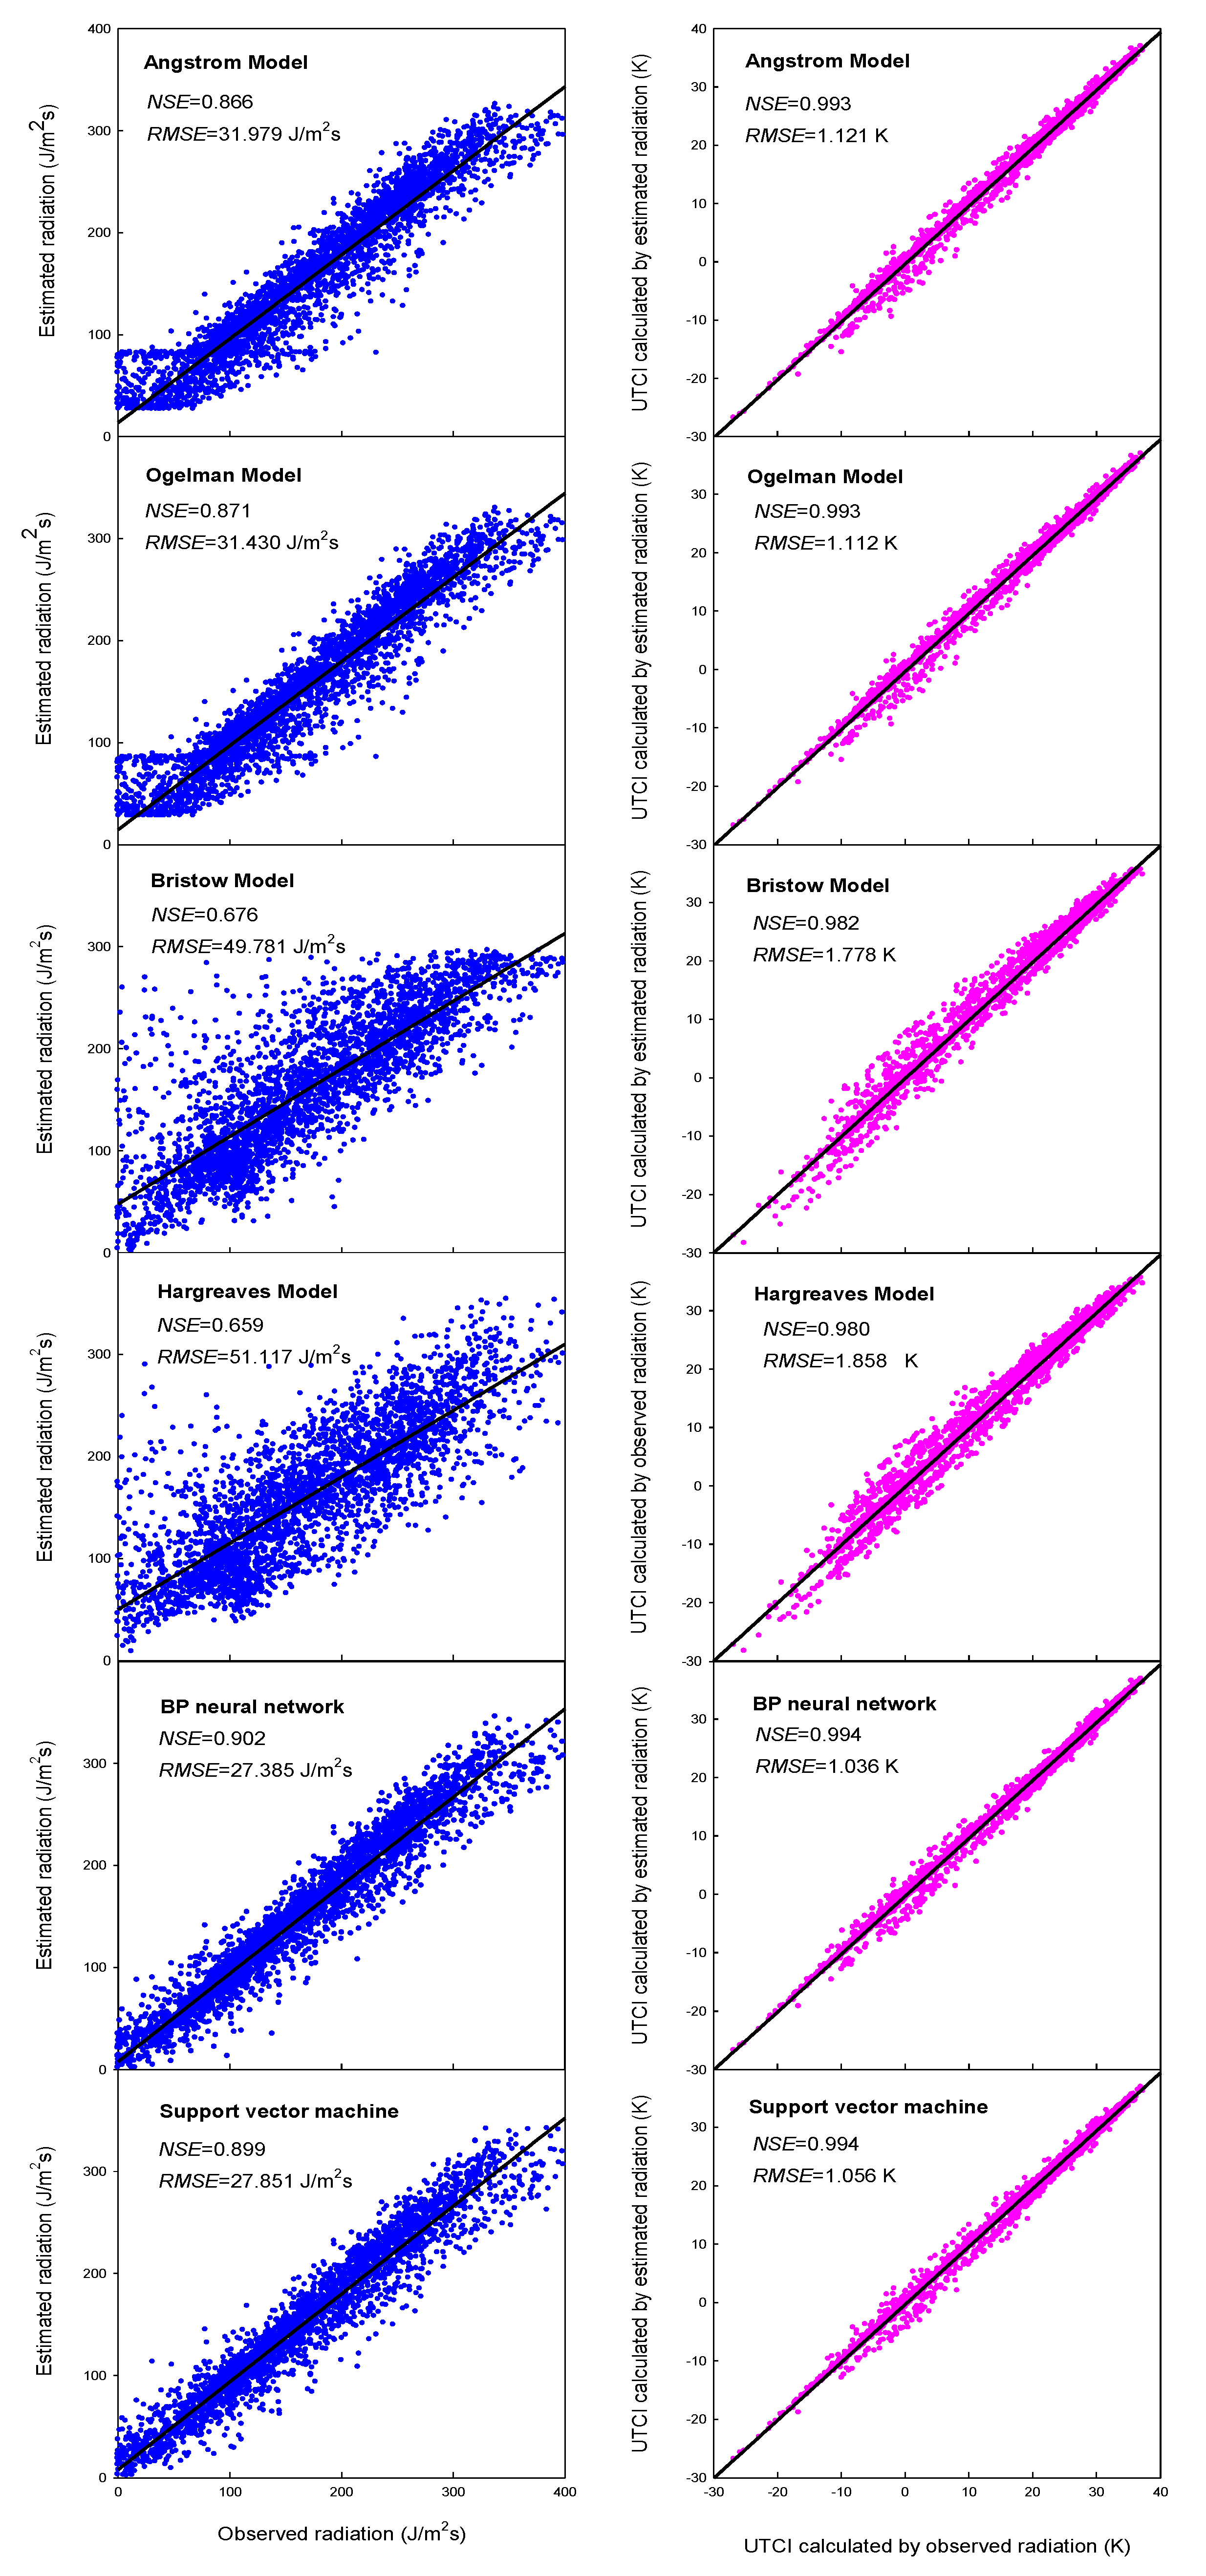
3.1. Comparison of Model Performance in Radiation Estimation and UTCI Calculation
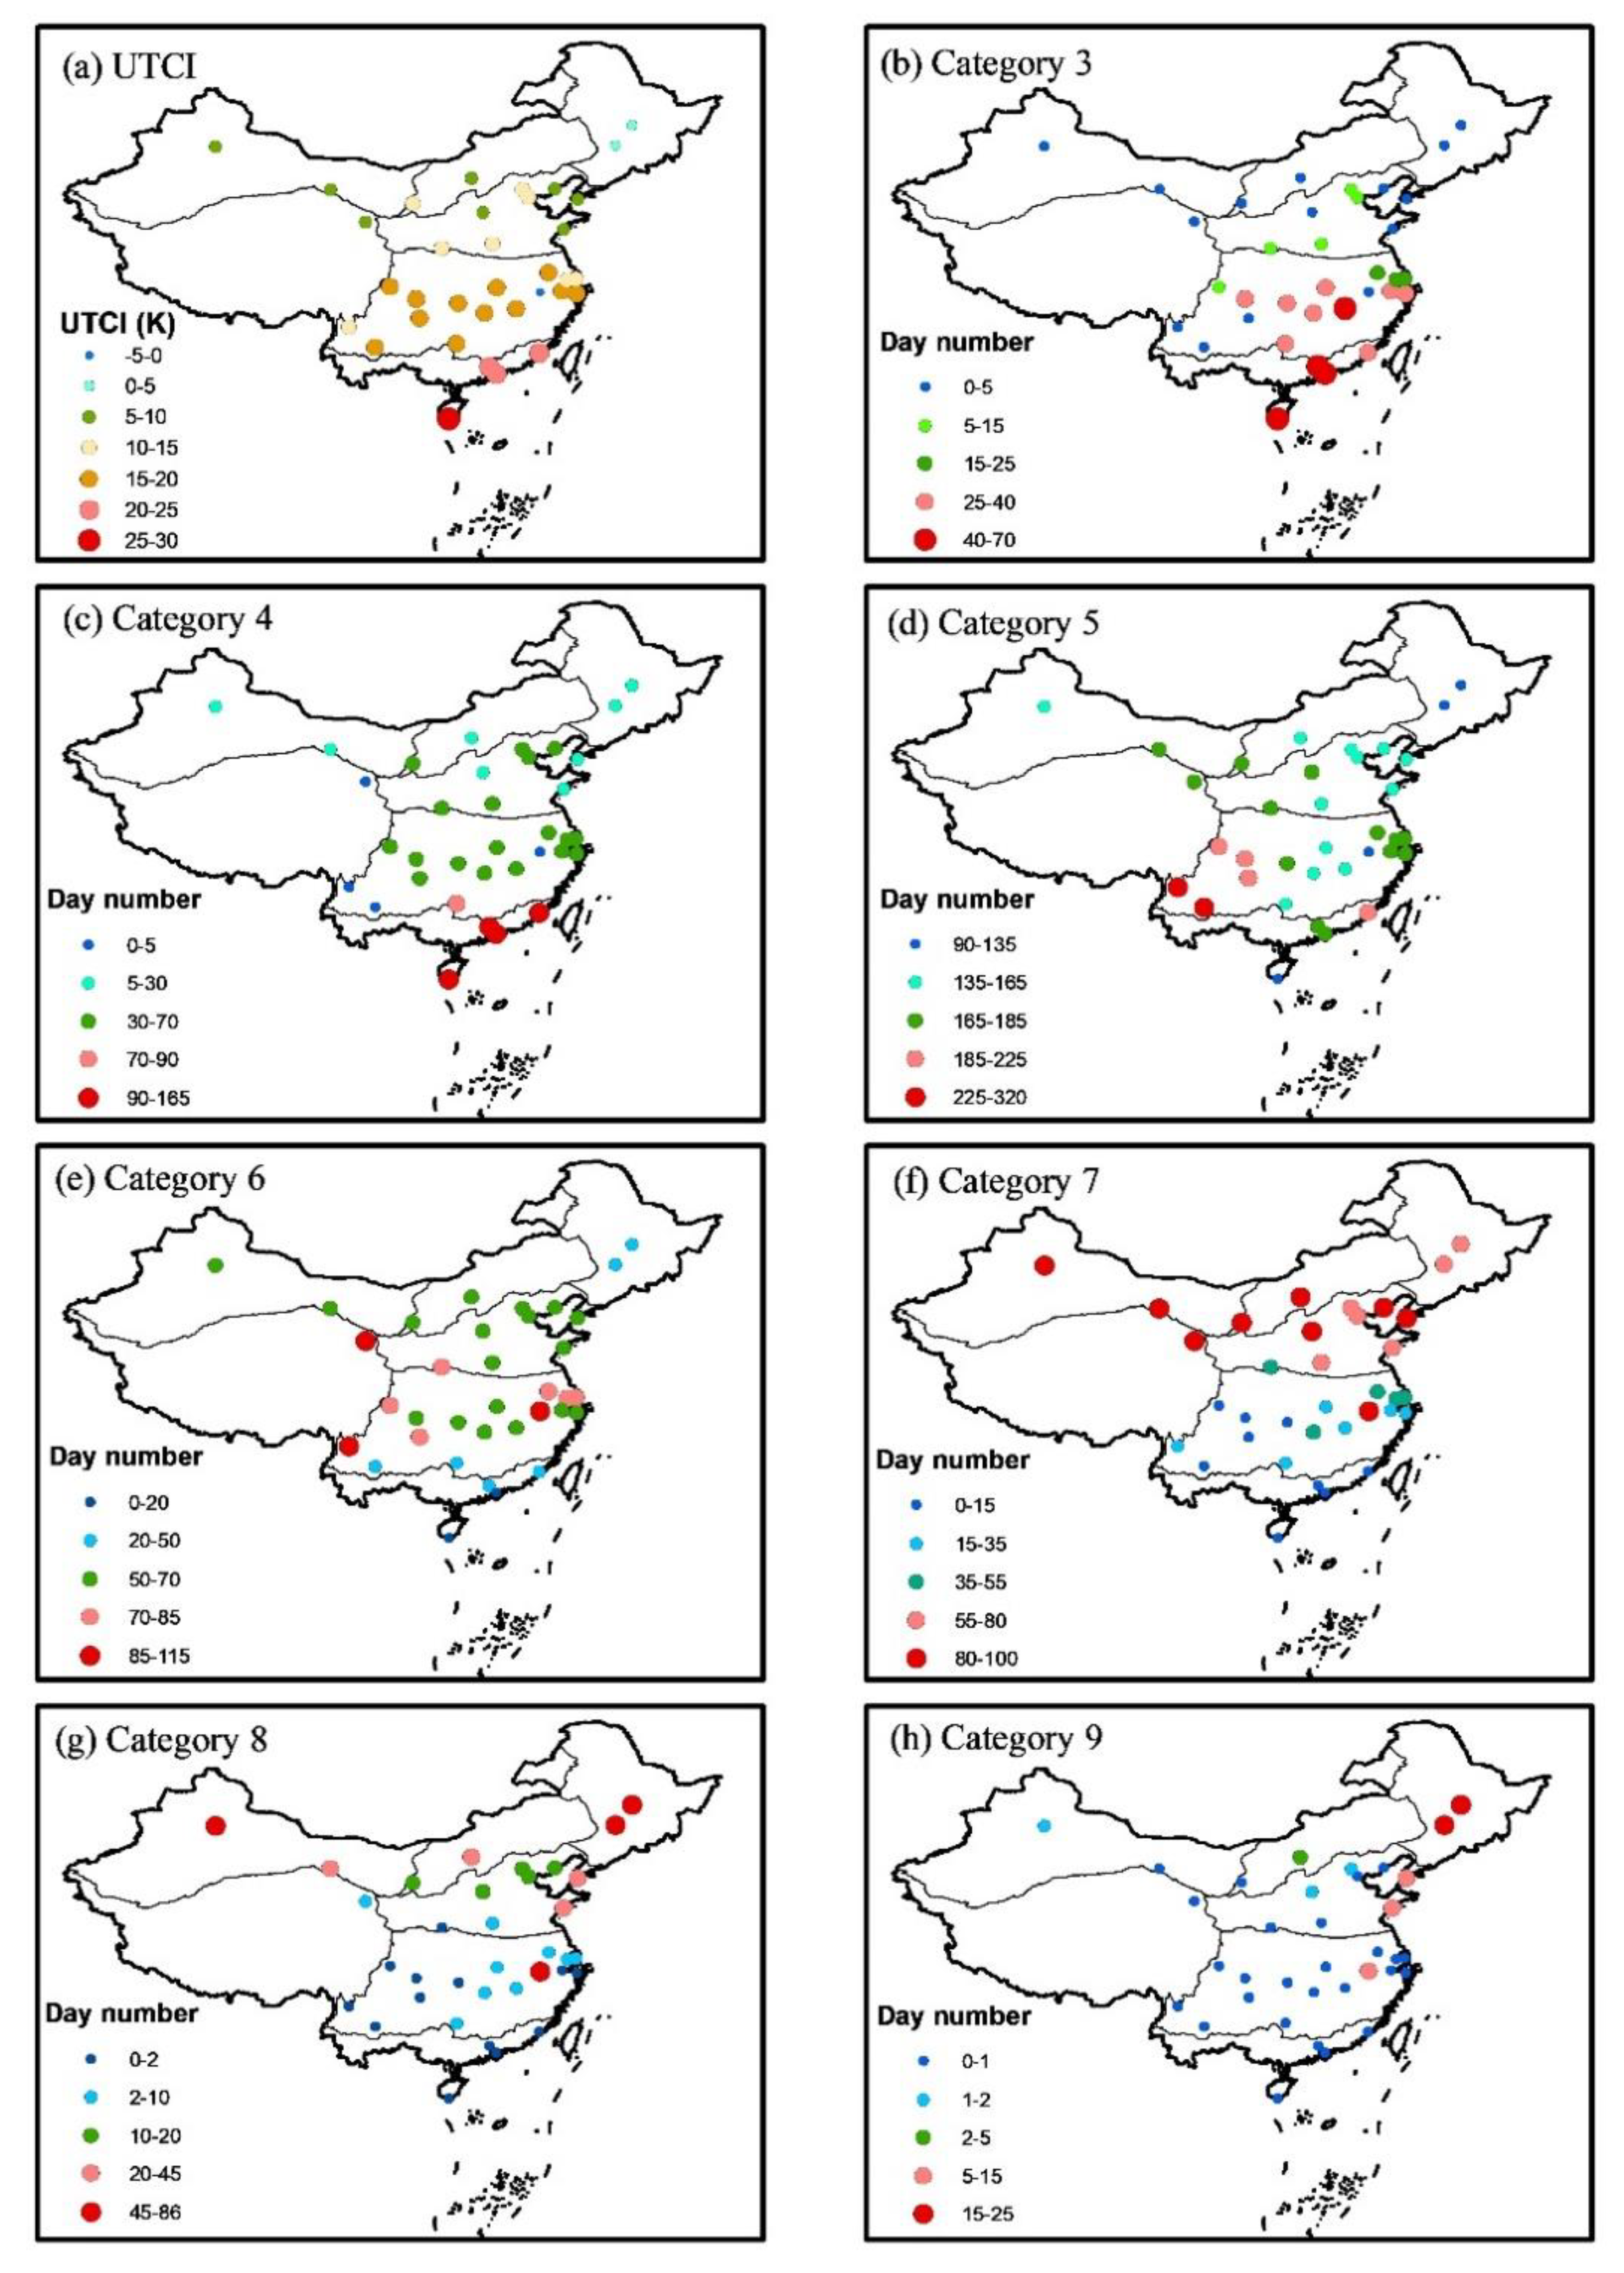
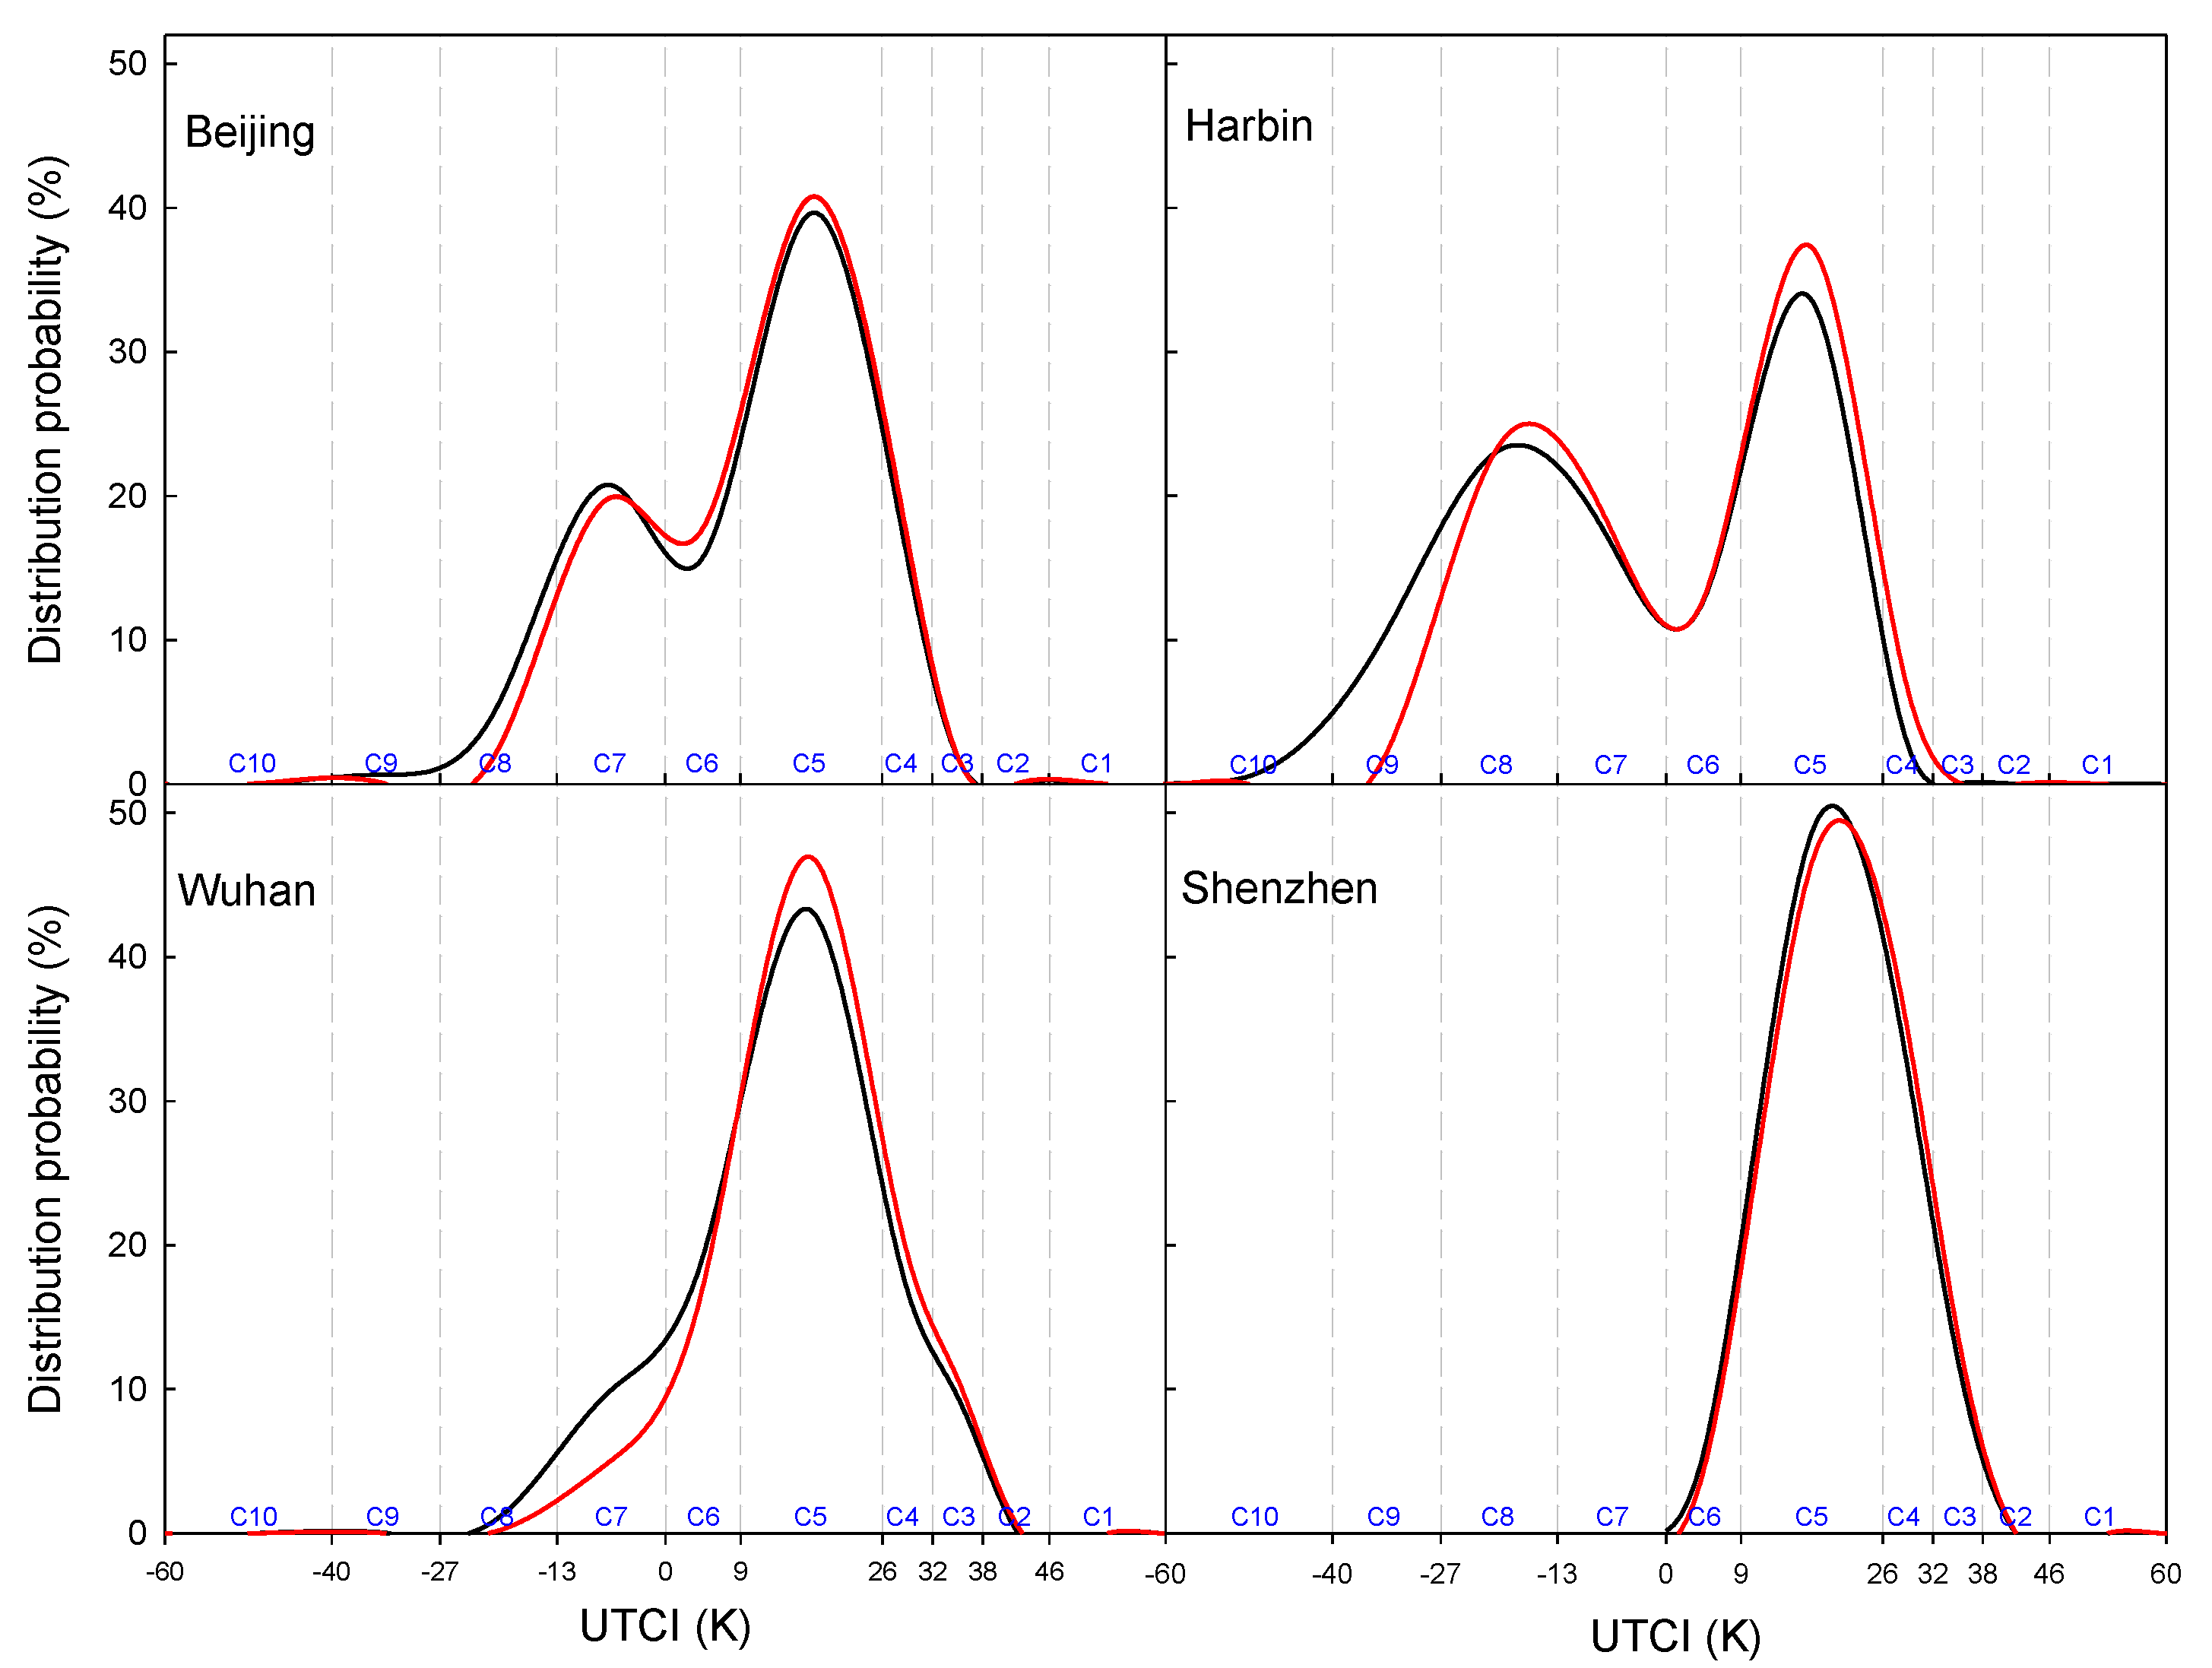
3.2. Spatial Analysis of UTCI and Day Number within Each Category
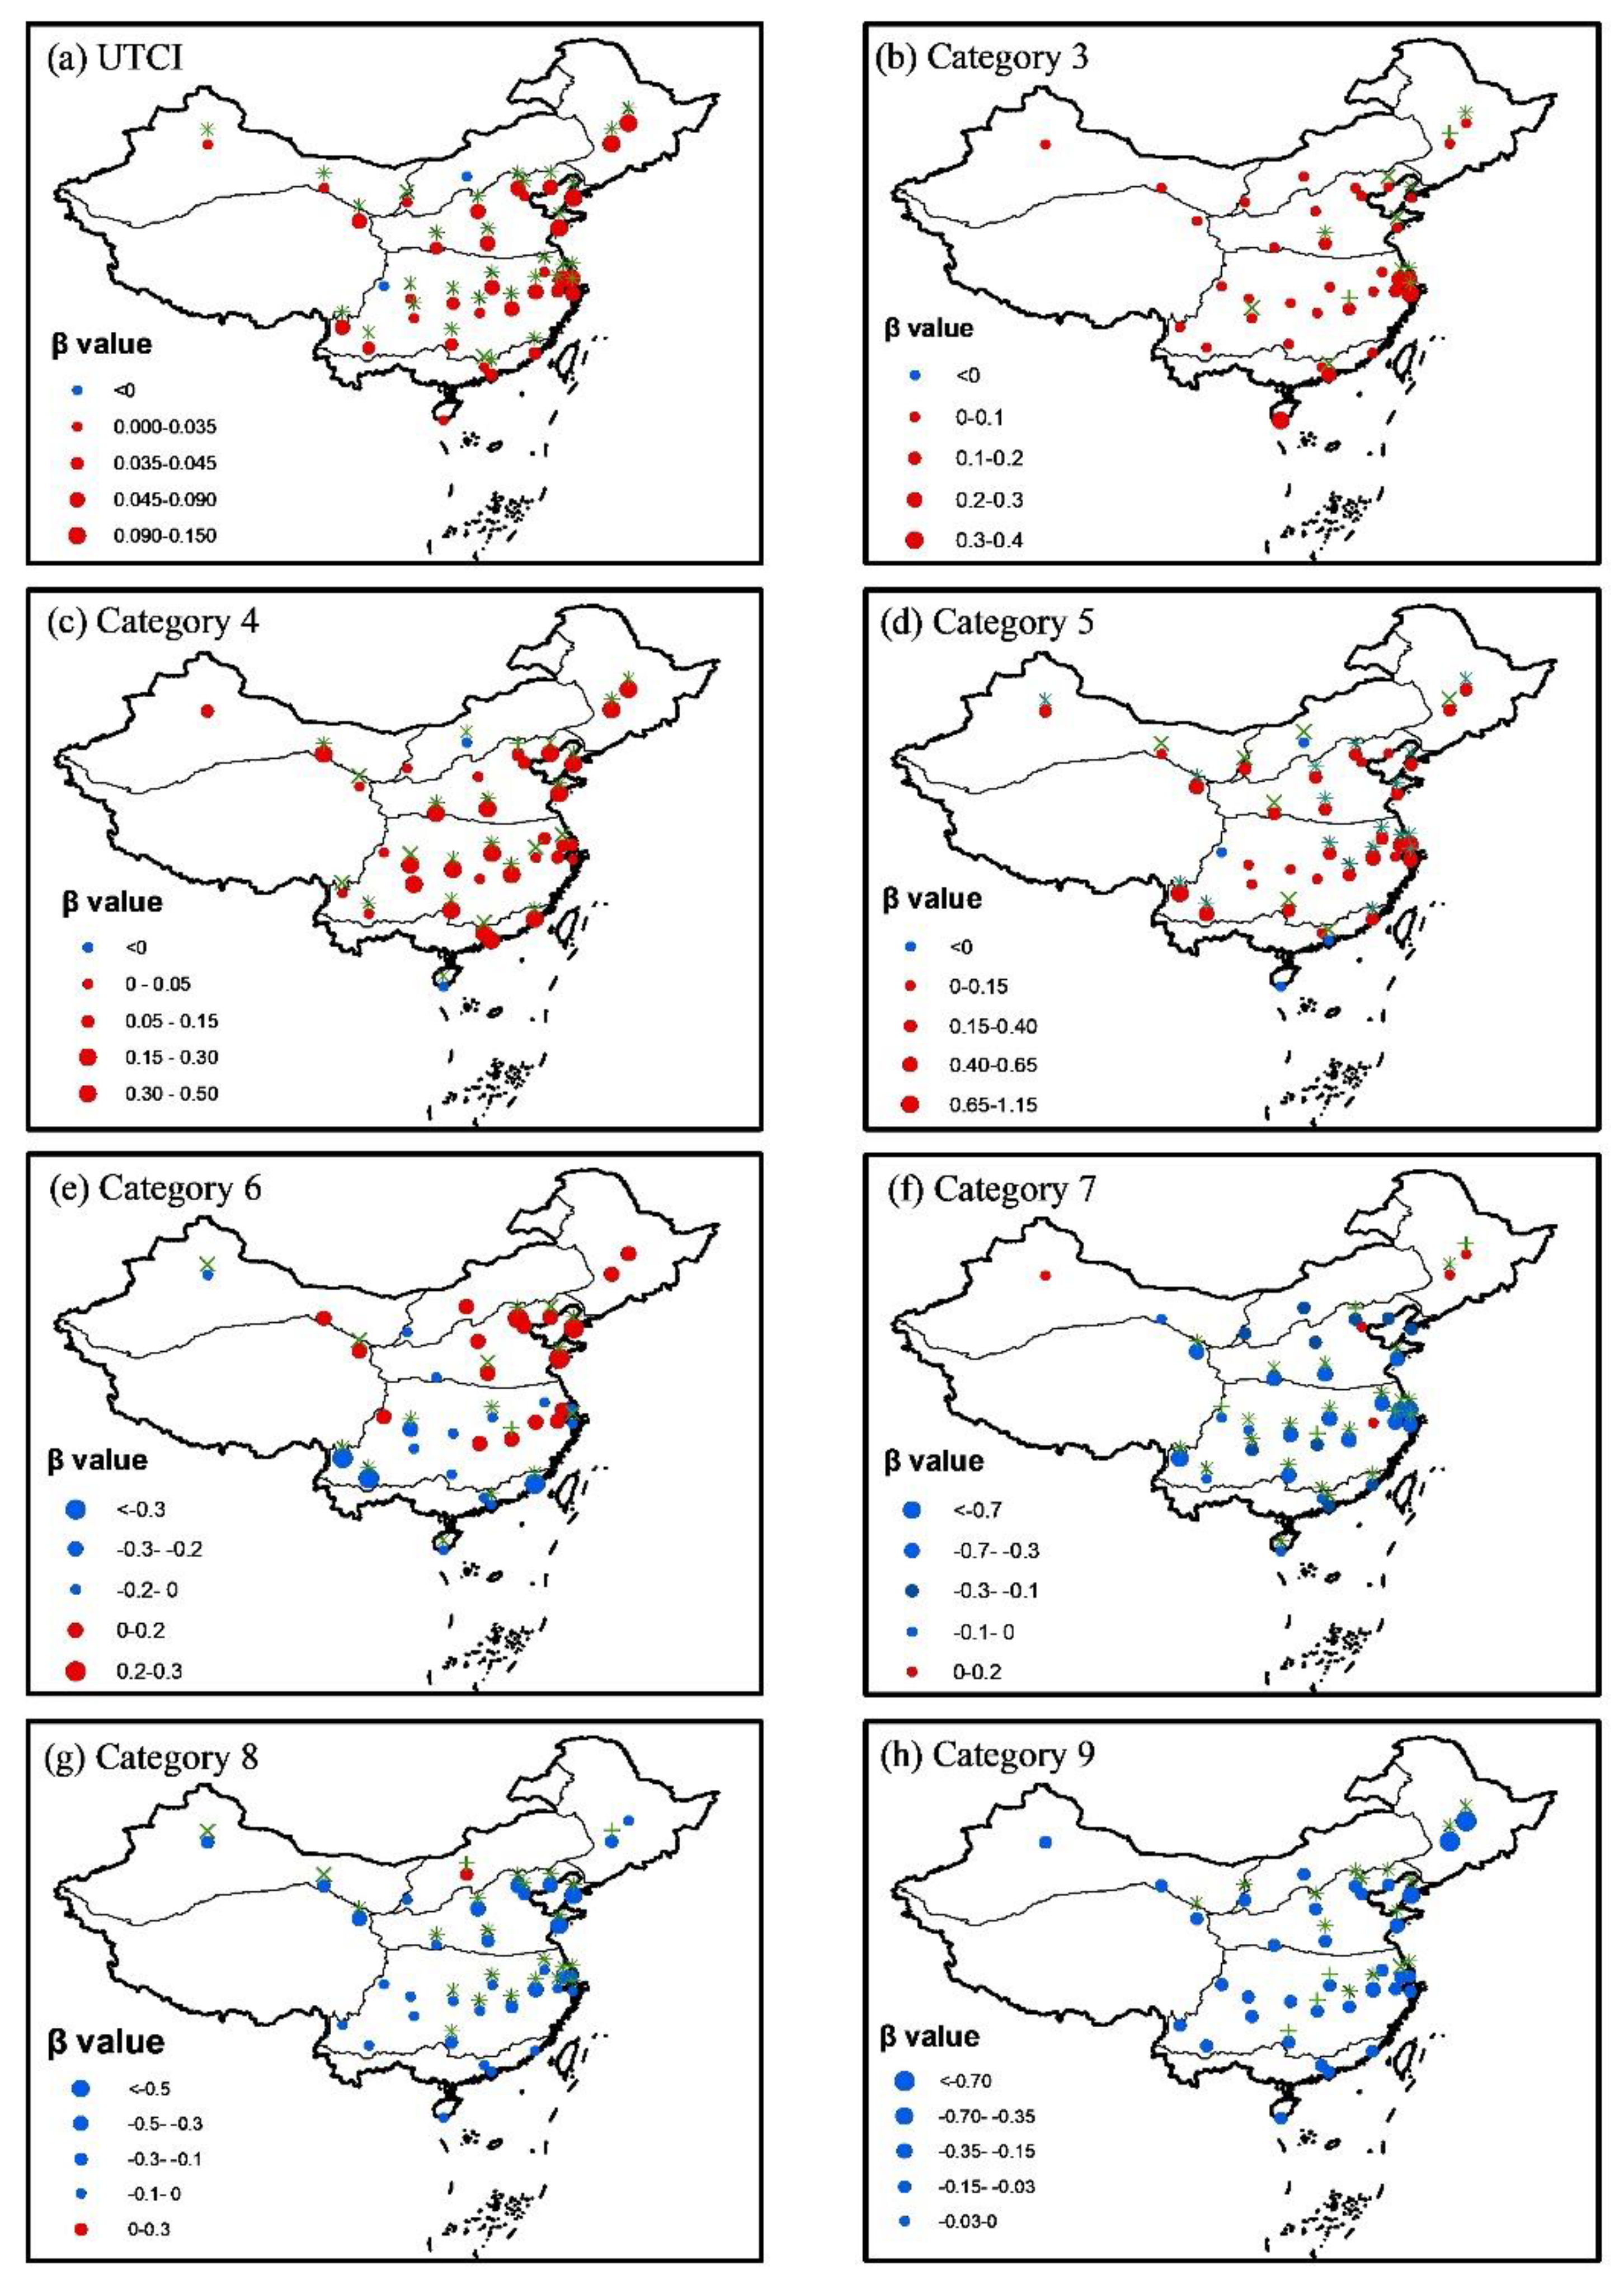
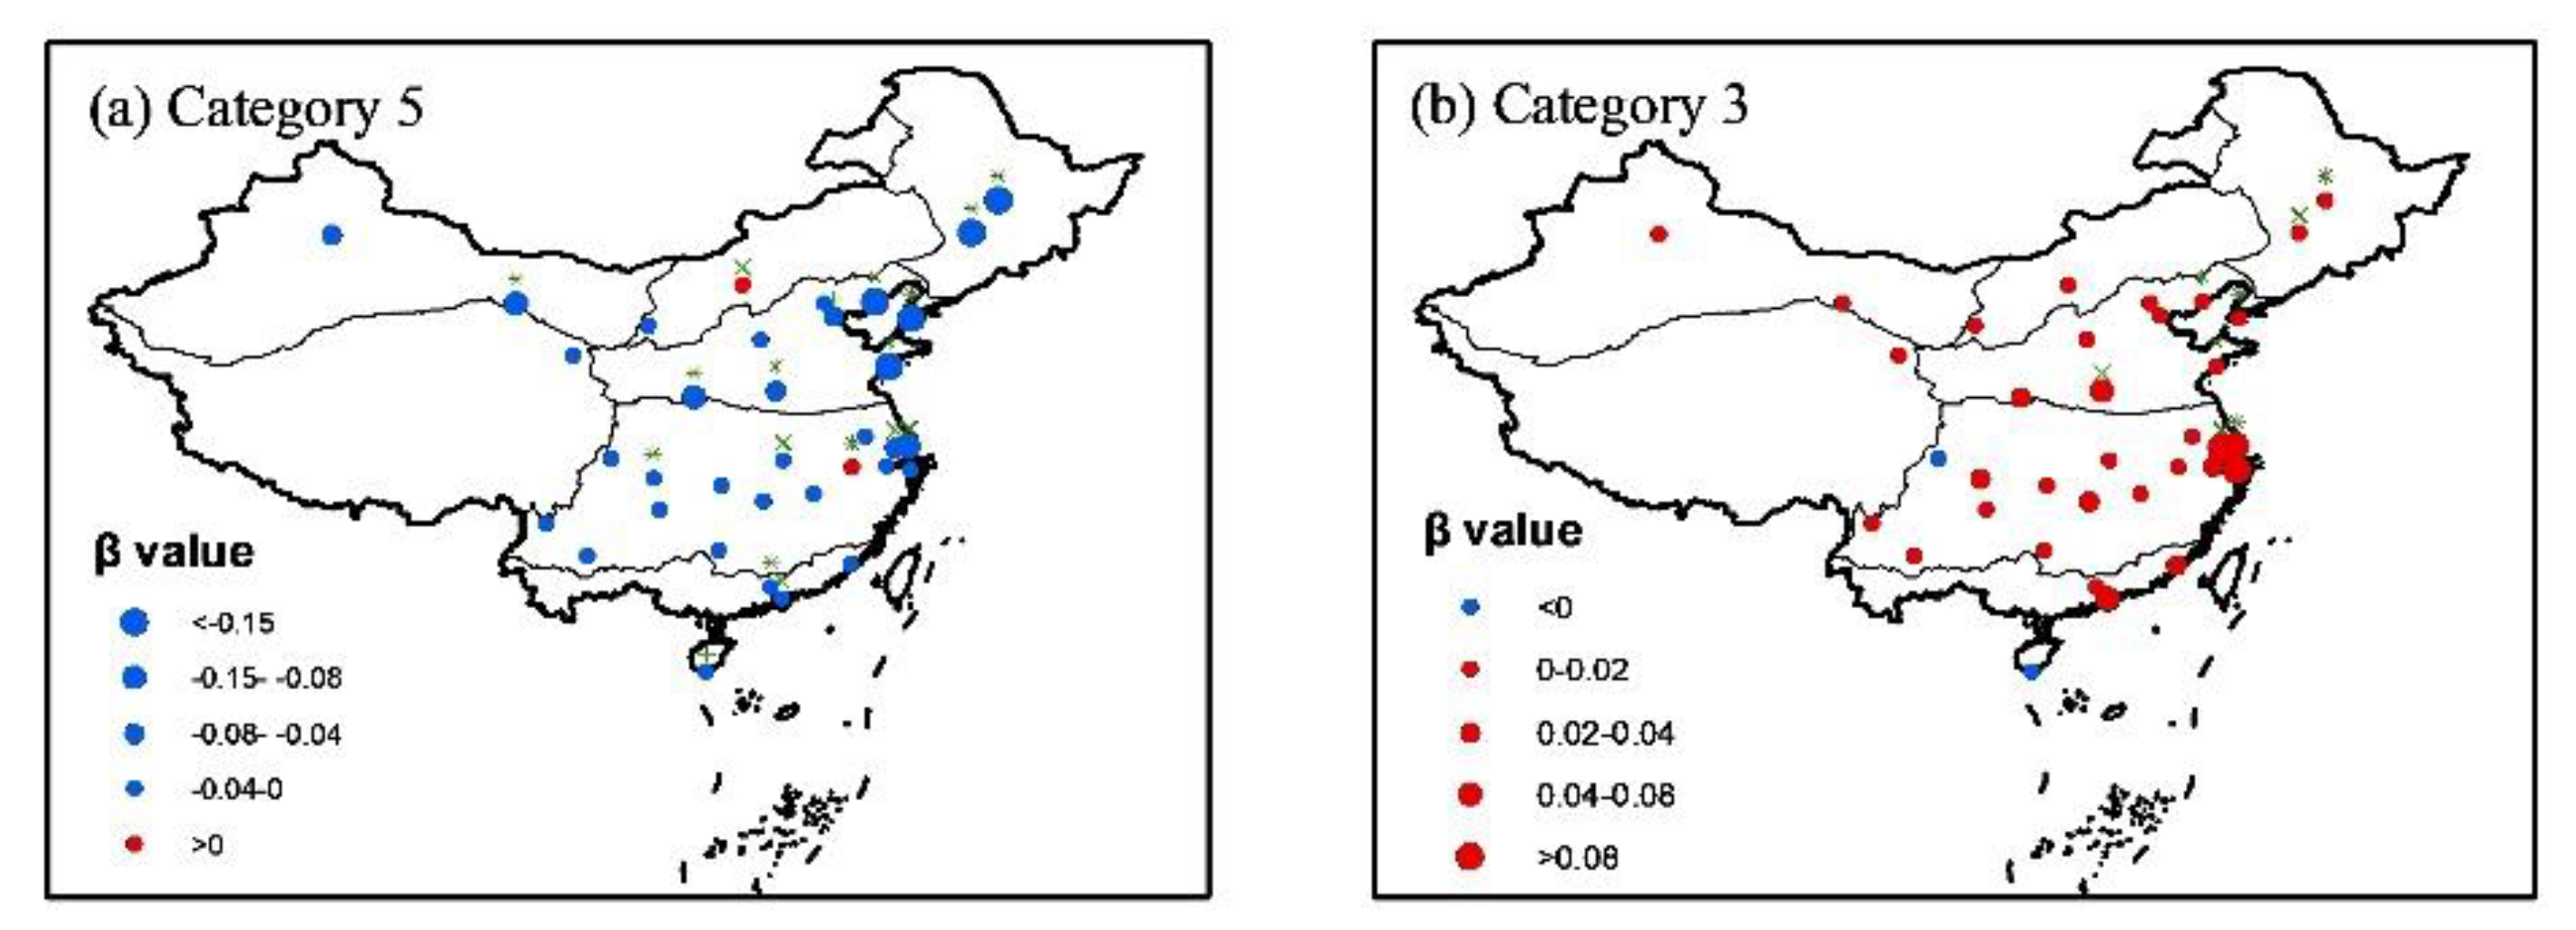
3.3. Temporal Trend in UTCI and Day Number within Each Category
4. Discussion
4.1. Optimal Strategy on Estimating Solar Radiation for UTCI Calculation
4.2. Increase in Yearly Day Number under no Thermal Stress Accompanying with More Risks in Heat Stress in Summer in China
4.3. Certainties and Uncertainties in UTCI Estimation over China
5. Conclusions
Author Contributions
Funding
Institutional Review Board Statement
Informed Consent Statement
Data Availability Statement
Acknowledgments
Conflicts of Interest
References
- Jendritzky, G.; Nübler, W. A model analyzing the urban thermal environment in physiologically significant terms. Arch. Meteorol. Geophys. Bioclim. 1981, 29, 313–326. [Google Scholar] [CrossRef]
- Fröhlich, D.; Matzarakis, A. A quantitative sensitivity analysis on the behavior of common thermal indices under hot and windy conditions in Doha, Qatar. Theor. Appl. Climatol. 2016, 124, 179–187. [Google Scholar] [CrossRef]
- Fiala, D.; Havenith, G.; Bröde, P.; Kampmann, B.; Jendritzky, G. UTCI-Fiala multi-node model of human heat transfer and temperature regulation. Int. J. Biometeorol. 2012, 56, 429–441. [Google Scholar] [CrossRef] [Green Version]
- Weihs, P.; Staiger, H.; Tinz, B.; Batchvarova, E.; Rieder, H.; Vuilleumier, L.; Jendritzky, G. The uncertainty of UTCI due to uncertainties in the determination of radiation fluxes derived from measured and observed meteorological data. Int. J. Biometeorol. 2012, 56, 537–555. [Google Scholar] [CrossRef]
- Thorsson, S.; Lindberg, F.; Eliasson, I.; Holmer, B. Different methods for estimating the mean radiant temperature in an outdoor urban setting. Int. J. Climatol. 2007, 27, 1983–1993. [Google Scholar] [CrossRef]
- Matzarakis, A.; Rutz, F.; Mayer, H. Modelling radiation fluxes in simple and complex environments: Basics of the RayMan model. Int. J. Biometeorol. 2010, 54, 131–139. [Google Scholar] [CrossRef] [Green Version]
- Jendritzky, G.; de Dear, R.; Havenith, G. UTCI—why another thermal index? Int. J. Biometeorol. 2012, 56, 421–428. [Google Scholar] [CrossRef] [PubMed] [Green Version]
- Matzarakis, A. Weather-and climate-related information for tourism. Tour. Hosp. Plan. Dev. 2006, 3, 99–115. [Google Scholar] [CrossRef]
- Ge, Q.; Kong, Q.; Xi, J.; Zheng, J. Application of UTCI in China from tourism perspective. Theor. Appl. Climatol. 2017, 128, 551–561. [Google Scholar] [CrossRef]
- Yan, Y.; Wang, D.; Yue, S.; Qu, J. Trends in summer air temperature and vapor pressure and their impacts on thermal comfort in China. Theor. Appl. Climatol. 2019, 138, 1445–1456. [Google Scholar] [CrossRef]
- Houghten, F.C. Determining lines of equal comfort. ASHVE Trans. 1923, 29, 163–176. [Google Scholar]
- Siple, P.A.; Passel, C.F. Measurements of dry atmospheric cooling in subfreezing temperatures. Proc. Am. Philos. Soc. 1945, 89, 177–199. [Google Scholar] [CrossRef]
- Thom, E.C. The discomfort index. Weatherwise 1959, 12, 57–61. [Google Scholar] [CrossRef]
- Matzarakis, A.; Rutz, F.; Mayer, H. Modelling radiation fluxes in simple and complex environments—Application of the RayMan model. Int. J. Biometeorol. 2007, 51, 323–334. [Google Scholar] [CrossRef]
- Błazejczyk, K. New climatological and physiological model of the Human Heat Balance outdoor (MENEX) and its applications in bioclimatological studies in different scales. Zeszyty Instytutu Geografii i Przestrzennego Zagospodarowania PAN 1994, 28, 27–58. [Google Scholar]
- Bröde, P.; Fiala, D.; Błażejczyk, K.; Holmér, I.; Jendritzky, G.; Kampmann, B.; Havenith, G. Deriving the operational procedure for the Universal Thermal Climate Index (UTCI). Int. J. Biometeorol. 2012, 56, 481–494. [Google Scholar] [CrossRef] [Green Version]
- Fiala, D.; Lomas, K.J.; Stohrer, M. A computer model of human thermoregulation for a wide range of environmental conditions: The passive system. J. Appl. Physiol. 1999, 87, 1957–1972. [Google Scholar] [CrossRef]
- Fiala, D.; Lomas, K.J.; Stohrer, M. Computer prediction of human thermoregulatory and temperature responses to a wide range of environmental conditions. Int. J. Biometeorol. 2001, 45, 143–159. [Google Scholar] [CrossRef]
- Kampmann, B.; Bröde, P.; Fiala, D. Physiological responses to temperature and humidity compared to the assessment by UTCI, WGBT and PHS. Int. J. Biometeorol. 2012, 56, 505–513. [Google Scholar] [CrossRef]
- Blazejczyk, K.; Epstein, Y.; Jendritzky, G.; Staiger, H.; Tinz, B. Comparison of UTCI to selected thermal indices. Int. J. Biometeorol. 2012, 56, 515–535. [Google Scholar] [CrossRef] [Green Version]
- Roshan, G.; Nastos, P.T. Assessment of extreme heat stress probabilities in Iran’s urban settlements, using first order Markov chain model. Sustain. Cities. Soc. 2018, 36, 302–310. [Google Scholar] [CrossRef]
- Di Napoli, C.; Pappenberger, F.; Cloke, H.L. Assessing heat-related health risk in Europe via the Universal Thermal Climate Index (UTCI). Int. J. Biometeorol. 2018, 62, 1155–1165. [Google Scholar] [CrossRef] [Green Version]
- Zare, S.; Hasheminejad, N.; Shirvan, H.E.; Hemmatjo, R.; Sarebanzadeh, K.; Ahmadi, S. Comparing Universal Thermal Climate Index (UTCI) with selected thermal indices environmental parameters during 12 months of the year. Weather. Clim. Extreme. 2018, 19, 49–57. [Google Scholar] [CrossRef]
- Vinogradova, V. Using the Universal Thermal Climate Index (UTCI) for the assessment of bioclimatic conditions in Russia. Int. J. Biometeorol. 2021, 65, 1473–1483. [Google Scholar] [CrossRef]
- Pecelj, M.M.; Lukić, M.Z.; Filipović, D.J.; Protić, B.M.; Bogdanović, U.M. Analysis of the Universal Thermal Climate Index during heat waves in Serbia. Nat. Hazard Earth Sys. 2020, 20, 2021–2036. [Google Scholar] [CrossRef]
- Pantavou, K.; Lykoudis, S.; Nikolopoulou, M.; Tsiros, I.X. Thermal sensation and climate: A comparison of UTCI and PET thresholds in different climates. Int. J. Biometeorol. 2018, 62, 1695–1708. [Google Scholar] [CrossRef]
- Leroyer, S.; Bélair, S.; Spacek, L.; Gultepe, I. Modelling of radiation-based thermal stress indicators for urban numerical weather prediction. Urban. Clim. 2018, 25, 64–81. [Google Scholar] [CrossRef]
- Kong, Q.; Ge, Q.; Xi, J.; Zheng, J. Human-biometeorological assessment of increasing summertime extreme heat events in Shanghai, China during 1973–2015. Theor. Appl. Climatol. 2017, 130, 1055–1064. [Google Scholar] [CrossRef]
- Morcrette, J.J.; Mozdzynski, G.; Leutbecher, M. A reduced radiation grid for the ECMWF Integrated Forecasting System. Mon. Weather Rev. 2008, 136, 4760–4772. [Google Scholar] [CrossRef]
- Manners, J.; Thelen, J.C.; Petch, J.; Hill, P.; Edwards, J.M. Two fast radiative transfer methods to improve the temporal sampling of clouds in numerical weather prediction and climate models. Q. J. R. Meteor. Soc. 2009, 135, 457–468. [Google Scholar] [CrossRef]
- Janjai, S.; Pankaew, P.; Laksanaboonsong, J. A model for calculating hourly global solar radiation from satellite data in the tropics. Appl. Energy 2009, 86, 1450–1457. [Google Scholar] [CrossRef]
- Pinker, R.T.; Frouin, R.; Li, Z. A review of satellite methods to derive surface shortwave irradiance. Remote Sens. Environ. 1995, 51, 108–124. [Google Scholar] [CrossRef]
- Chen, R.; Ersi, K.; Yang, J.; Lu, S.; Zhao, W. Validation of five solar radiation models with measured daily data in China. Energy Convers. Manag. 2004, 45, 1759–1769. [Google Scholar] [CrossRef]
- Wu, G.; Liu, Y.; Wang, T. Methods and strategy for modeling daily global solar radiation with measured meteorological data–A case study in Nanchang station, China. Energy Convers. Manag. 2007, 48, 2447–2452. [Google Scholar] [CrossRef]
- Liu, X.; Mei, X.; Li, Y.; Porter, J.R.; Wang, Q.; Zhang, Y. Choice of the Ångström–Prescott coefficients: Are time-dependent ones better than fixed ones in modeling global solar irradiance? Energy Convers. Manag. 2010, 51, 2565–2574. [Google Scholar] [CrossRef]
- Bayrakçı, H.C.; Demircan, C.; Keçebaş, A. The development of empirical models for estimating global solar radiation on horizontal surface: A case study. Renew. Sust. Energy Rev. 2018, 81, 2771–2782. [Google Scholar] [CrossRef]
- Liu, J.; Linderholm, H.; Chen, D.; Zhou, X.; Flerchinger, G.N.; Yu, Q.; Yang, Z. Changes in the relationship between solar radiation and sunshine duration in large cities of China. Energy 2015, 82, 589–600. [Google Scholar] [CrossRef]
- Liu, J.; Pan, T.; Chen, D.; Zhou, X.; Yu, Q.; Flerchinger, G.N.; Shen, Y. An improved Ångström-type model for estimating solar radiation over the Tibetan Plateau. Energies 2017, 10, 892. [Google Scholar] [CrossRef] [Green Version]
- Liu, J.; Liu, J.; Linderholm, H.W.; Chen, D.; Yu, Q.; Wu, D.; Haginoya, S. Observation and calculation of the solar radiation on the Tibetan Plateau. Energy Convers. Manag. 2012, 57, 23–32. [Google Scholar] [CrossRef]
- Tymvios, F.S.; Jacovides, C.P.; Michaelides, S.C.; Scouteli, C. Comparative study of Ångström’s and artificial neural networks’ methodologies in estimating global solar radiation. Sol. Energy 2005, 78, 752–762. [Google Scholar] [CrossRef]
- He, C.; Liu, J.; Xu, F.; Zhang, T.; Chen, S.; He, J. Improving solar radiation estimation in China based on regional optimal combination of meteorological factors with machine learning methods. Energy Convers. Manag. 2020, 220, 113111. [Google Scholar] [CrossRef]
- Domros, M.; Peng., G.B. The Climate of China; Springer: Berlin, Germany, 1988. [Google Scholar]
- Chi, X.; Li, R.; Cubasch, U.; Cao, W. The thermal comfort and its changes in the 31 provincial capital cities of mainland China in the past 30 years. Theor. Appl. Climatol. 2018, 132, 599–619. [Google Scholar] [CrossRef]
- Wu, F.; Yang, X.; Shen, Z. Regional and seasonal variations of outdoor thermal comfort in China from 1966 to 2016. Sci. Total Environ. 2019, 665, 1003–1016. [Google Scholar] [CrossRef]
- Xie, X.; Sun, H.; Gao, J.; Chen, F.; Zhou, C. Spatiotemporal differentiation of coupling and coordination relationship of tourism–urbanization–ecological environment system in China’s major tourist cities. Sustainability 2021, 13, 5867. [Google Scholar] [CrossRef]
- Angstrom, A. Solar and terrestrial radiation. Q. J. R. Meteor. Soc. 1924, 50, 121–125. [Google Scholar] [CrossRef]
- Prescott, J.A. Evaporation from a water surface in relation to solar radiation. Trans. R. Soc. S. Aust. 1940, 46, 114–118. [Google Scholar]
- Allen, R.G.; Pereira, L.S.; Raes, D.; Smith, M. Crop Evapotranspiration-Guidelines for Computing Crop Water Requirements-FAO Irrigation and Drainage Paper 56; FAO: Rome, Italy, 1998; Volume 300, p. D05109. [Google Scholar]
- Ögelman, H.; Ecevit, A.; Tasdemiroglu, E. A new method for estimating solar radiation from bright sunshine data. Sol. Energy 1984, 33, 619–625. [Google Scholar] [CrossRef]
- Bristow, K.L.; Campbell, G.S. On the relationship between incoming solar radiation and daily maximum and minimum temperature. Agric. Forest Meteorol. 1984, 31, 159–166. [Google Scholar] [CrossRef]
- Hargreaves, G.L.; Hargreaves, G.H.; Riley, J.P. Irrigation water requirements for Senegal River basin. J. Irrig. Drain. Eng. 1985, 111, 265–275. [Google Scholar] [CrossRef]
- Wang, Z.; Wang, F.; Su, S. Solar irradiance short-term prediction model based on BP neural network. Energy Procedia 2011, 12, 488–494. [Google Scholar] [CrossRef] [Green Version]
- Hans, V.S.; Francos, W.Z. Statistical Analysis in Climate Research; Cambridge University Press: Cambridge, UK, 1999. [Google Scholar]
- Fernandes, R.; Leblanc, S.G. Parametric (modified least squares) and non-parametric (Theil–Sen) linear regressions for predicting biophysical parameters in the presence of measurement errors. Remote Sens. Environ. 2005, 95, 303–316. [Google Scholar] [CrossRef]
- Mann, H.B. Nonparametric tests against trend. Econometrica 1945, 13, 245–259. [Google Scholar] [CrossRef]
- Kendall, M.G. Rank Correlation Methods, 4th ed.; Charles Griffin: London, UK, 1975. [Google Scholar]
- Zhou, L.; Pan, S.; Wang, J.; Vasilakos, A.V. Machine learning on big data: Opportunities and challenges. Neurocomputing 2017, 237, 350–361. [Google Scholar] [CrossRef] [Green Version]
- Ibrahim, I.A.; Khatib, T. A novel hybrid model for hourly global solar radiation prediction using random forests technique and firefly algorithm. Energy Convers. Manag. 2017, 138, 413–425. [Google Scholar] [CrossRef]
- Harvey, L.D.D. Global Warming: The Hard Science; Pearson Education Limited: London, UK, 2000. [Google Scholar]
- Tol, R.S. The economic impacts of climate change. Rev. Environ. Econ. Policy. 2018, 12, 4–25. [Google Scholar] [CrossRef] [Green Version]
- Calzadilla, A.; Rehdanz, K.; Betts, R.; Falloon, P.; Wiltshire, A.; Tol, R.S. Climate change impacts on global agriculture. Clim. Change 2013, 120, 357–374. [Google Scholar] [CrossRef]
- Wheeler, T.; von Braun, J. Climate change impacts on global food security. Science 2013, 341, 508–513. [Google Scholar] [CrossRef]
- Hashim, J.H.; Hashim, Z. Climate change, extreme weather events, and human health implications in the Asia Pacific Region. Asia-Pac. J. Public. Health 2016, 28, 8S–14S. [Google Scholar] [CrossRef]
- Mills, D.M. Climate change, extreme weather events, and us health impacts: What can we say? J. Occup. Environ. Med. 2009, 63, 26–32. [Google Scholar] [CrossRef]
- Mirza, M.M.Q. Climate change and extreme weather events: Can developing countries adapt? Clim. Policy 2003, 3, 233–248. [Google Scholar] [CrossRef]
- Li, M.; Gu, S.; Bi, P.; Yang, J.; Liu, Q. Heat waves and morbidity: Current knowledge and further direction-a comprehensive literature review. Int. J. Environ. Res. Pub. Health 2015, 12, 5256–5283. [Google Scholar] [CrossRef] [PubMed] [Green Version]
- Hanna, E.G.; Tait, P.W. Limitations to thermoregulation and acclimatization challenge human adaptation to global warming. Int. J. Env. Res. Pub. Health 2015, 12, 8034–8074. [Google Scholar] [CrossRef] [PubMed]
- Zhai, P.; Pan, X. Trends in temperature extremes during 1951–1999 in China. Geophys. Res. Lett. 2003, 30, 17. [Google Scholar] [CrossRef]
- Ma, L.J.; Sun, G.N.; Wang, J.J. Evaluation of tourism climate comfortableness of coastal cities in the eastern China. Prog. Geog. 2009, 28, 713–722. [Google Scholar]
- Ren, J.M.; Niu, J.J.; Hu, C.H. Tourism climate and evaluation of comfortableness in Wutai Mountain. Geogr. Res. 2004, 23, 856–862. [Google Scholar]
- Wang, S.; Tian, H.; Xie, W.S. A study on variations and comprehensive zoning of climate comfort degree in Anhui Province in the past 50 years. Prog. Geog. 2012, 31, 40–45. [Google Scholar]
- Yang, K.; Zhang, J. Spatiotemporal characteristics of soil temperature memory in China from observation. Theor. Appl. Climatol. 2016, 126, 739–749. [Google Scholar] [CrossRef]


| Cities | Latitude (N) | Longitude (E) | Altitude (m) | Climate Conditions | Population (Million) |
|---|---|---|---|---|---|
| Beijing (BJ) | 39.8 | 116.5 | 31.3 | temperate and sub-humid | 21.9 |
| Tianjin (TJ) | 39.1 | 117.1 | 3.5 | temperate and sub-humid | 13.9 |
| Dalian (DL) | 38.9 | 121.6 | 91.5 | temperate and sub-humid | 7.5 |
| Qingdao (QD) | 36.1 | 120.3 | 76.0 | temperate and sub-humid | 10.0 |
| Shanghai (SH) | 31.4 | 121.5 | 5.5 | subtropical humid | 24.9 |
| Nanjing (NJ) | 31.9 | 118.9 | 35.2 | subtropical humid | 9.3 |
| Suzhou (SZ) | 31.3 | 120.6 | 10.7 | subtropical humid | 12.7 |
| Hangzhou (HZ) | 30.2 | 120.2 | 41.7 | subtropical humid | 12.2 |
| Xiamen (XM) | 24.5 | 118.1 | 139.4 | tropical humid | 5.2 |
| Guangzhou (GZ) | 23.2 | 113.3 | 41.0 | tropical humid | 18.7 |
| Shenzhen (SE) | 22.5 | 114.0 | 63.0 | tropical humid | 17.6 |
| Sanya (SY) | 18.2 | 109.6 | 419.4 | tropical humid | 1.0 |
| Qinhuangdao (QH) | 39.9 | 119.5 | 2.4 | temperate and sub-humid | 3.1 |
| Ningbo (NB) | 30.0 | 121.6 | 4.0 | subtropical humid | 8.5 |
| Harbin (HB) | 45.8 | 126.8 | 142.3 | temperate and sub-humid | 10.0 |
| Zhengzhou (ZZ) | 34.7 | 113.7 | 110.4 | temperate and sub-humid | 12.6 |
| Wuhan (WH) | 30.6 | 114.1 | 23.6 | subtropical humid | 12.3 |
| Zhangjiajie (ZJ) | 29.1 | 110.5 | 183.5 | subtropical humid | 1.5 |
| Changsha (CS) | 28.2 | 112.9 | 68.0 | subtropical humid | 10.0 |
| Huangshan (HS) | 30.1 | 118.2 | 1840.4 | subtropical humid | 1.3 |
| Guilin (GL) | 25.3 | 110.3 | 164.4 | subtropical humid | 4.9 |
| Changchun (CC) | 43.9 | 125.2 | 236.8 | temperate and sub-humid | 9.1 |
| Hohhot (HH) | 40.8 | 111.7 | 1063.0 | Inner Mongolia | 3.4 |
| Jinzhong (JZ) | 37.7 | 112.8 | 831.2 | Temperate and sub-humid | 3.3 |
| Nanchang (NC) | 28.6 | 115.9 | 46.9 | subtropical humid | 6.4 |
| Xi’an (XA) | 34.3 | 108.9 | 397.5 | temperate and sub-humid | 12.9 |
| Chongqing (CQ) | 29.5 | 106.5 | 351.1 | subtropical humid | 32.1 |
| Chengdu (CD) | 30.7 | 104.0 | 507.3 | subtropical humid | 21.2 |
| Kunming (KM) | 25.0 | 102.7 | 1888.1 | subtropical humid | 8.5 |
| Lijiang (LJ) | 26.9 | 100.2 | 2380.9 | subtropical humid | 1.3 |
| Zunyi (ZY) | 27.7 | 106.9 | 843.9 | subtropical humid | 6.6 |
| Yinchuan (YC) | 38.5 | 106.2 | 1110.9 | Inner Mongolia | 2.9 |
| Jiuquan (JQ) | 39.8 | 98.5 | 1477.2 | temperate and warm-temperate | 1.0 |
| Xining (XN) | 36.7 | 101.8 | 2295.2 | Qinghai-Tibetan Plateau | 2.5 |
| Wulumuqi (WL) | 43.8 | 87.7 | 935.0 | temperate and warm-temperate | 4.1 |
| Category | UTCI Range (°C) | Stress Description |
|---|---|---|
| Category 1 (C1) | above +46 | extreme heat stress |
| Category 2 (C2) | +38 to +46 | very strong heat stress |
| Category 3 (C3) | +32 to +38 | strong heat stress |
| Category 4 (C4) | +26 to +32 | moderate heat stress |
| Category 5 (C5) | +9 to +26 | no thermal stress |
| Category 6 (C6) | 0 to +9 | slight cold stress |
| Category 7 (C7) | −13 to 0 | moderate cold stress |
| Category 8 (C8) | −27 to −13 | strong cold stress |
| Category 9 (C9) | −40 to −27 | very strong cold stress |
| Category 10 (C10) | below −40 | extreme cold stress |
| Model | City | a | b | c | NSE | MAPE | RMSE | Slope | Inter | n |
|---|---|---|---|---|---|---|---|---|---|---|
| Angstrom | Beijing | 0.167 | 0.518 | - | 0.930 | 11.677 | 21.408 | 0.894 | 15.637 | 7118 |
| Hangzhou | 0.136 | 0.587 | - | 0.900 | 17.061 | 27.982 | 0.881 | 15.355 | 6993 | |
| Guangzhou | 0.159 | 0.502 | - | 0.844 | 16.697 | 26.249 | 0.840 | 21.090 | 6665 | |
| Harbin | 0.240 | 0.456 | - | 0.900 | 13.338 | 27.154 | 0.880 | 18.462 | 7006 | |
| Wuhan | 0.130 | 0.537 | - | 0.881 | 17.865 | 29.602 | 0.867 | 17.049 | 7011 | |
| Chongqing | 0.133 | 0.570 | - | 0.861 | 24.131 | 30.517 | 0.858 | 13.370 | 7020 | |
| Average | 0.161 | 0.528 | - | 0.886 | 16.795 | 27.152 | 0.870 | 16.827 | 6969 | |
| Ogelman | Beijing | 0.174 | 0.483 | 0.038 | 0.930 | 11.501 | 21.422 | 0.895 | 16.510 | 7118 |
| Hangzhou | 0.122 | 0.832 | −0.310 | 0.908 | 17.158 | 26.837 | 0.890 | 14.371 | 6993 | |
| Guangzhou | 0.141 | 0.743 | −0.303 | 0.858 | 16.700 | 25.032 | 0.873 | 17.165 | 6665 | |
| Harbin | 0.224 | 0.585 | −0.138 | 0.902 | 13.574 | 26.910 | 0.882 | 18.270 | 7006 | |
| Wuhan | 0.116 | 0.793 | −0.316 | 0.890 | 18.152 | 28.481 | 0.874 | 16.323 | 7011 | |
| Chongqing | 0.123 | 0.906 | −0.481 | 0.879 | 24.012 | 28.547 | 0.868 | 12.635 | 7020 | |
| Average | 0.150 | 0.724 | −0.252 | 0.895 | 16.850 | 26.205 | 0.880 | 15.879 | 6969 | |
| Bristow | Beijing | 0.602 | 0.025 | 1.840 | 0.670 | 20.070 | 46.432 | 0.711 | 47.635 | 7118 |
| Hangzhou | 0.549 | 0.009 | 2.428 | 0.691 | 23.948 | 49.186 | 0.695 | 41.642 | 6993 | |
| Guangzhou | 0.515 | 0.011 | 2.336 | 0.600 | 23.024 | 42.090 | 0.625 | 47.369 | 6663 | |
| Harbin | 0.600 | 0.081 | 1.324 | 0.699 | 21.321 | 47.050 | 0.685 | 48.281 | 7006 | |
| Wuhan | 0.496 | 0.005 | 2.938 | 0.626 | 24.209 | 52.551 | 0.607 | 53.517 | 7011 | |
| Chongqing | 0.563 | 0.015 | 1.978 | 0.750 | 25.154 | 41.006 | 0.753 | 24.299 | 7020 | |
| Average | 0.554 | 0.024 | 2.141 | 0.673 | 22.954 | 46.386 | 0.679 | 43.791 | 6969 | |
| Hargreaves | Beijing | 0.180 | −0.098 | - | 0.649 | 21.504 | 47.874 | 0.688 | 51.044 | 7118 |
| Hangzhou | 0.244 | −0.304 | - | 0.693 | 24.305 | 49.000 | 0.678 | 44.199 | 6993 | |
| Guangzhou | 0.248 | −0.325 | - | 0.604 | 22.791 | 41.858 | 0.597 | 53.491 | 6663 | |
| Harbin | 0.137 | 0.046 | - | 0.698 | 21.220 | 47.096 | 0.695 | 47.187 | 7006 | |
| Wuhan | 0.242 | −0.296 | - | 0.625 | 23.737 | 52.674 | 0.572 | 55.445 | 7011 | |
| Chongqing | 0.220 | −0.288 | - | 0.770 | 23.042 | 39.282 | 0.748 | 25.765 | 7020 | |
| Average | 0.212 | −0.211 | - | 0.673 | 22.767 | 46.297 | 0.663 | 46.189 | 6969 | |
| BP neural network | Beijing | - | - | - | 0.960 | 9.745 | 16.197 | 0.958 | 6.336 | 7118 |
| Hangzhou | - | - | - | 0.947 | 14.718 | 20.307 | 0.947 | 7.359 | 6993 | |
| Guangzhou | - | - | - | 0.925 | 13.429 | 18.252 | 0.922 | 10.088 | 6665 | |
| Harbin | - | - | - | 0.925 | 11.900 | 23.519 | 0.922 | 11.988 | 7006 | |
| Wuhan | - | - | - | 0.917 | 17.318 | 24.701 | 0.917 | 11.456 | 7011 | |
| Chongqing | - | - | - | 0.951 | 18.147 | 18.083 | 0.951 | 4.857 | 7020 | |
| Average | - | - | - | 0.938 | 14.210 | 20.177 | 0.936 | 8.681 | 6969 | |
| Support vector machine | Beijing | - | - | - | 0.960 | 9.777 | 16.155 | 0.965 | 5.478 | 7118 |
| Hangzhou | - | - | - | 0.947 | 14.451 | 20.369 | 0.942 | 7.554 | 6993 | |
| Guangzhou | - | - | - | 0.925 | 13.183 | 18.174 | 0.927 | 10.171 | 6665 | |
| Harbin | - | - | - | 0.927 | 11.256 | 23.241 | 0.915 | 11.244 | 7006 | |
| Wuhan | - | - | - | 0.929 | 16.153 | 22.959 | 0.950 | 7.703 | 7011 | |
| Chongqing | - | - | - | 0.953 | 17.445 | 17.786 | 0.952 | 4.932 | 7020 | |
| Average | - | - | - | 0.940 | 13.711 | 19.781 | 0.942 | 7.847 | 6969 |
| Model | City | NSE | MAPE | RMSE | Slope | Inter | n |
|---|---|---|---|---|---|---|---|
| Angstrom | Beijing | 0.866 | 14.284 | 31.979 | 0.823 | 13.784 | 3157 |
| Hangzhou | 0.839 | 21.244 | 39.101 | 0.794 | 14.421 | 3181 | |
| Guangzhou | 0.848 | 18.853 | 28.226 | 0.849 | 8.514 | 3048 | |
| Harbin | 0.758 | 17.935 | 42.942 | 0.745 | 30.079 | 2982 | |
| Wuhan | 0.838 | 21.756 | 35.622 | 0.838 | 6.737 | 3090 | |
| Chongqing | 0.865 | 25.230 | 34.305 | 0.833 | 11.752 | 2666 | |
| Average | 0.836 | 19.884 | 35.363 | 0.814 | 14.215 | 3021 | |
| Ogelman | Beijing | 0.871 | 13.925 | 31.430 | 0.824 | 14.753 | 3157 |
| Hangzhou | 0.850 | 20.544 | 37.641 | 0.805 | 13.005 | 3181 | |
| Guangzhou | 0.859 | 18.600 | 27.114 | 0.870 | 5.298 | 3048 | |
| Harbin | 0.766 | 17.675 | 42.292 | 0.758 | 28.327 | 2982 | |
| Wuhan | 0.851 | 20.876 | 34.192 | 0.851 | 5.718 | 3090 | |
| Chongqing | 0.869 | 25.018 | 33.765 | 0.812 | 13.284 | 2666 | |
| Average | 0.844 | 19.440 | 34.406 | 0.820 | 13.398 | 3021 | |
| Bristow | Beijing | 0.676 | 20.839 | 49.781 | 0.663 | 47.803 | 3156 |
| Hangzhou | 0.688 | 27.359 | 54.323 | 0.665 | 36.553 | 3180 | |
| Guangzhou | 0.673 | 22.910 | 41.338 | 0.670 | 39.519 | 3047 | |
| Harbin | 0.616 | 23.049 | 54.105 | 0.602 | 55.703 | 2981 | |
| Wuhan | 0.631 | 25.879 | 53.798 | 0.612 | 58.487 | 3088 | |
| Chongqing | 0.728 | 29.767 | 48.626 | 0.698 | 21.339 | 2665 | |
| Average | 0.669 | 24.967 | 50.329 | 0.652 | 43.234 | 3020 | |
| Hargreaves | Beijing | 0.659 | 21.534 | 51.117 | 0.650 | 50.072 | 3156 |
| Hangzhou | 0.693 | 25.461 | 53.913 | 0.665 | 36.779 | 3180 | |
| Guangzhou | 0.683 | 22.481 | 40.661 | 0.673 | 42.975 | 3047 | |
| Harbin | 0.618 | 22.622 | 54.003 | 0.607 | 55.754 | 2981 | |
| Wuhan | 0.659 | 23.908 | 51.761 | 0.686 | 52.406 | 3088 | |
| Chongqing | 0.744 | 26.345 | 47.135 | 0.696 | 22.075 | 2665 | |
| Average | 0.676 | 23.725 | 49.765 | 0.663 | 43.344 | 3020 | |
| BP neural network | Beijing | 0.902 | 13.060 | 27.385 | 0.864 | 7.698 | 3158 |
| Hangzhou | 0.894 | 18.316 | 31.648 | 0.854 | 7.498 | 3182 | |
| Guangzhou | 0.878 | 16.842 | 25.254 | 0.910 | −4.069 | 3049 | |
| Harbin | 0.792 | 17.363 | 39.825 | 0.796 | 20.184 | 2983 | |
| Wuhan | 0.891 | 20.557 | 29.313 | 0.899 | −0.245 | 3091 | |
| Chongqing | 0.912 | 20.084 | 27.717 | 0.862 | 8.983 | 2667 | |
| Average | 0.878 | 17.704 | 30.190 | 0.864 | 6.675 | 3022 | |
| Support vector machine | Beijing | 0.899 | 13.192 | 27.851 | 0.861 | 7.882 | 3158 |
| Hangzhou | 0.890 | 18.298 | 32.325 | 0.845 | 8.477 | 3182 | |
| Guangzhou | 0.881 | 17.139 | 24.889 | 0.919 | −5.099 | 3049 | |
| Harbin | 0.791 | 17.470 | 39.939 | 0.787 | 20.197 | 2983 | |
| Wuhan | 0.894 | 20.770 | 28.865 | 0.933 | −5.885 | 3091 | |
| Chongqing | 0.909 | 20.048 | 28.068 | 0.852 | 10.173 | 2667 | |
| Average | 0.877 | 17.820 | 30.323 | 0.866 | 5.958 | 3022 |
| Model | City | NSE | MAPE | RMSE | Slope | Inter | n |
|---|---|---|---|---|---|---|---|
| Angstrom | Beijing | 0.993 | 7.683 | 1.121 | 0.994 | −0.375 | 3157 |
| Hangzhou | 0.990 | 7.210 | 1.137 | 0.992 | −0.275 | 3181 | |
| Guangzhou | 0.989 | 3.788 | 0.907 | 1.001 | −0.404 | 3048 | |
| Harbin | 0.987 | 10.162 | 2.013 | 1.017 | −0.601 | 2982 | |
| Wuhan | 0.989 | 7.093 | 1.238 | 0.992 | −0.309 | 3090 | |
| Chongqing | 0.989 | 4.505 | 0.998 | 0.983 | 0.175 | 2666 | |
| Average | 0.990 | 6.740 | 1.236 | 0.997 | −0.298 | 3021 | |
| Ogelman | Beijing | 0.993 | 7.617 | 1.112 | 0.994 | −0.350 | 3157 |
| Hangzhou | 0.991 | 6.453 | 1.044 | 0.993 | −0.245 | 3181 | |
| Guangzhou | 0.990 | 3.584 | 0.843 | 1.003 | −0.425 | 3048 | |
| Harbin | 0.987 | 10.034 | 1.994 | 1.018 | −0.582 | 2982 | |
| Wuhan | 0.990 | 6.449 | 1.146 | 0.990 | −0.213 | 3090 | |
| Chongqing | 0.990 | 4.331 | 0.967 | 0.975 | 0.308 | 2666 | |
| Average | 0.990 | 6.411 | 1.184 | 0.996 | −0.251 | 3021 | |
| Bristow | Beijing | 0.982 | 11.797 | 1.778 | 0.996 | −0.134 | 3156 |
| Hangzhou | 0.974 | 8.787 | 1.790 | 0.986 | −0.144 | 3180 | |
| Guangzhou | 0.979 | 4.816 | 1.242 | 0.975 | 0.400 | 3047 | |
| Harbin | 0.981 | 12.933 | 2.366 | 1.006 | −0.211 | 2981 | |
| Wuhan | 0.976 | 9.028 | 1.779 | 0.940 | 1.347 | 3088 | |
| Chongqing | 0.980 | 5.246 | 1.368 | 0.972 | 0.079 | 2665 | |
| Average | 0.979 | 8.768 | 1.721 | 0.979 | 0.223 | 3020 | |
| Hargreaves | Beijing | 0.980 | 12.380 | 1.858 | 0.994 | −0.178 | 3156 |
| Hangzhou | 0.975 | 8.810 | 1.774 | 0.988 | −0.219 | 3180 | |
| Guangzhou | 0.978 | 5.079 | 1.280 | 0.976 | 0.393 | 3047 | |
| Harbin | 0.983 | 12.607 | 2.297 | 1.005 | −0.218 | 2981 | |
| Wuhan | 0.980 | 8.134 | 1.635 | 0.951 | 1.197 | 3088 | |
| Chongqing | 0.982 | 4.970 | 1.277 | 0.965 | 0.269 | 2665 | |
| Average | 0.980 | 8.663 | 1.687 | 0.980 | 0.207 | 3020 | |
| BP neural network | Beijing | 0.994 | 7.024 | 1.036 | 0.992 | −0.322 | 3158 |
| Hangzhou | 0.993 | 5.496 | 0.944 | 0.996 | −0.274 | 3182 | |
| Guangzhou | 0.992 | 3.008 | 0.774 | 0.999 | −0.369 | 3049 | |
| Harbin | 0.988 | 9.361 | 1.878 | 1.011 | −0.573 | 2983 | |
| Wuhan | 0.991 | 6.008 | 1.106 | 0.996 | −0.326 | 3091 | |
| Chongqing | 0.992 | 3.206 | 0.874 | 0.983 | 0.137 | 2667 | |
| Average | 0.992 | 5.684 | 1.102 | 0.996 | −0.288 | 3022 | |
| Support vector machine | Beijing | 0.994 | 7.201 | 1.056 | 0.992 | −0.343 | 3158 |
| Hangzhou | 0.993 | 5.533 | 0.950 | 0.996 | −0.284 | 3182 | |
| Guangzhou | 0.992 | 3.103 | 0.770 | 1.001 | −0.391 | 3049 | |
| Harbin | 0.988 | 9.638 | 1.878 | 1.010 | −0.597 | 2983 | |
| Wuhan | 0.992 | 5.576 | 1.038 | 0.993 | −0.258 | 3091 | |
| Chongqing | 0.992 | 3.176 | 0.847 | 0.981 | 0.204 | 2667 | |
| Average | 0.992 | 5.705 | 1.090 | 0.996 | −0.278 | 3022 |
| Cities | UTCI (°C) | C3 (Day) | C4 (Day) | C5 (Day) | C6 (Day) | C7 (Day) | C8 (Day) | C9 (Day) |
|---|---|---|---|---|---|---|---|---|
| BJ | 11.6 ± 1.3 [8.7,13.9] | 7.2 ± 5.0 [0,22] | 60.2 ± 8.7 [40,81] | 146.8 ± 10.6 [122,171] | 61.1 ± 11.1 [39,84] | 74.2 ± 9.8 [53,95] | 14.6 ± 8.8 [1,36] | 1.2 ± 2.0 [0,8] |
| TJ | 11.7 ± 1.3 [8.8,14.1] | 8.6 ± 5.5 [0,24] | 61.4 ± 10.1 [38,82] | 142.9 ± 10.0 [113,165] | 62.4 ± 10.2 [36,91] | 74.6 ± 11.5 [53,102] | 14.8 ± 8.3 [1,41] | 0.9 ± 1.2 [0,5] |
| DL | 5.5 ± 2.8 [0.3,10.8] | 0.5 ± 1.8 [0,13] | 24.2 ± 12.6 [3,53] | 150.3 ± 11.8 [126,179] | 56.2 ± 9.3 [35,85] | 81.5 ± 10.5 [60,105] | 40.0 ± 13.5 [9,66] | 10.8 ± 7.3 [0,28] |
| QD | 7.3 ± 2.3 [1.8,11.7] | 0.8 ± 1.7 [0,9] | 27.3 ± 13.0 [6,55] | 154.2 ± 10.8 [135,178] | 67.7 ± 10.7 [49,97] | 77.9 ± 13.3 [46,102] | 31.6 ± 10.7 [10,61] | 5.3 ± 4.6 [0,19] |
| SH | 14.2 ± 1.9 [10.2,17.8] | 17.8 ± 10.2 [1,42] | 54.1 ± 8.2 [37,66] | 166.8 ± 17.1 [133,208] | 72.6 ± 9.7 [50,93] | 48.5 ± 15.7 [14,79] | 5.3 ± 6.1 [0,28] | 0.1 ± 0.3 [0,1] |
| NJ | 15.4 ± 1.2 [12.8,18.3] | 23.6 ± 9.8 [6,52] | 57.7 ± 9.5 [35,80] | 168.2 ± 13.4 [138,207] | 70.4 ± 9.2 [53,91] | 41.5 ± 12.2 [12,71] | 3.2 ± 3.4 [0,15] | 0.0 ± 0.0 [0,0] |
| SZ | 14.8 ± 2.2 [10.1,18.5] | 22.1 ± 11.4 [4,45] | 54.3 ± 9.4 [33,79] | 167.6 ± 16.1 [129,201] | 72.6 ± 9.6 [56,91] | 44.0 ± 19.5 [8,89] | 4.1 ± 5.4 [0,22] | 0.1 ± 0.3 [0,1] |
| HZ | 16.8 ± 1.1 [14.5,18.8] | 32.6 ± 12.1 [14,61] | 56.3 ± 9.7 [25,82] | 176.8 ± 13.5 [145,205] | 68.0 ± 9.1 [48,95] | 29.7 ± 10.6 [8,58] | 1.5 ± 2.0 [0,10] | 0.0 ± 0.0 [0,0] |
| XM | 20.5 ± 1.3 [17.4,22.4] | 28.5 ± 14.7 [3,66] | 93.1 ± 13.8 [59,122] | 198.6 ± 13.9 [169,232] | 39.2 ± 13.0 [13,63] | 5.8 ± 5.6 [0,24] | 0.0 ± 0.0 [0,0] | 0.0 ± 0.0 [0,0] |
| GZ | 23.4 ± 0.9 [21.2,25.0] | 48.7 ± 11.1 [21,71] | 120.0 ± 13.0 [95,156] | 171.8 ± 11.9 [149,200] | 20.4 ± 7.1 [5,39] | 4.3 ± 4.9 [0,18] | 0.1 ± 0.2 [0,1] | 0.0 ± 0.0 [0,0] |
| SE | 23.5 ± 1.0 [21.5,26.0] | 47.2 ± 12.4 [25,86] | 122.5 ± 13.8 [100,160] | 173.8 ± 15.2 [143,201] | 18.0 ± 7.3 [3,34] | 3.7 ± 3.6 [0,16] | 0.0 ± 0.2 [0,1] | 0.0 ± 0.0 [0,0] |
| SY | 26.7 ± 3.0 [19.4,30.4] | 66.7 ± 45.6 [0,153] | 160.3 ± 33.2 [76,204] | 134.2 ± 63.0 [46,272] | 4.0 ± 8.1 [0,39] | 0.2 ± 0.7 [0,4] | 0.0 ± 0.0 [0,0] | 0.0 ± 0.0 [0,0] |
| QD | 9.9 ± 1.6 [5.7,12.7] | 2.3 ± 3.2 [0,14] | 44.6 ± 9.6 [16,66] | 152.8 ± 9.9 [128,170] | 59.5 ± 8.4 [45,81] | 88.7 ± 9.3 [53,109] | 16.5 ± 11.2 [1,45] | 0.8 ± 1.6 [0,9] |
| NB | 16.8 ± 1.5 [14.0,20.3] | 31.0 ± 13.2 [6,60] | 58.9 ± 9.1 [32,78] | 177.8 ± 14.8 [146,209] | 68.2 ± 10.1 [46,92] | 27.6 ± 12.1 [4,50] | 1.6 ± 2.2 [0,10] | 0.0 ± 0.0 [0,0] |
| HB | 0.5 ± 3.0 [−5.1,5.9] | 0.3 ± 0.7 [0,3] | 16.9 ± 10.0 [1,46] | 129.3 ± 13.6 [101,163] | 46.7 ± 8.1 [31,72] | 62.4 ± 8.5 [47,90] | 85.3 ± 11.2 [52,110] | 23.3 ± 19.4 [1,72] |
| ZZ | 13.9 ± 1.6 [9.7,17.4] | 14.6 ± 7.7 [4,42] | 64.3 ± 9.9 [40,86] | 153.7 ± 11.0 [127,179] | 69.9 ± 9.4 [45,91] | 55.1 ± 12.8 [24,79] | 7.1 ± 6.7 [0,30] | 0.4 ± 1.1 [0,7] |
| WH | 17.4 ± 1.6 [14.1,20.3] | 36.8 ± 10.8 [14,60] | 65.9 ± 10.4 [46,89] | 164.5 ± 15.8 [126,209] | 66.6 ± 9.6 [40,95] | 27.4 ± 14.0 [2,61] | 2.3 ± 3.2 [0,14] | 0.1 ± 0.3 [0,2] |
| ZJ | 18.3 ± 0.9 [16.5,19.8] | 32.7 ± 9.9 [13,55] | 68.9 ± 9.7 [51,90] | 183.4 ± 14.0 [156,220] | 65.3 ± 10.0 [44,95] | 14.4 ± 9.6 [0,40] | 0.5 ± 1.2 [0,7] | 0.0 ± 0.0 [0,0] |
| CS | 16.7 ± 0.9 [14.8,19.4] | 37.6 ± 10.5 [18,73] | 64.0 ± 8.0 [49,86] | 161.7 ± 13.2 [129,195] | 61.3 ± 9.6 [33,84] | 36.7 ± 9.5 [16,60] | 3.5 ± 3.0 [0,12] | 0.1 ± 0.3 [0,2] |
| HS | −1.7 ± 1.7 [−4.8,1.3] | 0. ± 0.1 [0,1] | 0.1 ± 0.3 [0,2] | 91.6 ± 17.3 [61,125] | 92.9 ± 11.1 [62,121] | 101.6 ± 8.9 [80,120] | 62.7 ± 10.5 [43,85] | 14.8 ± 6.1 [1,30] |
| GL | 18.2 ± 1.2 [15.5,20.2] | 36.0 ± 9.3 [13,59] | 89.0 ± 9.7 [65,117] | 156.7 ± 12.6 [122,190] | 48.9 ± 7.6 [30,67] | 30.8 ± 10.2 [6,51] | 3.9 ± 4.3 [0,16] | 0.1 ± 0.2 [0,1] |
| CC | 1.3 ± 2.5 [−4.5,6.4] | 0.4 ± 0.8 [0,4] | 17.8 ± 10.0 [3,44] | 131.9 ± 10.7 [106,158] | 46.3 ± 8.3 [27,66] | 68.1 ± 12.1 [41,91] | 79.9 ± 11.7 [52,107] | 20.3 ± 15.5 [0,65] |
| HH | 6.9 ± 1.8 [2.4,9.2] | 0.2 ± 0.6 [0,3] | 18.4 ± 9.6 [0,41] | 162.9 ± 12.0 [134,186] | 59.3 ± 8.7 [34,81] | 87.7 ± 11.5 [65,109] | 33.4 ± 15.8 [9,74] | 3.4 ± 3.2 [0,16] |
| JZ | 8.9 ± 1.3 [5.7,11.5] | 0.2 ± 0.6 [0,3] | 26.5 ± 8.7 [7,48] | 169.2 ± 10.4 [152,199] | 60.4 ± 9.6 [40,80] | 89.0 ± 9.7 [64,110] | 18.8 ± 9.1 [2,41] | 1.1 ± 1.3 [0,5] |
| NC | 17.7 ± 1.7 [14.5,20.4] | 45.8 ± 10.3 [22,74] | 64.0 ± 11.4 [38,87] | 162.3 ± 14.8 [128,198] | 57.0 ± 8.5 [36,75] | 29.8 ± 12.9 [7,59] | 4.6 ± 6.0 [0,24] | 0.3 ± 0.7 [0,4] |
| XA | 14.5 ± 1.1 [12.6,18.0] | 11.7 ± 6.9 [0,29] | 57.2 ± 9.0 [37,78] | 172.0 ± 13.3 [150,197] | 80.5 ± 10.6 [57,103] | 41.9 ± 12.2 [18,73] | 2.0 ± 2.5 [0,13] | 0.0 ± 0.0 [0,0] |
| CQ | 19.0 ± 0.8 [17.1,20.5] | 33.5 ± 10.5 [13,58] | 63.2 ± 11.6 [41,94] | 203.1 ± 12.4 [179,234] | 62.7 ± 12.6 [37,97] | 2.0 ± 2.6 [0,14] | 0.0 ± 0.0 [0,0] | 0.0 ± 0.0 [0,0] |
| CD | 17.5 ± 0.7 [16.4,20.1] | 6.6 ± 5.4 [0,21] | 65.7 ± 8.8 [50,101] | 216.3 ± 15.0 [176,243] | 72.2 ± 12.2 [45,105] | 4.4 ± 3.9 [0,22] | 0.0 ± 0.1 [0,1] | 0.0 ± 0.0 [0,0] |
| KM | 15.8 ± 1.3 [13.4,18.5] | 0. ± 0. [0,0] | 1.7 ± 2.3 [0,10] | 319.2 ± 18.4 [274,350] | 39.0 ± 17.4 [11,78] | 5.3 ± 3.3 [0,13] | 0.1 ± 0.2 [0,1] | 0.0 ± 0.1 [0,1] |
| LJ | 11.3 ± 1.6 [8.6,14.0] | 0. ± 0. [0,0] | 0.1 ± 0.4 [0,2] | 226.2 ± 27.7 [185,279] | 113.1 ± 14.3 [83,140] | 25.7 ± 19.9 [1,75] | 0.1 ± 0.3 [0,2] | 0.0 ± 0.0 [0,0] |
| ZY | 16.5 ± 0.8 [15.1,18.4] | 3.4 ± 4.6 [0,18] | 64.6 ± 12.9 [39,93] | 204.9 ± 17.8 [175,245] | 78.2 ± 11.5 [45,111] | 14.2 ± 8.2 [1,35] | 0.0 ± 0.2 [0,1] | 0.0 ± 0.0 [0,0] |
| YC | 10.1 ± 1.1 [7.5,12.5] | 0.7 ± 1.3 [0,7] | 32.3 ± 8.9 [9,51] | 171.0 ± 10.5 [151,199] | 64.8 ± 9.4 [40,89] | 84.4 ± 11.4 [55,113] | 11.9 ± 6.3 [1,28] | 0.2 ± 0.4 [0,1] |
| JQ | 7.4 ± 1.3 [4.6,10.1] | 0. ± 0.1 [0,1] | 13.1 ± 7.0 [0,32] | 168.2 ± 7.7 [155,186] | 64.6 ± 9.0 [46,84] | 97.9 ± 10.8 [68,122] | 21.1 ± 10.7 [5,45] | 0.3 ± 0.5 [0,2] |
| XN | 7.7 ± 1.6 [3.8,9.9] | 0. ± 0. [0,0] | 0.9 ± 1.9 [0,8] | 182.9 ± 15.5 [136,208] | 86.0 ± 11.2 [54,117] | 86.5 ± 13.4 [59,116] | 8.9 ± 8.3 [0,29] | 0.1 ± 0.4 [0,2] |
| WL | 6.5 ± 1.5 [1.6,9.0] | 0.5 ± 1.3 [0,7] | 21.8 ± 9.9 [3,42] | 160.2 ± 11.5 [139,198] | 50.5 ± 8.6 [36,71] | 85.9 ± 14.0 [57,118] | 45.1 ± 14.0 [13,75] | 0.1 ± 2.0 [0,9] |
Publisher’s Note: MDPI stays neutral with regard to jurisdictional claims in published maps and institutional affiliations. |
© 2022 by the authors. Licensee MDPI, Basel, Switzerland. This article is an open access article distributed under the terms and conditions of the Creative Commons Attribution (CC BY) license (https://creativecommons.org/licenses/by/4.0/).
Share and Cite
Liu, J.; Zhou, G.; Linderholm, H.W.; Song, Y.; Liu, D.-L.; Shen, Y.; Liu, Y.; Du, J. Optimal Strategy on Radiation Estimation for Calculating Universal Thermal Climate Index in Tourism Cities of China. Int. J. Environ. Res. Public Health 2022, 19, 8111. https://doi.org/10.3390/ijerph19138111
Liu J, Zhou G, Linderholm HW, Song Y, Liu D-L, Shen Y, Liu Y, Du J. Optimal Strategy on Radiation Estimation for Calculating Universal Thermal Climate Index in Tourism Cities of China. International Journal of Environmental Research and Public Health. 2022; 19(13):8111. https://doi.org/10.3390/ijerph19138111
Chicago/Turabian StyleLiu, Jiandong, Guangsheng Zhou, Hans W. Linderholm, Yanling Song, De-Li Liu, Yanbo Shen, Yanxiang Liu, and Jun Du. 2022. "Optimal Strategy on Radiation Estimation for Calculating Universal Thermal Climate Index in Tourism Cities of China" International Journal of Environmental Research and Public Health 19, no. 13: 8111. https://doi.org/10.3390/ijerph19138111
APA StyleLiu, J., Zhou, G., Linderholm, H. W., Song, Y., Liu, D.-L., Shen, Y., Liu, Y., & Du, J. (2022). Optimal Strategy on Radiation Estimation for Calculating Universal Thermal Climate Index in Tourism Cities of China. International Journal of Environmental Research and Public Health, 19(13), 8111. https://doi.org/10.3390/ijerph19138111