
Exploring Spatial Relationship between Restoration Suitability and Rivers for Sustainable Wetland Utilization

Abstract
:1. Introduction
2. Methods
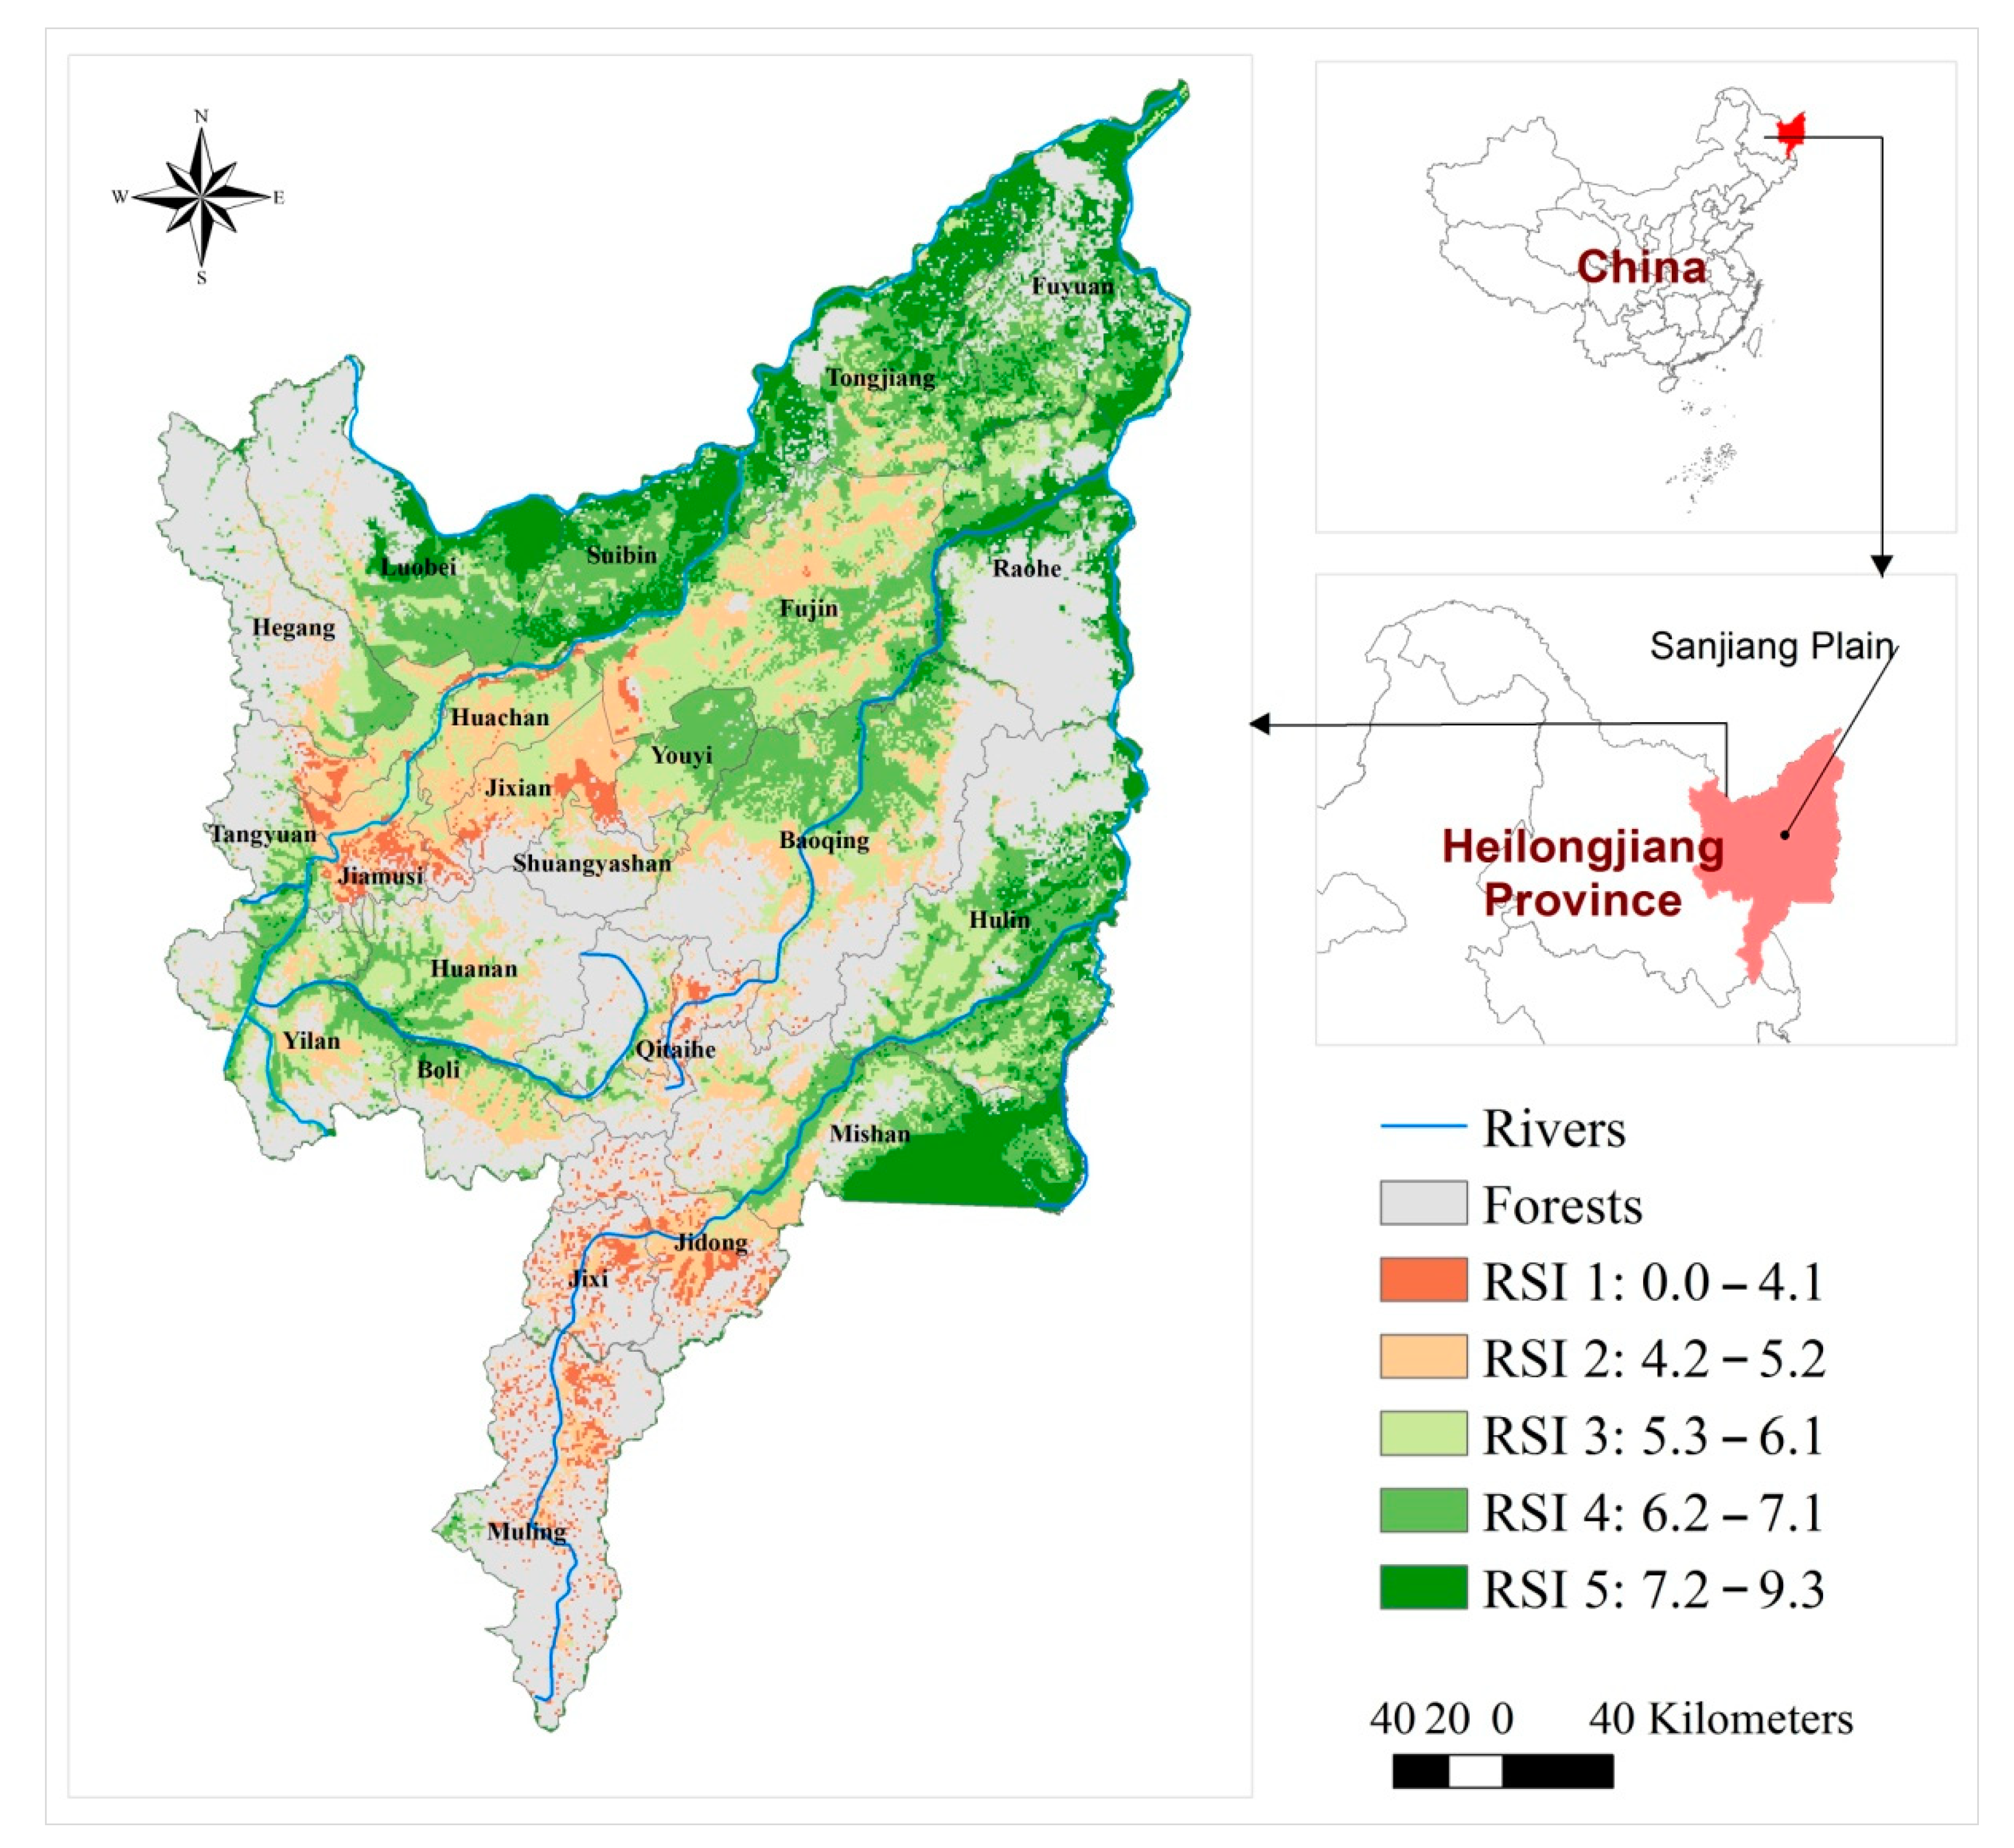
2.1. Study Area
2.2. Data Sources and Processing
2.3. Research Methods
2.3.1. Modelling of Wetland Restoration Suitability
2.3.2. Relationship between Wetland Restoration Suitability and Stream Orders
2.3.3. Relationship between Wetland Restoration Suitability and River Buffer Distances
3. Results
3.1. Weight of Wetland Restoration Suitability Indicators
3.2. Wetland Restoration Suitability Levels and Spatial Distribution
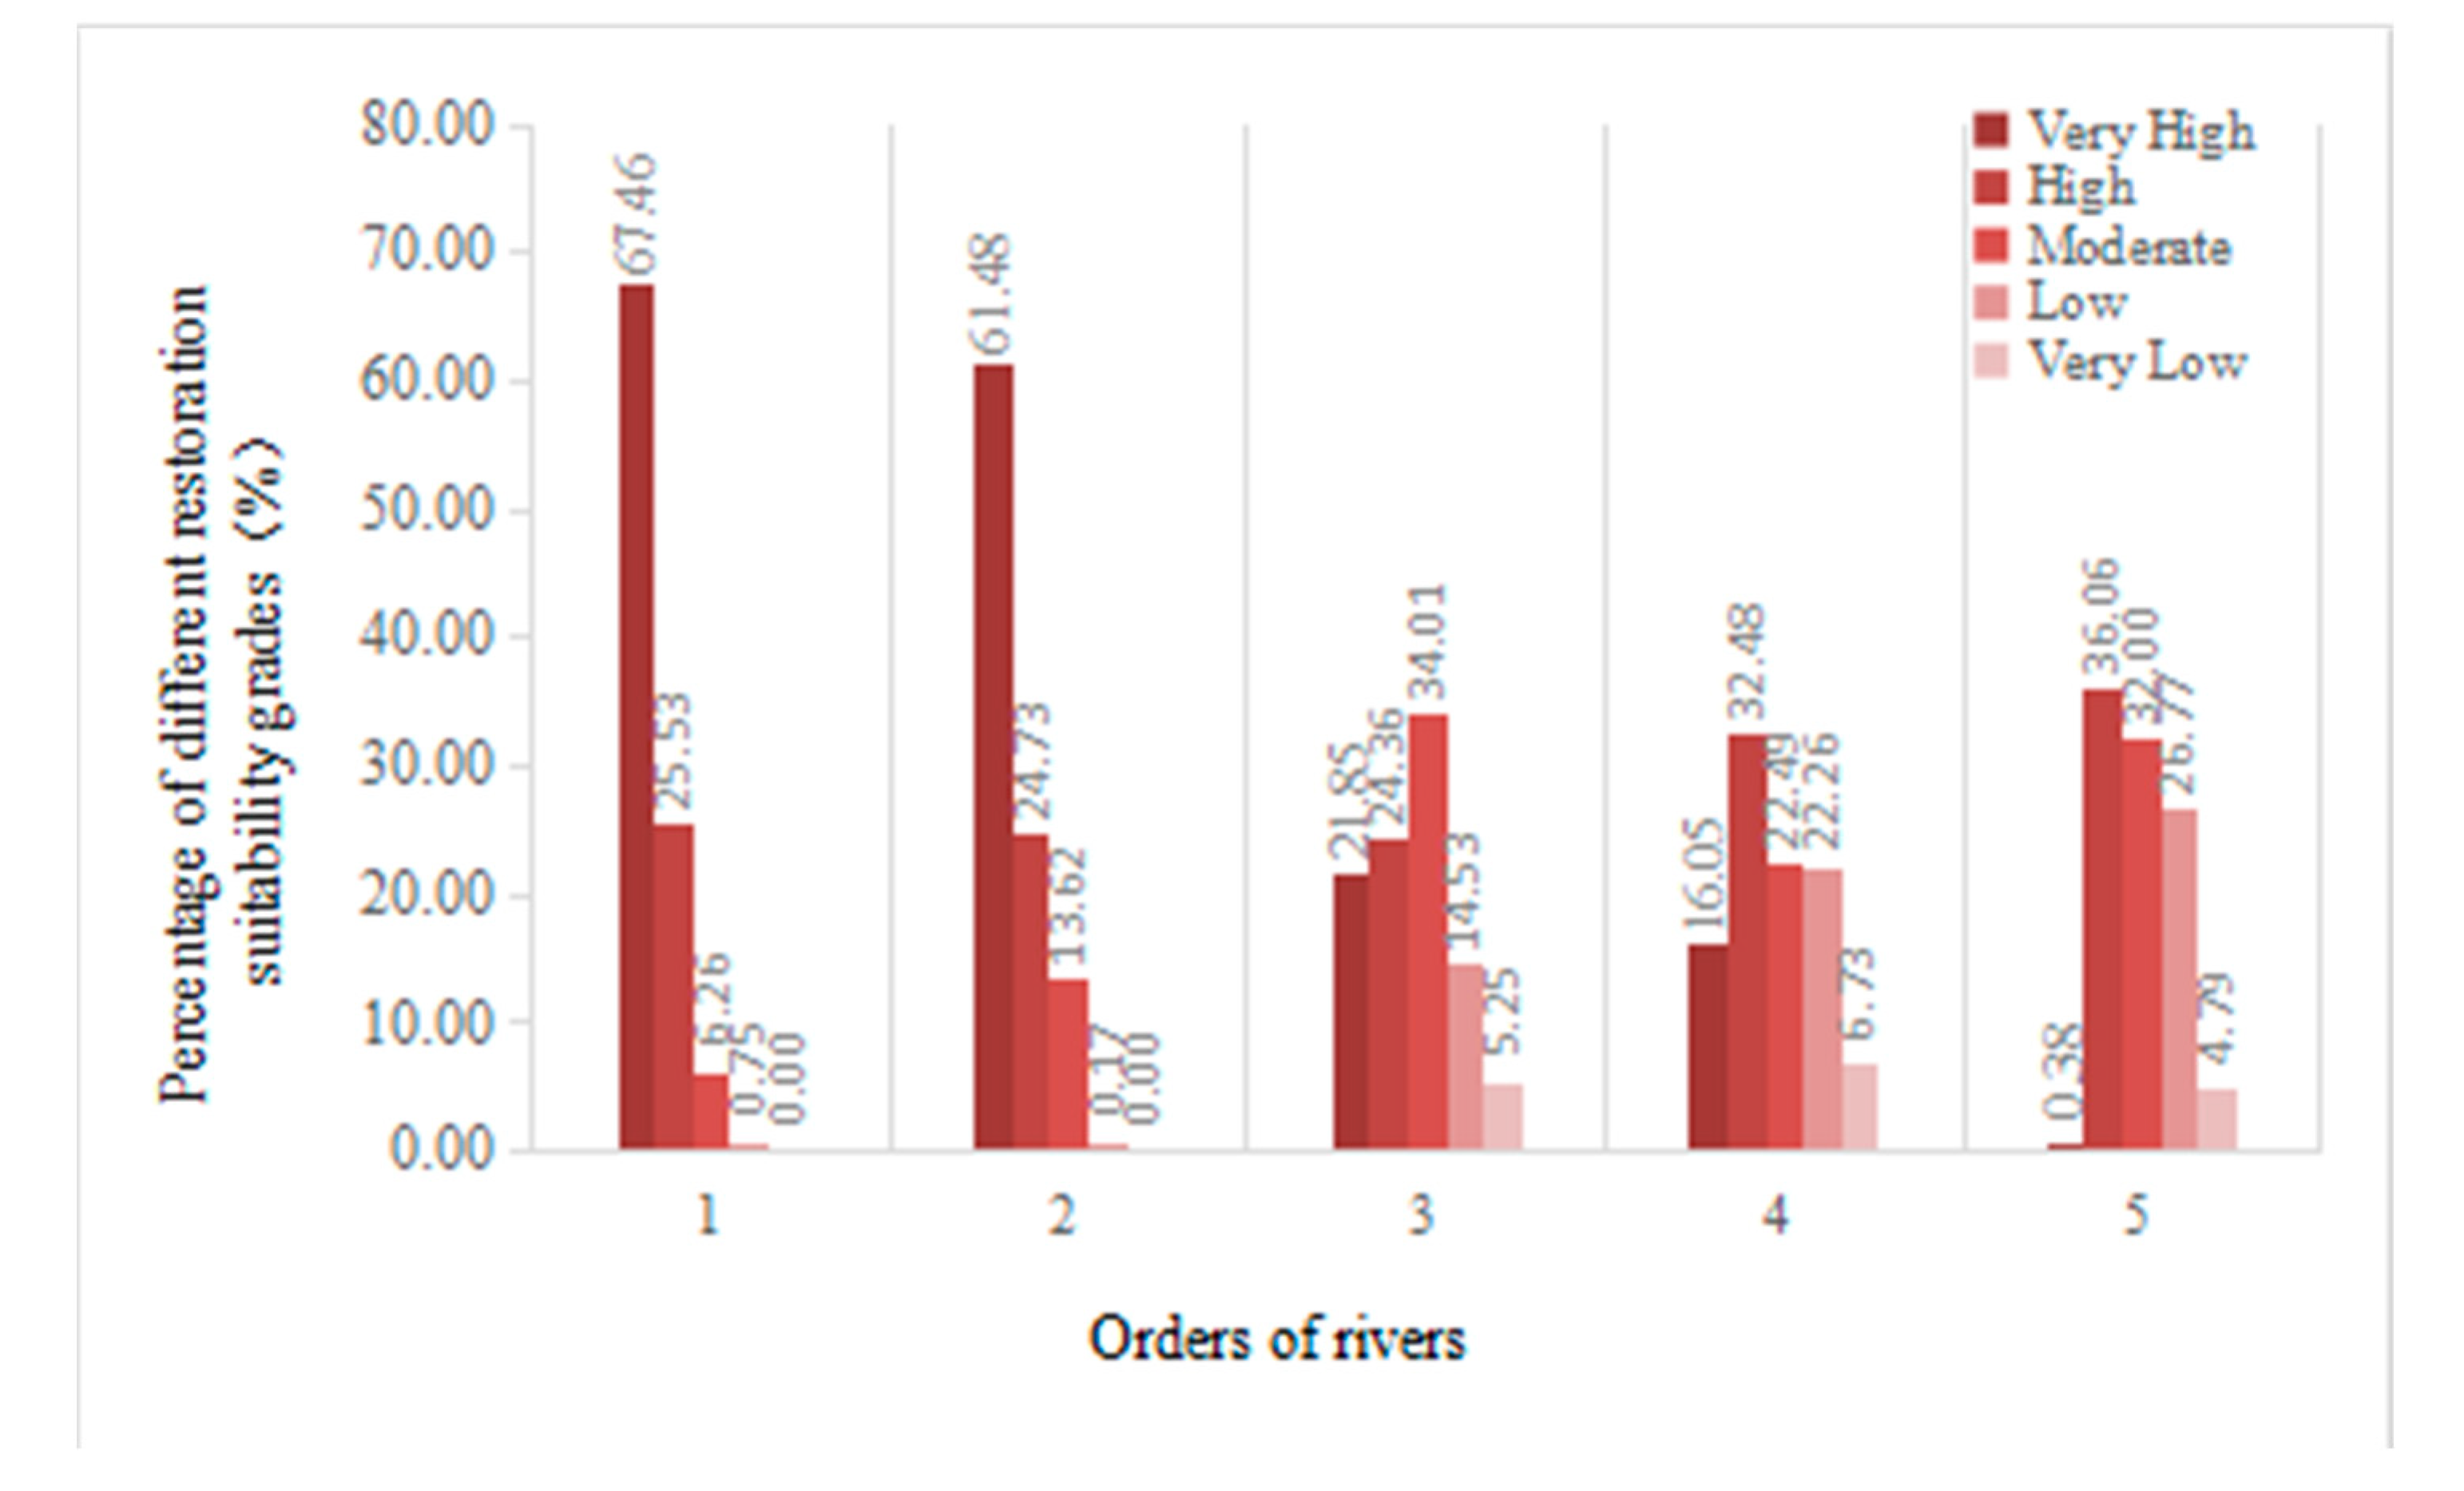
3.3. Relationship between Wetland Restoration Suitability and Stream Order
3.4. Relationship between Wetland Restoration Suitability and River Buffer Distance
4. Discussion
4.1. Determining the Weight of Wetland Restoration Suitability Indicators
4.2. Spatial Distribution of Wetland Restoration Suitability
4.3. Relationship between Wetland Restoration Suitability and Stream Order
4.4. Relationship between Wetland Restoration Suitability and River Buffer Distance
5. Conclusions
Author Contributions
Funding
Institutional Review Board Statement
Informed Consent Statement
Acknowledgments
Conflicts of Interest
References
- Ayyam, V.; Palanivel, S.; Chandrakasa, S. Coastal Wetlands: Status and Strategies for Development. In Coastal Ecosystems of the Tropics—Adaptive Management; Springer: Singapore, 2019; pp. 107–135. [Google Scholar]
- Clarkson, B.R.; Ausseil, A.G.E.; Gerbeaux, P. Wetland Ecosystem Services. In Ecosystem Services in New Zealand: Conditions and Trends; Manaaki Whenua Press: Auckland, New Zealand, 2013; pp. 192–202. [Google Scholar]
- Zedler, J.B.; Kercher, S. Wetland resources: Status, trends, ecosystem services, and restorability. Annu. Rev. Environ. Resour. 2005, 30, 39–74. [Google Scholar] [CrossRef] [Green Version]
- Prigent, C.; Papa, F.; Aires, F.; Jiménez, C.; Rossow, W.B.; Matthews, E. Changes in land surface water dynamics since the 1990s and relation to population pressure. Geophys. Res. Lett. 2012, 39, L08403. [Google Scholar] [CrossRef] [Green Version]
- Young, T.P. Restoration ecology and conservation biology. Biol. Conserv. 2000, 92, 73–83. [Google Scholar] [CrossRef] [Green Version]
- Kumar, M.; Singh, R. Sewage water treatment with energy recovery using constructed wetland integrated with bioelectrochemical system. Environ. Sci. Water Res. Technol. 2020, 6, 795–808. [Google Scholar] [CrossRef]
- Bortolotti, L.E.; Vinebrooke, R.D.; Louis, V.S. Prairie wetland communities recover at different rates following hydrological restoration. Freshw. Biol. 2016, 61, 1874–1890. [Google Scholar] [CrossRef]
- Qu, Y.; Sun, G.Q.; Luo, C.Y.; Zeng, X.; Zhang, H.; Murray, N.J.; Xu, N. Identifying restoration priorities for wetlands based on historical distributions of biodiversity features and restoration suitability. J. Environ. Manag. 2019, 231, 1222–1231. [Google Scholar] [CrossRef]
- Verhoeven, J.T.A.; Arheimer, B.; Yin, C.; Hefting, M.M. Regional and global concerns over wetlands and water quality. Trends Ecol. Evol. 2006, 21, 96–103. [Google Scholar] [CrossRef]
- Zedler, J.B. Wetlands at your service: Reducing impacts of agriculture at the watershed scale. Front. Ecol. Environ. 2003, 1, 65–72. [Google Scholar] [CrossRef]
- Crumpton, W.G. Using wetlands for water quality improvement in agricultural watersheds; the importance of a watershed scale approach. Water Sci. Technol. 2001, 44, 559–564. [Google Scholar] [CrossRef]
- Dale, W.; Siobhan, F. Modeling the suitability of wetland restoration potential at the watershed scale. Orig. Res. Artic. Ecol. Eng. 2005, 24, 359–377. [Google Scholar]
- Evelyn, U.; Andrew, H.; Chris, T. Identifying Feasible Locations for Wetland Creation or Restoration in Catchments by Suitability Modelling Using Light Detection and Ranging (LiDAR) Digital Elevation Model (DEM). Water 2018, 10, 464. [Google Scholar]
- Dong, Z.Y.; Liu, D.W.; Wang, Z.M.; Ren, C.Y.; Tang, X.G.; Jia, M.M.; Wang, Y. Wetlands of priority restoration in Northeast China based on spatial analysis. Chin. J. Appl. Ecol. 2013, 24, 170–176. [Google Scholar]
- Wang, G.D.; Wang, M.; Lu, X.G.; Jiang, M. Effects of farming on the soil seed banks and wetland restoration potential in Sanjiang Plain, Northeastern China. Ecol. Eng. 2015, 77, 265–274. [Google Scholar] [CrossRef]
- Desta, H. Local perceptions of ecosystem services and human-induced degradation of lake ziway in the rift valley region of ethiopia. Ecol. Indic. 2021, 127, 107786. [Google Scholar] [CrossRef]
- Mind’Je, R.; Mindje, M.; Kayumba, P.M. The influence of anthropogenic activities on wetland integrity dynamics: A case study of the Rwampara wetland in Rwanda. Environ. Sustain. 2021, 4, 833–849. [Google Scholar] [CrossRef]
- Du, B.; Zheng, Y.; Liu, J.; Mao, D. Threatened Plants in China’s Sanjiang Plain: Hotspot Distributions and Gap Analysis. Sustainability 2018, 10, 194. [Google Scholar] [CrossRef] [Green Version]
- Liu, Z.M.; Xia, G.L.; Lv, X.G.; Chen, Z.K. Response of water cycle processes in Sanjiang Plain to human activities and climate change in recent 50 years. South-North Water Divers. Water Sci. Technol. 2011, 9, 68–74. [Google Scholar] [CrossRef]
- Liu, J.P.; Gao, J.; Dong, C.Y. Regional differentiation and factors influencing changes in swamps in the Sanjiang Plain from 1954 to 2015. Acta Ecol. Sin. 2019, 39, 4821–4831. [Google Scholar]
- Chen, H.; Zhang, W.C.; Gao, H.R.; Nie, N. Climate Change and Anthropogenic Impacts on Wetland and Agriculture in the Songnen and Sanjiang Plain, Northeast China. Remote Sens. 2018, 10, 356. [Google Scholar] [CrossRef] [Green Version]
- Man, W.D.; Liu, M.Y.; Li, X.Y.; Wang, Z.M.; Jia, M.M.; Li, X.; Mao, D.H.; Ren, C.Y.; Ouyang, L. Assessment on the dynamics of eco-environmental statuses from 1990 to 2015 in the ecological function zone of Sanjiang Plain. J. Arid Land Resour. Environ. 2018, 32, 136–141. [Google Scholar]
- Guo, Z.X.; Wang, Z.M.; Song, K.S.; Liu, D.W.; Zhang, B. Spatial Features of Productivity Variability of Marsh in the Sanjiang Plain. Wetl. Sci. 2008, 6, 372–378. [Google Scholar]
- Qu, Y.; Luo, C.Y.; Zhang, H.Q.; Ni, H.W.; Xu, N. Modeling the wetland restorability based on natural and anthropogenic impacts in Sanjiang Plain, China. Ecol. Indic. 2018, 91, 429–438. [Google Scholar] [CrossRef]
- Ouyang, N.L.; Lu, S.L.; Wu, B.F.; Zhu, J.J.; Wang, H. Wetland restoration potential estimation at the watershed scale—A case study in upstream of the Yongdinghe River. Wetl. Sci. 2012, 10, 74–79. [Google Scholar]
- Hatvany, M.G. Wetlands and Reclamation. In International Encyclopedia of Human Geography; Elsevier: Amsterdam, The Netherlands, 2009; pp. 241–246. [Google Scholar]
- Yang, W.H.; Liu, Y.B.; Cutlac, M.; Boxall, P.; Weber, M.; Bonnycastle, A.; Gabor, S. Integrated economic-hydrologic modeling for examining cost-effectiveness of wetland restoration scenarios in a canadian prairie watershed. Wetlands 2016, 36, 577–589. [Google Scholar] [CrossRef]
- Beven, K.J.; Kirkby, M.J. A physically based, variable contributing area model of basin hydrology. Hydrol. Sci. Bull. 1979, 24, 43–69. [Google Scholar] [CrossRef] [Green Version]
- Wang, Q.; Lu, C.; Li, F.Y.; Fan, Z.P. River habitat quality assessment based on principal component analysis and entropy weight in Qinghe River. Ecol. Sci. 2017, 36, 185–193. [Google Scholar]
- Martinez-Martinez, E.; Nejadhashemi, A.P.; Woznicki, S.A.; Adhikari, U.; Giri, S. Assessing the significance of wetland restoration scenarios on sediment mitigation plan. Ecol. Eng. 2015, 77, 103–113. [Google Scholar] [CrossRef]
- Richard, D.R.; Martha, C.R.; Mark, M.B.; Karl, F. Forested wetlands of low order streams in the inner coastal plain of North Carolina, USA. Wetlands 1998, 18, 365–378. [Google Scholar]
- Zhang, X.N.; Yang, X.D.; Li, Y.; He, X.M.; Lv, G.H.; Yang, J.J. Influence of edaphic factors on plant distribution and diversity in the arid area of Xinjiang, Northwest China. Arid Land Res. Manag. 2018, 32, 38–56. [Google Scholar] [CrossRef]
- Sarker, S.K.; Kominoski, J.S.; Gaiser, E.E.; Scinto, L.J.; Rudnick, D.T. Quantifying effects of increased hydroperiod on wetland nutrient concentrations during early phases of freshwater restoration of the florida everglades. Restor. Ecol. 2020, 28, 1561–1573. [Google Scholar] [CrossRef]
- Li, H.; Fan, Y.; Gong, Z.; Zhou, D. Water accessibility assessment of freshwater wetlands in the yellow river delta national nature reserve, China. Ecohydrol. Hydrobiol. 2019, 20, 21–30. [Google Scholar] [CrossRef]
- DeLaney, T.A. Benefits to downstream flood attenuation and water quality as a result of constructed wetlands in agricultural landscapes. J. Soil Water Conserv. 1995, 50, 620–626. [Google Scholar]
- Darwiche-Criado, N.; Comín, F.A.; Masip, A.; García, M.; Eismann, S.G.; Sorando, R. Effects of wetland restoration on nitrate removal in an irrigated agricultural area: The role of in-stream and off-stream wetlands. Ecol. Eng. 2017, 103, 426–435. [Google Scholar] [CrossRef]
- Li, Y.; Boswell, E.; Thompson, A. Correlations between land use and stream nitrate-nitrite concentrations in the yahara river watershed in south-central wisconsin. J. Environ. Manag. 2021, 278 Pt 2, 111535. [Google Scholar] [CrossRef]
- Echavarría-Caballero, C.; Domínguez-Gómez, J.A.; González-García, C.; García-García, M.J. Assessment of Landsat 5 Images Atmospherically Corrected with LEDAPS in Water Quality Time Series. Can. J. Remote Sens. 2019, 45, 691–706. [Google Scholar] [CrossRef]
- Amani, M.; Salehi, B.; Mahdavi, S.; Masjedi, A.; Dehnavi, S. Temperature-vegetation-soil moisture dryness index (TVMDI). Remote Sens. Environ. 2017, 197, 1–14. [Google Scholar] [CrossRef]
- Clarke, E.; Baldwin, A.H. Responses of wetland plant to ammonia and water level. Ecol. Eng. 2002, 18, 257–264. [Google Scholar] [CrossRef]


| Main Factors | Sub-Factors | Weights of Factors |
|---|---|---|
| Natural factors |
| 0.0509 |
| 0.2304 | |
| 0.0872 | |
| 0.3063 | |
| Human factors |
| 0.0876 |
| 0.0819 | |
| 0.0017 | |
| 0.1539 |
| Levels | Descriptions | Area (km2) | Percentage of the Total Area (%) |
|---|---|---|---|
| RSI 5 | Very high restoration suitability | 11,044 | 10.34 |
| RSI 4 | High restoration suitability | 22,077 | 20.68 |
| RSI 3 | Moderate restoration suitability | 18,764 | 17.57 |
| RSI 2 | Low restoration suitability | 12,301 | 11.52 |
| RSI 1 | Very low restoration suitability | 2908 | 2.72 |
| Forests | No need for wetland restoration | 39,685 | 37.17 |
Publisher’s Note: MDPI stays neutral with regard to jurisdictional claims in published maps and institutional affiliations. |
© 2022 by the authors. Licensee MDPI, Basel, Switzerland. This article is an open access article distributed under the terms and conditions of the Creative Commons Attribution (CC BY) license (https://creativecommons.org/licenses/by/4.0/).
Share and Cite
Xu, N.; Li, H.; Luo, C.; Zhang, H.; Qu, Y. Exploring Spatial Relationship between Restoration Suitability and Rivers for Sustainable Wetland Utilization. Int. J. Environ. Res. Public Health 2022, 19, 8083. https://doi.org/10.3390/ijerph19138083
Xu N, Li H, Luo C, Zhang H, Qu Y. Exploring Spatial Relationship between Restoration Suitability and Rivers for Sustainable Wetland Utilization. International Journal of Environmental Research and Public Health. 2022; 19(13):8083. https://doi.org/10.3390/ijerph19138083
Chicago/Turabian StyleXu, Nan, Haiyan Li, Chunyu Luo, Hongqiang Zhang, and Yi Qu. 2022. "Exploring Spatial Relationship between Restoration Suitability and Rivers for Sustainable Wetland Utilization" International Journal of Environmental Research and Public Health 19, no. 13: 8083. https://doi.org/10.3390/ijerph19138083
APA StyleXu, N., Li, H., Luo, C., Zhang, H., & Qu, Y. (2022). Exploring Spatial Relationship between Restoration Suitability and Rivers for Sustainable Wetland Utilization. International Journal of Environmental Research and Public Health, 19(13), 8083. https://doi.org/10.3390/ijerph19138083