
Can Nuclear Power Products Mitigate Greenhouse Gas Emissions? Evidence from Global Trade Network

Abstract
:1. Introduction
2. Literature Review
2.1. The Impact of Nuclear Power on GHG Emissions
2.2. The Impact of International Trade on GHG Emissions
3. Materials and Methods
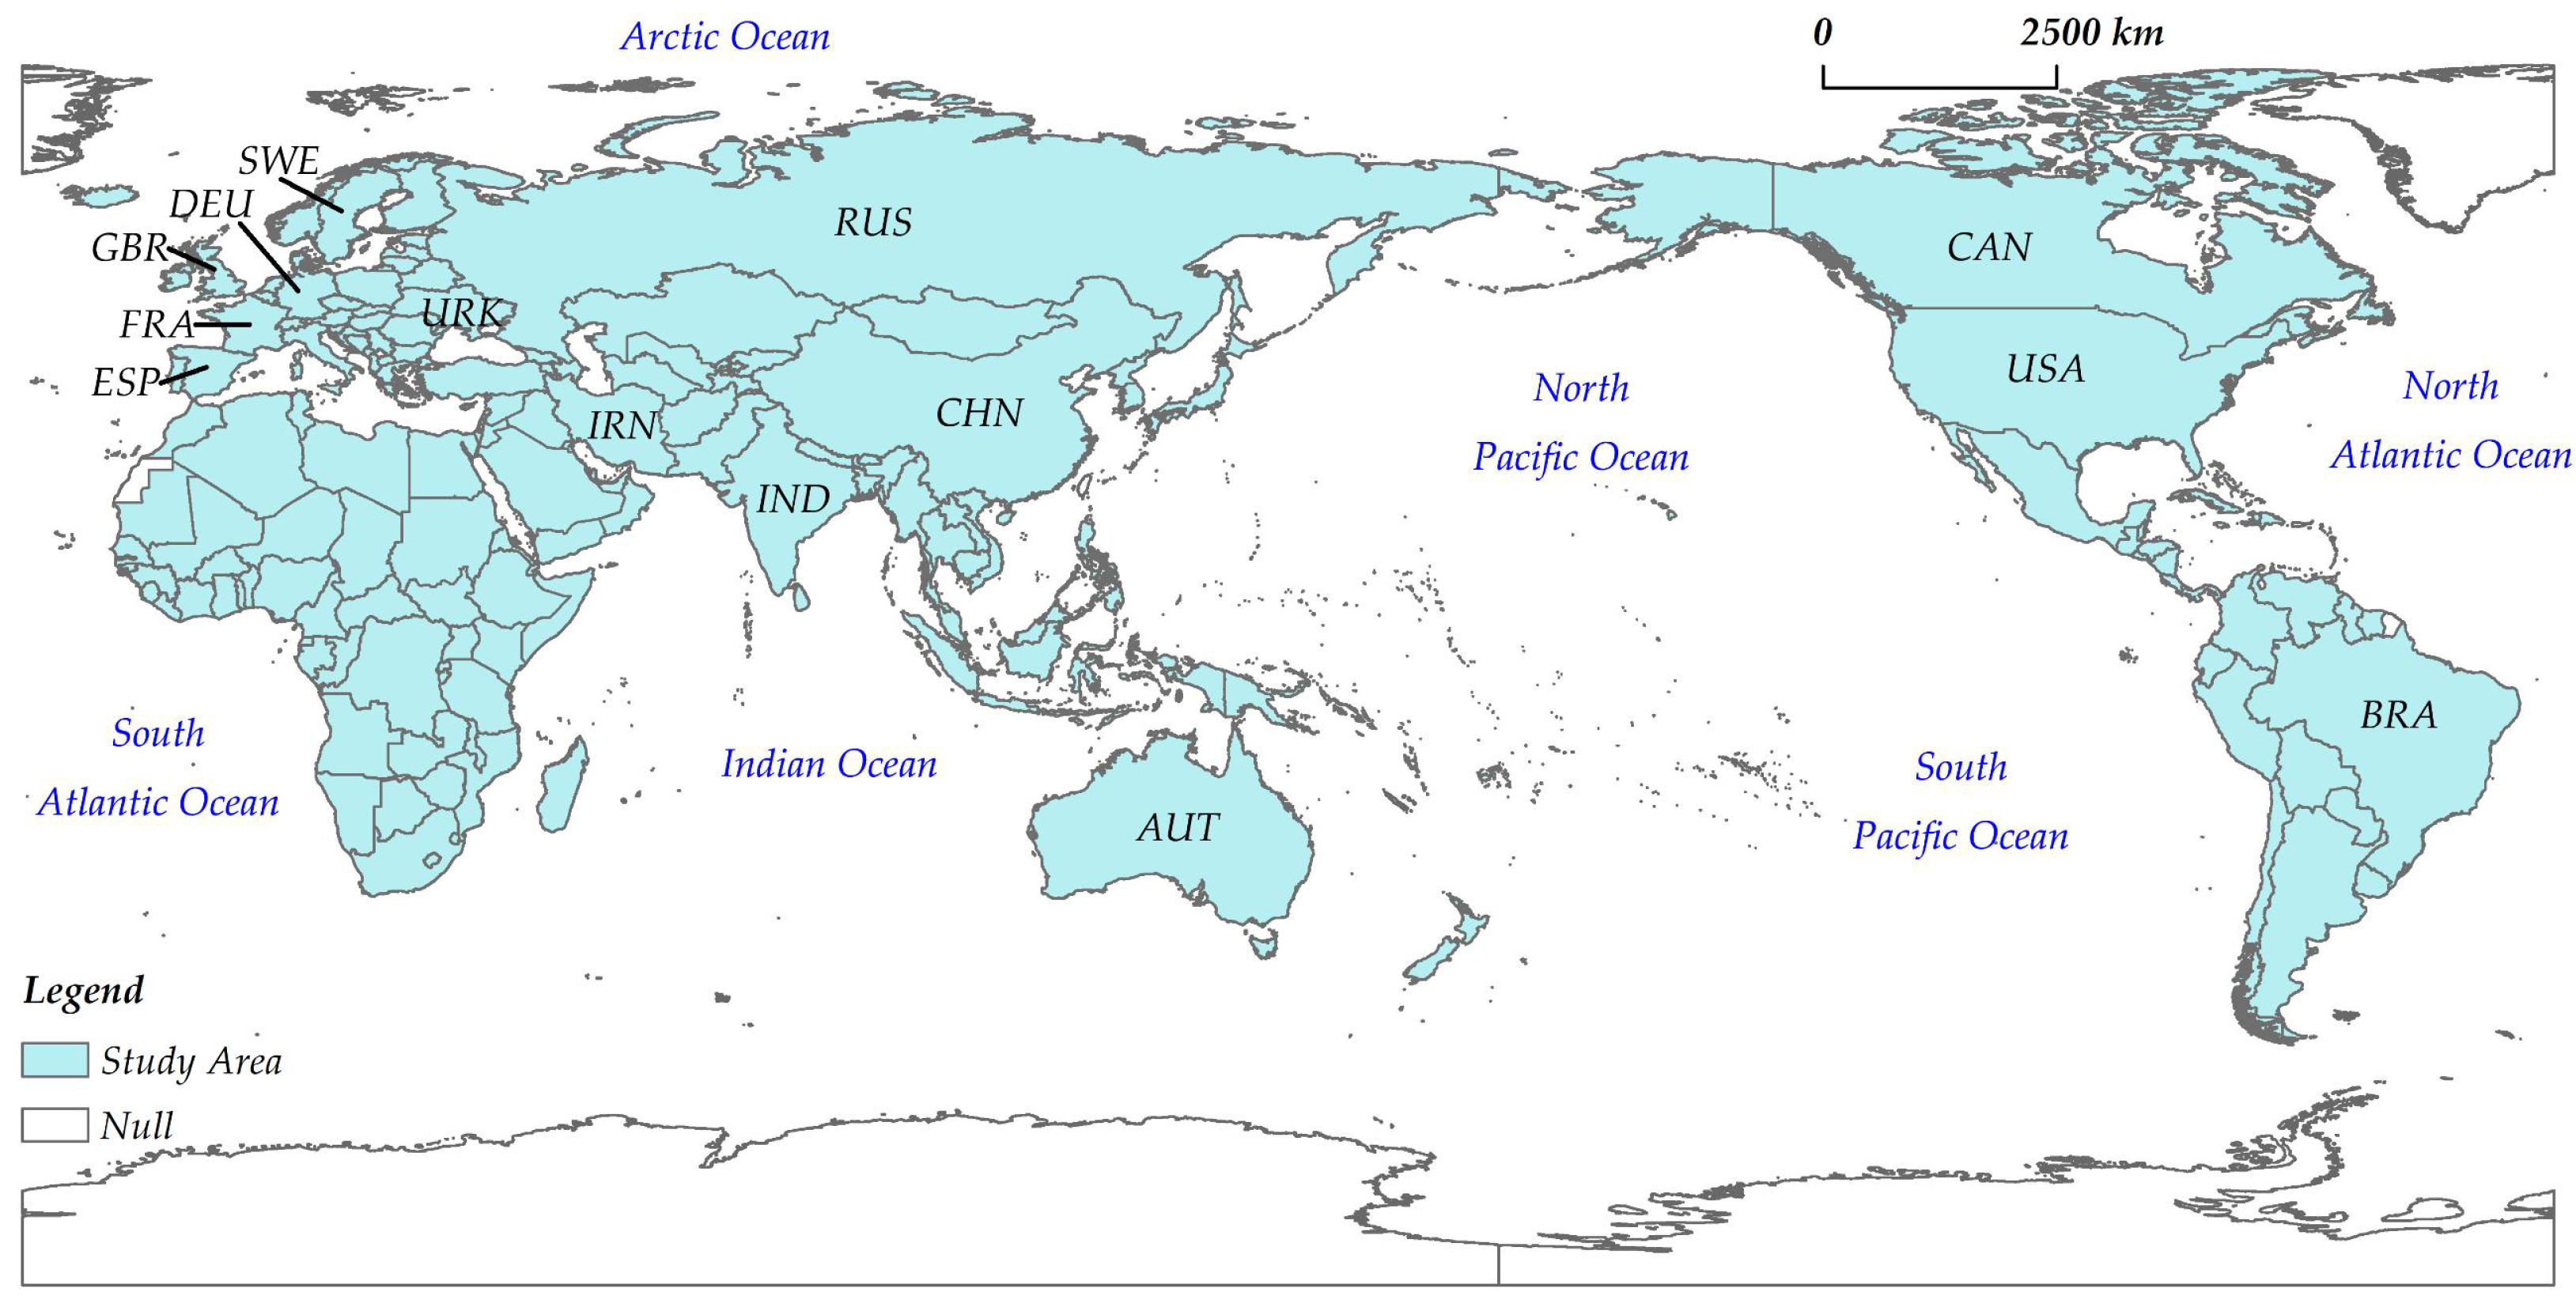
3.1. Data Source and Study Area
3.2. Construction of Trade Networks
3.2.1. Network Node Attribute
3.2.2. Network Overall Attribute
3.2.3. Network Hierarchical Structure Decision Model
3.3. Standard Deviation Elliptic Model
3.4. Variables and Empirical Model
4. Empirical Results and Analysis
4.1. Evidence from Spatio-Temporal Analysis
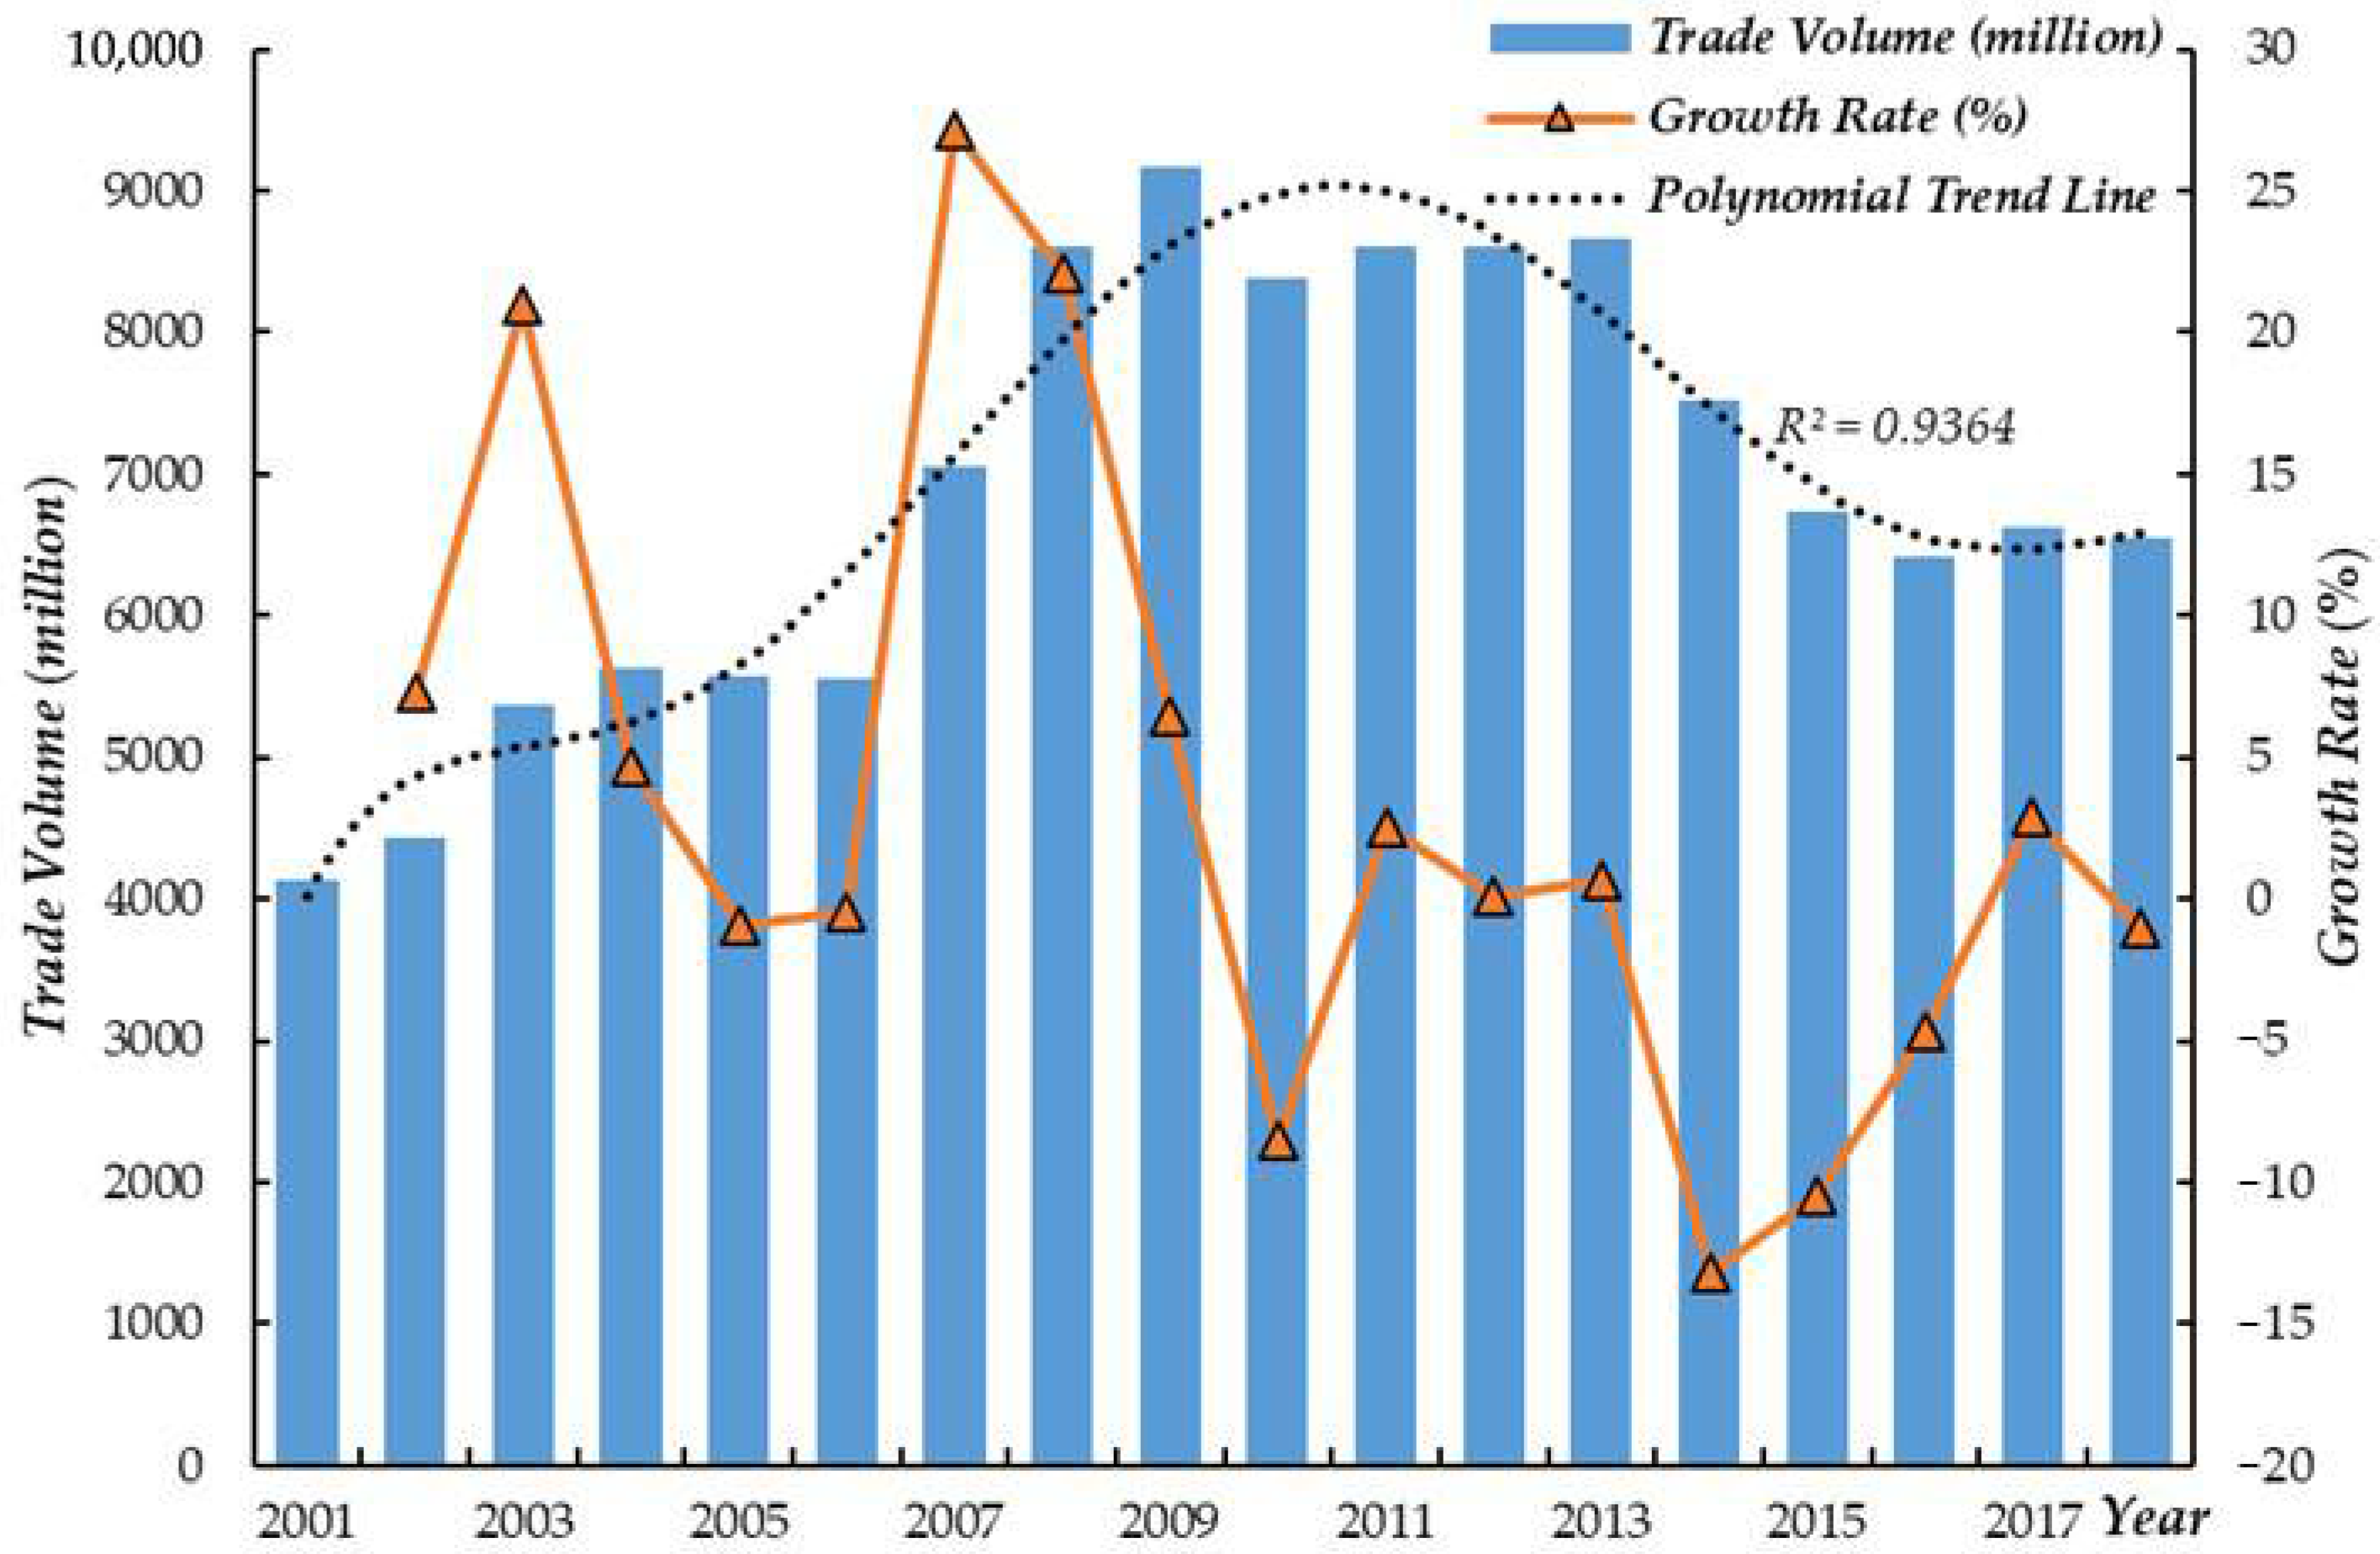
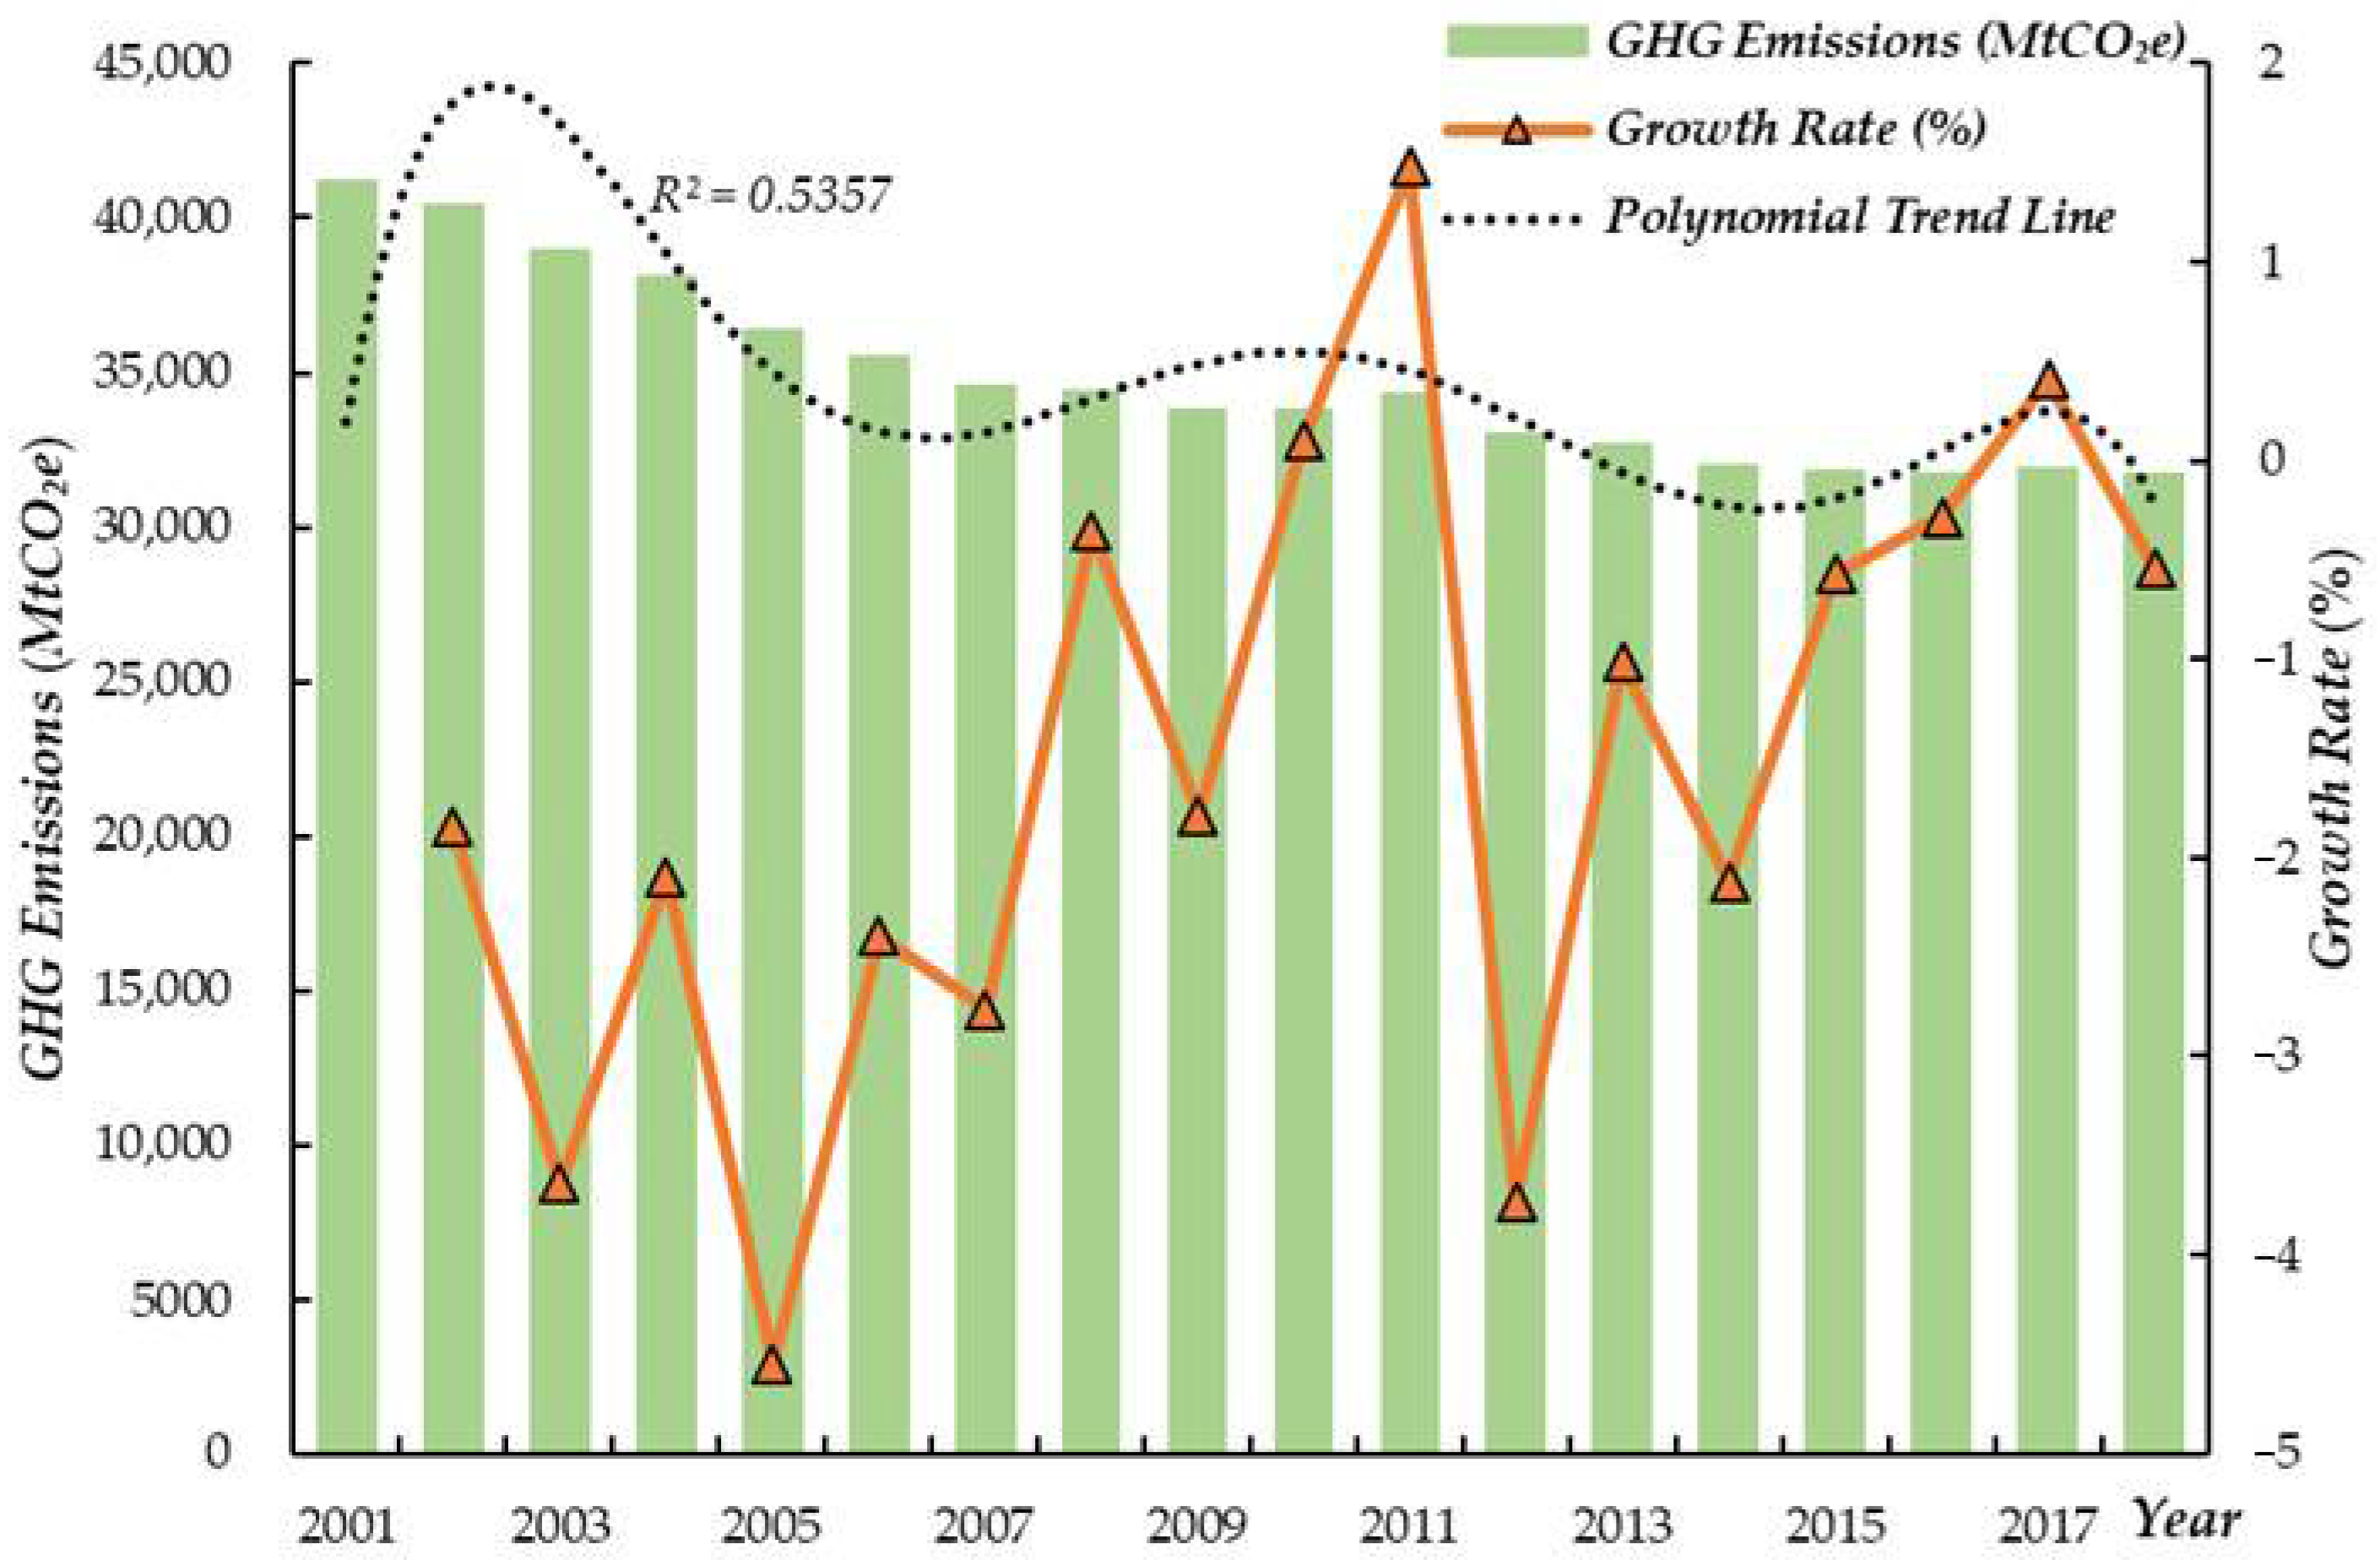
4.1.1. Temporal Change
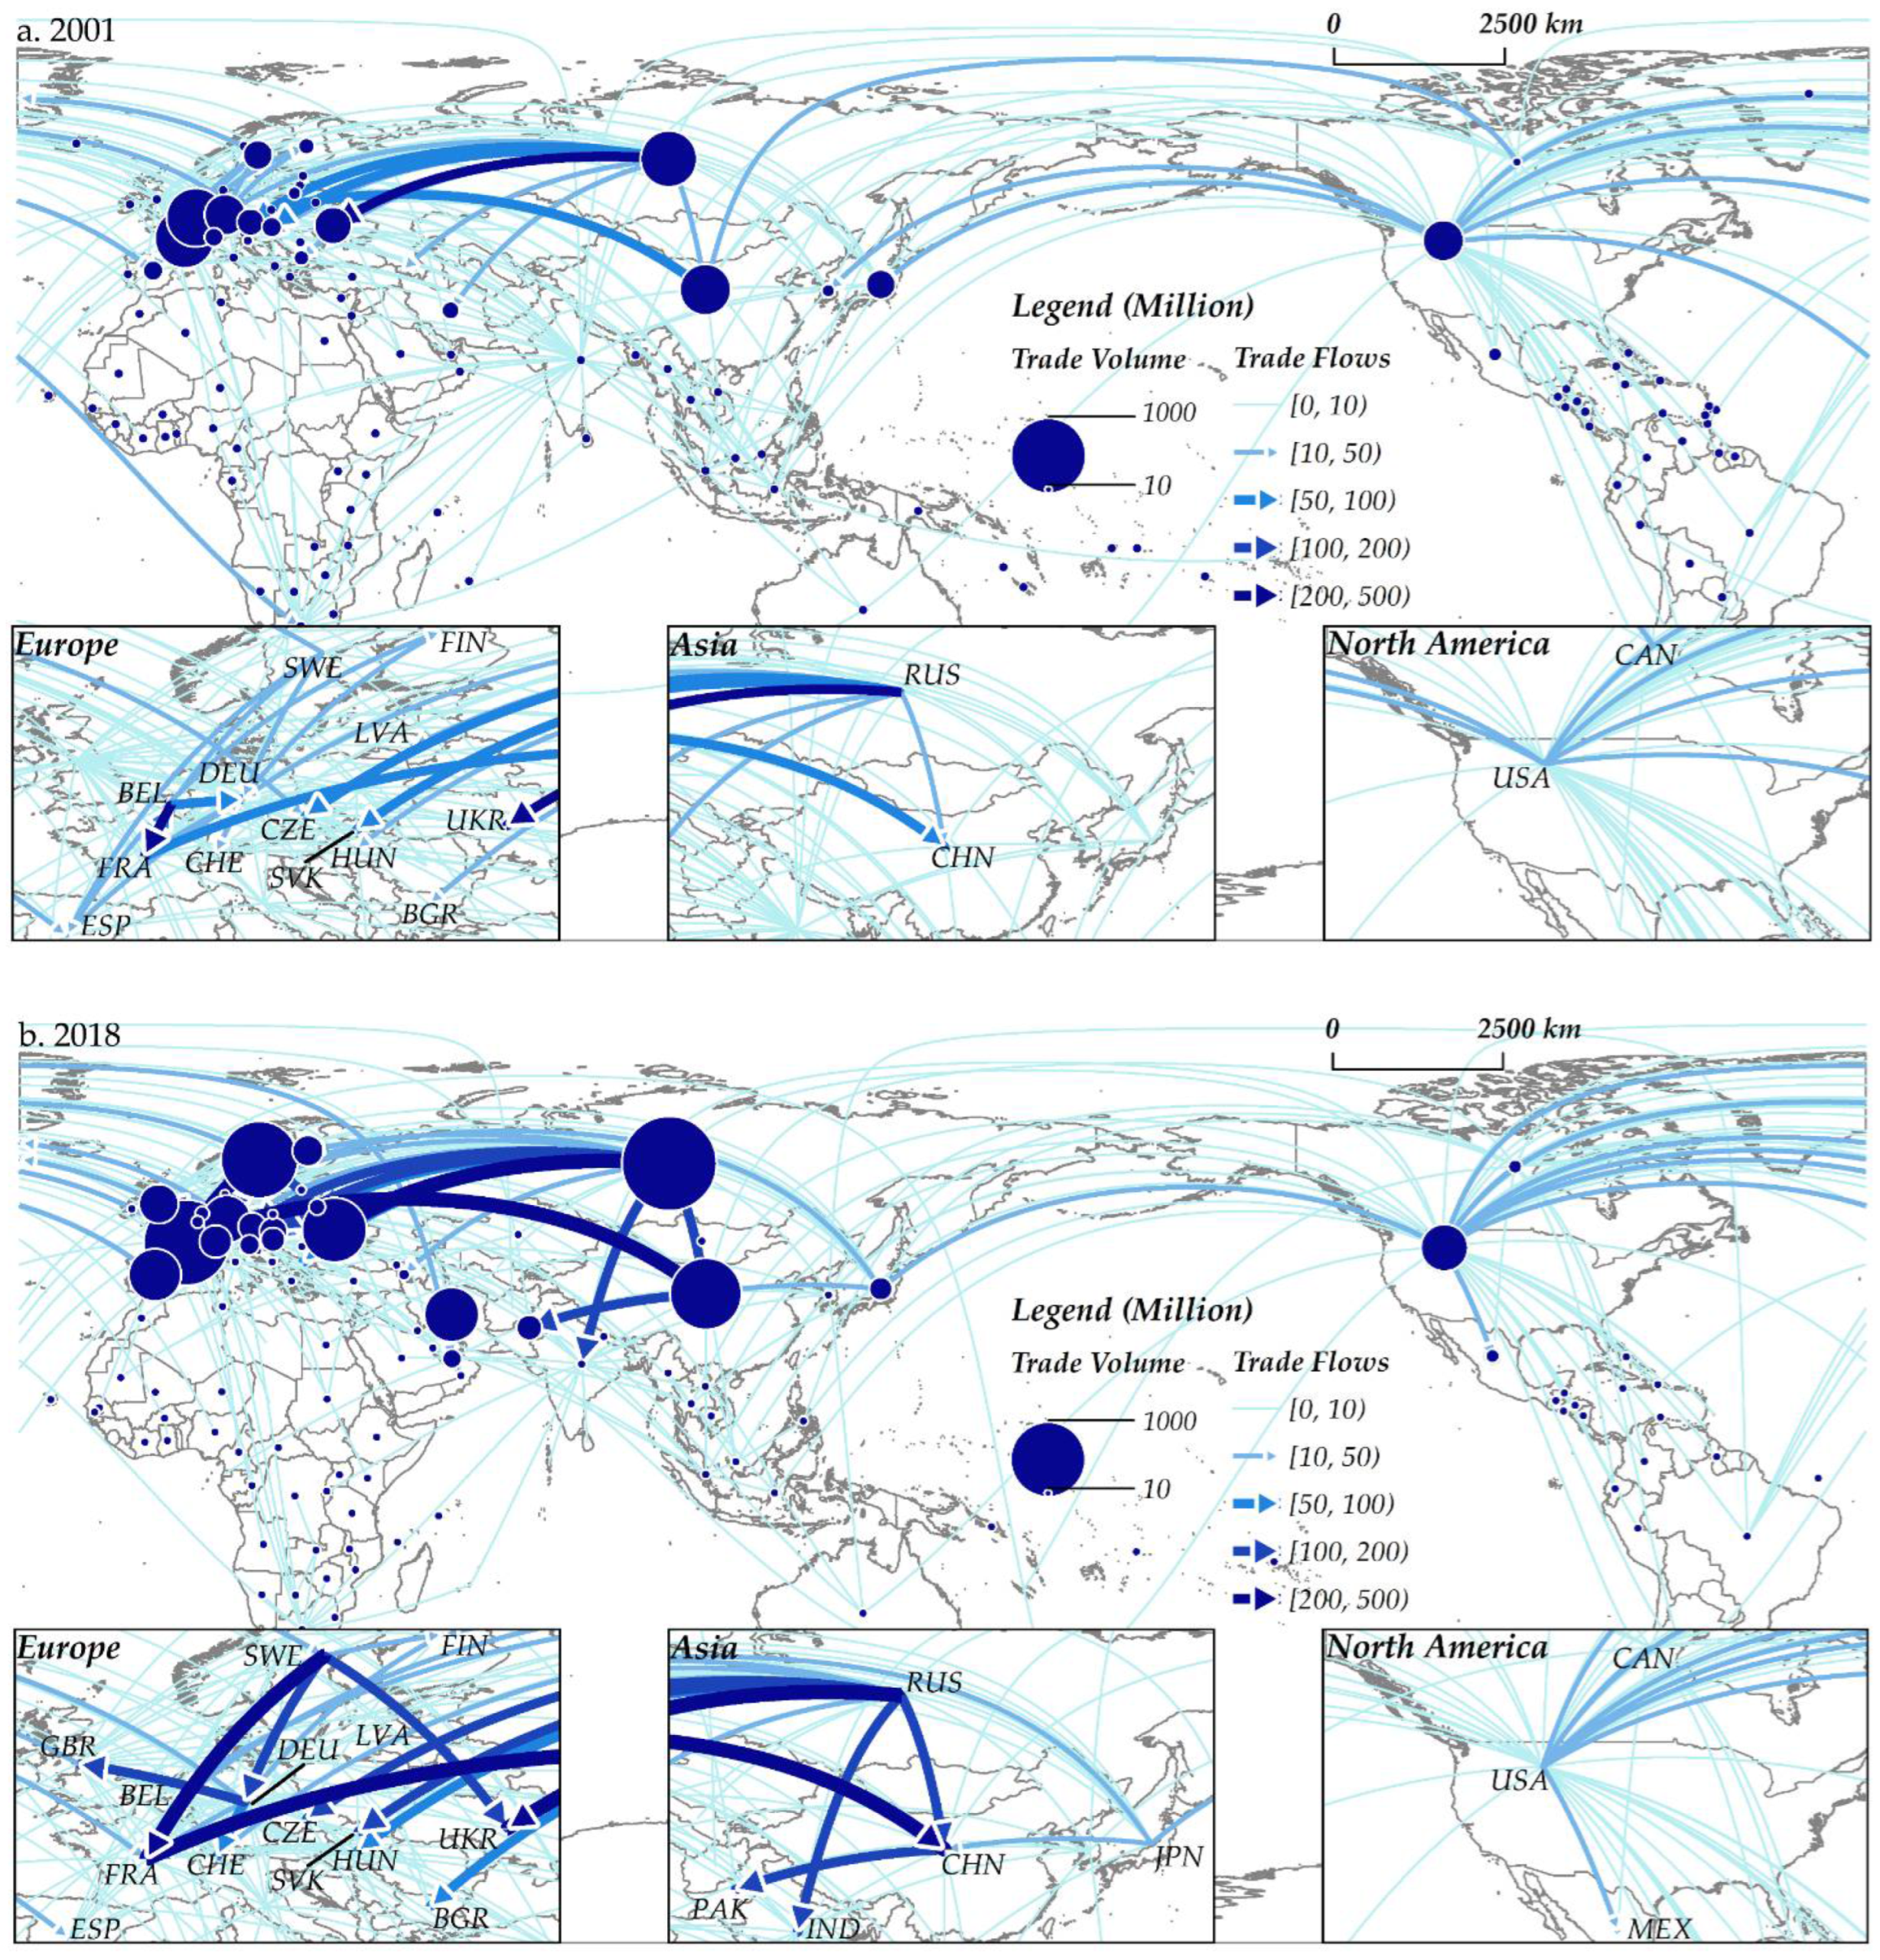
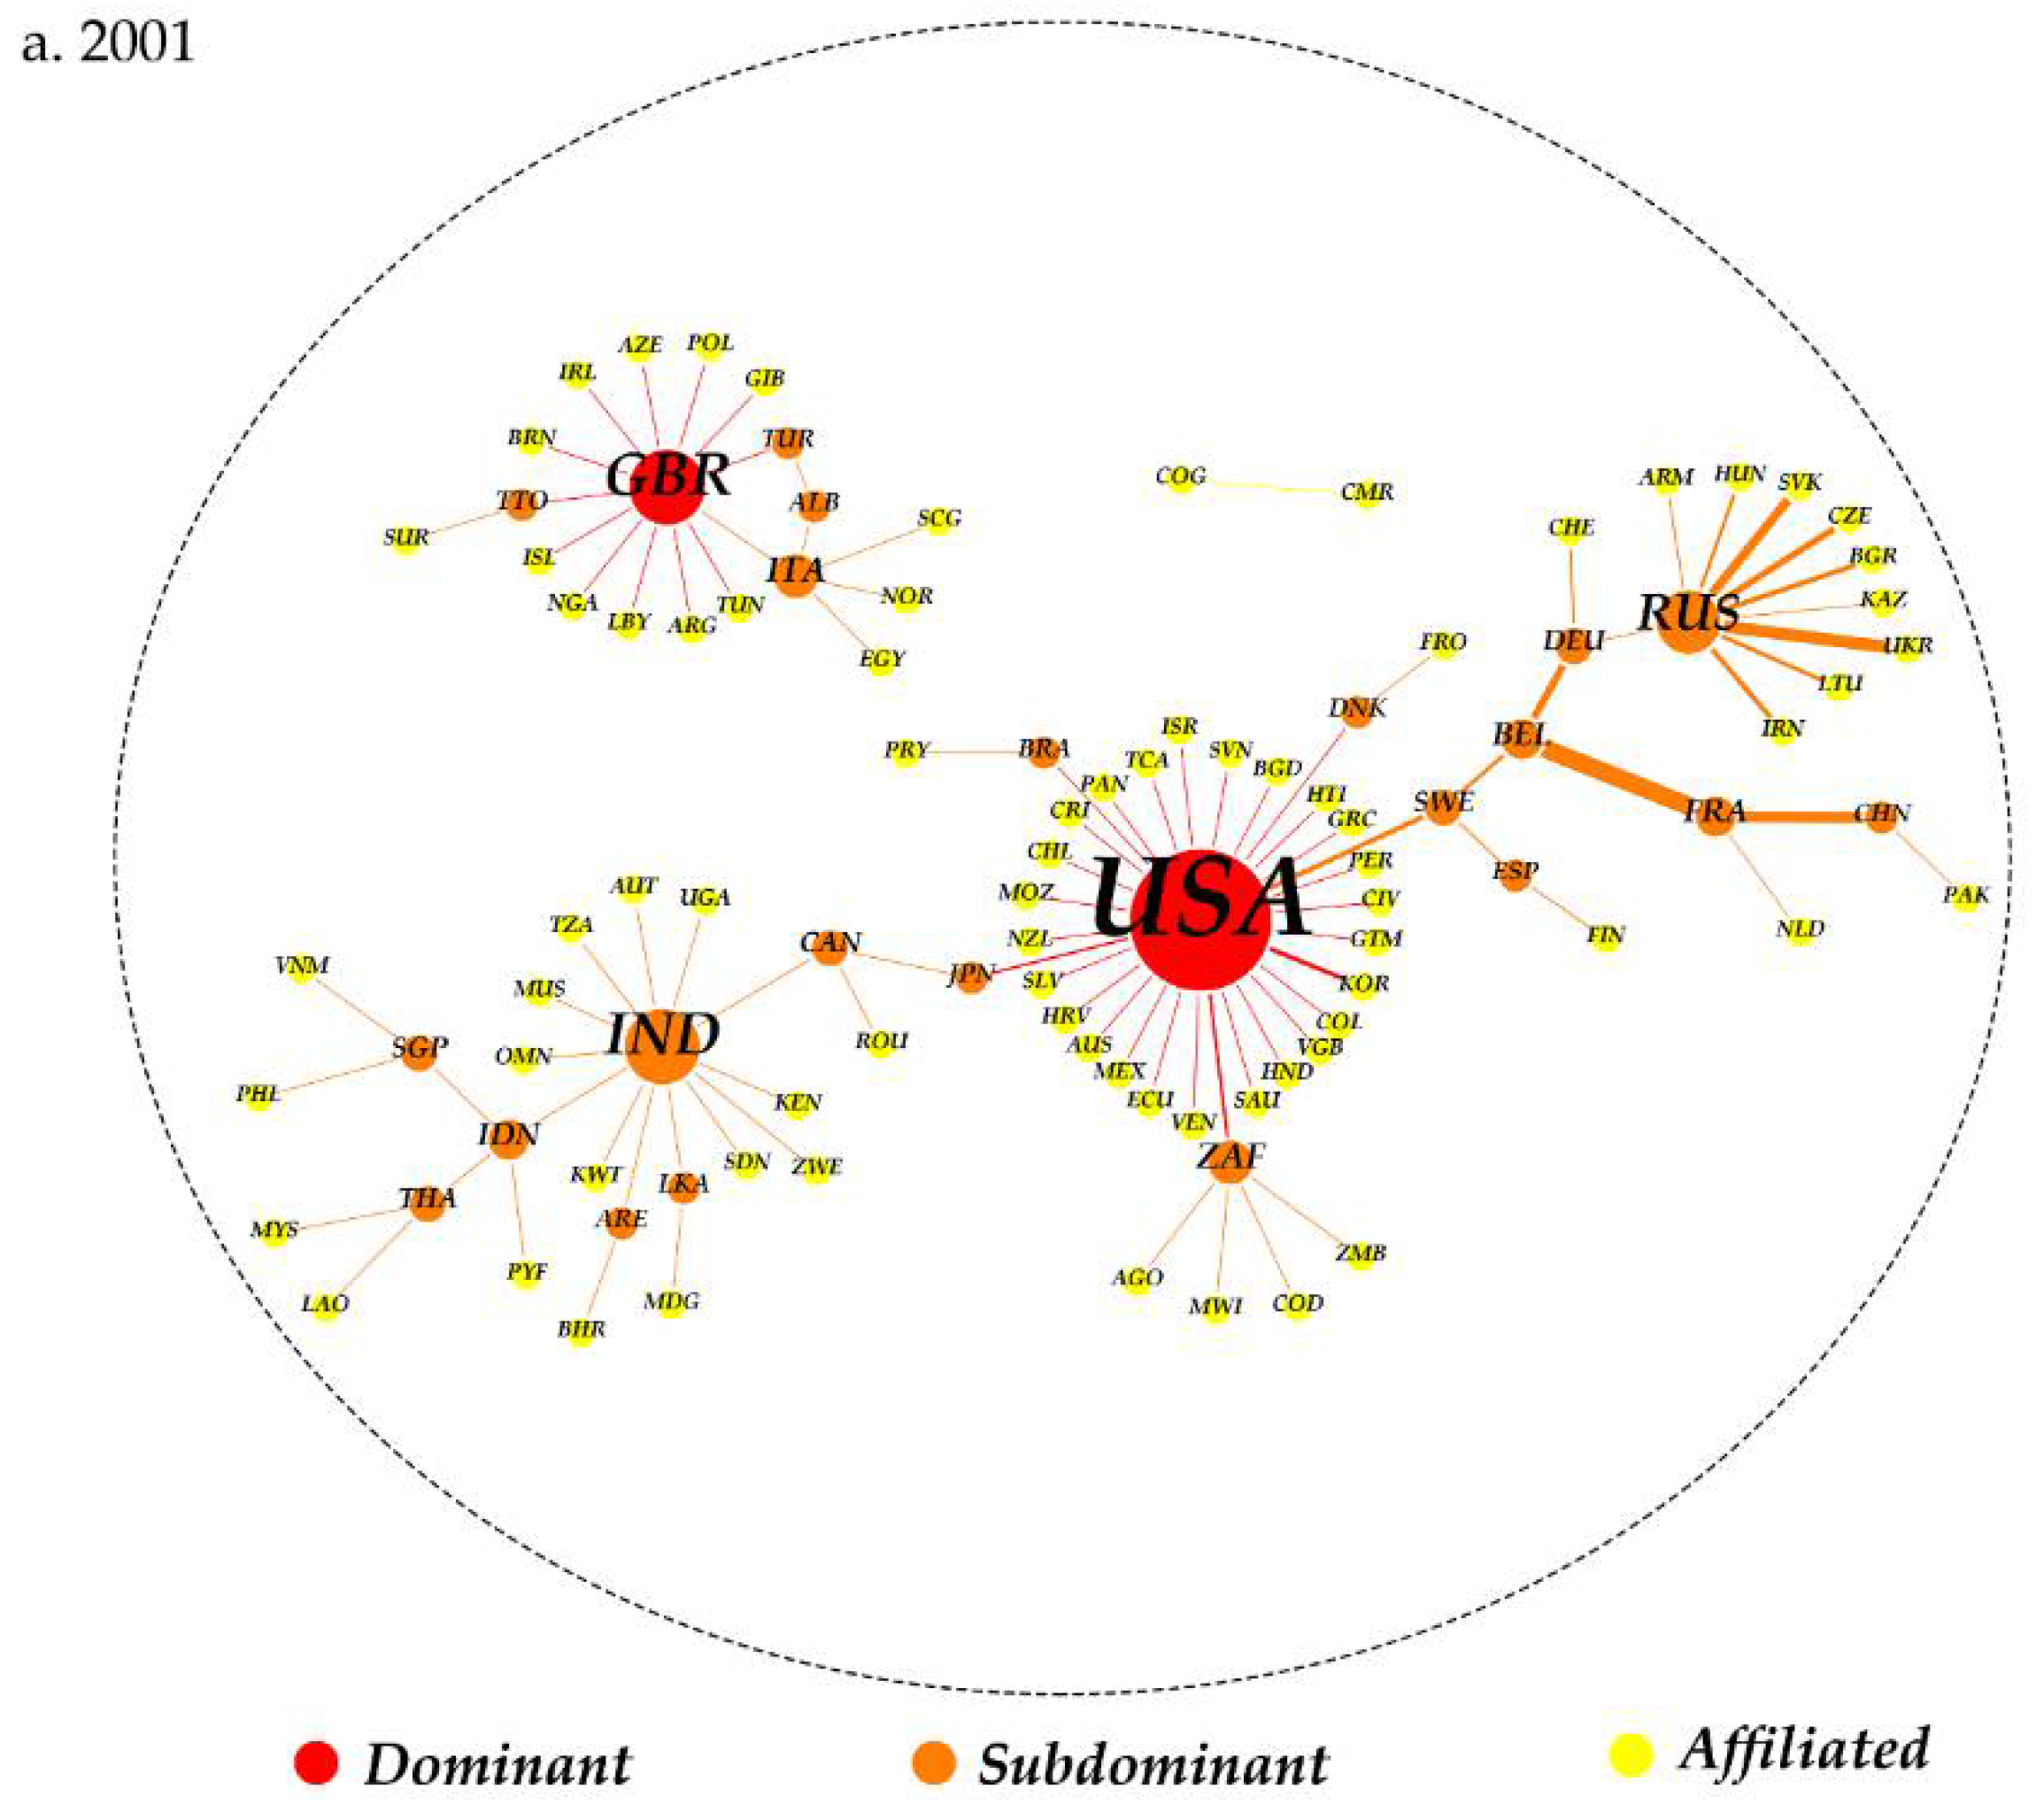
4.1.2. Spatial Evolution
4.2. Evidence from Regression Analysis
4.2.1. Results Estimating the Impact of GNT on GHG Emissions
4.2.2. Results Estimating the Impact of GNT Networks on GHG Emissions
4.2.3. Robustness Test
5. Discussion
6. Conclusions
Author Contributions
Funding
Institutional Review Board Statement
Informed Consent Statement
Data Availability Statement
Conflicts of Interest
References
- Abbaspour, M.; Monavari, M.; Karbassi, A.R.; Kargari, N. Nuclear Power and Its Role in CO2 Emissions from the Electricity Generation Sector in Iran. Energy Sources Part A 2012, 34, 43–52. [Google Scholar] [CrossRef]
- Weisser, D.; Howells, M.; Rogner, H.H. Nuclear Power and Post-2012 Energy and Climate Change Policies. Environ. Sci. Policy 2008, 11, 467–477. [Google Scholar] [CrossRef]
- Verbruggen, A. Renewable and Nuclear Power: A Common Future? Energy Policy 2008, 36, 4036–4047. [Google Scholar] [CrossRef]
- Khan, D.; Ulucak, R. How Do Environmental Technologies Affect Green Growth? Evidence from BRICS Economies. Sci. Total Environ. 2020, 712, 136504. [Google Scholar]
- Saidi, K.; Ben Mbarek, M. Nuclear Energy, Renewable Energy, CO2 Emissions, and Economic Growth for Nine Developed Countries: Evidence from Panel Granger Causality Tests. Prog. Nucl. Energy 2016, 88, 364–374. [Google Scholar] [CrossRef]
- Luqman, M.; Ahmad, N.; Bakhsh, K. Nuclear Energy, Renewable Energy and Economic Growth in Pakistan: Evidence from Non-linear Autoregressive Distributed Lag Model. Renew. Energy 2019, 139, 1299–1309. [Google Scholar] [CrossRef]
- Hassan, S.T.; Danish; Khan, U.D.; Baloch, M.A.; Tarar, Z.H. Is Nuclear Energy a Better Alternative for Mitigating CO2 Emissions in BRICS Countries? An Empirical Analysis. Nucl. Eng. Technol. 2020, 52, 2969–2974. [Google Scholar] [CrossRef]
- Sarkodie, S.A.; Adam, S. Renewable Energy, Nuclear Energy, and Environmental Pollution: Accounting for Political Institutional Quality in South Africa. Sci. Total Environ. 2018, 643, 1590–1601. [Google Scholar] [CrossRef]
- Mensah, I.A.; Sun, M.; Gao, C.; Omari-Sasu, A.Y.; Zhu, D.; Ampimah, B.C.; Quarcoo, A. Analysis on the Nexus of Economic Growth, Fossil Fuel Energy Consumption, CO2 Emissions and Oil Price in Africa Based on a PMG Panel ARDL Approach. J. Clean. Prod. 2019, 228, 161–174. [Google Scholar] [CrossRef]
- Lau, L.S.; Choong, C.K.; Ng, C.F.; Liew, F.M.; Ching, S.L. Is Nuclear Energy Clean? Revisit of Environmental Kuznets Curve Hypothesis in OECD Countries. Econ. Model. 2019, 77, 12–20. [Google Scholar] [CrossRef]
- Mahmood, N.; Danish, N.; Wang, Z.; Zhang, B. The Role of Nuclear Energy in the Correction of Environmental Pollution: Evidence from Pakistan. Nucl. Eng. Technol. 2020, 52, 1327–1333. [Google Scholar] [CrossRef]
- Solarin, S.A.; Al-Mulali, U.; Musah, I.; Ozturk, I. Investigating the Pollution Haven Hypothesis in Ghana: An Empirical Investigation. Energy 2017, 124, 706–719. [Google Scholar] [CrossRef]
- Ben Jebli, M.; Ben Youssef, S.; Ozturk, I. Testing Environmental Kuznets Curve Hypothesis: The Role of Renewable and Non-renewable Energy Consumption and Trade in OECD Countries. Ecol. Indic. 2016, 60, 824–831. [Google Scholar] [CrossRef]
- Weisser, D. A Guide to Life-Cycle Greenhouse Gas (GHG) Emissions from Electric Supply Technologies. Energy 2007, 32, 1543–1559. [Google Scholar] [CrossRef]
- International Energy Agency. Energy Technology Perspectives. Scenarios and Strategies to 2050; IEA/OECD: Paris, France, 2006. [Google Scholar]
- IPCC. Climate Change 2007—Mitigation of Climate Change; Contribution of Working Group III to the Fourth Assessment Report of the IPCC; Cambridge University Press: Cambridge, UK, 2007. [Google Scholar]
- Florida, R. The World is Spiky. Atl. Mon. 2005, 296, 48–51. [Google Scholar]
- Feiock, R.C.; Moon, M.J.; Park, H.J. Is the World “Flat” or “Spiky”? Rethinking the Governance Implications of Globalization for Economic Development. Public Adm. Rev. 2010, 68, 24–35. [Google Scholar] [CrossRef]
- Metzger, N. Energy: The Continuing Crisis; Thomas, Y., Ed.; Crowell Company: New York, NY, USA, 1984. [Google Scholar]
- International Energy Agency. Key World Energy Statistics; IEA/OECD: Paris, France, 2019. [Google Scholar]
- Sovacool, B.K. Valuing the Greenhouse Gas Emissions from Nuclear Power: A Critical Survey. Energy Policy 2008, 36, 2940–2953. [Google Scholar] [CrossRef]
- Wiliarty, S.E. Nuclear Power in Germany and France. Policy 2013, 45, 281–296. [Google Scholar] [CrossRef]
- Andrews-Speed, P. The Governance of Civil Nuclear Power in France: Advantages and Disadvantages of Deep State Involvement. J. World Energy Law Bus. 2022, 15, 151–166. [Google Scholar] [CrossRef]
- Frankenbach, P.; Kruck, A.; Zangl, B. India’s Recognition as a Nuclear Power: A Case of Strategic Cooptation. Contemp. Secur. Policy 2021, 42, 530–533. [Google Scholar] [CrossRef]
- Hou, J.C.; Tan, Z.F.; Wang, J.H.; Xie, P.J. Government Policy and Future Projection for Nuclear Power in China. J. Energy Eng. 2011, 137, 151–158. [Google Scholar] [CrossRef]
- National Energy Policy Report; Report of the National Energy Policy Development Group: Washington, DC, USA, 2004.
- Szilard, R.; Planchon, P.; Busby, J. The Case for Extended Nuclear Reactor Operation. JOM 2009, 61, 24–27. [Google Scholar] [CrossRef]
- Environmental News Service. Greenpeace Co-Founded Says Nuclear Energy Is ‘Only Option’. 2007. Available online: https://www.independent.co.uk/voices/commentators/patrick-moore-nuclear-energy-yes-please-436399.html (accessed on 15 February 2007).
- Areva. Carbon Disclosure Project: Greenhouse Gas Emissions. 2007. Available online: http://www.cdproject.net/download.asp?file=CDP4_Areva_AQ_France120.doc (accessed on 8 November 2007).
- DeLlano-Paz, F.; Calvo-Silvosa, A.; Antelo, S.; Soares, I. The European Low-Carbon Mix for 2030: The Role of Renewable Energy Sources in An Environmentally and Socially Efficient Approach. Renew. Sustain. Energy Rev. 2015, 48, 49–61. [Google Scholar] [CrossRef]
- Sims, R.; Rogner, H.; Gregory, K. Carbon Emission and Mitigation Cost Comparisons between Fossil Fuel, Nuclear and Renewable Energy Resources for Electricity Generation. Energy Policy 2003, 31, 1315–1326. [Google Scholar] [CrossRef]
- Ren, L.; Zhou, S.; Ou, X. Life-Cycle Energy Consumption and Greenhouse-Gas Emissions of Hydrogen Supply Chains for Fuel-Cell Vehicles in China. Energy 2020, 209, 118482. [Google Scholar] [CrossRef]
- Kampan, P.; Tanielian, A.R. Nuclear Power: Irreplaceable Before and After Fukushima. Int. J. Glob. Energy Issues 2016, 39, 394–412. [Google Scholar] [CrossRef]
- Joskow, P.; Parsons, J. The Future of Nuclear Power After Fukushima. Econ. Energy Environ. Policy 2012, 1, 37–39. [Google Scholar] [CrossRef] [Green Version]
- Markandya, A.; Wilkinson, P. Electricity Generation and Health. Energy Health 2007, 2, 979–990. [Google Scholar] [CrossRef]
- Adamantiades, A.A.; Kessides, I.K. Nuclear Power for Sustainable Development: Current Status and Future Prospects. Energy Policy 2009, 37, 5149–5166. [Google Scholar] [CrossRef]
- Nian, V.; Chou, S.K. The State of Nuclear Power Two Years After Fukushima—The ASEAN Perspective. Appl. Energy 2014, 136, 838–848. [Google Scholar] [CrossRef]
- Schaffer, M.B. Nuclear Power for Clean, Safe and Secure Energy Independence. Foresight 2007, 9, 47–60. [Google Scholar] [CrossRef]
- Baker, E.; Chon, H.; Keisler, J.M. Advanced Nuclear Power: Combining Economic Analysis with Expert Elicitations to Inform Climate Policy. Soc. Sci. Electron. Publ. 2009, 31, 37–49. [Google Scholar] [CrossRef] [Green Version]
- Hardy, C.; Higson, D.; Mcdonald, N. Nuclear Power Is Safer Than Most People Think. Eng. Aust. 2009, 81, 62. [Google Scholar]
- Beerten, J.; Laes, E.; Meskens, G.; D’haeseleer, W. Greenhouse Gas Emissions in the Nuclear Life Cycle: A Balance Appraisal. Energy Policy 2009, 37, 5056–5068. [Google Scholar] [CrossRef] [Green Version]
- Storm van Leeuwen, J.W.; Smith, P. Nuclear Power—The Energy Balance. 2005. Available online: http://www.stormsmith.nl (accessed on 1 January 2005).
- Lenzen, M. Life Cycle and Greenhouse Gas Emissions of Nuclear Energy: A Review. Energy Convers. Manag. 2008, 49, 2178–2199. [Google Scholar] [CrossRef]
- Integrated Sustainability Analysis. Life-Cycle Energy Balance and Greenhouse Gas Emissions of Nuclear Energy in Australia; University of Sydney: Sydney, Australia, 2006. [Google Scholar]
- Oxford Research Group. Too Hot to Handle? The Future of Civil Nuclear Power; University of Oxford: Oxford, UK, 2007. [Google Scholar]
- Oxford Research Group. Secure Energy? Civil Nuclear Power, Security, and Global Warming; University of Oxford: Oxford, UK, 2007. [Google Scholar]
- Maennel, A.; Kim, H.G. Comparison of Greenhouse Gas Reduction Potential through Renewable Energy Transition in South Korea and Germany. Energies 2018, 11, 206. [Google Scholar] [CrossRef] [Green Version]
- Buesseler, K.; Aoyama, M.; Fukasawa, M. Impacts of the Fukushima Nuclear Power Plants on Marine Radioactivity. Environ. Sci. Technol. 2011, 45, 9931–9935. [Google Scholar] [CrossRef]
- Kato, T.; Takahara, S.; Nishikawa, M.; Homma, T. A Case Study of Economic Incentives and Local Citizens’ Attitudes Toward Hosting a Nuclear Power Plant in Japan: Impacts of the Fukushima Accident. Energy Policy 2013, 59, 808–818. [Google Scholar] [CrossRef] [Green Version]
- Antweiler, W.; Copeland, B.R.; Taylor, M.S. Is Free Trade Good for the Environment? Am. Econ. Rev. 2001, 91, 877–908. [Google Scholar] [CrossRef] [Green Version]
- Magani, S. Trade Liberalization and the Environment: Carbon Dioxide for 1960–1999. Econ. Bull. 2004, 17, 1–5. [Google Scholar]
- Alpay, E.; Kerkvliet, B.J. Productivity Growth and Environmental Regulation in Mexican and U.S. Food Manufacturing. Am. J. Agric. Econ. 2002, 84, 887–901. [Google Scholar] [CrossRef]
- Kanemoto, K.; Lenzen, M.; Peters, G.P.; Moran, D.D.; Geschke, A. Frameworks for Comparing Emissions Associated with Production, Consumption, And International Trade. Environ. Sci. Technol. 2012, 46, 172–179. [Google Scholar] [CrossRef] [PubMed]
- Liu, Y.; Jayanthakumaran, K.J.; Neri, F. Who Is Responsible for the CO2 Emissions that China Produces? Energy Policy 2013, 62, 1412–1419. [Google Scholar] [CrossRef] [Green Version]
- Tian, X.; Sarkis, J.; Geng, Y.; Bleischwitz, R.; Qiang, Y.Y.; Xu, L.Q.; Wu, R. Examining the Role of BRICS Countries at the Global Economic and Environmental Resources Nexus. J. Environ. Manag. 2020, 262, 110330. [Google Scholar] [CrossRef]
- Zhong, Z.; Zhang, X.; Gao, W. Spatiotemporal Evolution of Global Greenhouse Gas Emissions Transferring via Trade: Influencing Factors and Policy Implications. Int. J. Environ. Res. Public Health 2020, 17, 5065. [Google Scholar] [CrossRef]
- Althouse, J.; Guarini, G.; Gabriel, P.J. Ecological Macroeconomics in the Open Economy: Sustainability, Unequal Exchange and Policy Coordination in a Center-Periphery Model. Ecol. Econ. 2020, 172, 106628. [Google Scholar] [CrossRef]
- Jayadevappa, R.; Chhatre, S. International Trade and Environmental Quality: A Survey. Ecol. Econ. 2000, 32, 175–194. [Google Scholar] [CrossRef]
- Shaw, D.; Fu, Y.H. Climate Clubs with Tax Revenue Recycling, Tariffs, and Transfers. Clim. Chang. Econ. 2020, 11, 2040008. [Google Scholar] [CrossRef]
- Skjoeldebrand, R. International Nuclear Markets: Problems & Prospect. Internaitonal At. Energy Agency Bull. 1984, 26, 31–36. [Google Scholar]
- Azam, A.; Rafiq, M.; Shafique, M.; Yuan, J. An Empirical Analysis of the Non-Linear Effects of Natural Gas, Nuclear Energy, Renewable Energy and ICT-Trade in Leading CO2 Emitter Countries: Policy Towards CO2 Mitigation and Economic Sustainability. J. Environ. Manag. 2021, 286, 112232. [Google Scholar] [CrossRef]
- Newman, M.E.J. The Structure of Scientific Collaboration Networks. Proc. Natl. Acad. Sci. USA 2001, 98, 404–409. [Google Scholar] [CrossRef] [PubMed]
- Scott, J. Social Network Analysis: Developments, Advances, and Prospects. Soc. Netw. Anal. Min. 2011, 1, 21–26. [Google Scholar] [CrossRef]
- Smith, M.; Gorgoni, S.; Cronin, B. International Production and Trade in a High-tech Industry: A Multilevel Network Analysis. Soc. Netw. 2019, 59, 50–60. [Google Scholar] [CrossRef]
- Stanley Wasserman, K.F. Social Network Analysis Methods and Applications; Cambridge University Press: Cambridge, UK, 1994. [Google Scholar]
- Whittington, K.B.; Owen-Smith, J.; Powell, W.W. Networks, Propinquity, and Innovation in Knowledge-Intensive Industries. Adm. Sci. Q. 2009, 54, 90–122. [Google Scholar] [CrossRef] [Green Version]
- Dean, L.; Koskinen, J.; Robins, G. Exponential Random Graph Models for Social Networks: Theory, Methods, and Applications; Cambridge University Press: Cambridge, UK, 2013. [Google Scholar]
- Nystuen, J.D.; Dacey, M.F. A Graph Theory Interpretation of Nodal Regions. Pap. Reg. Sci. Assoc. 1961, 7, 29–42. [Google Scholar] [CrossRef] [Green Version]
- Ducruet, C.; Cuyala, S.; El Hosni, A. Maritime Networks as Systems of Cities: The Long-Term Interdependencies between Global Shipping Flows and Urban Development (1890–2010). J. Transp. Geogr. 2018, 66, 340–355. [Google Scholar] [CrossRef] [Green Version]
- Hou, C.G.; Du, D.B. The Changing Patterns of International Student Mobility: A Network Perspective. J. Ethn. Migr. Stud. 2020, 48, 248–272. [Google Scholar] [CrossRef]
- Gui, Q.C.; Liu, C.L.; Du, D.B. Globalization of Science and International Scientific Collaboration: A Network Perspective. Geoforum 2019, 105, 1–12. [Google Scholar] [CrossRef]
- Zhao, L.; Zhao, Z. Projecting the Spatial Variation of Economic Based on the Specific Ellipses in China. Sci. Geogr. Sin. 2014, 34, 979–986. [Google Scholar]
- Gui, Q.C.; Liu, C.L.; Du, D.B. Does Network Position Foster Knowledge Production? Evidence from International Scientific Collaboration Network. Growth Chang. 2018, 48, 594–611. [Google Scholar] [CrossRef]
- Wang, X.L.; Wang, L. The Spatiotemporal Evolution of COVID-19 in China and Its Impact on Urban Economic Resilience. China Econ. Rev. 2022, 74, 101806. [Google Scholar] [CrossRef] [PubMed]
- Fan, F.; Zhang, X.R. Transformation Effect of Resource-Based Cities Based on PSM-DID Model: An Empirical Analysis from China. Environ. Impact Assess. Rev. 2021, 911, 106648. [Google Scholar] [CrossRef]
- Zhang, H.; Lan, T.; Li, Z.L. Fractal Evolution of Urban Street Networks in Form and Structure: A Case Study of Hong Kong. Int. J. Geogr. Inf. Sci. 2022, 36, 1100–1118. [Google Scholar] [CrossRef]
- Fan, F.; Zhang, X.Y.; Wang, X.L. Are There Political Cycles Hidden Inside Collaborative Innovation Efficiency? An Empirical Study Based on Chinese Cities. Sci. Public Policy 2022, 45, 101093005. [Google Scholar] [CrossRef]
- Breschi, S.; Lenzi, C. The Role of External Linkages and Gatekeepers for the Renewal and Expansion of US Cities’ Knowledge Base, 1990–2004. Reg. Stud. 2015, 49, 782–797. [Google Scholar] [CrossRef]
- Zhang, X.P.; Lu, D.D.; Chen, M.X.; Gao, S.S.; Wu, A.P. Comprehensive Analysis of World Geography of Nuclear Power Industry. Geogr. Res. 2021, 40, 673–688. [Google Scholar]
- Lu, H.; Du, D.; Qin, X. Assessing the Dual Innovation Capability of National Innovation System: Empirical Evidence from 65 Countries. Systems 2022, 10, 23. [Google Scholar] [CrossRef]
- Fan, F.; Dai, S.Z.; Zhang, K.K. Innovation Agglomeration and Urban Hierarchy: Evidence from Chinese Cities. Appl. Econ. 2021, 53, 6300–6318. [Google Scholar] [CrossRef]
- Fan, F.; Lian, H.; Wang, S. Can Regional Collaborative Innovation Improve Innovation Efficiency? An Empirical Study of Chinese Cities. Growth Chang. 2020, 51, 440–463. [Google Scholar] [CrossRef]
- Hettige, H.; Mani, M.; Wheeler, D. Industrial Pollution in Economic Development: The Environmental Kuznets Curve Revisited. J. Dev. Econ. 2000, 62, 445–476. [Google Scholar] [CrossRef]
- Walter, I.; Ugelow, J.L. Environmental Policies in Developing Countries. Ambio 1979, 8, 102–109. [Google Scholar]
- Wang, T.; Lv, Z.H. Population Growth, Income Level and Urban Environment. China Popul. Resour. Environ. 2012, 22, 143–149. [Google Scholar]
- Kharecha, P.A.; Hansen, J.E. Prevented Mortality and Greenhouse Gas Emissions from Historical and Projected Nuclear Power. Environ. Sci. Technol. 2013, 47, 4889–4895. [Google Scholar] [CrossRef] [PubMed]
- Yang, X. The Relative Importance of Distance in Restricting International Trade. Appl. Econ. Lett. 2013, 20, 1548–1552. [Google Scholar] [CrossRef]
- Jacoby, H.D.; Paltsev, S. Nuclear Exit, the US Energy Mix, and Carbon Dioxide Emissions. Bull. At. Sci. 2015, 69, 34–43. [Google Scholar] [CrossRef]
- Shi, A.Q. The Impact of Population Pressure on Global Carbon Dioxide Emissions, 1975–1996: Evidence from Pooled Cross-Country Data. Ecol. Econ. 2003, 44, 29–42. [Google Scholar] [CrossRef]
- Kim, S.; Kim, S.K. Decomposition Analysis of the Greenhouse Gas Emissions in Korea’s Electricity Generation Sector. Carbon Manag. 2016, 7, 249–260. [Google Scholar] [CrossRef]
- Liu, Y.; Tang, H.Y.; Muhammad, A.; Huang, G.Q. Emission Mechanism and Reduction Countermeasures of Agricultural Greenhouse Gases—A Review. Greenhouse Gases-Sci. Technol. 2019, 9, 160–174. [Google Scholar] [CrossRef]
- Wang, C.; Amon, B.; Schulz, K.; Mehdi, B. Factors That Influence Nitrous Oxide Emissions from Agricultural Soils as Well as Their Representation in Simulation Models: A Review. Agronomy 2021, 11, 770. [Google Scholar] [CrossRef]
- Dong, K.; Sun, R.; Jiang, H.; Zeng, X. CO2 Emissions, Economic Growth, and the Environmental Kuznets Curve in China: What Roles Can Nuclear Energy and Renewable Rnergy Play? J. Clean. Prod. 2018, 196, 51–63. [Google Scholar] [CrossRef]
- Baek, J.; Kim, H.S. Is Economic Growth Good or Bad for the Environment? Empirical Evidence from Korea. Energy Econ. 2013, 36, 744–749. [Google Scholar] [CrossRef]
- Iwata, H.; Okada, K.; Samreth, S. Empirical Study on the Environmental Kuznets Curve for CO2 in France: The Role of Nuclear Energy. Energy Policy 2010, 38, 4057–4063. [Google Scholar] [CrossRef] [Green Version]
- Ben Mbarek, M.; Saidi, K.; Amamri, M. The Relationship between Pollutant Emissions, Renewable Energy, Nuclear Energy and GDP: Empirical Evidence from 18 Developed and Developing countries. Int. J. Sustain. Energy 2018, 37, 597–615. [Google Scholar] [CrossRef]
- Jin, T.; Kim, T. What is Better for Mitigating Carbon Emissions—Renewable Energy or Nuclear Energy? A Panel Data Analysis. Renew. Sustain. Energy Rev. 2018, 91, 464–471. [Google Scholar] [CrossRef]
- Borgatti, S.P.; Mehra, A.; Brass, D.J.; Labianca, G. Network Analysis in the Social Sciences. Science 2009, 323, 892–895. [Google Scholar] [CrossRef] [Green Version]
- Tsai, W.P. Knowledge Transfer in Intraorganizational Network: Effects of Network Position and Absorptive Capacity on Business Unit Innovation and Performance. Acad. Manag. J. 2001, 44, 996–1004. [Google Scholar]


| Variable | Description | Source |
|---|---|---|
| Dependent variable | ||
| GHG | National GHG emissions | Climate Watch |
| Explanatory variable | ||
| GNT | The trade volume of nuclear power products in a country | UN Comtrade |
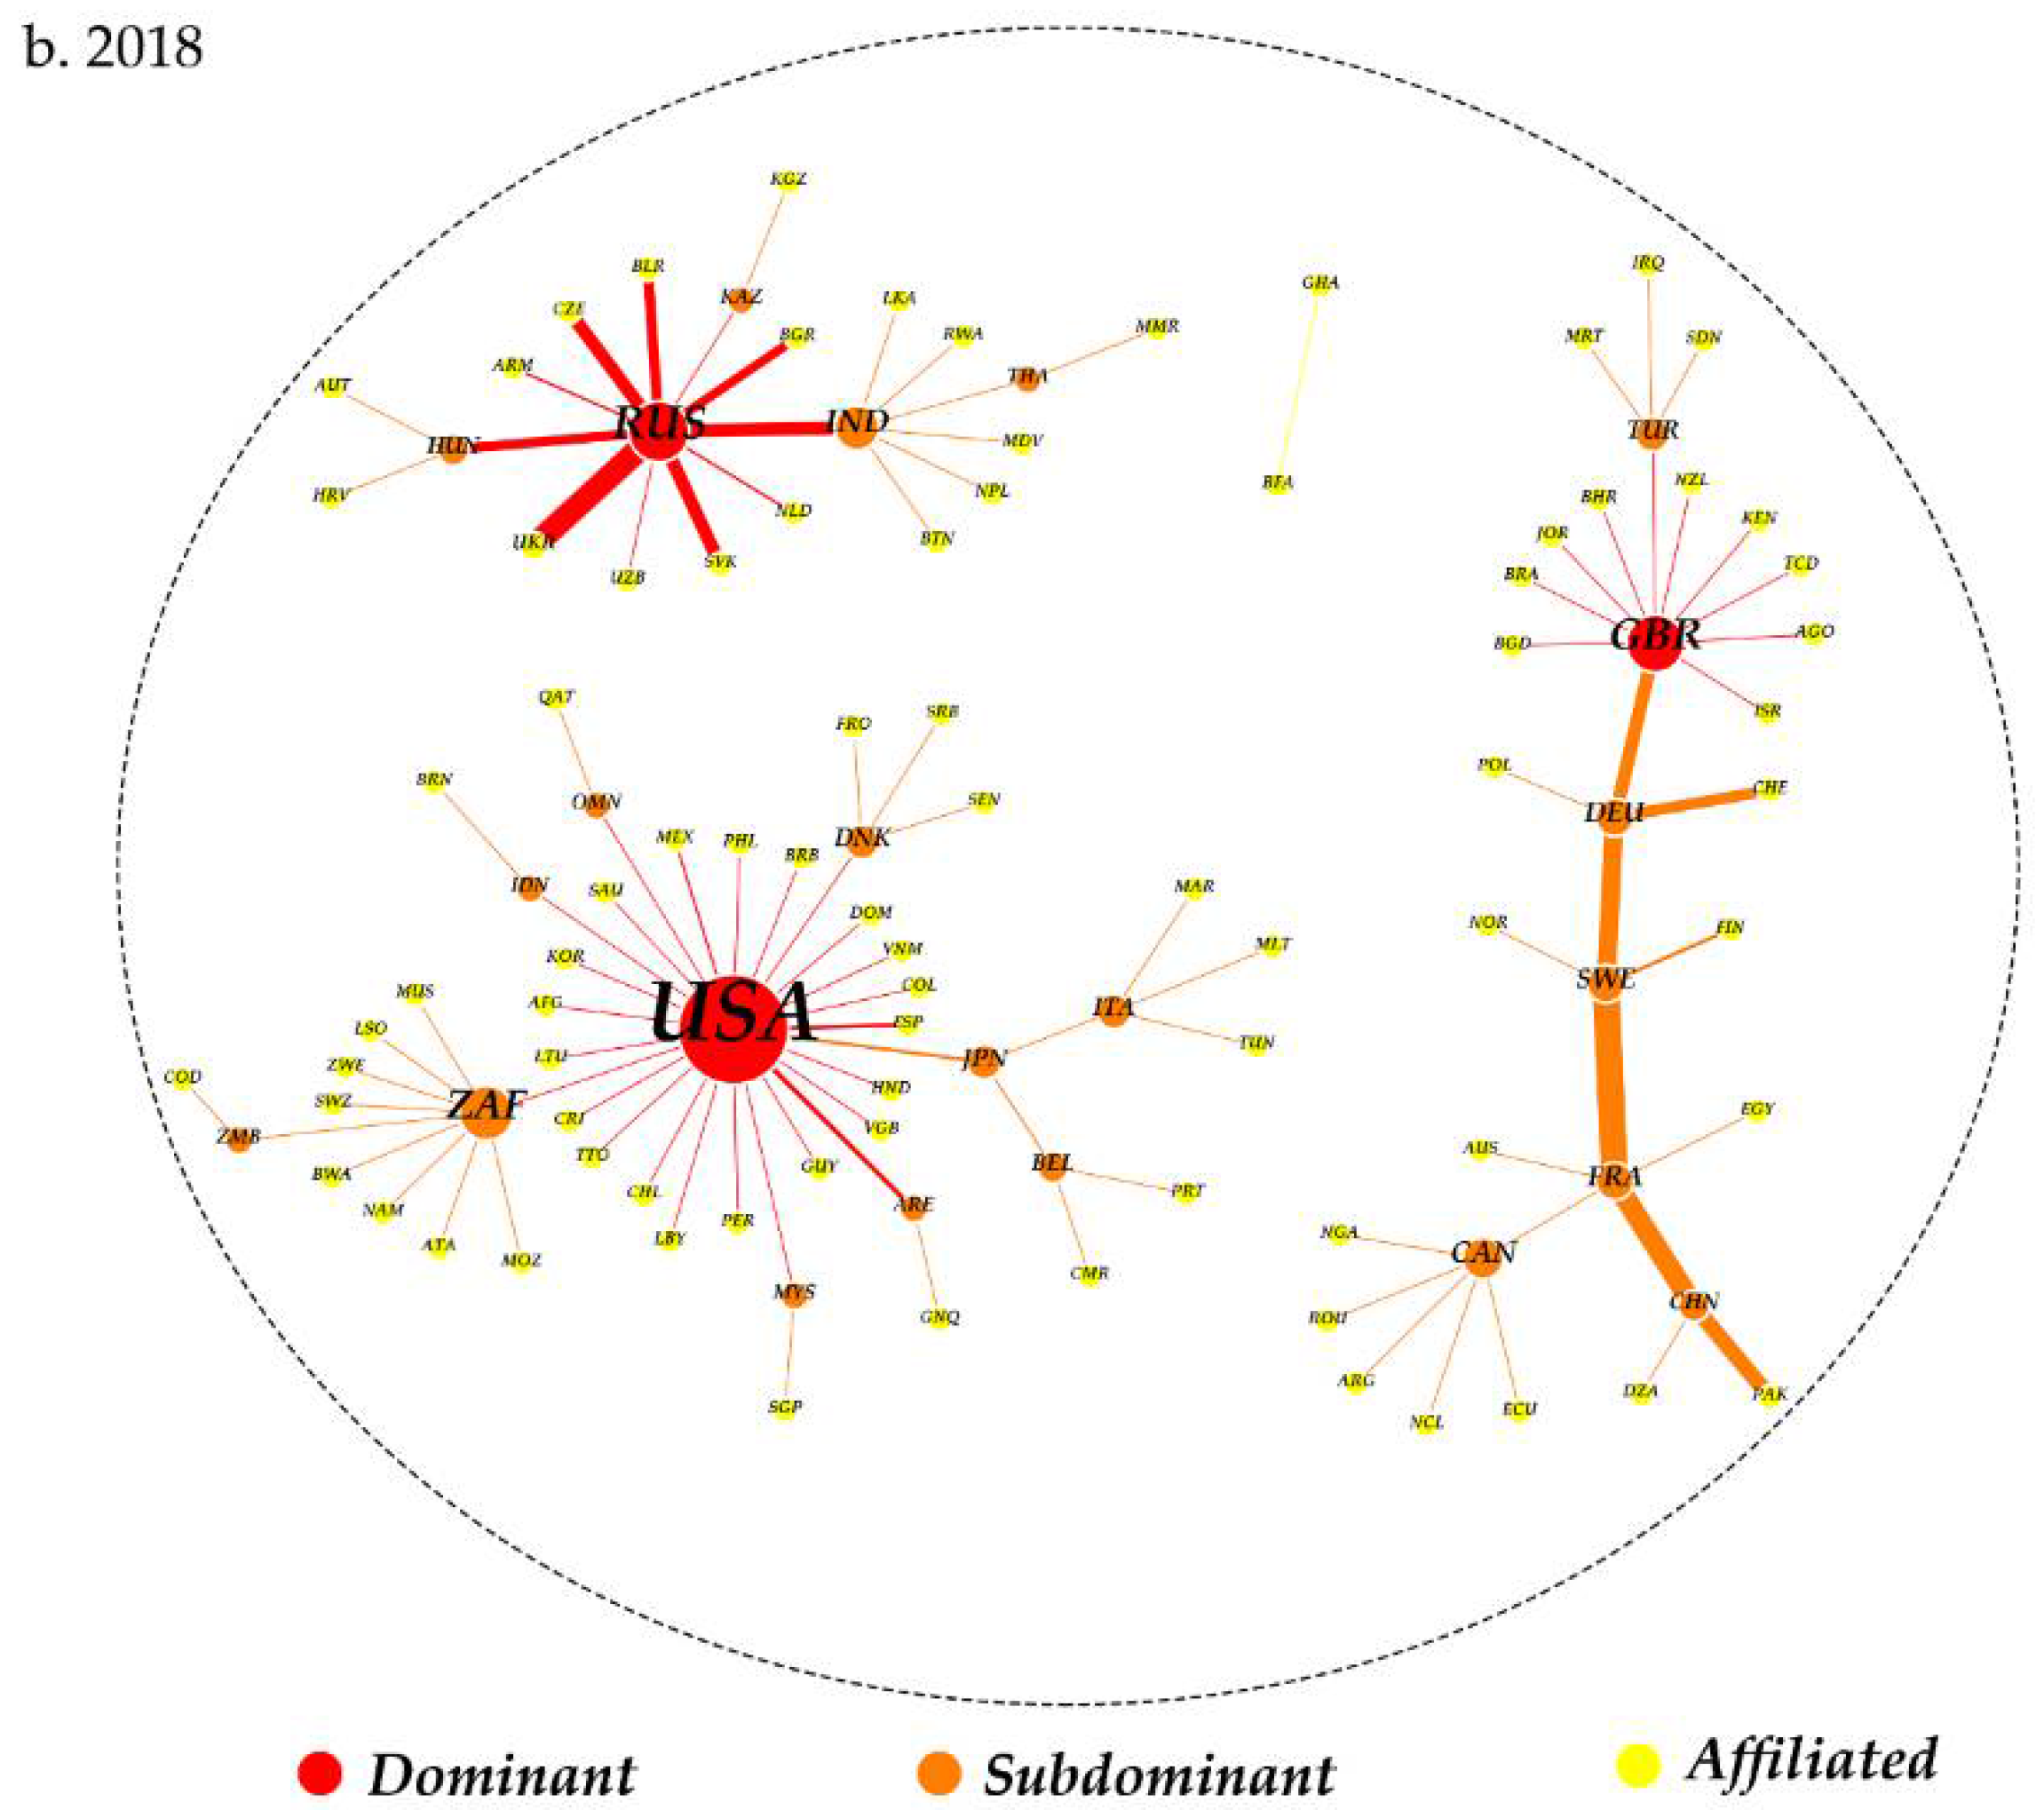
| POS | Dominant: 4; subdominant: 3; affiliated: 2; other: 1 | |
| Control variables | ||
| GDP | Gross national product of a country (USD, billions) | Word Bank |
| FDI | Foreign direct investment within a country (USD, millions) | Word Bank |
| UP | Average urban population of a country (thousands) | Word Bank |
| POP | Total population of a country (millions) | Word Bank |
| PCT | The number of PCT patents in a country (thousands) | WIPO |
| Parameters | 2001 | 2018 |
|---|---|---|
| Center X | 47°38′1″ N | 49°15′47″ N |
| Center Y | 29°48′23″ E | 35°43′48″ E |
| X standard distance | 84.344 | 71.935 |
| Y standard distance | 15.413 | 15.282 |
| Rotation | 88.911 | 88.847 |
| Variables | Mean | SD | 1 | 2 | 3 | 4 | 5 | 6 |
|---|---|---|---|---|---|---|---|---|
| GHG | 219.239 | 838.252 | ||||||
| GNT | 35.967 | 162.080 | 0.337 *** | |||||
| GDP | 322.281 | 1356.077 | 0.789 *** | 0.398 *** | ||||
| FDI | 896.004 | 3649.205 | 0.596 *** | 0.290 *** | 0.686 *** | |||
| UP | 18.381 | 60.488 | 0.407 *** | 0.271 *** | 0.358 *** | 0.283 *** | ||
| POP | 35.837 | 134.890 | 0.802 *** | 0.203 *** | 0.452 *** | 0.363 *** | 0.409 *** | |
| PCT | 72.108 | 482.696 | 0.673 *** | 0.290 *** | 0.911 *** | 0.550 *** | 0.256 *** | 0.332 *** |
| Variables | Model 1 | Model 2 | ||
|---|---|---|---|---|
| Coefficient | SD | Coefficient | SD | |
| GDP | 0.117 *** | 0.026 | 0.118 *** | 0.026 |
| FDI | 0.051 *** | 0.009 | 0.051 *** | 0.009 |
| UP | 0.038 *** | 0.002 | 0.038 *** | 0.002 |
| POP | 0.175 *** | 0.021 | 0.180 *** | 0.022 |
| PCT | −0.096 *** | 0.011 | −0.090 *** | 0.012 |
| GNT | −0.677 * | 0.362 | ||
| Constant | 1.465 *** | 0.209 | 1.429 | 0.211 |
| Observations | 3438 | 3438 | ||
| Number of countries | 191 | 191 | ||
| Log likelihood | −11,284.92 | −11,283.11 | ||
| Wald χ2 | 1472.71 | 1472.07 | ||
| 2001 | 2018 | |
|---|---|---|
| Node number | 108 | 111 |
| Edge number | 314 | 307 |
| Degree centrality | 5.815 | 5.532 |
| Out-degree centrality | 2.907 | 2.766 |
| Network density | 0.027 | 0.025 |
| Clustering coefficient | 0.261 | 0.202 |
| Average path length | 2.673 | 2.854 |
| Variables | Coefficient | SD |
|---|---|---|
| GDP | 0.041 *** | 0.012 |
| FDI | 0.011 *** | 0.003 |
| UP | 0.003 *** | 0.001 |
| POP | 0.253 *** | 0.067 |
| PCT | −0.041 | 0.038 |
| POS | −0.044 ** | 0.205 |
| Constant | 0.845 | 0.604 |
| Observations | 3438 | |
| Number of countries | 191 | |
| Log likelihood | −647.62 | |
| Wald χ2 | 269.48 | |
| Variables | Dominant Positions | Affiliated Positions | ||
|---|---|---|---|---|
| Model 1 | Model 2 | Model 3 | Model 4 | |
| Coefficient (SD) | Coefficient (SD) | Coefficient (SD) | Coefficient (SD) | |
| GDP | 0.929 *** (0.191) | 0.990 *** (0.194) | 0.097 *** (0.025) | 0.099 *** (0.025) |
| FDI | 0.032 ** (0.016) | 0.033 ** (0.016) | 0.054 *** (0.010) | 0.053 *** (0.010) |
| UP | 0.027 *** (0.004) | 0.026 *** (0.004) | 0.030 *** (0.008) | 0.029 *** (0.007) |
| POP | 0.408 (0.407) | 0.415 (0.408) | 0.184 *** (0.032) | 0.190 *** (0.033) |
| PCT | −0.062 *** (0.018) | −0.054 ** (0.018) | −0.236 *** (0.064) | −0.265 *** (0.063) |
| GNT | −0.728 * (0.415) | −0.342 ** (0.129) | ||
| Constant | 0.730 *** (0.500) | 0.580 *** (0.507) | 1.477 *** (0.293) | 1.435 *** (0.299) |
| Observations | 522 | 3006 | ||
| Number of countries | 29 | 167 | ||
| Log likelihood | −2543.08 | −2541.49 | −9099.62 | −9095.78 |
| Wald χ2 | 539.01 | 530.07 | 203.64 | 213.81 |
Publisher’s Note: MDPI stays neutral with regard to jurisdictional claims in published maps and institutional affiliations. |
© 2022 by the authors. Licensee MDPI, Basel, Switzerland. This article is an open access article distributed under the terms and conditions of the Creative Commons Attribution (CC BY) license (https://creativecommons.org/licenses/by/4.0/).
Share and Cite
Li, T.; Du, D.; Wang, X.; Qin, X. Can Nuclear Power Products Mitigate Greenhouse Gas Emissions? Evidence from Global Trade Network. Int. J. Environ. Res. Public Health 2022, 19, 7808. https://doi.org/10.3390/ijerph19137808
Li T, Du D, Wang X, Qin X. Can Nuclear Power Products Mitigate Greenhouse Gas Emissions? Evidence from Global Trade Network. International Journal of Environmental Research and Public Health. 2022; 19(13):7808. https://doi.org/10.3390/ijerph19137808
Chicago/Turabian StyleLi, Tingzhu, Debin Du, Xueli Wang, and Xionghe Qin. 2022. "Can Nuclear Power Products Mitigate Greenhouse Gas Emissions? Evidence from Global Trade Network" International Journal of Environmental Research and Public Health 19, no. 13: 7808. https://doi.org/10.3390/ijerph19137808
APA StyleLi, T., Du, D., Wang, X., & Qin, X. (2022). Can Nuclear Power Products Mitigate Greenhouse Gas Emissions? Evidence from Global Trade Network. International Journal of Environmental Research and Public Health, 19(13), 7808. https://doi.org/10.3390/ijerph19137808