Abstract
The WTC Health Registry (WTCHR) is a closed, longitudinal cohort of rescue/recovery workers and survivors exposed to the 11 September 2001 disaster. WTCHR enrollees diagnosed with asthma after 11 September 2001 continued to experience poor control despite treatment. Asthma is associated with mental problems, although their bidirectional movement has not been studied. This study tested whether a clinical change in mental problems was associated with a difference in asthma control, and whether a change in asthma control varied with a change in quality of life (QoL). Difference in the Asthma Control Test (ACT) on the WTCHR from 2011–12 to 2015–16 was compared with the change in the Post-traumatic Stress Disorder Checklist (PCL-17), the Patient Health Questionnaire depression scale, self-reported heartburn, and change of physical and mental QoL over this period. In adjusted multinomial multivariable logistic regression, improved PCL-17 was associated with a better ACT score, odds ratio (OR) = 1.42 (95% C.I. 1.01, 1.99), and a worsened PCL-17 score was associated with a worsened ACT score, OR = 1.77 (95% C.I. 1.26, 2.50). Decreased ACT was associated with poor physical QoL, OR = 1.97 (95% C.I. 1.48, 2.62). Change in mental health measures tracked with change in asthma control, which correlated with a change in QoL. Careful follow-up and treatment of all three are indicated to improve these inter-related issues.
1. Introduction
New incident asthma is one of the hallmarks of World Trade Center (WTC)-disaster-related illness. Symptoms of asthma, as well as bronchial hyperreactivity and decreased lung function were reported early on in Fire Department of New York (FDNY) firefighters, especially those exposed on the day of the disaster [1,2]. Increased asthma symptoms were noted in exposed Manhattan residents 5–9 weeks after the attack [3]. Wheeler et al. reported a significant increase in newly diagnosed self-reported asthma among rescue/recovery workers with earlier arrival at the site and longer duration of exposure to the dust cloud and work on the debris pile [4]. Brackbill et al. found that the increased rate of newly diagnosed asthma was also seen in lower Manhattan residents and area workers who were exposed to the dust cloud, experienced a heavy layer of dust at home or office, or remained at home after the disaster [5].
Asthma has continued to be reported among WTC-exposed groups. As of 2009, 8.8% of exposed firefighters had FDNY physician-diagnosed asthma [6]. Apart from these firefighters, among 7027 rescue/recovery workers and volunteers followed for nine years, the cumulative incidence of asthma was 27.6% [7].
Asthma is known to be associated with mental health disorders [8,9,10]. ln a longitudinal study of WTC rescue/recovery workers, probable post-traumatic stress disorder (PTSD), as measured by the PTSD Checklist-17 (PCL-17) at baseline, was associated with self-reported physician-diagnosed new onset asthma over a three to five year follow-up period, and that the association was much stronger for the more chronic PTSD trajectories within that interval [11].
Studies have indicated that asthma control in WTC-disaster-exposed populations may be poor, as measured by National Asthma Education and Prevention Program Guidelines [12]. Among 2445 WTCHR survey participants examined in 2011–12, Jordan et al. found that 33.7% had poorly controlled symptoms and 34.6% had very poorly controlled symptoms [13]. A higher number of mental health conditions (PTSD, depression, and anxiety), gastroesophageal reflux symptoms (GERS), and obstructive sleep apnea (OSA), as well as increased age, lower educational attainment, current smoking, participation in rescue/recovery work, and obesity were all significantly associated with very poor asthma control. In a study of 218 WTC rescue and recovery workers, Xu et al. found that higher gastroesophageal reflux disease (GERD) scores and PTSD, as well as increased age, lower income, and high WTC exposure were associated with very poor asthma control [14]. The highly prevalent comorbidities reported in WTC workers [15] are known to be associated with difficult-to-treat asthma in the general population [16]. Wyka et al. demonstrated that lower respiratory symptoms and PTSD in enrollees in the WTCHR exhibited a bidirectionality in these physical and mental health problems [17]. Psychological variables have also been associated with asthma-related quality of life [18,19]. However, the effect of change in level of asthma control on health-related quality of life has not yet been reported in WTC-exposed individuals. These findings raised the new question of whether a change in PTSD, depression, and quality of life over time would be accompanied by a concomitant change in the level of asthma control.
The primary hypothesis of this study was that a clinically significant change from the W3 survey to the W4 asthma survey in risk factors would be associated with a clinically significant change in asthma control level. A second hypothesis was that clinically significant change in asthma control would be associated with clinically significant change in quality of life measures.
2. Materials and Methods
2.1. Data Source
The WTC Health Registry (WTCHR) is a closed, longitudinal cohort of rescue/recovery workers, volunteers, local area workers, residents, students, teachers, and passersby who met criteria for exposure to the disaster on or after 11 September 2001 [20]. A total of 68,046 adults aged ≥18 on 11 September 2001 responded to the first registry survey (Wave 1 or W1, 2003–2004). To date, four surveys have been completed, with 46,019 enrollees responding to the second survey (Wave 2, 2006–2007), 42,395 responding to the third survey (Wave 3, 2011–2012), and 35,958 responding to the fourth survey (Wave 4, 2015–2016). These surveys asked about demographic characteristics, exposure to the disaster, physical and mental health status, self-report of diagnosed illnesses, social status, and quality of life. The W3 survey included an asthma module that inquired about symptoms, diagnosis date and control level using a modified version of the Asthma Control Test (ACT) [21,22].
2.2. Analytic Sample
There were 10,583 enrollees who reported that they had been diagnosed with asthma between 11 September 2001 through 2012 on the Wave 1, 2, or 3 surveys. Those who completed the asthma symptoms and control module in Wave 3 (n = 5379) were mailed the Wave 4 asthma survey. Of these, 69.4% (3735) answered the W4 asthma survey. There were 2796 respondents who completed the components of the ACT survey in the Wave 3 and Wave 4 asthma surveys, and they comprise the cohort for this study (Figure 1). Wave 3 characteristics of the participants and non-participants in the W4 asthma survey were compared using the chi-square test.
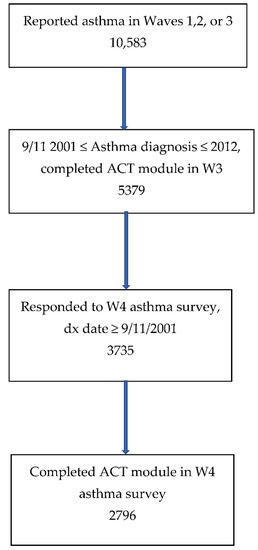
Figure 1.
Flow diagram of participation in this study.
The asthma surveys asked about asthma morbidity and symptom control. The difference between the modified ACT used in Wave 3, 2011–12, and the ACT in the Wave 4 asthma survey in 2016 was that the modified ACT asked about symptoms in the last 30 days, whereas the ACT asked about symptoms in the last 28 days. All self-reported data reported in this study were acquired through these surveys.
The Institutional Review Boards of the New York City Department of Health and Mental Hygiene and the Centers for Disease Control and Prevention approved the Registry protocols.
2.3. Change in Asthma Control
Change was measured by characterizing whether the change in ACT score was clinically significant, i.e., a change of at least three points versus within three points up or down [22], or by whether the change in ACT resulted in a change in the level of control (very poorly controlled, 0–15; poorly controlled, 16–19; or controlled, 20–25).
2.4. Predictors of Change in Asthma Control
Demographic variables including age on 11 September 2001, sex, and race/ethnicity were recorded in W1. Race/ethnicity was categorized in two different ways: (1) five groups: non-Hispanic White, non-Hispanic African American, non-Hispanic Asian, and other, and (2) two groups: non-Hispanic White versus others.
Since the goal was to measure the association between clinically significant change from W3 to W4 in asthma symptom control risk factors and clinically significant change in asthma control level, we first defined significant change in the predictors. Seven factors potentially associated with control level were measured at both W3 and W4 (see Table 1). The effect of these factors on control level was examined using the change in the factor from W3 to W4 as the independent variable. These time dependent variables included the time interval from W3 to W4, score on the 17-item PTSD Checklist, Stressor-Specific Version (PCL-17) [23,24], score on the 8-item Patient Health Questionnaire depression scale (PHQ-8) [25], self-reported body mass index (BMI), gastroesophageal reflux symptom (GERS) frequency in the past 12 months, and level of social support. (The PCL-17 is scored as 17 to 85 with ≥44 as positive; the PHQ-8 is scored as 0 to 24 with ≥10 as positive). Difference in BMI was categorized as relative change of at least 5 percent. For GERS in the last 12 months, change was categorized as crossing a threshold of symptoms of at least twice a week. Social support was estimated based on four criteria: having ≥3 close friends, having contact with those friends ≥ twice a month, attending religious service ≥ twice a month, and being actively involved in a group or club. Social support was scored as low (meeting none or 1 of the criteria), medium (meeting 2 of the criteria) or high (meeting ≥3 of the criteria). Change was measured as a minimum of movement from one level to the next up or down (e.g., from low to medium or low to high). For PTSD, a change of at least 10 points in the PCL-17 score was required [25,26,27] as the standard deviation for the difference was 10.44. For depression using the PHQ-8, a difference of at least 5 points was used as the change criterion [25,28].

Table 1.
Change from Wave 3 to Wave 4.
There was little change in the percentage of participants who were currently smoking from W3 to W4. Only 34/157 (21.7%) adults who smoked at W3 stopped at W4, and only 17/2918 (0.58%) adults who did not smoke at W3 reported smoking every day at W4Smoking status at W3, rather than change in smoking status was used to provide the effect of smoking on asthma control.
Questions about healthcare accessibility were revised from W3 to W4 so change in healthcare access could not be determined, and access at W3 was used. In W3, poor healthcare accessibility was defined as the absence of health insurance, absence of a personal health care provider, or not receiving needed physical health care in the past 12 months.
OSA prevalence was based on self-report of a history of physician diagnosis which should not change negatively from W3 to W4 (once a diagnosis is recorded in W3, it is unlikely to be undone in W4), so OSA at W3 was used.
2.5. Statistical Analysis
The bivariate association between possible risk factors and change in ACT score from W3 to W4 was measured using the chi-square test. The association between possible risk factors and change in ACT score was also modeled using bivariate or multivariable logistic regression analyses predicting clinically significant change in ACT score from W3 to W4. The ACT change reference category was chosen to be ±2, and the probability of being assigned to the ≤−3 or ≥3 categories were compared with this reference, using odds ratios and their 95% confidence intervals. A proportional odds model was attempted, but the data did not support the proportional odds assumption. Subsequently, a multivariable multinomial logistic regression model was used. The output yielded four odds ratios for each pair of independent and dependent variables.
A PCL-17 score change of ≥10 points and PHQ-8 score change of ≥5 points were included in separate models since these variables are collinear.
The relationship of ACT score changes and quality of life measures was analyzed using a multivariable multinomial logistic regression model where a clinically significant change in ACT score was used to predict a change of ≥10 days of poor physical or mental health (versus within 9 days up or down). A sensitivity analysis was undertaken using a cutoff of 14 or more days of poor physical or mental health as the dependent variable [29].
2.6. Participants vs. Non-Participants in W4
Between participants and non-participants in W4, the prevalence of controlled versus not controlled (poorly or very poorly controlled) asthma at W3 measured by ACT criteria was not significantly different (52.1% in participants versus 50.7% in non-participants) (p = 0.3976). However, there were some differences in covariates. Participants were more likely to report being older (p < 0.0001), White non-Hispanic race and ethnicity (p < 0.0001), and higher educational attainment (p < 0.0001). Participants were less likely to report current smoking at W3 (p < 0.0001), less likely to have poor access to healthcare (p = 0.0126), lower social support (p = 0.0003), or a history of less GERS (p = 0.0065). Participants and non-participants did not vary significantly by sex, obesity status, rescue/recovery worker experience, dust cloud exposure after 11 September 2001, or reported history of OSA.
3. Results
The mean age at submission of the W3 survey was 52.0 years, standard deviation (SD) 9.67 years, and for the W4 asthma survey, 56.0 years, SD 9.66 years. The mean interval from the Wave 3 to the Wave 4 asthma interview was 4.11 years, SD 0.20 years. The mean time interval between interviews was not associated with change in ACT score from the W3 survey to the W4 asthma survey (Pr > F = 0.081).
Asthma control decreased from W3 to the W4 asthma survey. The mean change in ACT score was −1.07, range −18 to +18; 32.6% scored higher, 16.2% scored the same, and 51.2% scored lower. Using a clinically significant change of three points, 15.9% scored higher, 52.5% scored the same, and 31.6% scored lower. Mean BMI increased by 0.19 kg/m2 (95% CI 0.082, 0.30), mean PCL-17 score decreased by 2.0 points (95% CI 1.55, 2.41), and mean PHQ-8 decreased by 0.32 points (95% CI 0.13, 50).
The results of the bivariate analyses of demographics, covariates and change of asthma control between the W3 and W4 asthma surveys are presented in Table 2 and Table 3. Associations related to factors measured at a single time point (i.e., W1 or W3) are shown in Table 2. Age group on 9/11, sex, education, and 9/11 exposure category documented at Wave 1 were associated with a clinically significant change in ACT score (up or down by ≥3 points) from W3 to W4. Race/ethnicity was not significantly associated with a change in ACT score when it was categorized into five groups. However, there was significant variability when using the non-Hispanic White versus the remaining groups, so this breakdown was presented in the tables. Other factors measured at W3, income level, poor access to healthcare, GERS frequency, obstructive sleep apnea, PCL-17 ≥ 44, and PHQ-8 ≥ 10, were also associated with a change in ACT score. ACT level at W3 was strongly inversely related to a change in ACT score, i.e., those with poorly controlled asthma at W3 were more likely to have improvement in ACT score from W3 to W4. Similarly, those with controlled asthma at W3 were less likely to improve their ACT score in W4. The year of asthma diagnosis and dust cloud exposure, smoking status, BMI category, and level of social support at W3 were not associated with a change in ACT score.
Table 2.
Demographics, exposures and other relevant factors’ effect on change in ACT scores.
Table 3.
Factors measured as the difference between W3 and W4 association between change in risk factor and change in ACT score.
Possible risk factors measured as change from W3 to W4 are presented in Table 3. Change in PCL-17 score by ≥10 points, change in PHQ-8 score by ≥5 points, and change in GERS frequency in the past 12 months across the twice-a-week threshold were significantly associated with a change in ACT scores from W3 to W4. Change in income level, smoking history, BMI, and social support category were not associated with a change in ACT score.
By bivariate logistic regression (Table 4), female sex, very poorly controlled asthma at W3, improving GERS, improving PCL-17 score, and improving PHQ-8 score were associated with an improved ACT score from W3 to W4. Older age group on 9/11, history of sleep apnea at W3, poorly controlled asthma at W3, and worse GERS, PCL-17, and PHQ-8 scores from W3 to W4 were associated with a worsening ACT score. Race/ethnicity, smoking history, dust cloud exposure, BMI change of ≥5%, and social support change were not associated with a change in ACT score. Not being a rescue/recovery worker was protective against worsening asthma control. Poor healthcare accessibility at W3 was associated with an improved ACT score but not with worsened ACT.
Table 4.
Bivariate and adjusted multivariable multinomial logistic regression for clinically significant change in ACT score versus demographics and clinically significant change in physical, and mental health factors from W3 to W4, odds ratios and 95% confidence intervals.
In the adjusted multinomial multivariable logistic regression analysis (Table 4), as in the bivariate analyses, female sex and uncontrolled asthma at W3 were associated with an improved ACT score from W3 to W4. Improving PCL-17 was associated with an improving ACT score (adjusted odds ratio (ORadj) = 1.42 (95% C.I 1.01, 1.99), and worsening PCL-17 score was associated with a worsening ACT score (ORadj = 1.77 (95 % C.I. 1.26, 2.50). Older age group and increasing frequency of GERS from W3 to W4 were associated with a worsening ACT score, and 9/11 exposure group other than rescue/recovery worker and higher educational attainment were protective against a worsening ACT score.
In an adjusted logistic regression model where clinically a significant change in PHQ-8 was substituted for a clinically significant change in PCL-17, worsening PHQ-8 score approached but did not reach statistically significant association with worsening ACT score, ORadj = 1.34, 95%, confidence intervals (C.I. 0.96, 1.86).
The effect of a clinically significant change in ACT score on quality of life was examined in a multivariable multinomial logistic regression model (Table 5). Decrease (≥3 points) in ACT score was associated with a change of ≥10 days of poor physical health, ORadj = 1.97 (95% CI 1.48, 2.62). The possible association between improvement in ACT score (≥3 points) and fewer days of poor physical health approached but did not reach significance, ORadj = 1.38 (95% CI 0.96, 1.98). Change in ACT score was not associated with a change in days of poor mental health. When PCL-17 was removed from the model for mental health quality of life, a worse ACT score (≥3 points) was associated with worse mental health (≥10 days), ORadj = 1.44 (95% C.I. 1.07, 1.96).
Table 5.
Multivariable multinomial logistic regression, change in quality of life of 10 days poor health versus change in ACT score, W3 to W4.
4. Discussion
This study is the first in the WTC disaster literature to demonstrate bidirectionality in clinically significant change in PTSD and ACT scores over time. ACT score change paralleled change in PTSD score, depression score, and GERS frequency in bivariate and in multivariable logistic regression analyses accounting for covariates.
Previous studies have demonstrated an association between mental health conditions and incident asthma or poor asthma control [11,13,14]. The current study goes further to demonstrate that clinically meaningful change in these mental health indicators is associated with concomitant change in asthma symptom control. The indicators used in this study, 3-point change in ACT score, change to GERS to at least twice a week, 10-point change in PCL-17 score, and 5-point change in PHQ-8 score were meaningful by clinical standards and sensitive enough to identify change from W3 to W4.
The strongest predictor of change in ACT score was the ACT score at W3. Enrollees with very poorly controlled asthma at W3 were several times more likely than those with controlled asthma to show improvement in ACT score. This pattern might be expected since there is a greater possibility for improvement among those with very poor control than those with controlled asthma, and similarly, greater possibility for worsening control among those with controlled asthma than those with very poor control. Even so, the association between change in PTSD score and change in ACT score remained when baseline ACT score at W3 was accounted for in the adjusted model.
Poor healthcare access has been shown to be associated with poor asthma control [13]. In the current study it was paradoxically associated with improvement in the ACT score in the bivariate linear regression model, despite efforts by the WTCHR to link care to the World Trade Center Health Program. This finding was unexpected and requires further investigation.
Asthma is known to be associated with poor quality of life, in both community and WTC populations [14,30,31]. Similarly in this study, the ACT change tracked a clinically significant change in quality of life measures. A decrease of ≥3 points in the ACT was associated with a nearly twofold increased adjusted odds of poorer physical health. A change of ≥3 points in ACT score was associated with a change in days of poor mental health only when changes in PCL-17 and PHQ-8 scores were omitted from the model. A mediation study of the effect of asthma change on mental health quality of life through the association between asthma control and mental health might be revealing.
Previous WTCHR reports and studies of broader populations have also shown that report of poor mental health precedes report of lower respiratory symptoms and poor quality of life [9,10,32,33]. In this study data on asthma control, mental health covariates and quality of life were collected at approximately the same point in time, suggesting that these factors may be affecting each other.
Limitations
A weakness of this study is that all the diagnoses and measures were self-reported. However, key measures (ACT score, PCL-17, PHQ-8, days of poor quality of life) are well-validated, and clinically significant thresholds have been determined [25,26,27,28,29,34,35]. Analyses using slightly different measures for change in PCL-17 (crossing the 44-point threshold for positive PTSD), change in ACT score (change in controlled, poorly controlled, and very poorly controlled categories), and change in physical and mental quality of life (crossing the 14-days-per-month threshold of poor physical or mental health), gave similar results. Nevertheless, measurement of asthma control level in this study would benefit from objective clinical measurement such as spirometry with bronchodilator response [36] or forced oscillometry [37]. Still, this study provided longitudinal, prospective data that allowed for measurement of the relationships among respiratory, mental health, and quality of life variables.
The participants who self-reported asthma in the W3 asthma module and the Wave 4 asthma survey were older, had completed a higher level of education, and reported fewer mental health problems than those who did not participate. These differences may limit generalizing the findings to the entire WTCHR population. Still, 69% of enrollees who completed the W3 asthma module did participate in this study and represented a substantial sample for this analysis.
The association between mental health problems and asthma has been well-reported both in those exposed to the WTC disaster and in the general population [9,10,11,13,14,36]. Possible mechanisms include changes in gene expression and stress modulation of the hypothalamic–pituitary–adrenal cortex axis, autonomic nervous system, lung function, and the immune system [8,11,38,39]. However, the actual pathways remain to be elucidated.
Change in asthma control and other mental illnesses may also be bidirectional, as in the case of asthma and panic disorder [40]. In this study, the inter-relationship of asthma and PTSD underscored the potential importance of treating mental health problems and asthma simultaneously to improve the outcomes of both. Similarly, for asthma control and quality of life, improvement in one is likely to be accompanied by in improvement in the other. This study did not directly assess the effect of treatment of PTSD or asthma on the other. Although access through the WTC Health Program made multidisciplinary treatment possible for many exposed individuals, future studies will be needed to test whether treatment of PTSD reduces the symptoms of asthma with an accompanying change in quality of life.
This study antedated the COVID-19 pandemic, but it may have an ongoing effect on WTCHR enrollees with PTSD and asthma, and their quality of life. Subsequent WTCHR surveys will provide an opportunity to investigate the relationship between these health issues and COVID-19 in detail.
5. Conclusions
This prospective longitudinal study measured the relationships among asthma, mental health, and quality of life. Change in mental health paralleled change in asthma control and change in asthma control correlated with change in quality of life. Careful study of simultaneous treatment of asthma and mental illness are needed to achieve reciprocal, inter-related benefits.
Author Contributions
Conceptualization, S.M.F., H.A., M.R.F. and J.C.; Data curation, S.O.; Formal analysis, S.M.F., H.A. and S.O.; Funding acquisition, M.R.F.; Investigation, M.R.F. and J.C.; Methodology, S.M.F., H.A. and R.E.d.l.H.; Project administration, M.R.F. and J.C.; Resources, M.R.F.; Software, S.M.F. and S.O.; Supervision, M.R.F. and J.C.; Validation, H.A.; Visualization, J.C.; Writing—original draft, S.M.F., R.E.d.l.H. and J.C.; Writing—review & editing, S.M.F., H.A., R.E.d.l.H. and J.C. All authors have read and agreed to the published version of the manuscript.
Funding
This publication was supported by Cooperative Agreement Numbers 2U50/OH009739 and 5U50/OH009739 from the National Institute for Occupational Safety and Health (NIOSH) of the Centers for Disease Control and Prevention (CDC); U50/ATU272750 from the Agency for Toxic Substances and Disease Registry (ATSDR), CDC, which included support from the National Center for Environmental Health, CDC; and by the New York City Department of Health and Mental Hygiene (NYC DOHMH). Its contents are solely the responsibility of the authors and do not necessarily represent the official views of NIOSH-CDC.
Institutional Review Board Statement
The study was conducted in accordance with the Declaration of Helsinki, and approved by the Institutional Review Boards of the New York City Department of Health and Mental Hygiene (protocol # 02057) and the Centers for Disease Control and Prevention (renewal date May 2022).
Informed Consent Statement
Informed consent was obtained from all subjects involved in the study.
Data Availability Statement
Unidentified data sets may be accessed from the New York City World Trade Center Health Registry (https://www1.nyc.gov/site/911health/researchers/health-data-tools.page, accessed on 10 June 2022). Researchers with further data may contain the WTCHR directly.
Conflicts of Interest
The authors declare no conflict of interest.
References
- Prezant, D.J.; Weiden, M.; Banauch, G.I.; McGuinness, G.; Rom, W.N.; Aldrich, T.K.; Kelly, K.J. Cough and bronchial responsiveness in firefighters at the World Trade Center site. N. Engl. J. Med. 2002, 347, 806–815. [Google Scholar] [CrossRef] [PubMed]
- Banauch, G.I.; Alleyne, D.; Sanchez, R.; Olender, K.; Cohen, H.W.; Weiden, M.; Kelly, K.J.; Prezant, D.J. Persistent hyperreactivity and reactive airway dysfunction in firefighters at the World Trade Center. Am. J. Respir. Crit. Care Med. 2003, 168, 54–62. [Google Scholar] [CrossRef] [PubMed]
- MMWR. Self-reported increase in asthma severity after the 11 September attacks on the World Trade Center-Manhattaan, New York, 2001. MMWR Morb. Mortal. Wkly. Rep. 2002, 51, 781–784. [Google Scholar]
- Wheeler, K.; McKelvey, W.; Thorpe, L.; Perrin, M.; Cone, J.; Kass, D.; Farfel, M.; Thomas, P.; Brackbill, R. Asthma diagnosed after 11 September 2001 among rescue and recovery workers: Findings from the World Trade Center Health Registry. Environ. Health Perspect. 2007, 115, 1584–1590. [Google Scholar] [CrossRef] [PubMed] [Green Version]
- Brackbill, R.M.; Hadler, J.L.; DiGrande, L.; Ekenga, C.C.; Farfel, M.R.; Friedman, S.; Perlman, S.E.; Stellman, S.D.; Walker, D.J.; Wu, D.; et al. Asthma and posttraumatic stress symptoms 5 to 6 years following exposure to the World Trade Center terrorist attack. JAMA 2009, 302, 502–516. [Google Scholar] [CrossRef] [Green Version]
- Webber, M.P.; Glaser, M.S.; Weakley, J.; Soo, J.; Ye, F.; Zeig-Owens, R.; Weiden, M.D.; Nolan, A.; Aldrich, T.K.; Kelly, K.; et al. Physician-diagnosed respiratory conditions and mental health symptoms 7-9 years following the World Trade Center disaster. Am. J. Ind. Med. 2011, 54, 661–671. [Google Scholar] [CrossRef] [Green Version]
- Wisnivesky, J.P.; Teitelbaum, S.L.; Todd, A.C.; Boffetta, P.; Crane, M.; Crowley, L.; de la Hoz, R.E.; Dellenbaugh, C.; Harrison, D.; Herbert, R.; et al. Persistence of multiple illnesses in World Trade Center rescue and recovery workers: A cohort study. Lancet 2011, 378, 888–897. [Google Scholar] [CrossRef]
- Yonas, M.A.; Lange, N.E.; Celedón, J.C. Psychosocial stress and asthma morbidity. Curr. Opin. Allergy Clin. Immunol. 2012, 12, 202–210. [Google Scholar] [CrossRef]
- Alonso, J.; de Jonge, P.; Lim, C.C.; Aguilar-Gaxiola, S.; Bruffaerts, R.; Caldas-de-Almeida, J.M.; Liu, Z.; O’Neill, S.; Stein, D.J.; Viana, M.C.; et al. Association between mental disorders and subsequent adult onset asthma. J. Psychiatr. Res. 2014, 59, 179–188. [Google Scholar] [CrossRef] [Green Version]
- Hung, Y.-H.; Cheng, C.-M.; Lin, W.-C.; Bai, Y.-M.; Su, T.-P.; Li, C.-T.; Tsai, S.-J.; Pan, T.-L.; Chen, T.-J.; Chen, M.-H. Post-traumatic stress disorder and asthma risk: A nationwide longitudinal study. Psychiatry Res. 2019, 276, 25–30. [Google Scholar] [CrossRef]
- de la Hoz, R.E.; Jeon, Y.; Miller, G.E.; Wisnivesky, J.P.; Celedon, J.C. Post-traumatic Stress Disorder, Bronchodilator Response, and Incident Asthma in World Trade Center Rescue and Recovery Workers. Am. J. Respir. Crit. Care Med. 2016, 194, 1383–1391. [Google Scholar] [CrossRef] [Green Version]
- Program, N.A.E.A.P. Guidelines for the Diagnosis and Management of Asthma 2007 (EPR-3). Available online: www.nhlbi.nih.gov/guidelines/asthma/ (accessed on 5 May 2022).
- Jordan, H.T.; Stellman, S.D.; Reibman, J.; Farfel, M.R.; Brackbill, R.M.; Friedman, S.M.; Li, J.; Cone, J.E. Factors associated with poor control of 9/11-related asthma 10-11 years after the 2001 World Trade Center terrorist attacks. J. Asthma. 2015, 52, 630–637. [Google Scholar] [CrossRef] [PubMed] [Green Version]
- Xu, K.Y.; Goodman, E.; Goswami, R.; Crane, M.; Crowley, L.; Busse, P.; Katz, C.L.; Markowitz, S.; de la Hoz, R.E.; Jordan, H.T.; et al. Determinants of asthma morbidity in World Trade Center rescue and recovery workers. Ann. Allergy Asthma Immunol. Off. Publ. Am. Coll. Allergy Asthma Immunol. 2016, 117, 568–570. [Google Scholar] [CrossRef] [PubMed] [Green Version]
- de la Hoz, R.E.; Shohet, M.R.; Chasan, R.; Bienenfeld, L.A.; Afilaka, A.A.; Levin, S.M.; Herbert, R. Occupational toxicant inhalation injury: The World Trade Center (WTC) experience. Int. Arch. Occup. Environ. Health 2008, 81, 479–485. [Google Scholar] [CrossRef] [PubMed]
- Sumino, K.; Djukanovic, R.; Castro, M. Evaluation of the difficult-to-treat severe asthma patient in the clinic. Eur. Respir. Mon. 2011, 51, 16–27. [Google Scholar]
- Wyka, K.; Friedman, S.M.; Jordan, H.T. Probable PTSD and lower respiratory symptoms among rescue/recovery workers and community members after the 9/11 World Trade Center attacks-a longitudinal mediation analysis. Psychosom. Med. 2019, 82, 115–124. [Google Scholar] [CrossRef]
- Adeyeye, O.O.; Adewumi, T.A.; Adewuya, A.O. Effect of psychological and other factors on quality of life amongst asthma outpatients in Lagos, Nigeria. Respir. Med. 2017, 122, 67–70. [Google Scholar] [CrossRef] [Green Version]
- González-Freire, B.; Vázquez, I.; Pértega-Díaz, S. The Relationship of Psychological Factors and Asthma Control to Health-Related Quality of Life. J. Allergy Clin. Immunol. Pract. 2020, 8, 197–207. [Google Scholar] [CrossRef]
- Farfel, M.; DiGrande, L.; Brackbill, R.; Prann, A.; Cone, J.; Friedman, S.; Walker, D.J.; Pezeshki, G.; Thomas, P.; Galea, S. An overview of 9/11 experiences and respiratory and mental health conditions among World Trade Center Health Registry enrollees. J. Urban Health 2008, 85, 880–909. [Google Scholar] [CrossRef] [Green Version]
- Nathan, R.A.; Sorkness, C.A.; Kosinski, M.; Schatz, M.; Li, J.T.; Marcus, P.; Murray, J.J.; Pendergraft, T.B. Development of the asthma control test: A survey for assessing asthma control. J. Allergy Clin. Immunol. 2004, 113, 59–65. [Google Scholar] [CrossRef]
- Schatz, M.; Sorkness, C.A.; Li, J.T.; Marcus, P.; Murray, J.J.; Nathan, R.A.; Kosinski, M.; Pendergraft, T.B.; Jhingran, P. Asthma Control Test: Reliability, validity, and responsiveness in patients not previously followed by asthma specialists. J. Allergy Clin. Immunol. 2006, 117, 549–556. [Google Scholar] [CrossRef] [PubMed]
- Blanchard, E.B.; Jones-Alexander, J.; Buckley, T.C.; Forneris, C.A. Psychometric properties of the PTSD Checklist (PCL). Behav. Res. Ther. 1996, 34, 669–673. [Google Scholar] [CrossRef]
- Ventureyra, V.A.; Yao, S.N.; Cottraux, J.; Note, I.; De Mey-Guillard, C. The validation of the Posttraumatic Stress Disorder Checklist Scale in posttraumatic stress disorder and nonclinical subjects. Psychother. Psychosom. 2002, 71, 47–53. [Google Scholar] [CrossRef] [PubMed]
- Kroenke, K. Enhancing the clinical utility of depression screening. CMAJ 2012, 184, 281–282. [Google Scholar] [CrossRef] [Green Version]
- Monson, C.M.; Gradus, J.L.; Young-Xu, Y.; Schnurr, P.P.; Price, J.L.; Schumm, J.A. Change in posttraumatic stress disorder symptoms: Do clinicians and patients agree? Psychol. Assess 2008, 20, 131–138. [Google Scholar] [CrossRef] [PubMed]
- Stefanovics, E.A.; Rosenheck, R.A.; Jones, K.M.; Huang, G.; Krystal, J.H. Minimal Clinically Important Differences (MCID) in Assessing Outcomes of Post-Traumatic Stress Disorder. Psychiatr. Q. 2018, 89, 141–155. [Google Scholar] [CrossRef]
- Löwe, B.; Unützer, J.; Callahan, C.M.; Perkins, A.J.; Kroenke, K. Monitoring depression treatment outcomes with the patient health questionnaire-9. Med. Care 2004, 42, 1194–1201. [Google Scholar]
- Zahran, H.S.; Kobau, R.; Moriarty, D.G.; Zack, M.M.; Holt, J.; Donehoo, R. Health-related quality of life surveillance-United States, 1993–2002. MMWR Surveill Summ. 2005, 54, 1–35. [Google Scholar]
- Bateman, E.D.; Bousquet, J.; Keech, M.L.; Busse, W.W.; Clark, T.J.; Pedersen, S.E. The correlation between asthma control and health status: The GOAL study. Eur. Respir. J. 2007, 29, 56–62. [Google Scholar] [CrossRef] [Green Version]
- Yip, J.; Zeig-Owens, R.; Hall, C.B.; Webber, M.P.; Olivieri, B.; Schwartz, T.; Kelly, K.J.; Prezant, D.J. Health Conditions as Mediators of the Association Between World Trade Center Exposure and Health-Related Quality of Life in Firefighters and EMS Workers. J. Occup. Environ. Med. 2016, 58, 200–206. [Google Scholar] [CrossRef]
- Friedman, S.M.; Farfel, M.R.; Maslow, C.; Jordan, H.T.; Li, J.; Alper, H.; Cone, J.E.; Stellman, S.D.; Brackbill, R.M. Risk factors for and consequences of persistent lower respiratory symptoms among World Trade Center Health Registrants 10 years after the disaster. Occup. Environ. Med. 2016, 73, 676–684. [Google Scholar] [CrossRef] [PubMed] [Green Version]
- Jordan, H.T.; Friedman, S.M.; Reibman, J.; Goldring, R.M.; Miller Archie, S.A.; Ortega, F.; Alper, H.; Shao, Y.; Maslow, C.B.; Cone, J.E.; et al. Risk factors for persistence of lower respiratory symptoms among community members exposed to the 2001 World Trade Center terrorist attacks. Occup. Environ. Med. 2017, 74, 449–455. [Google Scholar] [CrossRef] [PubMed]
- Schatz, M.; Kosinski, M.; Yarlas, A.S.; Hanlon, J.; Watson, M.E.; Jhingran, P. The minimally important difference of the Asthma Control Test. J. Allergy Clin. Immunol. 2009, 124, 719–723.e1. [Google Scholar] [CrossRef]
- Norman, G.R.; Sloan, J.A.; Wyrwich, K.W. Interpretation of changes in health-related quality of life: The remarkable universality of half a standard deviation. Med. Care 2003, 41, 582–592. [Google Scholar] [CrossRef]
- Goodwin, R.D. Toward Improving Our Understanding of the Link between Mental Health, Lung Function, and Asthma Diagnosis. The Challenge of Asthma Measurement. Am. J. Respir. Crit. Care Med. 2016, 194, 1313–1315. [Google Scholar] [CrossRef] [PubMed]
- Goldman, M.D.; Saadeh, C.; Ross, D. Clinical applications of forced oscillation to assess peripheral airway function. Respir. Physiol. Neurobiol. 2005, 148, 179–194. [Google Scholar] [CrossRef] [PubMed]
- Rosenberg, S.L.; Miller, G.E.; Brehm, J.M.; Celedón, J.C. Stress and asthma: Novel insights on genetic, epigenetic, and immunologic mechanisms. J. Allergy Clin. Immunol. 2014, 134, 1009–1015. [Google Scholar] [CrossRef] [Green Version]
- Spitzer, C.; Koch, B.; Grabe, H.J.; Ewert, R.; Barnow, S.; Felix, S.B.; Ittermann, T.; Obst, A.; Volzke, H.; Glaser, S.; et al. Association of airflow limitation with trauma exposure and post-traumatic stress disorder. Eur. Respir. J. 2011, 37, 1068–1075. [Google Scholar] [CrossRef]
- Hasler, G.; Gergen, P.J.; Kleinbaum, D.G.; Ajdacic, V.; Gamma, A.; Eich, D.; Rossler, W.; Angst, J. Asthma and panic in young adults: A 20-year prospective community study. Am. J. Respir. Crit. Care Med. 2005, 171, 1224–1230. [Google Scholar] [CrossRef] [Green Version]
Publisher’s Note: MDPI stays neutral with regard to jurisdictional claims in published maps and institutional affiliations. |
© 2022 by the authors. Licensee MDPI, Basel, Switzerland. This article is an open access article distributed under the terms and conditions of the Creative Commons Attribution (CC BY) license (https://creativecommons.org/licenses/by/4.0/).