
Occurrence and Fate of Triclosan and Triclocarban in Selected Wastewater Systems across Durban Metropolis, KwaZulu-Natal, South Africa


Abstract
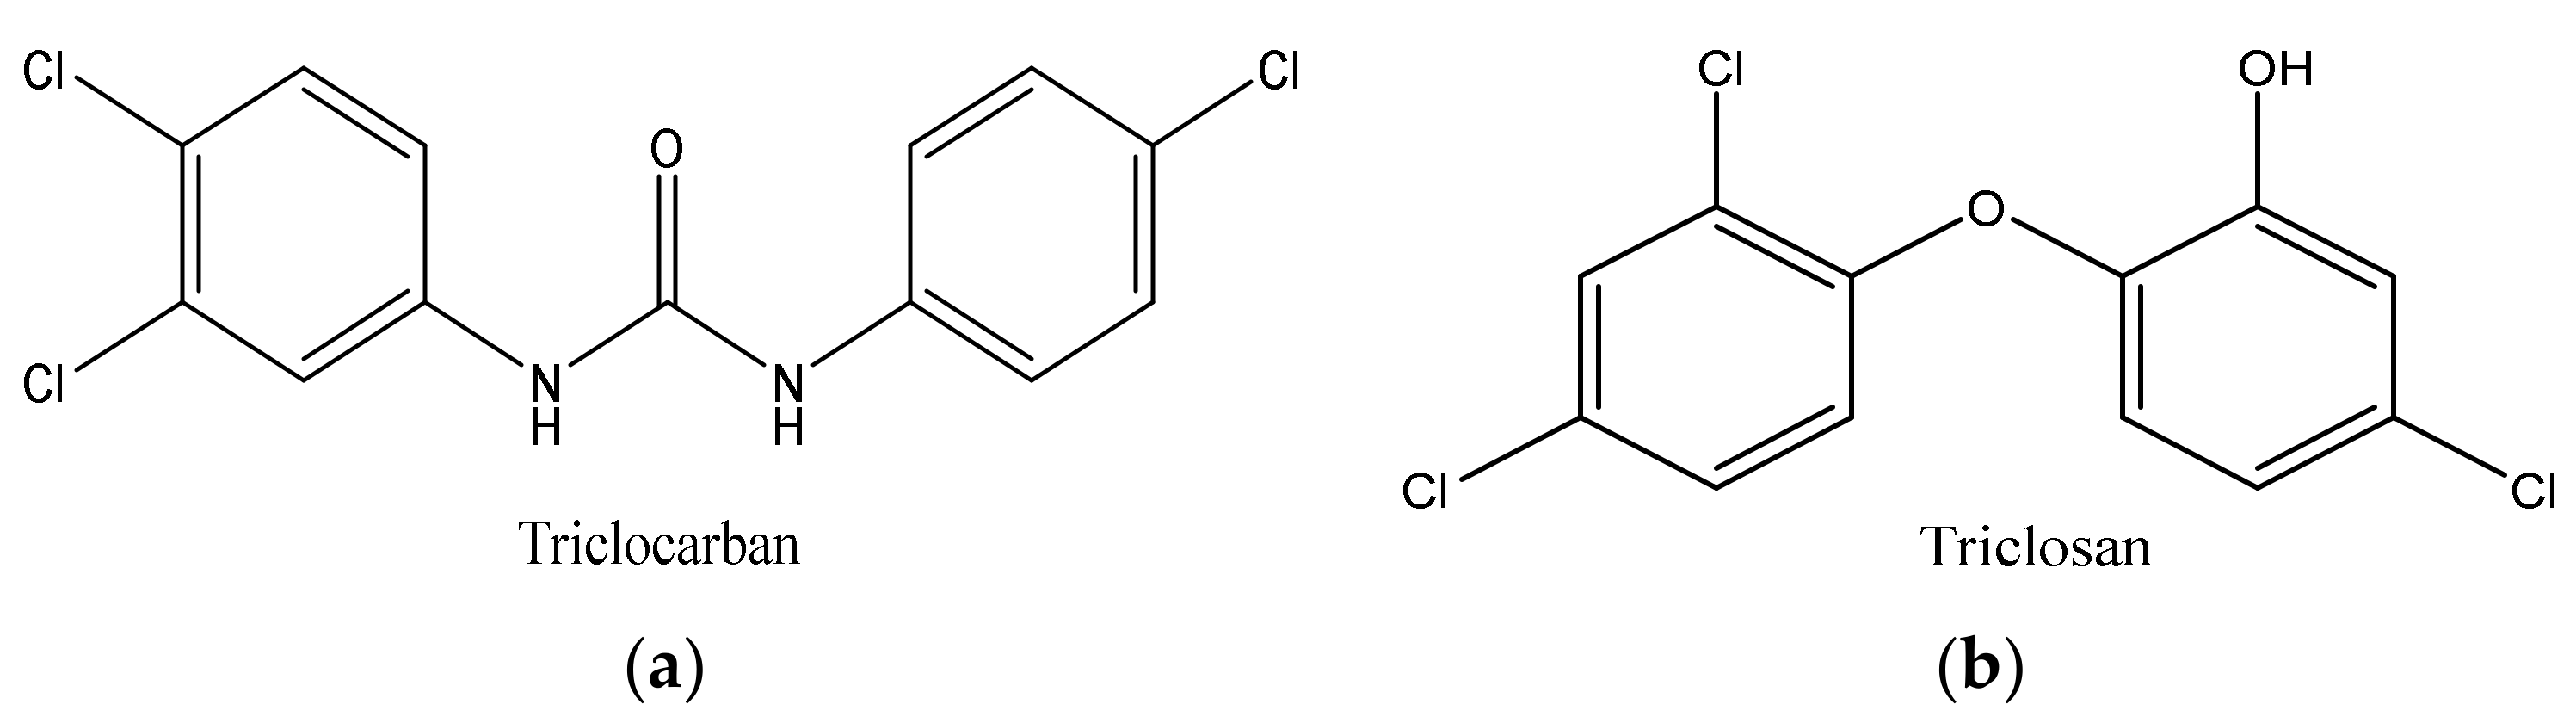
:1. Introduction
2. Materials and Method
2.1. Chemicals
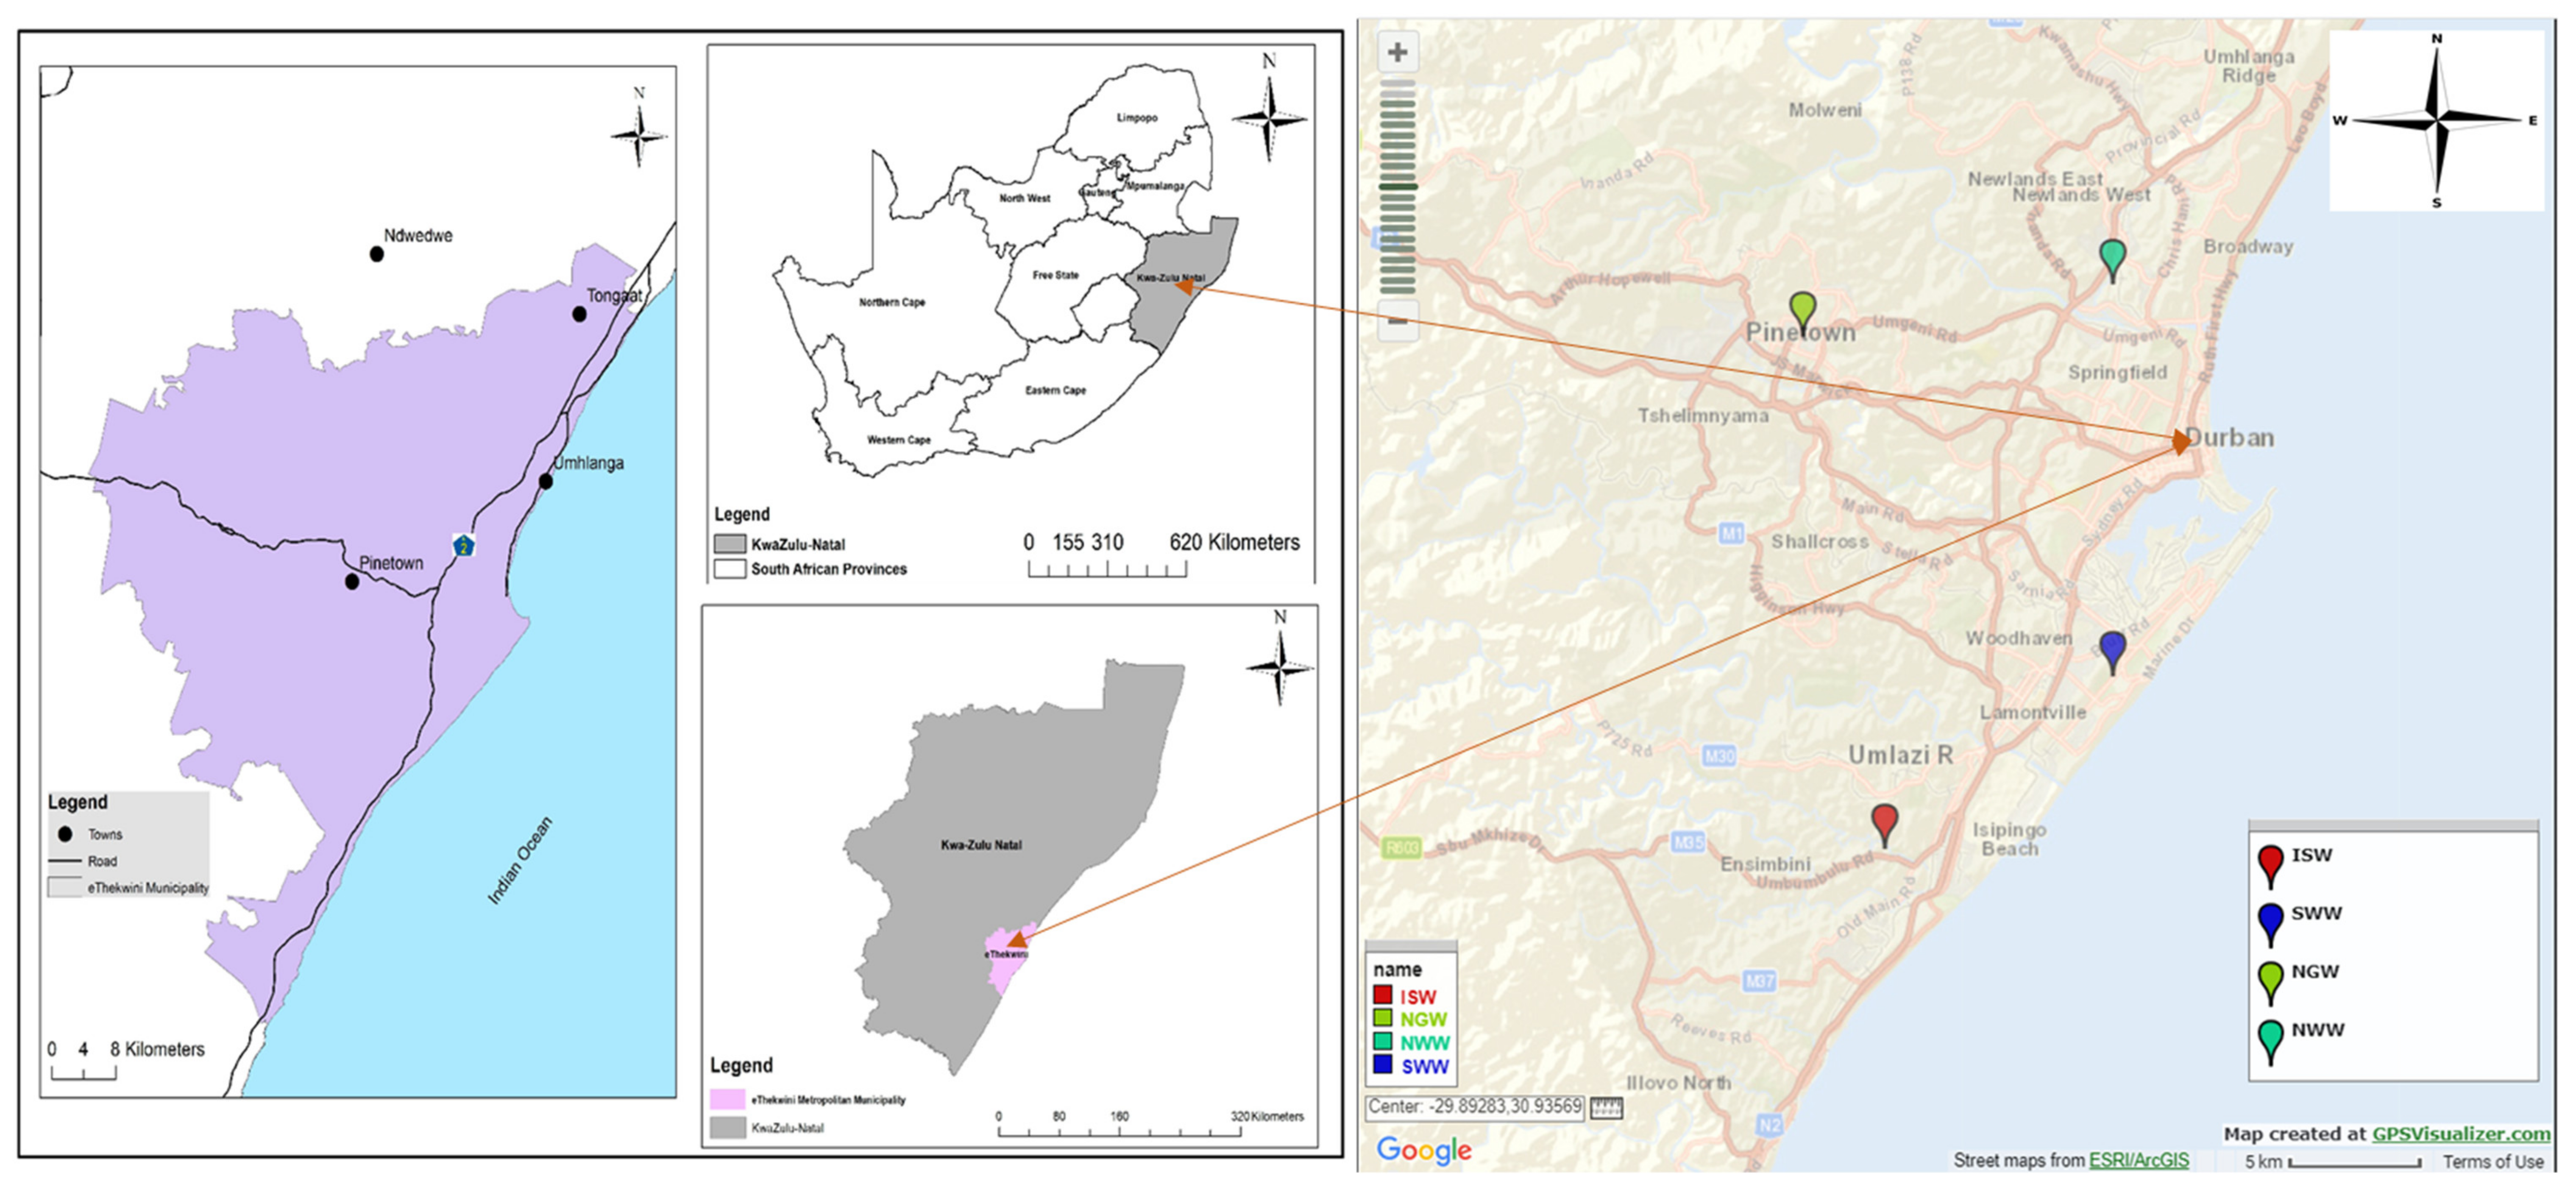
2.2. Description of the Study Location
2.3. Sample Collection
Influent, Effluent, and Sewage Sludge
2.4. Sample Extraction and Analysis
2.5. Quality Control Measures
2.6. Ecological Impact Assessment
3. Results and Discussion
3.1. Wastewater Sample Physicochemical Parameters

| Parameter | Sites/Reference | |||||||||
|---|---|---|---|---|---|---|---|---|---|---|
| ISW 1 | ISW 2 | SWW 1 | SWW 2 | SWW 3 | NGW 1 | NGW 2 | NWW 1 | NWW 2 | WHO Limit | |
| Ammonia (mg/L) | 30.15 | 3.93 | 37.70 | 29.10 | 41.66 | 32.43 | 30.74 | 36.86 | 40.80 | 0.25–32.5 |
| Chloride mg/L) | 59.14 | 57.86 | 125.14 | 64.97 | 270.41 | 82.20 | 80.18 | 68.06 | 79.31 | 200–250 |
| Phosphate (mg/L) | 3.43 | 2.49 | 2.56 | 3.29 | 7.22 | 0.67 | 0.88 | 4.82 | 8.20 | 0.05–0.10 |
| Conductivity (µs/cm) | 702 | 565 | 1220 | 813 | 1164 | 1059 | 802 | 901 | 982 | ≤400 |
| TDS (mg/L) | 344 | 277 | 598 | 399 | 571 | 519 | 393 | 442 | 482 | ≤300–600 |
| pH | 6.47 | 6.52 | 6.23 | 6.40 | 6.05 | 6.14 | 6.44 | 6.44 | 6.65 | 6.6–8.5 |
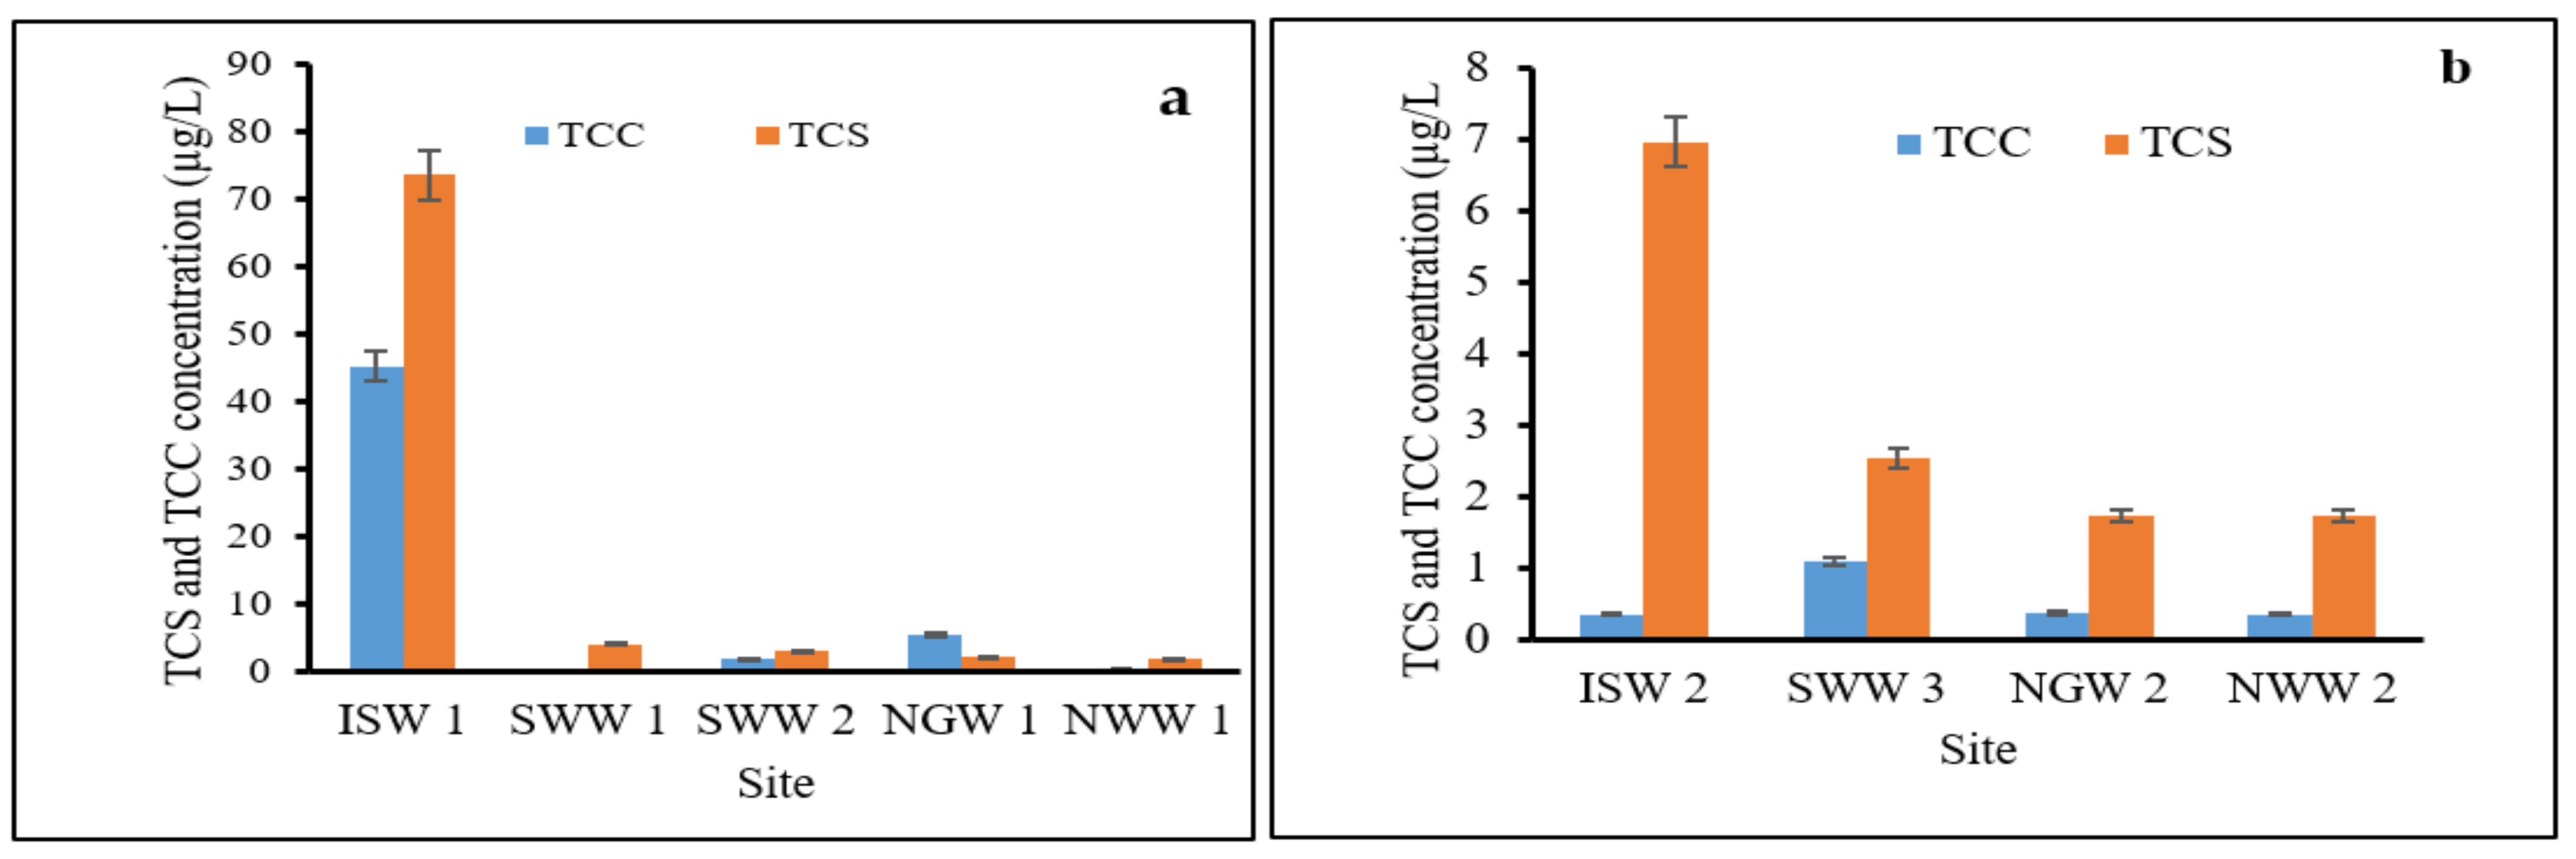
3.2. Levels of TCS and TCC in Sewage Influent and Effluent
3.3. Levels of TCS and TCC in Sludge Samples
3.4. Ecological Risk Assessment of TCS and TCC
3.5. Other Important Identified Compounds Found in the Wastewater Samples in This Study
4. Conclusions
Author Contributions
Funding
Institutional Review Board Statement
Informed Consent Statement
Data Availability Statement
Acknowledgments
Conflicts of Interest
References
- Akhtar, N.; Ishak, M.; Ahmad, M.; Umar, K.; Yusuff, M.M.; Anees, M.; Qadir, A.; Almanasir, Y.A. Modification of the Water Quality Index (WQI) Process for Simple Calculation Using the Multi-Criteria Decision-Making(MCDM) Method: A Review. Water 2021, 13, 905. [Google Scholar] [CrossRef]
- Sasakova, N.; Gregova, G.; Takacova, D.; Mojzisova, J.; Papajová, I.; Venglovsky, J.; Szaboova, T.; Kovacova, S. Pollution of Surface and Ground Water by Sources Related to Agricultural Activities. Front. Sustain. Food Syst. 2018, 2, 42. [Google Scholar] [CrossRef] [Green Version]
- Metcalf, L.; Eddy, H.P. Wastewater Engineering, Treatment and Reuse, 4th ed.; McGraw-Hill: New York, NY, USA, 2003; p. 25. [Google Scholar]
- Ricart, M.; Guasch, H.; Alberch, M. Triclosan persistence through wastewater treatment plants and its potential toxic effects on river biofilms. Aquatic Toxicol. 2010, 4, 346–353. [Google Scholar] [CrossRef] [PubMed]
- Wu, J.L.; Lam, N.P.; Martens, D.; Kettrup, A.; Cai, Z. Triclosan determination in water related to wastewater treatment. Talanta 2007, 72, 1650–1654. [Google Scholar] [CrossRef] [PubMed]
- Ying, G.G.; Kookana, R.S. Triclosan in wastewaters and biosolids from Australian wastewater treatment plants. Environ. Int. 2007, 33, 199–205. [Google Scholar] [CrossRef]
- Thompson, A.; Griffin, P.; Stuetz, R.; Cartmell, E. The Fate and Removal of Triclosan during Wastewater Treatment. Water Environ. Res. 2005, 77, 63. [Google Scholar] [CrossRef]
- Guerra, P.; Teslic, S.; Shah, A.; Albert, A.; Gewurtz, S.B.; Smyth, S.A. Occurrence and removal of triclosan in Canadian wastewater systems. Environ. Sci. Pollut. Res. 2019, 26, 31873–31886. [Google Scholar] [CrossRef] [PubMed]
- Cha, J.; Cupples, A.M. Detection of the antimicrobials triclocarban and triclosan in agricultural soils following land application of municipal biosolids. Water Res. 2009, 43, 2522–2530. [Google Scholar] [CrossRef]
- Dann, A.B.; Hontela, A. Triclosan: Environmental exposure, toxicity and mechanisms of action. J. Appl. Oxicol. 2011, 31, 285–311. [Google Scholar] [CrossRef]
- Dhillon, G.; Kaur, S.; Pulicharla, R.; Brar, S.; Cledón, M.; Verma, M.; Surampalli, R. Triclosan: Current status, occurrence, environmental risks and bioaccumulation potential. Int. J. Environ. Res. Public Health 2015, 12, 5657–5684. [Google Scholar] [CrossRef]
- ECCC; HC. Assessment Report: Triclosan. 978-0-660- 05976-1, Environment and Climate Change Canada and Health Canada. 2016. Available online: http://www.ec.gc.ca/ese-ees/65584A12-2B7D-4273-9F7A-38EDF916ECAF/EN%20FSAR%20Triclosan%20with%20ISBN.pdf (accessed on 1 March 2022).
- Halden, R.U.; Paull, D.H. Co-occurrence of triclocarban and triclosan in US Water Resources. Environ. Sci Technol. 2005, 39, 1420–1426. [Google Scholar] [CrossRef]
- Tran, T.M.; Trinh, H.T.; Anh, H.Q.; Le, T.V.; Le, S.N.; Minh, T.B. Characterization of triclosan and triclocarban in indoor dust from home micro-environments in Vietnam and relevance of non-dietary exposure. Sci. Total Environ. 2020, 732, 139326. [Google Scholar] [CrossRef]
- Lalonde, B.; Garron, C.; Dove, A.; Struger, J.; Farmer, K.; Sekela, M.; Gledhill, M.; Backus, S. Investigation of spatial distributions and temporal trends of triclosan in Canadian surface waters. Arch. Environ. Contam. Toxicol. 2019, 76, 231–245. [Google Scholar] [CrossRef]
- Lee, J.D.; Lee, J.Y.; Kwack, S.J.; Shin, C.Y.; Jang, H.-J.; Kim, H.Y.; Kim, M.K.; Seo, D.-W.; Lee, B.-M.; Kim, K.-B. Risk Assessment of Triclosan, a Cosmetic Preservative. Toxicol. Res. 2019, 35, 137–154. [Google Scholar] [CrossRef]
- Lehutso, R.F.; Daso, A.P.; Okonkwo, J.O. Occurrence and environmental levels of triclosan and triclocarban in selected wastewatertreatment plants in Gauteng Province, South Africa. Emerging Contam. 2017, 3, 107–114. [Google Scholar] [CrossRef]
- Lu, S.; Wang, N.; Ma, S.; Hu, X.; Kang, L.; Yu, Y. Parabens and triclosan in shellfish from Shenzhen coastal waters: Bioindication of pollution and human health risks. Environ. Pollut. 2019, 246, 257–263. [Google Scholar] [CrossRef]
- Brose, D.A.; Kumar, K.; Liao, A.; Hundal, L.H.; Tian, G.; Cox, A.; Zhang, H.; Podczerwinski, E.D. A reduction in triclosan and triclocarban in water resource recovery facilities’ influent, effluent, and biosolids following the U.S. Food and Drug Administration’s 2013 proposed rulemaking on antibacterial products. Water Environ. Res. 2019, 91, 715–721. [Google Scholar] [CrossRef]
- Abbott, T.; Kor-Bicakci, G.; Islam, M.S.; Eskicioglu, C. A Review on the Fate of Legacy and Alternative Antimicrobials and Their Metabolites during Wastewater and Sludge Treatment. Int. J. Mol. Sci. 2020, 21, 9241. [Google Scholar] [CrossRef]
- Beaver, D.J.; Roman, D.P.; Stooffel, P.J. The preparation and bacteriostatic activity of substituted ureas. J. Am. Chem Soc. 1957, 79, 1236–1245. [Google Scholar] [CrossRef]
- Black, J.G.; Howes, D.; Rutherford, T. Skin deposition and penetration of trichlorocarbanilide. Toxicology 1975, 3, 253–264. [Google Scholar] [CrossRef]
- Almqvist, H.; Hanæus, J. Organic Hazardous Substances in Graywater from Swedish Households. J. Environ. Eng. 2006, 132, 901–908. [Google Scholar] [CrossRef]
- Bedoux, G.; Roig, B.; Thomas, O.; Dupont, V.; Le Bot, B. Occurrence and toxicity of antimicrobial triclosan and by-products in the environment. Environ. Sci. Pollut. Res. Int. 2012, 19, 1044–1065. [Google Scholar] [CrossRef] [PubMed]
- Tran, N.H.; Reinhard, M.; Gin, K.Y.-H. Occurrence and fate of emerging contaminants in municipal wastewater treatment plants from different geographical regions-a review. Water Res. 2018, 133, 182–207. [Google Scholar] [CrossRef] [PubMed]
- Halden, R.U.; Lindeman, A.E.; Aiello, A.E.; Andrews, D.; Arnold, W.A.; Fair, P.; Fuoco, R.E.; Geer, L.A.; Johnson, P.I.; Lohmann, R.; et al. The florence statement on triclosan and triclocarban. Environ. Health Perspect. 2017, 125, 064501. [Google Scholar] [CrossRef]
- Santana, E.R.; Spinelli, A. Electrode modified with graphene quantum dots supported in chitosan for electrochemical methods and non-linear deconvolution of spectra for spectrometric methods: Approaches for simultaneous determination of triclosan and methylparaben. Microchim. Acta 2020, 187, 250. [Google Scholar] [CrossRef]
- Santana, E.R.; Martins, E.C.; Spinelli, A. Electrode modified with nitrogen-doped graphene quantum dots supported in chitosan for triclocarban monitoring. Microchem. J. 2021, 167, 106297. [Google Scholar] [CrossRef]
- Dong, X.; Xu, H.; Wu, X.; Yang, L. Multiple bioanalytical method to reveal developmental biological responses in zebrafish embryos exposed to triclocarban. Chemosphere 2018, 193, 251–258. [Google Scholar] [CrossRef]
- Vimalkumar, K.; Seethappan, S.; Pugazhendhi, A. Fate of triclocarban (TCC) in aquatic and terrestrial systems and human exposure. Chemosphere 2019, 230, 201–209. [Google Scholar] [CrossRef]
- Ahn, K.C.; Zhao, B.; Chen, J.; Cherednichenko, G.; Sanmarti, E.; Denison, M.S.; Lasley, B.; Pessah, I.N.; Kultz, D.; Chang, D.P.; et al. In vitro biologic activities of the antimicrobials triclocarban, its analogs, and triclosan in bioassay screens: Receptor-based bioassay screens. Environ. Health Perspect. 2008, 116, 1203–1210. [Google Scholar] [CrossRef] [Green Version]
- Routledge, E.J.; Parker, J.; Odum, J.; Ashby, J.; Sumpter, J.P. Some alkyl hydroxyl benzoate preservatives (parabens) are estrogenic. Toxicol. Appl. Pharmacol. 1998, 153, 12–19. [Google Scholar] [CrossRef]
- Brausch, J.M.; Rand, G.M. A review of personal care products in the aquatic environment: Environmental concentrations and toxicity. Chemosphere 2011, 82, 1518–1532. [Google Scholar] [CrossRef]
- Chalew, T.E.; Halden, R.U. Environmental exposure of aquatic and terrestrial biota to triclosan and triclocarban1. JAWRA. J. Am. Water Resour. Assoc. 2009, 45, 4–13. [Google Scholar] [CrossRef] [Green Version]
- Madsen, T.; Boyd, H.B.; Nylén, D.; Pedersen, A.R.; Petersen, G.I.; Simonsen, F. Environmental and health assessment of substances in household detergents and cosmetic detergent products. Environ. Chang. Secur. Proj. Rep. 2001, 615, 221. [Google Scholar]
- Ethekwini Municipality. Environmental Impact Assessment Process; KZN DAEA REF NO.: DM/0032/2014 and DM/WML/0050/2014 Royal HaskoningDHV; Ethekwini Municipality: KwaZulu-Natal, South Africa, 2014.
- DWAF (Department of Water Affairs and Forestry). First Order Assessment of Wastewater Treatment Works in KwaZulu-Natal; DWAF: Pretoria, South Africa, 2009.
- Msiya, N.; Mukhadi, F. Investigating the Capacity of the Wastewater Treatment Plants in the eThekwini Municipality. 2022. Available online: https://www.researchgate.net/publication/358672719_Investigating_the_capacity_of_the_waste_water_treatment_plants_in_the_eThekwini_Municipality (accessed on 10 April 2022).
- Lozano, N.; Rice, C.P.; Ramirez, M.; Torrents, A. Fate of Triclocarban, Triclosan and Methyltriclosan during wastewater and biosolids treatment processes. Water Res. 2013, 47, 4519–4527. [Google Scholar] [CrossRef]
- European Chemicals Bureau. European Commission Technical Guidance Document in Support of Commission Directive 93/67/EEC on Risk Assessment for New Notified Substances and Commission Regulation (EC) No. 1488/94 on Risk Assessment for Existing Substances and Directive 98/8/EC of the European Parliament and of the Council Concerning the Placing of Biocidal Products on the Market. Off. J. Eur. Comm. EUR 20418 EN/1. 2003. Available online: http://publications.jrc.ec.europa.eu/repository/bitstream/111111111/5395/1/EUR%2020784%20EN.pdf (accessed on 15 April 2022).
- Musee, N. Environmental risk assessment of triclosan and triclocarban from personal care products in South Africa. Environ. Pollut. 2018, 242, 827–838. [Google Scholar] [CrossRef]
- Olaniyan, L.W.B.; Okoh, A.I. Determination and ecological risk assessment of two endocrine disruptors from River Buffalo, South Africa. Environ. Monit. Assess. 2020, 192, 1–15. [Google Scholar] [CrossRef]
- Ying, L.; Ai-jun, G.; Jing, Z. Study of Treating High Ammonia-N Domestic Wastewater with CASS Process. Procedia Environ. Sci. 2011, 11, 858–863. [Google Scholar] [CrossRef] [Green Version]
- Constable, M.; Charlton, M.; Jensen, F.; McDonald, K.; Craig, G.; Taylor, K. An ecological risk assessment of ammonia in the aquatic environment. Hum. Ecol. Risk Assess. 2003, 9, 527–548. [Google Scholar] [CrossRef]
- Milne, I.; Seager, J.; Mallett, M.; Sims, I. Effects of short-term pulsed ammonia exposure on fish. Environ. Toxicol. Chem. 2000, 19, 2929–2936. [Google Scholar] [CrossRef]
- USEPA. Update of Ambient Water Quality Criteria for Ammonia; EPA-822-R-99-014; U.S. Environmental Protection Agency: Washington, DC, USA, 1999; p. 153.
- DWA. Management of the Water Resources of the Republic of South. Africa; Department of Water Affairs: Pretoria, South Africa, 1986; p. 126.
- Ashtow, P.J.; O’Keeffe, J.H.; Van Ginkel, C.E.; Hughes, D.A.; Hill, T.R. WRC Report No. 405/1/96; WRC: Pretoria, South Africa, 1996; pp. 32–47. [Google Scholar]
- Hem, D. Study and Interpretation the Chemical of Natural of Characteristics Natural Water, 3rd ed.; USGS Water Supply Paper 2254 66-69; US Govt Printing Office: Washington, DC, USA, 1985; p. 205.
- Kumar, S.K.; Logeshkumaran, A.; Magesh, N.S.; Godson, P.S.; Chandrasekar, N. Hydrogeochemistry and application of water quality index (WQI) for groundwater quality assessment, Anna Nagar, part of Chennai City, Tamil Nadu, India. Appl. Water Sci. 2015, 5, 335–343. [Google Scholar] [CrossRef] [Green Version]
- Marandi, A.; Polikarpus, M.; Jõeleht, A. A new approach for describing the relationship between electrical conductivity and major anion concentration in natural waters. Appl. Geochem. 2013, 38, 103–109. [Google Scholar] [CrossRef]
- Meride, Y.; Ayenew, B. Drinking water quality assessment and its effects on residents health in Wondo genet campus, Ethiopia. Environ. Syst. Res. 2016, 5, 1–7. [Google Scholar] [CrossRef] [Green Version]
- Bester, K. Fate of triclosan and triclosan-methyl in sewage treatment plants and surface water. Arch. Environ. Contam. Toxicol. 2005, 49, 9–17. [Google Scholar] [CrossRef] [PubMed]
- Kumar, K.S.; Priya, S.M.; Peck, A.M.; Sajwan, K.S. Mass loadings of triclosan and triclocarban from four wastewater treatment plants to three rivers and landfill in Savannah, Georgia, USA. Arch. Environ. Contam. Toxicol. 2010, 58, 275–285. [Google Scholar] [CrossRef]
- Heidler, J.; Sapkota, A.; Halden, R.U. Partitioning, persistence, and accumulation in digested sludge of the topical antiseptic triclocarban during wastewater treatment. Environ. Sci. Technol. 2006, 40, 3634–3639. [Google Scholar] [CrossRef] [Green Version]
- Armstronga, D.L.; Lozanoa, N.; Ricec, C.P.; Ramirezd, M.; Torrentsa, A. Degradation of triclosan and triclocarban and formation of transformation products in activated sludge using benchtop bioreactors. Environ. Res. 2018, 161, 17–25. [Google Scholar] [CrossRef]
- Pycke, B.; Roll, I.; Brownawell, B.; Kinney, C.A.; Furlong, E.T.; Kolpin, D.W.; Halden, R.U. Transformation Products and Human Metabolites of Triclocarban and Triclosan in Sewage Sludge across the United States. Environ. Sci. Technol. 2014, 48, 7881–7890. [Google Scholar] [CrossRef]
- Federle, T.W.; Kaiser, S.K.; Nuck, B.A. Fate and effects of triclosan in activated sludge. Environ. Toxicol. Chem. 2002, 21, 1330–1337. [Google Scholar] [CrossRef]
- Boyd, G.R.; Reemtsma, H.; Grimm, D.A.; Mitra, S. Pharmaceuticals and personal care products (PPCPs) in surface and treated waters of Lousiana, USA and Ontario, Canada. Sci. Total Environ. 2003, 311, 135–149. [Google Scholar] [CrossRef]
- Sapkota, A.; Heidler, J.; Halden, R.U. Detection of triclocarbon and two co-contaminating chlorocarbanilides in US aquatic environments using isotope dilution liquid chromatography tandem mass spectrometry. Chemosphere 2007, 103, 21–29. [Google Scholar]
- Zheng, G.; Yu, B.; Wang, Y.; Ma, C.; Chen, T. Fate and biodegradation characteristics of triclocarban in wastewater treatment plants and sewage sludge composting processes and risk assessment after entering the ecological environment. J. Hazard. Mat. 2021, 412, 125270. [Google Scholar] [CrossRef]
- Zhu, Q.; Jia, J.; Wang, Y.; Zhang, K.; Zhang, H.; Liao, C.; Jiang, G. Spatial distribution of parabens, triclocarban, triclosan, bisphenols, and tetrabromobisphenol A and its alternatives in municipal sewage sludges in China. Sci. Total Environ. 2019, 679, 61–69. [Google Scholar] [CrossRef]
- Tran, N.H.; Chen, H.; Reinhard, M.; Mao, F.; Gin, K.Y. Occurrence and removal of multiple classes of antibiotics and antimicrobial agents in biological wastewater treatment processes. Water Res. 2016, 104, 461–472. [Google Scholar] [CrossRef]
- SCCS Scientific Committee on Consumer Safety. Opinion on: Triclosan Antimicrobial, Resistance (SCCP/1251/09). Adopted by the SCCP during the 7th Plenary on 22 June 2010. Available online: http://ec.europa.eu/health/scientific_committees/consumer_safety/docs/sccs_s_004.pdf (accessed on 12 April 2022).
- Waltman, E.L.; Venables, B.J.; Waller, W.Z. Triclosan in a North Texas Wastewater Treatment Plant and the Influent and Effluent of an Experimental Constructed Wetland. Environ. Toxicol. Chem. 2006, 25, 367–372. [Google Scholar] [CrossRef] [Green Version]
- Gasperi, J.; Geara, D.; Lorgeoux, C.; Bressy, A.; Zedek, S.; Rocher, V.; El Samrani, A.; Chebbo, G.; Moilleron, R. First assessment of triclosan, triclocarban and paraben mass loads at a very large regional scale: Case of Paris conurbation (France). Sci. Total Environ. 2014, 493, 854–861. [Google Scholar] [CrossRef] [Green Version]
- Hernando, M.D.; Mezcua, M.; Fernández, A.R.; Alba, D. Barceló, Environmental risk assessment of pharmaceutical residues in wastewater effluents, surface waters and sediments. Talanta 2006, 69, 334–342. [Google Scholar] [CrossRef]
- Chen, F.; Ying, G.G.; Ma, Y.B.; Chen, Z.F.; Lai, H.J.; Peng, F.J. Field dissipation and risk assessment of typical personal care products TCC, TCS, AHTN and HHCB in biosolid-amended soils. Sci. Total Environ. 2014, 470–471, 1078–1086. [Google Scholar] [CrossRef]
- Caballero, B.; Finglas, P.; Toldra, F. Encyclopedia of Food and Health; Elsevier Science: Amsterdam, The Netherlands, 2015; p. 561. ISBN 978-0-12-384953-3. [Google Scholar]
- Kleywegt, S.; Payne, M.; Ng, F.; Fletcher, T. Environmental loadings of Active Pharmaceutical Ingredients from manufacturing facilities in Canada. Sci. Total Environ. 2019, 646, 257–264. [Google Scholar] [CrossRef]
- Dafouz, R.; Caceres, N.; Rodriguez-Gil, J.L.; Mastroianni, N.; Lopez de Alda, M.; Barcelo, D.; de Miguel, Á.G.; Valcárcel, Y. Does the presence of caffeine in the marine environment represent an environmental risk? A regional and global study. Sci. Total Environ. 2018, 615, 632–642. [Google Scholar] [CrossRef]
- Li, S.; He, B.; Wang, J.; Liu, J.; Hu, X. Risks of caffeine residues in the environment: Necessity for a targeted ecopharmacovigilance program. Chemosphere 2020, 243, 125343. [Google Scholar] [CrossRef]
- Almeida Eduardo, S.; Portela Flaysner, M.; Sousa Raquel, M.F.; Daniel Daniela, T.; Manuel, G.H.; Richter, E.M.; Muñoz Rodrigo, A.A. Behaviour of the antioxidant tert-butylhydroquinone on the storage stability and corrosive character of biodiesel. Fuel 2011, 90, 3480–3484. [Google Scholar] [CrossRef] [Green Version]
- Gharavi, N.; El-Kadi, A. tert-Butylhydroquinone is a novel aryl hydrocarbon receptor ligand. Drug Metab. Dispos. 2005, 33, 365–372. [Google Scholar] [CrossRef] [PubMed] [Green Version]
- Hirose, M.; Yada, H.; Hakoi, K.; Takahashi, S.; Ito, N. Modification of carcinogenesis by -tocopherol, t-butylhydro-quinone, propyl gallate and butylated hydroxytoluene in a rat multi-organ carcinogenesis model. Carcinogenesis 1993, 14, 2359–2364. [Google Scholar] [CrossRef]
- (NLM) National Library of Medicine. T-BUTYLHYDROQUINONE, HSDB -Database. 2019; pp. 11–21. Available online: toxnet.nlm.nih.gov (accessed on 13 April 2022).
- Ascenzi, J.M. Chloroxylenol: An old-new antimicrobial. In Handbook of Disinfectants and Antiseptics; M. Dekker: New York, NY, USA, 1996; ISBN 978-0-8247-9524-5. Archived from the original on 23 September 2017. [Google Scholar]
- Ijaz, K.; Whitehead, K.; Srinivasan, V.; Jones, C.; Nims, R.; Charlesworth, B. Microbicidal actives with virucidal efficacy against SARS-CoV-2. Am. J. Infect. Control. 2020, 48, 972–973. [Google Scholar] [CrossRef] [PubMed]
- Wilson, M.; Mowad, C. Chloroxylenol., Dermatitis: Contact, atopic, occupational, drug. Dermatitis 2007, 18, 120–121. [Google Scholar]
- Malaveille, C.; Brun, G.; Bartsch, H. Structure-activity studies in E. coli strains on ochratoxin A (OTA) and its analogues implicate a genotoxic free radical and a cytotoxic thiol derivative as reactive metabolites. Mutat. Res. 1994, 307, 141–147. [Google Scholar] [CrossRef]
- UNEP Publication, (OECD SIDS, 1995). SIDS Initial Assessment Report For SIAM 3 Williamsburg, Virginia, 13–16 February 1995. Available online: http://www.chem.unep.ch/irptc/invent/igo.html (accessed on 15 April 2022).
- Staples, C.; van der Hoeven, N.; Clark, K.; Mihaich, E.; Woelz, J.; Hentges, S. Distributions of concentrations of bisphenol A in North American and European surface waters and sediments determined from 19 years of monitoring data. Chemosphere 2018, 201, 448–458. [Google Scholar] [CrossRef] [PubMed]
- Abraham, A.; Chakraborty, P. A review on sources and health impacts of bisphenol A. Rev. Environ. Health. 2019, 35, 201–210. [Google Scholar] [CrossRef] [PubMed]
- Lang, I.A.; Galloway, T.S.; Scarlett, A.; Henley, W.E.; Depledge, M.; Wallace, R.B. Association of urinary bisphenol A concentration with medical disorders and laboratory abnormalities in adults. J. Am. Med. Assoc. 2008, 300, 1303–1310. [Google Scholar] [CrossRef] [PubMed]
- Maria, E.; Costa, F.; Spritzer, P.M.; Hohl, A.; Bachega, T. Effects of endocrine disruptors in the development of the female reproductive tract. Arq. Bras. Endocrinol. Metab. 2014, 58, 153–161. [Google Scholar]
- Kabir, E.R.; Rahman, M.S.; Rahman, I. A review on endocrine disruptors and their possible impacts on human health. Environ. Toxicol. Pharmacol. 2015, 40, 241–258. [Google Scholar] [CrossRef]
- Osborne, G.; Rudel, R.; Schwarzman, M. Evaluating chemical effects on mammary gland development: A critical need in disease prevention. Reprod. Toxicol. 2015, 54, 148–155. [Google Scholar] [CrossRef] [Green Version]
- Ejaredar, M.; Lee, Y.; Roberts, D.J.; Sauve, R.; Dewey, D. Bisphenol A exposure and children’s behavior: A systematic review. J. Expo. Sci. Environ. Epidemiol. 2017, 27, 175–183. [Google Scholar] [CrossRef]
- Rubin, B.S.; Murray, M.K.; Damassa, D.A.; King, J.C.; Soto, A.M. Perinatal exposure to low doses of bisphenol A affects body weight, patterns of estrous cyclicity, and plasma LH levels. Environ. Health Perspect. 2001, 109, 675–680. [Google Scholar] [CrossRef]
- Aalto-Korte, K.; Alanko, K.; Henriks-Eckerman, M.L.; Estlander, T.; Jolanki, R. Allergic contact dermatitis from bisphenol A in PVC gloves. Contact Dermat. 2003, 49, 202–205. [Google Scholar] [CrossRef]

| Literature | TCS | TCC | ||||
|---|---|---|---|---|---|---|
| Influent (µg/L) | Effluent (µg/L) | Sludge (µg/kg) | Influent (µg/L) | Effluent (µg/L) | Sludge (µg/kg) | |
| This study (2022), Durban, S.A | 1.906–73.462 | 1.732–6.980 | 0.138–2.455 | 0.320–45.261 | <LOQ–1.103 | 0.107–8.827 |
| [64], Luxembourg | 0.02 -86.161 | 0.023–5.370 | 580–15600 | - | - | - |
| [8], Canada | 0.289–33.500 | 0.030–1.390 | - | - | - | - |
| [62], China | - | - | - | - | - | 2350.0 |
| [17], S.A | 2.10–17.60 | 0.990–13.00 | 3.70–15.00 | 0.0860–2.84 | <LOQ–1.89 | 3.65–11.8 |
| [65], North Texas, USA | 26.8 | 0.25 | - | - | - | - |
| [61], Zhengzhou, China | - | - | - | 0.731–0.812 | - | 1430.1–1663.8 |
| [55], USA | - | - | - | 6.10 | 0.170 | - |
| [66], Paris, France | - | - | - | 0.097–0.140 | BDL | - |
| [63], Singapore | 0.341–0.744 | 0.0285–0.046 | - | 0.424–0.934 | 0.143–0.215 | - |
| Sample | Influent RQ | Effluent RQ | |||||||
|---|---|---|---|---|---|---|---|---|---|
| ISW 1 | SWW 1 | SWW 2 | NGW 1 | NWW 1 | ISW 2 | SWW 3 | NGW 2 | NWW 2 | |
| TCC | 6.036 × 101 | 4.30 × 10⁻² | 2.61 × 10⁻¹ | 7.41 × 10⁻¹ | 7.90 × 10⁻² | 4.60 × 10⁻² | 1.47 × 10⁻¹ | 5.0 × 10⁻² | 4.60 × 10⁻² |
| TCS | 1.75 × 10² | 9.82 × 10⁻¹ | 7.23 × 10⁻¹ | 5.33 × 10⁻¹ | 4.54 × 10⁻¹ | 1.66 × 101 | 6.05 × 10⁻¹ | 4.15 × 10⁻¹ | 4.12 × 10⁻¹ |
| RI | 1.17 × 101 | 5.12 × 10⁻¹ | 4.92 × 10⁻¹ | 6.37 × 10⁻¹ | 2.66 × 10⁻¹ | 8.54 × 10⁻¹ | 3.76 × 10⁻¹ | 2.32 × 10⁻¹ | 2.23 × 10⁻¹ |
| Identified Compounds | Properties | Sources and Application | Environmental and Health Impacts |
|---|---|---|---|
Caffeine (C8H10N4O2) | Caffeine is a potent stimulant with a direct effect on the central nervous system. It has a high water solubility of 20.17 g/L (25 °C) | Caffeine is commonly found across the world in some plant parts such as seeds, fruits, nuts, or leaves [69]. Caffeinated drinks and foods also contain substantial amounts of caffeine and are used widely as an ingredient in some over-the-counter medications such as analgesics, stimulants, illegal drugs, and cold medicines [70]. It enters surface water primarily through wastewater effluent through anthropogenic sources [71]. | When present within the environmentally relevant concentrations, caffeine can pose serious effects on aquatic life. Such effects include lethality, decreasing general stress, inducing oxidative stress and lipid peroxidation, affecting energy reserves and metabolic activity, neurotoxic effects, and affecting reproduction and development [72]. |
Tert butylhydroquinone (C10H14O2) | Tert butylhydroquinone is a good antioxidant that is extensively used as a preservative. It is soluble in water less than 1 g/L (18 °C). | Tert butylhydroquinone finds wider application as a fixative agent in perfumery. It is an important agent commonly applied as an antioxidant in biodiesel and used as a stabilizer to inhibit autopolymerisation of organic peroxides [73]. The industrial effluent discharge could serve as a point source to TBHQ into the surface water or leach into the groundwater through sludge, which is used as fertilizer. | Tert butylhydroquinone may be carcinogenic when expose to prolonged very high doses. (Gharavi and Kadi [74], especially for stomach tumors [75]). Reports had also shown that exposure to tert butylhydroquinone could result in visual disturbances. [76]. |
Chloroxylenol (C8H9OCl) | Chloroxylenol is an antimicrobial agent commonly used in many cosmetic products. Freely soluble in an organic solvent but fairly soluble in water (0.03 wt%). | The dermal and gastrointestinal tract is the common route of exposure to chloroxylenol in humans. It is frequently used as a disinfectant and for sanitation in hospitals and households. Other important applications are antibacterial soaps, wound-cleansing applications, and household antiseptics [77]. A recent investigation has shown products containing chloroxylenol are effective against the SARS-CoV-2 virus [78]. The use of chloroxylenol in these products can end up in surface water through sewage generated from domestic, industrial, and hospital waste. | Chloroxylenol has been reported to be moderately toxic to freshwater invertebrates and highly toxic to fish [79]. It can generate active species that can cause cancer [80]. |
Phenol, 4-(1,1,3,3-tetramethylbutyl) (C14H22O) | Phenol is commonly produced via a catalytic reaction involving phenol and diisobutylene at high temperatures. It has a high water solubility of 19 mg/L at 22 °C. | The main route of phenol, 4-(1,1,3,3-tetramethyl butyl) is produced through the catalytic reaction of phenol with diisobutylene at temperatures from 80 to 100 °C in a closed system. Octylphenol ethoxylates are used as a surfactant in detergents and cleaning agents, and maybe degraded back to its by-products in an aquatic environment. | Its acute toxicity to human health with slight skin irritation could be highly irritating to the eyes. It may lead to skin depigmentation but is not genotoxic. Displacement of 17-β-estradiol from its receptors in a competitive manner is possible and it can also promote cell proliferation in estrogen-dependent cells [81]. |
Dimethyl-bisphenol A (C17H20O2)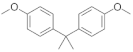 | Dimethyl-bisphenol A is an industrial chemical that has been extensively used for the production of certain plastics and resins since the 1950s. It has a moderate water solubility of 120–300 mg/L at 25 °C) | Dimethyl-bisphenol A is essentially found in polycarbonate plastics and epoxy resins. Diet has been a major exposure route to dimethyl-bisphenol A for humans [82]. Other possible sources of exposure include air, dust, and water. A larger percentage of dimethyl-bisphenol A exposure occurs through daily human food and beverages [83]. Its moderate water solubility (120–300 mg/L at 25 °C) enables either its release into the effluent from domestic or industrial manufacturing units using bisphenol A-based products. | It is an endocrine disruptor. It can also imitate body hormones in a way that could be hazardous to health. Its impacts on humans include cardiovascular problems [84], reproductive effects [85], mammary gland and developmental problems, low sperm production, and fetal growth restriction [85,86,87]. Other effects include anxiety and depression, obesity [88,89], hormone-related cancers such as breast cancer or prostate cancer, and allergic contact dermatitis [86,90]. |
Publisher’s Note: MDPI stays neutral with regard to jurisdictional claims in published maps and institutional affiliations. |
© 2022 by the authors. Licensee MDPI, Basel, Switzerland. This article is an open access article distributed under the terms and conditions of the Creative Commons Attribution (CC BY) license (https://creativecommons.org/licenses/by/4.0/).
Share and Cite
Bakare, B.F.; Adeyinka, G.C. Occurrence and Fate of Triclosan and Triclocarban in Selected Wastewater Systems across Durban Metropolis, KwaZulu-Natal, South Africa. Int. J. Environ. Res. Public Health 2022, 19, 6769. https://doi.org/10.3390/ijerph19116769
Bakare BF, Adeyinka GC. Occurrence and Fate of Triclosan and Triclocarban in Selected Wastewater Systems across Durban Metropolis, KwaZulu-Natal, South Africa. International Journal of Environmental Research and Public Health. 2022; 19(11):6769. https://doi.org/10.3390/ijerph19116769
Chicago/Turabian StyleBakare, Babatunde Femi, and Gbadebo Clement Adeyinka. 2022. "Occurrence and Fate of Triclosan and Triclocarban in Selected Wastewater Systems across Durban Metropolis, KwaZulu-Natal, South Africa" International Journal of Environmental Research and Public Health 19, no. 11: 6769. https://doi.org/10.3390/ijerph19116769
APA StyleBakare, B. F., & Adeyinka, G. C. (2022). Occurrence and Fate of Triclosan and Triclocarban in Selected Wastewater Systems across Durban Metropolis, KwaZulu-Natal, South Africa. International Journal of Environmental Research and Public Health, 19(11), 6769. https://doi.org/10.3390/ijerph19116769