Article

Analysis of the Mediating Role of Psychological Empowerment between Perceived Leader Trust and Employee Work Performance

CAS Key Laboratory of Behavioral Science, Institute of Psychology, Chinese Academy of Sciences, Beijing 100101, China
*
Author to whom correspondence should be addressed.
Int. J. Environ. Res. Public Health 2022, 19(11), 6712; https://doi.org/10.3390/ijerph19116712
Submission received: 19 March 2022 / Revised: 17 May 2022 / Accepted: 25 May 2022 / Published: 31 May 2022
(This article belongs to the Section Mental Health)

Abstract

:
High levels of trust between employees and leaders moderate the relationship between organizational management practices. A collaborative environment encourages employees to have more Psychological Empowerment, which in turn leads to better performance. Based on Intrinsic Work Motivation and Self-Evaluation, this paper uses Perceived Leader Trust as an independent variable, Employee Work Performance as a dependent variable, and introduces Psychological Empowerment to explore the internal mechanism of perceived trust. This paper proposes a total of 28 hypotheses, and 25 hypotheses have been verified. The specific research conclusions are as follows: (1) Perceived Leader Trust has a positive impact on Employee Work Performance. (2) Perceived Leader Trust positively affects employees’ Psychological Empowerment. Perceived Leader Dependence has a significant impact on all dimensions of Psychological Empowerment, but the relationship between Perceived Information Disclosure and Work Meaning is not significant. (3) Psychological Empowerment is positively correlated with Employee Work Performance, in which the four dimensions of Psychological Empowerment are significantly related to Employee Task Performance, while Work Meaning and Autonomy are not significantly related to Employee Relationship Performance. (4) Psychological Empowerment, as the overall perception of employees, plays a partial mediating role between Perceived Leader Trust and Employee Work Performance. This paper verifies the role of Psychological Empowerment between Perceived Leader Trust and Employee Work Performance, and explores the internal mechanism of Perceived Leader Trust from the perspective of employees’ Intrinsic Work Motivation, which promotes the development of organizational management practices.

1. Introduction

In recent years, interpersonal trust in organizations has become an increasingly important research topic. Especially with the rapidly changing business environment and increasing global competitive pressure, organizations face increasing uncertainty in the course of doing business [1]. Companies have now realized that human resources are the key to improving organizational competitiveness, and one of the most important challenges managers face is to build organizational trust at all levels by allowing employees to participate in organizational issues [2,3].
In organizational management, there are two types of trust that have an important impact on employees’ attitudes and behaviors, namely upward trust and downward trust [4]. Employees’ perception of their leaders’ trust is an important type of trust that has emerged in recent years, and is considered to be an important prerequisite for arousing employees’ inner perception [5,6]. Trust and Felt trust are two sides of the same coin. The two are independent constructs, and the most fundamental difference is the difference in the subject of action. The subject of trust is the giver of trust, and the subject of perceiving trust is the perceiver of trust. Sometimes the trust given by the truster may not be felt by the trustee. This is because trust and feeling trusted are different attitudes and views of two parties, which will be affected by the personality characteristics of the trust perceiver and organizational factors that affect trust attributes [7].
The fact that employees in an organization perceive superiors to be trusted only affects their behavior when they feel they are trusted. Therefore, in order to improve the relationship between superiors and subordinates in the organization, it is very important to ensure that employees perceive leader trust [2,5,8]. Trust is the cornerstone of improving organizational effectiveness and reducing employee management costs. Employees who perceive superior trust have higher job satisfaction and organizational commitment, and have better behavior and performance in expressing their opinions at work [9]. Therefore, this study takes the perception side of trust—employee as the starting point, and explores the relationship between Perceived Leader Trust, Psychological Empowerment, and Employee Work Performance from the perspective of Intrinsic Work Motivation and Self-Evaluation. This has important theoretical and practical significance for solving the missing link in perceived trust theory, and provides a reference for organizations to build a high-trust organizational structure.

2. Relevant Theoretical Basis

2.1. Intrinsic Work Motivation Theory

For individuals, the value of work itself is the intrinsic motivation for work, which is derived from people’s endogenous need for a sense of competence and self-determination [10]. Competence and self-determination are core components of Intrinsic Work Motivation [11]. Amabile proposed a five-factor model of intrinsic motivation, including competency, self-determination, interest, curiosity, and work engagement [12]. Existing studies have shown that the role of employees’ Intrinsic Work Motivation depends not only on individual differences, but also on the influence of the work environment. Therefore, Intrinsic Work Motivation has individual and social characteristics [13]. Deci found that external factors such as trust, mentoring, and participation opportunities from superiors can enhance employees’ Intrinsic Work Motivation [14]. When managers encourage employees, acknowledge their views, trust them, and provide them with guidance and choice at work, employees’ Intrinsic Work Motivation is significantly enhanced, and they tend to perform better at work [15].

2.2. Self-Evaluation Theory

Self-evaluation, as the intrinsic motivation of employees, represents how employees evaluate themselves [16], and can have a positive and significant impact on employees’ behavior, resulting in the satisfaction of leaders [17]. Nerstad found that Perceived Leader Trust, as an employee’s internal self-cognition, can enhance employees’ Self-Evaluation and make employees more recognized for their work meaning, ability, and influence [18]. When employees perceive that their leaders trust them, self-assessments related to perceived trust can lead to a stronger sense of competence and autonomy in employees, increase their influence at work, and promote better performance [19,20]. From these findings, we can infer that superior trust in social settings is important for the Self-Evaluation process in the workplace.

2.3. Perceived Leader Trust

Employees who perceive higher-level trust have higher accountability norms, organizational commitment, and organizational self-esteem. The positive relationship between employees’ social responsibility and their own behavior becomes stronger when leaders motivate frontline employees to serve customers. Furthermore, when frontline employees are satisfied with their jobs, the relationship between responsibility, self-esteem, and their own behavior is strengthened [21,22]. Lau [23] found that teachers who perceived the principal’s trust had higher task performance and organizational citizenship behavior, and organizational self-esteem played a positive moderating role between perceived trust and organizational citizenship behavior and task performance. Liu Y found that Perceived Leader Trust, as an employee’s individual cognition, has a positive impact on employees’ knowledge sharing behavior and voice behavior [24]. Ma E [25] found that self-efficacy and psychological safety play a dual mediating role between Perceived Leader Trust and voice behavior [26]. Thongpapanl N T and M Leppäniemi found that normative commitment and affective commitment play a mediating role between Perceived Leader Trust and project performance, and the mediating effect of continuous commitment has not been verified [27,28].

2.4. Psychological Empowerment

The effects of Psychological Empowerment on employee attitudes and behaviors include job satisfaction, organizational commitment, job engagement, and turnover intention [29]. Khany explored the impact of trust and Psychological Empowerment on teacher job satisfaction. Employees with a high perception of Psychological Empowerment have higher job satisfaction [30]. The four dimensions of Psychological Empowerment play a mediating role between work-related outcomes and employees’ perceptions of their direct leaders [31,32]. Lv M [33] explored the effect of Psychological Empowerment on the relationship between trust in business organizations and employee engagement, and found that Psychological Empowerment had a moderating effect on the relationship between organizational trust and employee engagement. Employees with low perceptions of Psychological Empowerment have a stronger positive relationship between organizational trust and engagement [34]. Sun Y L [35] found that job meaning and self-determination in Psychological Empowerment have a positive impact on employee satisfaction and organizational commitment, work meaning has a negative impact on turnover intention, and self-efficacy has a positive impact on organizational commitment.

2.5. Employee Work Performance

The individual factors that affect the Employee Work Performance mainly include personality traits, experience, risk preference and so on. Early research on Employee Work Performance focused on the individual factors of employees. Goldsmith P D found that employees’ work experience has a significant impact on job performance. Employees with higher work experience tend to have stronger competencies at work, and therefore tend to have better performance [36]. Cadsby [37] found that risk takers are more inclined to take aggressive measures, and their performance improvement tends to be higher. Hastings R P explored the impact of personality traits on Employee Work Performance. The extraversion personality trait has a more significant effect on relationship performance, and the open personality trait has no significant effect on Employee Work Performance [38].
The organizational factors that affect Employee Work Performance mainly involve the leadership style, organizational culture, and atmosphere of their leaders [39,40]. Wang P found that proper job design can affect job autonomy, integrity, and job feedback, thereby improving Employee Work Performance [41]. Cheng C explored the impact of organizational support on Employee Work Performance based on social exchange theory. Organizational support can positively affect Employee Work Performance, and job well-being plays a moderating role between the two [42]. Farndale’s study found that employees who Perceived Leader Trust had better performance in the organization, and had a positive impact on Employee Work Performance through emotional commitment [43].

3. Research Design and Data Analysis

3.1. Measurement of Research Variables

3.1.1. Measurement of Perceived Leader Trust

The more employees perceive leaders, the higher the perception of leaders’ dependence and information disclosure [44]. Lau and Wang Hongli [45] evaluated employees’ trust from two aspects: perceived superior dependence and perceived information disclosure, and the consistency coefficient was 0.916. Gabriel compiled a questionnaire for employees’ trust in their superiors based on the behavioral trust inventory developed by Gillespie, and the internal consistency coefficients of “reliance” and “disclosure” were 0.844, respectively [46]. Drawing lessons from the references [47] in exploring the measurement scales of employees’ perceived trust, this paper divides Perceived Leader Trust into Perceived Leader Dependence and Perceived Information Disclosure, and forms a measurement questionnaire including 2 dimensions and 9 items. The specific items are shown in Table 1.

3.1.2. Measurement of Psychological Empowerment

Spreitzer [48] compiled a research questionnaire with 12 items, and tested the reliability and validity of psychological empowerment. The results showed that the internal consistency of the four dimensions of psychological empowerment was between 0.8 and 0.85. Chenji, K [49] used the questionnaire developed by Spreitzer to measure psychological empowerment in the Chinese context. Avolio, B.J. [50], Wang, G. [25], Stander, M.W. [51], Reza, Khany [52] and many other scholars have confirmed the consistency and validity of the questionnaire. Drawing on the reference [53], this paper divides Psychological Empowerment into Work Meaning, Ability, Autonomy, and Influence, and forms a measurement questionnaire including 4 dimensions and 12 items. The specific items are shown in Table 2.

3.1.3. Measurement of Employee Work Performance

An employee’s work experience has a significant impact on work performance. Employees with higher work experience tend to have stronger competencies at work, and therefore tend to have better performance. Drawing on Han Y [54], Hosamane [55], Kara A [56], Gamage B N [57], Yoestini [58], and Idewele I’s [59] improved Employee Work Performance scale, this paper divides Employee Work Performance into Task Performance and Relationship Performance, including 2 dimensions and 11 items. The specific items are shown in Table 3.

3.2. Research Hypothesis

3.2.1. Relationship between Perceived Leader Trust and Employee Work Performance

Based on Intrinsic Work Motivation theory, positive beliefs and high expectations drive employees to perform better [60]. Perceived Leader Trust means that employees perceive the leader’s dependence and information disclosure. The leaders rely more on the knowledge, skills, and judgment of their subordinates when making decisions, which will lead to a strong sense of identity and autonomy for employees, which in turn enables employees to have better performance at work [61,62,63]. When employees feel trusted by their leaders, they get information and clues about work requirements, task completion, and compliance with organizational norms. Workers perform better when they perceive information accurately, receive information, and are willing to respond to information [64]. Perceived Leader Trust may make employees feel better about their organizational members, which can motivate employees to take more responsibility for their work, which in turn improves Employee Work Performance [65]. Therefore, we believe that employees who perceive the trust of their leaders will have better performance. Therefore, the following hypotheses are made:
Hypothesis 1 (H1).
Perceived Leader Trust positively affects Employee Work Performance.
Hypothesis 1a (H1a).
Perceived Leader Dependence positively affects Employee Task Performance.
Hypothesis 1b (H1b).
Perceived Information Disclosure positively affects Employee Task Performance.
Hypothesis 1c (H1c).
Perceived Leader Dependence positively affects Employee Relationship Performance.
Hypothesis 1d (H1d).
Perceived Information Disclosure positively affects Employee Relationship Performance.

3.2.2. Relationship between Perceived Leader Trust and Psychological Empowerment

Overall Psychological Empowerment increases when employees’ trust in their leaders’ reliability, dependence, and competence increases [66]. Based on the theory of Intrinsic Work Motivation, when employees perceive the dependence and information disclosure of their leaders, their sense of competence, autonomy, and belongingness will be enhanced, and they will have a higher sense of identity with their work, thereby enhancing their overall Psychological Empowerment level [67,68]. When employees perceive positive evaluation and support from their leaders, they attribute it to their self-concept, which significantly affects their Psychological Empowerment perception. Trust improves the relationship and increases the leader’s willingness to delegate authority to subordinates [69]. Managers’ experience of Psychological Empowerment is related to their trust in organizational leaders, and the success of Psychological Empowerment depends on the trust between employees and managers. Employee’s behavior and decision-making are more influenced by leadership or environment [67,70,71]. The trust of leaders is the external environmental factor of employee behavior. Perceiving leaders’ trust will obviously increase the internal Psychological Empowerment of employees [72]. Therefore, we argue that the higher the level of trust employees perceive from their leaders, the stronger their perception of Psychological Empowerment. Therefore, the following hypotheses are made:
Hypothesis 2 (H2).
Perceived Leader Trust positively affects Employee Psychological Empowerment.
Hypothesis 2a (H2a).
Perceived Leader Dependence positively affects Employee Work Meaning.
Hypothesis 2b (H2b).
Perceived Leader Dependence positively affects Employee Ability.
Hypothesis 2c (H2c).
Perceived Leader Dependence positively affects Employee Autonomy.
Hypothesis 2d (H2d).
Perceived Leader Dependence positively affects Employee Influence.
Hypothesis 2e (H2e).
Perceived Information Disclosure positively affects Employee Work Meaning.
Hypothesis 2f (H2f).
Perceived Information Disclosure positively affects Employee Ability.
Hypothesis 2g (H2g).
Perceived Information Disclosure positively affects Employee Autonomy.
Hypothesis 2h (H2h).
Perceived Information Disclosure positively affects Employee Influence.

3.2.3. Relationship between Psychological Empowerment and Employee Work Performance

In work situations, employees with a high perception of Psychological Empowerment tend to have a stronger sense of competence and autonomy, and pay more attention to the impact and value of the work itself [73,74]. This means that employees with a high perception of Psychological Empowerment will respond autonomously when faced with risks and uncertainties at work, and have more input in their work, which will promote employees to have higher work performance. Psychological Empowerment is related to management effectiveness and Employee Work Performance [75]. Meaning at work can increase employee focus and loyalty to work. Perceived competence can make employees more resilient in the face of difficulties and challenges, and have a higher pursuit of goals and tasks [76]. Employees who are more influential at work can coordinate resources more smoothly when completing tasks, and organize that line of work, resulting in high work performance [76,77]. Therefore, we believe that employees who perceive Psychological Empowerment will have better performance. Therefore, the following hypotheses are made:
Hypothesis 3 (H3).
Psychological Empowerment positively affects Employee Work Performance.
Hypothesis 3a (H3a).
Work Meaning positively affects Employee Task Performance.
Hypothesis 3b (H3b).
Ability positively affects Employee Task Performance.
Hypothesis 3c (H3c).
Autonomy positively affects Employee Task Performance.
Hypothesis 3d (H3d).
Influence positively affects Employee Task Performance.
Hypothesis 3e (H3e).
Work Meaning positively affects Employee Relationship Performance.
Hypothesis 3f (H3f).
Ability positively affects Employee Relationship Performance.
Hypothesis 3g (H3g).
Autonomy positively affects Employee Relationship Performance.
Hypothesis 3h (H3h).
Influence positively affects Employee Relationship Performance.

3.2.4. Mediating Role of Psychological Empowerment

Based on the viewpoints of Intrinsic Work Motivation and self-evaluation, when employees perceive the trust of their leaders, they will positively evaluate themselves, thereby improving their sense of competence, autonomy, and belongingness, and enabling employees to generate Psychological Empowerment. To maintain this Psychological Empowerment, employees who perceive the trust of their leaders strive to improve their work performance [78]. Employees who perceive the trust of their leaders will have a sense of responsibility, as well as Psychological Empowerment, which will motivate employees to perform well at work. When employees perceive their own importance at work and have a high level of self-worth experience, employees will increase their motivation to work harder, and Psychological Empowerment just reflects employees’ self-evaluation [79]. Achieving the desired effect of Psychological Empowerment requires an increased level of trust between employees and their superiors. Subordinates who perceive higher-level trust Intrinsic Work Motivation, enhance organizational citizenship, and motivate employees to stay in the organization [78,80]. Perceived Leader Trust is the process of stimulating employees’ Intrinsic Work Motivation [69]. Psychological Empowerment generated by the Intrinsic Work Motivation makes the tasks assigned by the leaders more meaningful to the employees, and the employees will be better at discovering the value of the work and recognize the tasks assigned in the work more [69,71,79]. This paper argues that Perceived Leader Trust helps to increase the Psychological Empowerment of employees, and the increase of Psychological Empowerment will lead to better performance of employees. Therefore, the following hypotheses are made:
Hypothesis 4 (H4).
Psychological Empowerment mediates between Perceived Leader Trust and Employee Work Performance.
Hypothesis 4a (H4a).
Psychological Empowerment mediates between Perceived Leader Dependence and Employee Task Performance.
Hypothesis 4b (H4b).
Psychological Empowerment mediates between Perceived Leader Dependence and Employee Relationship Performance.
Hypothesis 4c (H4c).
Psychological Empowerment mediates between Perceived Information Disclosure and Employee Task Performance.
Hypothesis 4d (H4d).
Psychological Empowerment mediates between Perceived Information Disclosure and Employee Relationship Performance.

3.3. Questionnaire

The questionnaire designed in this paper contains four parts. The first part is the research description of the questionnaire, including the basic information of the participants in the questionnaire, which contains 6 items. The second part is the measurement of Perceived Leader Trust, which contains 9 items in total, including 4 items for Perceived Leader Dependence and 5 items for Perceived Information Disclosure. The third part is the measurement of Psychological Empowerment, which contains 12 items, including 3 items each for Work Meaning, Ability, Autonomy, and Influence. The fourth part is the measurement of Employee Work Performance, which contains 11 items, including 5 items on Employee Task Performance and 6 items on Employee Relationship Performance.
The survey subjects selected in this paper are mainly employees of different enterprises and institutions.
First, this paper selected MBA students who had participated in actual work in enterprises and institutions. They came from different industries and regions, which made the sample highly reliable and rich. A total of 110 questionnaires were distributed and 101 questionnaires were returned.
Second, relying on Internet social platforms—”WeChat” and “QQ” to distribute questionnaires to classmates, friends, etc., participating in the work, a total of 207 questionnaires were distributed and recovered.
The questionnaire was issued from June 2021 to August 2021. A total of 317 questionnaires were distributed and 308 questionnaires were collected. The sample recovery rate was 97.2%. After removing 21 invalid questionnaires, 287 questionnaires were obtained, and the recovery rate of valid questionnaires was 90.5%.
NOTE: All methods were carried out in accordance with relevant international and Chinese guidelines and regulations. All experimental protocols were approved by Institute of Psychology, Chinese Academy of Sciences, and Ethics Committee of CAS. Moreover, the informed consent was obtained from all subjects and their legal guardian(s).

3.4. Descriptive Statistical Analysis

The specific information is shown in Table 4. It can be seen from Table 4 that there is little difference between male and female ratios (52.96% vs. 47.04%). In terms of age, 94.08% of employees are under the age of 40. This is because most of the employees in the current corporate environment are around 20–40 years old, so the number of questionnaires is the largest. From the perspective of educational background, the proportion of “undergraduate” is the largest (49.48%), followed by “master” (35.19%), with a higher degree of education. The higher percent of masters is because the sample includes more MBA. From the work distribution, most of the samples are “General Employee” (58.54%). From the perspective of working age distribution, there are more samples of “1–3 years” and “4–6 years”, accounting for 48.08% and 30.31% respectively. Among them, the proportion of “Private Enterprise” is the largest, at 48.43%.

3.5. Reliability and Validity Analysis

3.5.1. Reliability Test of Scale

(1) Reliability analysis of Perceived Leader Trust
As shown in Table 5, the CITC values of 9 items in the 2 dimensions of Perceived Leader Trust are all greater than 0.6, indicating that there is a good correlation between the items of the scale. The Cronbach’s α value of Perceived Leader Dependence was 0.853, and the Cronbach’s α value of Perceived Information Disclosure was 0.871, indicating that the reliability of the scale was good. Data on Perceived Leader Trust is of high quality and can be used for further analysis.
(2) Reliability analysis of Psychological Empowerment
As shown in Table 6, the CITC values of 12 items of Psychological Empowerment are all greater than 0.6, indicating that there is a good correlation coefficient between the items of the scale. The Cronbach’s α corresponding to the four dimensions of Psychological Empowerment is all greater than 0.8, indicating a good level of reliability. The data reliability of Psychological Empowerment is of high quality and can be used for further analysis.
(3) Reliability analysis of Employee Work Performance
As shown in Table 7, the CITC values of 11 items in the two dimensions of work performance are all greater than 0.6, indicating that there is a good correlation coefficient between the items of the scale. The Cronbach’s α corresponding to the two dimensions of job performance is greater than 0.8, indicating a good level of reliability. The data reliability of job performance is of high quality and can be used for further analysis.

3.5.2. Validity Test of Scale

(1) Validity analysis of Perceived Leader Trust
The KMO value and Bartlett’s sphericity test results of Perceived Leader Trust are shown in Table 8 (detailed data such as Table A1 and Table A2). The KMO value of Perceived Leader Trust was 0.862, and the Bartlett sphericity test was significant at the 0.000 level. The sample data illustrating the variable of Perceived Leader Trust can be subjected to factor analysis.
(2) Validity analysis of Psychological Empowerment
The KMO value and Bartlett’s sphericity test results of Psychological Empowerment are shown in Table 9 (detailed data such as Table A3 and Table A4). The KMO value for Psychological Empowerment was 0.833, and the Bartlett test of sphericity was significant at the 0.000 level. The sample data illustrating the variables of Psychological Empowerment can be subjected to factor analysis.
(3) Validity analysis of Employee Work Performance
The KMO value and Bartlett’s sphericity test results of Employee Work Performance are shown in Table 10 (detailed data such as Table A5 and Table A6). The KMO value of Employee Work Performance was 0.944, and the Bartlett sphericity test was significant at the 0.000 level. The sample data illustrating the variables of Employee Work Performance can be subjected to factor analysis.

4. Regression Analysis

4.1. Regression Analysis of Perceived Leader Trust on Employee Work Performance

(1) Regression analysis of Perceived Leader Trust on Employee Task Performance
Table 11 shows the results of regression analysis of Employee Task Performance on each dimension of Perceived Leader Trust. The multiple correlation coefficient between each dimension of Perceived Leader Trust and Employee Task Performance is 0.663, indicating that there is a positive correlation between the variables. The coefficient of determination R2 = 0.440 indicates that the data explanation degree of Perceived Leader Trust to Employee Task Performance is 44.0%. In the analysis of variance, F = 76.950, Sig. = 0.000, indicating that the model is highly significant and statistically significant. In addition, the regression coefficient of Perceived Leader Dependence was 0.483, Sig. = 0.000, the regression coefficient of Perceived Information Disclosure is 0.617, Sig. = 0.000, indicating that Perceived Leader Dependence and Perceived Information Disclosure are significantly positively correlated with Employee Task Performance. Therefore, the research hypotheses H1a and H1b hold.
(2) Regression analysis of Perceived Leader Trust on Employee Relationship Performance
Table 12 shows the regression analysis results of each dimension of Perceived Leader Trust on Employee Relationship Performance. The multiple correlation coefficient between each dimension of Perceived Leader Trust and Employee Relationship Performance is 0.668, indicating that there is a positive correlation between the variables. The coefficient of determination R2 = 0.446 indicates that the data explanation degree of Perceived Leader Trust on Employee Relationship Performance is 44.6%. In the analysis of variance, F = 78.765, Sig. = 0.000, indicating that the model is highly significant and statistically significant. In addition, the regression coefficient of Perceived Leader Dependence is 0.428, Sig. = 0.000, and the regression coefficient of Perceived Information Disclosure is 0.494, Sig. = 0.000, indicating that Perceived Leader Dependence and Perceived Information Disclosure are significantly positively correlated with Employee Relationship Performance. Therefore, the research hypotheses H1c and H1d hold.
(3) Regression analysis of Perceived Leader Trust on Employee Work Performance
The results of the regression analysis of Perceived Leader Trust on Employee Work Performance are shown in Table 13. The multiple correlation coefficient between Perceived Leader Trust and Employee Work Performance was 0.744, indicating a positive correlation between the variables. The coefficient of determination R2 = 0.554 indicates that the data explanation degree of Perceived Leader Trust to Employee Work Performance is 55.4%. In the analysis of variance, F = 244.646, Sig. = 0.000, indicating that the model is highly significant and statistically significant. In addition, the regression coefficient of Perceived Leader Trust is 1.123, and Sig. = 0.000 indicates that Perceived Leader Trust is significantly positively correlated with Employee Work Performance. Therefore, the research hypothesis H1 holds.

4.2. Regression Analysis of Perceived Leader Trust on Psychological Empowerment

(1) Regression analysis of Perceived Leader Trust on Work Meaning
The results of the regression analysis of each dimension of Perceived Leader Trust on Work Meaning are shown in Table 14. The multiple correlation coefficient between each dimension of Perceived Leader Trust and Work Meaning is 0.294, indicating that there is a positive correlation between the variables. The coefficient of determination R2 = 0.086, F = 9.240 and Sig. = 0.000 in the analysis of variance, indicating that the model is highly significant and statistically significant. In addition, the regression coefficient of Perceived Leader Dependence is 0.254, Sig. = 0.001, indicating that Perceived Leader Dependence is positively correlated with Work Meaning, the regression coefficient of Perceived Information Disclosure is 0.104, and Sig. = 0.184, indicating that there is no significant relationship between Perceived Information Disclosure and Work Meaning. Therefore, the research hypothesis H2a holds and H2e does not hold.
(2) Regression analysis of Perceived Leader Trust on Ability
The results of the regression analysis of each dimension of Perceived Leader Trust on Ability are shown in Table 15. The multiple correlation coefficient between each dimension of Perceived Leader Trust and Ability is 0.418, indicating that there is a positive correlation between the variables. The coefficient of determination R2 = 0.174, indicating that the data explanation degree of Perceived Leader Trust to Ability is 17.4%. In the analysis of variance, F = 20.705, Sig. = 0.000, indicating that the model is highly significant and statistically significant. In addition, the regression coefficient of Perceived Leader Dependence was 0.223, Sig. = 0.003, the regression coefficient of Perceived Information Disclosure is 0.340, Sig. = 0.000, indicating that Perceived Leader Dependence and Perceived Information Disclosure are significantly positively correlated with Ability. Therefore, the research hypotheses H2b and H2f hold.
(3) Regression analysis of Perceived Leader Trust on Autonomy
The results of regression analysis on Autonomy of each dimension of Perceived Leader Trust are shown in Table 16. The multiple correlation coefficient of each dimension of Perceived Leader Trust and Autonomy is 0.477, indicating that there is a positive correlation between the variables. The coefficient of determination R2 = 0.228, indicating that the data explanation degree of Perceived Leader Trust to Autonomy is 22.8%. In the analysis of variance, F = 28.864, Sig. = 0.000, indicating that the model is highly significant and statistically significant. In addition, the regression coefficient of Perceived Leader Dependence is 0.267, Sig. = 0.000; the regression coefficient of Perceived Information Disclosure is 0.363, Sig. = 0.000, indicating that Perceived Leader Dependence and Perceived Information Disclosure are significantly positively correlated with Autonomy. Therefore, the research hypotheses H2c and H2g hold.
(4) Regression analysis of Perceived Leader Trust on Influence
The results of the regression analysis of Influence on each dimension of Perceived Leader Trust are shown in Table 17. The multiple correlation coefficient between each dimension of Perceived Leader Trust and Influence is 0.466, indicating that there is a positive correlation between the variables. The coefficient of determination R2 = 0.217, indicating that the data interpretation of Perceived Leader Trust to Influence is 21.7%. In the analysis of variance, F = 27.219, Sig. = 0.000, indicating that the model is highly significant and statistically significant. In addition, the regression coefficient of Perceived Leader Dependence is 0.192, Sig. = 0.001; the regression coefficient of Perceived Information Disclosure is 0.434, Sig. = 0.000, indicating that Perceived Leader Dependence and Perceived Information Disclosure are significantly positively correlated with Influence. Therefore, the research hypotheses H2d and H2h hold.
(5) Regression analysis of Perceived Leader Trust on Psychological Empowerment
The regression analysis results of Perceived Leader Trust on Psychological Empowerment are shown in Table 18. The multiple correlation coefficient between Perceived Leader Trust and Psychological Empowerment was 0.568, indicating a positive correlation between the variables. The coefficient of determination R2 = 0.323, indicating that the data explanation degree of Perceived Leader Trust to Psychological Empowerment is 32.3%. In the analysis of variance, F = 94.010, Sig. = 0.000, indicating that the model has high significance and statistical significance. In addition, the regression coefficient of Perceived Leader Trust is 0.545, Sig. = 0.000, indicating that Perceived Leader Trust is significantly positively correlated with Psychological Empowerment. Therefore, the research hypothesis H2 holds.

4.3. Regression Analysis of Psychological Empowerment on Employee Work Performance

(1) Regression analysis of Psychological Empowerment on Employee Task Performance
Table 19 shows the regression analysis results of each dimension of Psychological Empowerment on Employee Task Performance. The multiple correlation coefficient between each dimension of Psychological Empowerment and Employee Task Performance is 0.800, indicating that there is a positive correlation between the variables. The coefficient of determination R2 = 0.640, indicating that the data explanation degree of Psychological Empowerment on Employee Task Performance is 64.0%. In the analysis of variance, F = 86.284, Sig. = 0.000, indicating that the model is highly significant and statistically significant. In addition, the regression coefficient of Work Meaning is 0.199, Sig. = 0.001; the regression coefficient of Ability is 0.259, Sig. = 0.000; the regression coefficient for Autonomy is 0.506, Sig. = 0.000; the regression coefficient of Influence is 0.376, Sig. = 0.000, indicating that Work Meaning, Ability, Autonomy, and Influence are positively related to Employee Task Performance. Therefore, the research hypotheses H3a, H3b, H3c, H3d hold.
(2) Regression analysis of Psychological Empowerment on Employee Relationship Performance
Table 20 shows the regression analysis results of each dimension of Psychological Empowerment on Employee Relationship Performance. The multiple correlation coefficient of each dimension of Psychological Empowerment and Employee Relationship Performance is 0.626, indicating that there is a positive correlation between the variables. The coefficient of determination R2 = 0.392, indicating that the data explanation degree of Psychological Empowerment on Employee Relationship Performance is 39.2%. In the analysis of variance, F = 31.332, Sig. = 0.000, indicating that the model is highly significant and statistically significant. In addition, the regression coefficient of Work Meaning is 0.115, Sig. = 0.080, indicating that there is no significant relationship between Work Meaning and Employee Relationship Performance. The regression coefficient of Ability is 0.294, Sig. = 0.000, indicating that Ability has a significant positive correlation with Employee Relationship Performance. The regression coefficient of Autonomy is 0.097, Sig. = 0.162, indicating that there is no significant relationship between Autonomy and Employee Relationship Performance. The regression coefficient of Influence is 0.350, Sig. = 0.000, indicating that Influence is positively correlated with Employee Relationship Performance. Therefore, the research hypotheses H3f and H3h hold, but H3e and H3g do not hold.
(3) Regression analysis of Psychological Empowerment on Employee Work Performance
The results of the regression analysis of Psychological Empowerment on Employee Work Performance are shown in Table 21. The multiple correlation coefficient between Psychological Empowerment and Employee Work Performance was 0.787, indicating a positive correlation between the variables. The coefficient of determination R2 = 0.620 indicates that the data explanation degree of Psychological Empowerment to Employee Work Performance is 62.0%. In the analysis of variance, F = 320.877, Sig. = 0.000, indicating that the model is highly significant and statistically significant. In addition, the regression coefficient of Psychological Empowerment is 1.240, Sig. = 0.000, indicating that Psychological Empowerment is significantly positively correlated with Employee Work Performance. Therefore, the research hypothesis H3 holds.

5. Analysis of the Mediating Effect of Psychological Empowerment

In this paper, the independent variable is X, the dependent variable is Y, and the mediating variable is M to construct a Psychological Empowerment Mediation Model. The specific situation is shown in Figure 1.
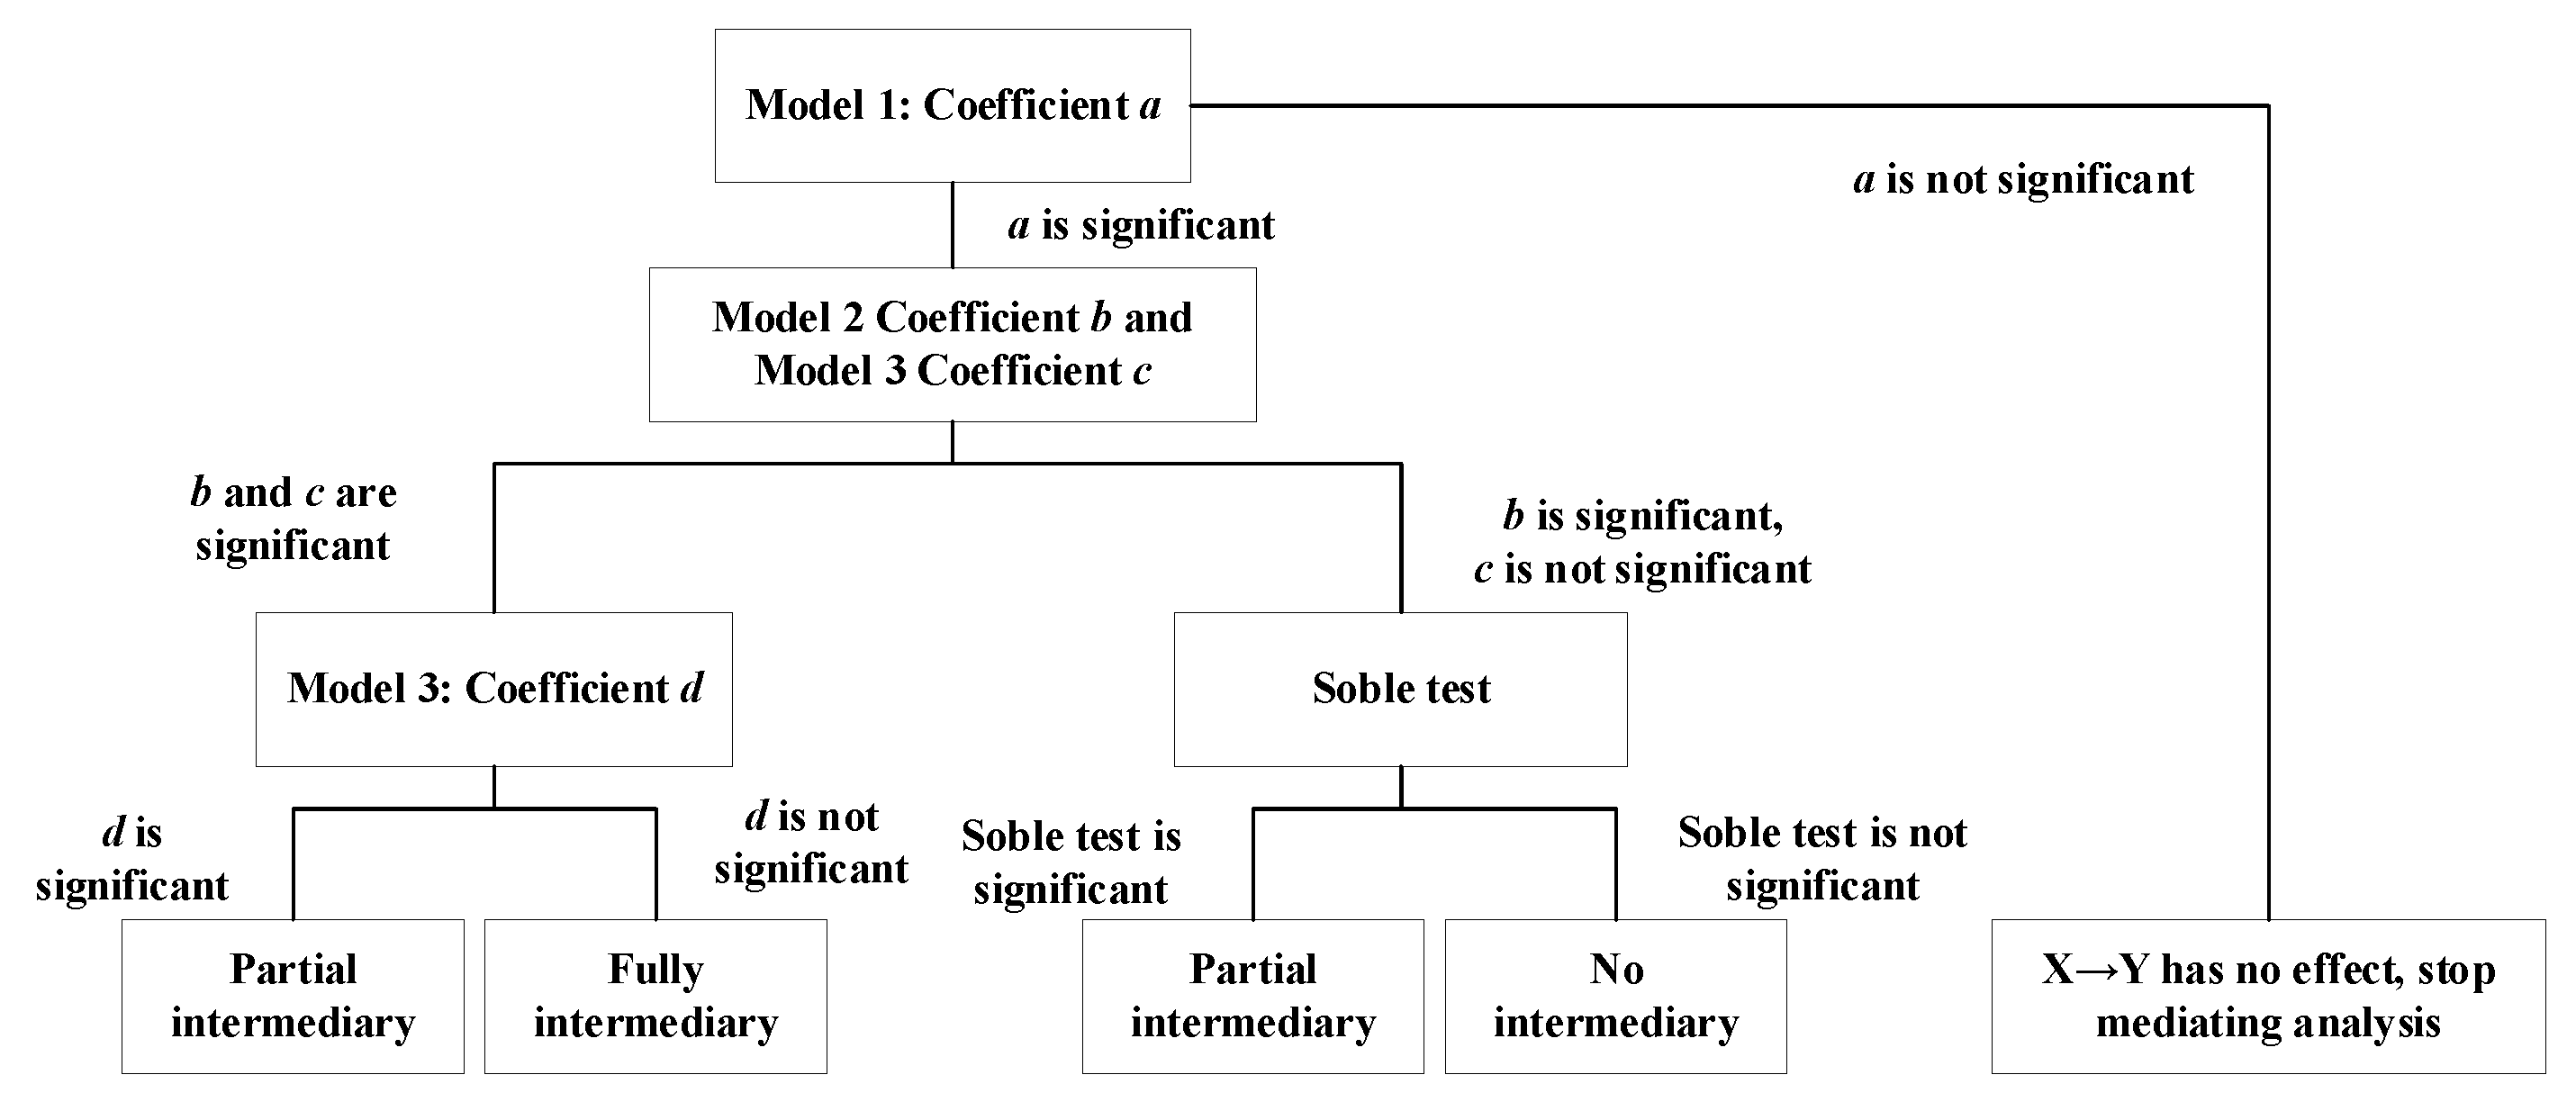
Step 1: Exploring whether the regression analysis coefficient a of X to M is significant. If it is not significant, stop the mediation test; if it is significant, go to Step 2;
Step 2: Explore whether the regression analysis coefficient b of Y to M is significant. If it is not significant, stop the mediation test; if it is significant, go to Step 3;
Step 3: Introducing X and M into the regression equation to explore the combined effect of X and M on Y. If the regression coefficient c of X and the regression coefficient d of M are both significant, it means that M plays a partial mediating role. If the regression coefficient c of X is significant, the regression coefficient d of M is not significant, indicating that M plays a complete mediating role. If the regression coefficient c of X is not significant, a Soble test is required. If the Soble test is significant, it means that M plays a partial mediating role; if the Soble test is not significant, it means that there is no mediating effect.

5.1. Mediating Role of Psychological Empowerment between Perceived Leader Dependence and Employee Task Performance

As shown in Table 22:
Model 1: Regression analysis of Perceived Leader Dependence on Employee Task Performance. R2 = 0.263, F = 70.356, Sig. = 0.000, the regression coefficient of Perceived Leader Trust is 0.679 (Sig. = 0.000), and the regression effect is significant.
Model 2: Regression analysis of Psychological Empowerment on Employee Task Performance. R2 = 0.616, F = 316.535, Sig. = 0.000, the regression coefficient of Psychological Empowerment is 1.360 (Sig. = 0.000), and the regression effect is significant.
Model 3: Regression analysis of Perceived Leader Dependence and Psychological Empowerment on Employee Task Performance. R2 = 0.653, F = 184.093, Sig. = 0.000, the regression coefficient of Psychological Empowerment is 1.200, the regression coefficient of Perceived Leader Dependence is 0.280, and the significance level has not changed.
The above results suggest that Psychological Empowerment plays a partial mediating role between Perceived Leader Dependence and Employee Task Performance, so hypothesis H4a holds.

5.2. Mediating Role of Psychological Empowerment between Perceived Leader Dependence and Employee Relationship Performance

As shown in Table 23:
Model 1: Regression analysis of Perceived Leader Dependence on Employee Relationship Performance. R2 = 0.282, F = 77.513, Sig. = 0.000, the regression coefficient of Perceived Leader Dependence is 0.586 (Sig. = 0.000), and the regression effect is significant.
Model 2: Regression analysis of Psychological Empowerment on Employee Relationship Performance. R2 = 0.366, F = 113.832, Sig. = 0.000, the regression coefficient of Psychological Empowerment was 0.873 (Sig. = 0.000), and the regression effect was significant.
Model 3: Regression analysis of Perceived Leader Dependence and Psychological Empowerment on Employee Relationship Performance. R2 = 0.455, F = 81.764, Sig. = 0.000, the regression coefficient of Psychological Empowerment is 0.665, the regression coefficient of Perceived Leader Dependence is 0.365, and the significance level has not changed.
The above results indicate that Psychological Empowerment plays a partial mediating role between Perceived Leader Dependence and Employee Relationship Performance, so hypothesis H4b holds.

5.3. Mediating Role of Psychological Empowerment between Perceived Information Disclosure and Employee Task Performance

As shown in Table 24:
Model 1: Regression analysis of Perceived Information Disclosure on Employee Task Performance. R2 = 0.322, F = 93.482, Sig. = 0.000, the regression coefficient of Perceived Leader Trust is 0.786 (Sig. = 0.000), and the regression effect is significant.
Model 2: Regression analysis of Psychological Empowerment on Employee Task Performance. R2 = 0.616, F = 316.535, Sig. = 0.000, the regression coefficient of Psychological Empowerment is 1.360 (Sig. = 0.000), and the regression effect is significant.
Model 3: Regression analysis of Perceived Information Disclosure and Psychological Empowerment on Employee Task Performance. R2 = 0.660, F = 190.472, Sig. = 0.000, the regression coefficient of Psychological Empowerment is 1.156, the regression coefficient of Perceived Information Disclosure is 0.333, and the significance level has not changed.
The above results indicate that Psychological Empowerment plays a partial mediating role between Perceived Information Disclosure and Employee Task Performance, so hypothesis H4c holds.

5.4. Mediating Role of Psychological Empowerment between Perceived Information Disclosure and Employee Relationship Performance

As shown in Table 25:
Model 1: Regression analysis of Perceived Information Disclosure on Employee Relationship Performance. R2 = 0.311, F = 89.085, Sig. = 0.000, the regression coefficient of Perceived Leader Trust is 0.643 (Sig. = 0.000), and the regression effect is significant.
Model 2: Regression analysis of Psychological Empowerment on Employee Relationship Performance. R2 = 0.366, F = 113.832, Sig. = 0.000, the regression coefficient of Psychological Empowerment was 0.873 (Sig. = 0.000), and the regression effect was significant.
Model 3: Regression analysis of Perceived Information Disclosure and Psychological Empowerment on Employee Relationship Performance. R2 = 0.456, F = 82.222, Sig. = 0.000, the regression coefficient of Psychological Empowerment is 0.629, the regression coefficient of Perceived Information Disclosure is 0.397, and the significance level has not changed.
The above results indicate that Psychological Empowerment plays a partial mediating role between Perceived Information Disclosure and Employee Relationship Performance, so hypothesis H4d holds.

5.5. Mediating Role of Psychological Empowerment between Perceived Leader Trust and Employee Work Performance

As shown in Table 26:
Model 1: Regression analysis of Perceived Leader Trust on Employee Work Performance. R2 = 0.554, F = 244.646, Sig. = 0.000, the regression coefficient of Perceived Leader Trust is 1.123 (Sig. = 0.000), and the regression effect is significant.
Model 2: Regression analysis of Psychological Empowerment on Employee Work Performance. R2 = 0.620, F = 320.877, Sig. = 0.000, the regression coefficient of Psychological Empowerment is 1.240 (Sig. = 0.000), and the regression effect is significant.
Model 3: Regression analysis of Perceived Leader Trust and Psychological Empowerment on Employee Work Performance. R2 = 0.750, F = 293.684, Sig. = 0.000, the regression coefficient of Psychological Empowerment is 0.847, the regression coefficient of Perceived Leader Trust is 0.662, and the significance level has not changed.
The above results indicate that Psychological Empowerment plays a partial mediating role between Perceived Leader Trust and Employee Work Performance, so hypothesis H4 holds.

5.6. Test Results of Research Hypotheses

A total of 28 research hypotheses are proposed in this paper, of which 25 research hypotheses are valid and 3 research hypotheses are not valid. The specific results are shown in Table 27.
The verification results show that the research hypotheses H2e, H3e, and H3g do not hold. The specific situation is as follows: Perceived Information Disclosure is not related to Employee Work Meaning; Employee Work Meaning and Employee Autonomy are not related to Employee Relationship Performance. In addition, Psychological Empowerment, as an overall mediating variable, played a partial mediating role in the testing of all mediating effects.

6. Discussion

(1) Perceived Leader Trust positively affects Employee Work Performance
The regression coefficients of Perceived Leader Dependence and Perceived Information Disclosure on Employee Task Performance are 0.483 and 0.617; the regression coefficients of Perceived Leader Dependence and Perceived Information Disclosure on Employee Relationship Performance are 0.428 and 0.494. This result shows that employees will more actively complete the tasks assigned by their leaders because they perceive their leaders’ dependence and information disclosure, and thus have better performance at work.
(2) Perceived Leader Trust positively affects employees’ Psychological Empowerment level
The empirical results show that Perceived Leader Trust has a positive impact on the overall Psychological Empowerment of employees. Perceived Leader Dependence has a significant positive effect on the Work Meaning, Ability, Autonomy and Influence of Psychological Empowerment, and Perceived Information Disclosure has a positive impact on employees’ Ability, Autonomy, and Influence. Perceived trust based on dependence and information disclosure is built on the emotional connection, interpersonal interest, and support of leaders and subordinates, while employees’ perception of Psychological Empowerment is closely linked to superiors’ communication and support. Therefore, Perceived Leader Trust can positively affect employees’ Psychological Empowerment.
(3) Psychological Empowerment positively affects Employee Work Performance
The empirical results show that employees’ overall Psychological Empowerment has a positive impact on Employee Work Performance. Employees with high Psychological Empowerment tend to be proactive in their work, and have more input in their work, which in turn promotes employees to have higher Employee Work Performance. The four dimensions of Psychological Empowerment can positively affect Employee Task Performance, the Ability and Influence of Psychological Empowerment have a positive impact on Employee Relationship Performance, and Work Meaning and Autonomy have no significant impact on Employee Relationship Performance. The reason for this result is that Employee Relationship Performance is more dependent on the performance and influence of employees at work. However, employees’ perception of Autonomy emphasizes the degree of employees’ self-determination of work, which is not much related to Employee Relationship Performance.
(4) Psychological Empowerment plays a partial mediating role between Perceived Leader Trust and Employee Work Performance
Psychological Empowerment, as a whole, plays a partial mediating role between Perceived Leader Dependence and Employee Task Performance, and partially mediates between Perceived Leader Dependence and Employee Relationship Performance. When employees feel the trust of their leaders, their Employee Work Performance is positively affected, and the effect of Perceived Leader Trust can be explained by changes in employees’ Psychological Empowerment.

7. Conclusions

Based on the research results of previous scholars, this paper constructs a theoretical model of Perceived Leader Trust, Psychological Empowerment and Employee Work Performance, and proposes 28 research hypotheses. Among them, Perceived Leader Trust is divided into Perceived Leader Dependence and Perceived Information Disclosure; Psychological Empowerment is divided into Work Meaning, Ability, Autonomy, and Influence; Employee Work Performance is divided into Employee Task Performance and Employee Relationship Performance. This paper adopts a combination of online (WeChat and QQ) and offline (MBA students) methods to collect 308 research data, verify the theoretical model and research hypothesis constructed in this paper through empirical analysis, and finally draw the research conclusion.
(1) Perceived Leader Trust has a positive impact on Employee Work Performance. (2) Perceived Leader Trust can positively affect employees’ perception of Psychological Empowerment. Among them, Perceived Leader Dependence has a significant impact on all dimensions of Psychological Empowerment, but the relationship between Perceived Information Disclosure and Work Meaning is not significant. (3) Employees’ Psychological Empowerment perception is positively related to their work performance. Among them, the four dimensions of Psychological Empowerment are significantly related to Employee Task Performance, and the relationship between Work Meaning and Autonomy and Employee Relationship Performance is not significant. (4) Psychological Empowerment, as the overall perception of employees, plays a partial mediating role between Perceived Leader Trust and Employee Work Performance.

Author Contributions

Conceptualization, X.R.; methodology, X.R.; formal analysis, X.L.; investigation, X.L.; resources, X.L.; data curation, X.L.; writing—original draft preparation, X.L.; writing—review and editing, X.L. and X.R.; supervision, X.R. All authors have read and agreed to the published version of the manuscript.

Funding

This research received no external funding.

Institutional Review Board Statement

The study does not require approval.

Informed Consent Statement

Informed consent was obtained from all subjects involved in the study.

Data Availability Statement

Any data requirements can be obtained by contacting the corresponding author.

Conflicts of Interest

The authors declare no conflict of interest.

Appendix A

Table A1. Perceived Leader Trust Total Variance Explained.
ElementInitial EigenvalueExtract the Sum of Squares of the LoadRotating Load Sum of Squares
TotalVariance%TotalVariance%TotalVariance%
A114.08845.4264.08845.4263.29536.608
A122.00822.3132.00822.3132.80231.131
A130.5546.155
A140.4775.3
A210.4374.857
A220.4074.524
A230.3764.179
A240.3644.042
A250.2883.203
Table A2. Rotated Composition Matrix of Perceived Leader Trust.
VariableItemElement
12
Perceived Leader DependenceA11 0.820
A12 0.835
A13 0.829
A14 0.804
Perceived Information DisclosureA210.774
A220.816
A230.811
A240.818
A250.783
Table A3. Psychological Empowerment Total Variance Explained.
ElementInitial EigenvalueExtract the Sum of Squares of the LoadRotating Load Sum of Squares
TotalVariance%TotalVariance%TotalVariance%
B114.70839.2324.70839.2322.32819.4
B121.76914.7421.76914.7422.32119.341
B131.50612.5491.50612.5492.28419.036
B211.1949.9461.1949.9462.24318.692
B220.4433.688
B230.4263.552
B310.3843.197
B320.3623.021
B330.3462.882
B410.3142.619
B420.2922.431
B430.2572.141
Table A4. Rotated Composition Matrix of Psychological Empowerment.
VariableItemElement
1234
Work MeaningB11 0.836
B12 0.864
B13 0.853
AbilityB210.840
B220.840
B230.831
AutonomyB31 0.794
B32 0.824
B33 0.833
InfluenceB41 0.832
B42 0.836
B43 0.835
Table A5. Employee Work Performance Total Variance Explained.
ElementInitial EigenvalueExtract the Sum of Squares of the LoadRotating Load Sum of Squares
TotalVariance%TotalVariance%TotalVariance%
C116.70467.046.70467.044.18141.815
C121.36713.6711.36713.6713.8938.897
C130.3393.386
C140.2982.975
C150.2772.766
C210.2622.617
C220.2262.257
C230.1931.933
C240.181.803
C250.1681.732
C260.1551.552
Table A6. Rotated Composition Matrix of Employee Work Performance.
VariableItemElement
12
Employee Task PerformanceC110.886
C120.855
C130.822
C140.870
C150.849
Employee Relationship PerformanceC21 0.817
C22 0.775
C23 0.843
C24 0.827
C25 0.836
C26 0.793

References

  1. Nwachukwu, C.E.; Chládková, H.; Agboga, R.S.; Vu, H.M. Religiosity, employee empowerment and employee engagement: An empirical analysis. Int. J. Sociol. Soc. Policy 2021, 41, 1195–1209. [Google Scholar] [CrossRef]
  2. Motamarri, S.; Akter, S.; Yanamandram, V. Frontline employee empowerment: Scale development and validation using Confirmatory Composite Analysis. Int. J. Inf. Manag. 2020, 54, 102177. [Google Scholar] [CrossRef]
  3. Obi, C.N.; Leggett, C.; Harris, H. National culture, employee empowerment and advanced manufacturing technology utilisation: A study of Nigeria and New Zealand. J. Manag. Organ. 2020, 26, 460–482. [Google Scholar] [CrossRef]
  4. Makridis, C.A.; Han, J.H. Future of work and employee empowerment and satisfaction: Evidence from a decade of technological change. Technol. Forecast. Soc. Chang. 2021, 173, 121162. [Google Scholar] [CrossRef]
  5. Baird, K.; Tung, A.; Su, S. Employee empowerment, performance appraisal quality and performance. J. Manag. Control Z. Plan. Unternehm. 2020, 31, 451–474. [Google Scholar] [CrossRef]
  6. Mohr, H.; Walter, Z. Formation of Consumers’ Perceived Information Security: Examining the Transfer of Trust in Online Retailers. Inf. Syst. Front. 2019, 21, 1231–1250. [Google Scholar] [CrossRef]
  7. Liu, C.; Bao, Z.; Zheng, C. Exploring consumers’ purchase intention in social commerce: An empirical study based on trust, argument quality, and social presence. Asia Pac. J. Mark. Logist. 2019, 31, 378–397. [Google Scholar] [CrossRef]
  8. Pour, M.J.; Taheri, F. Personality traits and knowledge sharing behavior in social media: Mediating role of trust and subjective well-being. Horizon 2019, 27, 98–117. [Google Scholar] [CrossRef]
  9. Eberl, J.M. Lying press: Three levels of perceived media bias and their relationship with political preferences. Communications 2019, 44, 5–32. [Google Scholar] [CrossRef]
  10. Caratozzolo, P. Sustainability: A Public Policy, a Concept, or a Competence? Efforts on the Implementation of Sustainability as a Transversal Competence throughout Higher Education Programs. Sustainability 2021, 13, 13989. [Google Scholar] [CrossRef]
  11. Chiu, T. Digital support for student engagement in blended learning based on self-determination theory. Comput. Hum. Behav. 2021, 124, 106909. [Google Scholar] [CrossRef]
  12. Amabile, T.M.; Hill, K.G.; Hennessey, B.A.; Tighe, E.M. The Work Preference Inventory: Assessing intrinsic and extrinsic motivational orientations. J. Pers. Soc. Psychol. 1994, 66, 950–967. [Google Scholar] [CrossRef] [PubMed]
  13. Ross, R.J.; Suzuki, Y.; Kondoh, M.; Suzuki, K.; Villa Martín, P.; Dornelas, M. Illuminating the intrinsic and extrinsic drivers of ecological stability across scales. Ecol. Res. 2021, 36, 364–378. [Google Scholar] [CrossRef]
  14. Deci, E.L.; Ryan, R.M. The “What” and “Why” of Goal Pursuits: Human Needs and the Self-Determination of Behavior. Psychol. Inq. 2000, 11, 227–268. [Google Scholar] [CrossRef]
  15. Karagün, E.; Ekiz, Z.D. Educational Research and Reviews Examination of intrinsic motivation, and job satisfaction of physical education and other branch teachers. Educ. Res. Rev. 2020, 15, 632–638. [Google Scholar]
  16. Nissan, D.; Weiss, G.; Siman-Tov, M.; Bodas, M.; Shenhar, G.; Adini, B. Differences in levels of psychological distress, perceived safety, trust, and efficacy amongst hospital personnel during the COVID-19 pandemic. Res. Nurs. Health 2021, 44, 776–786. [Google Scholar] [CrossRef]
  17. Abadi, S.J.; Mahdavipour, Z.; Rezaei, A.; Nazari, F. The relationship between employee self-concept, brand identity, brand pride and brand citizenship behaviour and customer satisfaction. Int. J. Bus. Excell. 2021, 23, 171–187. [Google Scholar] [CrossRef]
  18. Nerstad, C.; Searle, R.; Černe, M.; Dysvik, A.; Škerlavaj, M. Perceived mastery climate, felt trust, and knowledge sharing. J. Organ. Behav. 2018, 39, 429–447. [Google Scholar] [CrossRef]
  19. Longo, Y.; Gunz, A.; Curti, G.J.; Farsides, T. Measuring Need Satisfaction and Frustration in Educational and Work Contexts: The Need Satisfaction and Frustration Scale (NSFS). J. Happiness Stud. 2016, 17, 295–317. [Google Scholar] [CrossRef]
  20. Ertuerk, A.; Vurgun, L. Retention of IT professionals: Examining the influence of empowerment, social exchange, and trust. J. Bus. Res. 2015, 68, 34–46. [Google Scholar] [CrossRef]
  21. Youn, H.; Kim, J.H. Corporate Social Responsibility and Hotel Employees’ Organizational Citizenship Behavior: The Roles of Organizational Pride and Meaningfulness of Work. Sustainability 2022, 14, 2428. [Google Scholar] [CrossRef]
  22. Vizcaíno, F.V.; Martin, S.L.; Cardenas, J.J.; Cardenas, M. Employees’ attitudes toward corporate social responsibility programs: The influence of corporate frugality and polychronicity organizational capabilities. J. Bus. Res. 2021, 124, 538–546. [Google Scholar] [CrossRef]
  23. Lau, D.C.; Lam, L.W.; Wen, S.S. Examining the effects of feeling trusted by supervisors in the workplace: A self-evaluative perspective. J. Organ. Behav. 2013, 35, 112–127. [Google Scholar] [CrossRef]
  24. Liu, Y.; Gan, Y.; Song, Y.; Liu, J. What Influences the Perceived Trust of a Voice-Enabled Smart Home System: An Empirical Study. Sensors 2021, 21, 2037. [Google Scholar] [CrossRef]
  25. Ma, E.; Zhang, Y.; Xu, F.Z.; Wang, D.; Kim, M. Feeling empowered and doing good? A psychological mechanism of empowerment, self-esteem, perceived trust, and OCBs. Tour. Manag. 2021, 87, 104356. [Google Scholar] [CrossRef]
  26. Gao, J.H. Analyzing Online Customer Satisfaction: The Impacts of Perceived Benefits, Perceived Risks, and Trust. Int. J. Risk Conting. Manag. 2019, 8, 1–12. [Google Scholar] [CrossRef]
  27. Thongpapanl, N.T.; Ashraf, A.R.; Lapa, L.; Venkatesh, V. Differential Effects of Customers’ Regulatory Fit on Trust, Perceived Value, and M-Commerce Use among Developing and Developed Countries. J. Int. Mark. 2018, 26, 22–44. [Google Scholar] [CrossRef]
  28. Leppäniemi, M.; Karjaluoto, H.; Saarijärvi, H. Customer perceived value, satisfaction, and loyalty: The role of willingness to share information. Int. Rev. Retail Distrib. Consum. Res. 2017, 27, 164–188. [Google Scholar] [CrossRef]
  29. Khany, R.; Tazik, K. On the Relationship between Psychological Empowerment, Trust, and Iranian EFL Teachers’ Job Satisfaction. J. Career Assess. 2016, 24, 112–129. [Google Scholar] [CrossRef]
  30. Amor, A.M.; Xanthopoulou, D.; Calvo, N.; Vázqueza, J.P.A. Structural empowerment, psychological empowerment, and work engagement: A cross-country study. Eur. Manag. J. 2021, 39, 779–789. [Google Scholar] [CrossRef]
  31. Richardson, H.A.; Taylor, S.G.; Kluemper, D.H. Too Little and Too Much Authority Sharing: Differential Relationships with Psychological Empowerment and In-role and Extra-role Performance. J. Organ. Behav. 2021, 42, 1099–1119. [Google Scholar] [CrossRef]
  32. Bharadwaja, M.; Tripathi, N. Linking empowering leadership and job attitudes: The role of psychological empowerment. J. Asia Bus. Stud. 2021, 15, 110–127. [Google Scholar] [CrossRef]
  33. Lv, M.; Yang, S.; Lv, X.Y.; Zhang, L.; Chen, Z.Q.; Zhang, S.X. Organizational innovation climate and innovation behavior among nurses in China: A mediation model of psychological empowerment. J. Nurs. Manag. 2021, 29, 2225–2233. [Google Scholar] [CrossRef] [PubMed]
  34. Chenji, K.; Raghavendra, S. Onboarding Effect on Employee Creativity: The Moderating Role of Psychological Empowerment. J. Inf. Knowl. Manag. 2021, 20, 2150046. [Google Scholar] [CrossRef]
  35. Sun, Y.L.; Kim, Y.; Kim, Y. Engaging consumers with corporate social responsibility campaigns: The roles of interactivity, psychological empowerment, and identification. J. Bus. Res. 2021, 134, 507–517. [Google Scholar]
  36. Goldsmith, P.D.; Basak, R. Incentive Contracts and Environmental Performance Indicators. Environ. Resour. Econ. 2001, 20, 259–279. [Google Scholar] [CrossRef]
  37. Cadsby, C.B.; Song, F.; Tapon, F. Sorting and Incentive Effects of Pay for Performance: An Experimental Investigation. Acad. Manag. J. 2007, 50, 387–405. [Google Scholar] [CrossRef] [Green Version]
  38. Hastings, R.P.; Remington, B.; Hatton, C. Future directions for research on staff performance in services for people with learning disabilities. J. Appl. Res. Intellect. Disabil. 2010, 8, 333–339. [Google Scholar] [CrossRef]
  39. Mansell, J. Staffing and staff performance in services for people with severe or profound learning disability and serious challenging behaviour. J. Intellect. Disabil. Res. 2010, 39, 3–14. [Google Scholar] [CrossRef]
  40. Massami, E.P.; Manyasi, M.M. Analysis of determinants of work performance for seafarers based on fuzzy Electre model. J. Shipp. Trade 2021, 6, 7. [Google Scholar] [CrossRef]
  41. Wang, P.; Zhang, Q. The Impact of Job Crafting on Work Performance:The Mediating Effect of Psychological Empowerment. Chin. J. Ergon. 2017, 23, 35–39+54. [Google Scholar]
  42. Cheng, C. Research on the Relationship between Perceived Organizational Support and Job Performance—The Mediating Effect of Workplace Well-being. J. Lanzhou Univ. Financ. Econ. 2019, 35, 97–106. [Google Scholar]
  43. Farndale, E.; Ruiten, J.V.; Kelliher, C.; Hope-Hailey, V. The Influence of Perceived Employee Voice on Organizational Commitment: An Exchange Perspective. Hum. Resour. Manag. 2011, 50, 113–129. [Google Scholar] [CrossRef]
  44. Motro, D.; Gabriel, A.S.; Ellis, A. Examining the effects of menstruation on women’s helping behaviour in the workplace. J. Occup. Organ. Psychol. 2019, 92, 695–706. [Google Scholar] [CrossRef]
  45. Wang, H.; Diwei, Y.U. Employee perceived trust and effect from the perspective of controlled motivation theory. Chin. J. Manag. 2018, 15, 351–357+409. [Google Scholar]
  46. Gabriel, J.M.; Kpakol, A.G. Mediating Role of Power Distance on the Association of Perceived Managerial Competency and Employee Trust in the Nigerian Manufacturing Industry. Int. J. Manag. Stud. Res. 2014, 2, 1–12. [Google Scholar]
  47. Spreitzer, G.M. Psychological empowerment in the workplace: Dimensions, measurement, and validation. Acad. Manag. J. 1995, 38, 1442–1465. [Google Scholar]
  48. Avolio, B.J.; Zhu, W.; Bhatia, K.P. Transformational leadership and organizational commitment: Mediating role of psychological empowerment and moderating role of structural distance. J. Organ. Behav. 2004, 25, 951–968. [Google Scholar] [CrossRef]
  49. Wang, G.; Lee, P.D. Psychological empowerment and job satisfaction: An analysis of interactive effects. Group Organ. Manag. 2009, 34, 271–296. [Google Scholar] [CrossRef]
  50. Stander, M.W.; Rothmann, S. Psychological empowerment, job insecurity and employee engagement. SA J. Ind. Psychol. 2010, 36, 849. [Google Scholar] [CrossRef]
  51. Zhang, Q. The cost of feeling trusted: The study on the relationship among felt trust from supervisors, role overload, job stress and emotional exhaustion. Manag. World 2016, 8, 110–125+136+187–188. [Google Scholar]
  52. Ma, H.; Xin, W. Dyadic Trust between Superiors and Subordinates in Organizations:Impacts and Mechanisms. J. Psychol. Sci. 2014, 37, 438–445. [Google Scholar]
  53. Hochwlder, J.; Brucefors, A.B. Psychological empowerment at the workplace as a predictor of ill health–ScienceDirect. Personal. Individ. Differ. 2005, 39, 1237–1248. [Google Scholar] [CrossRef]
  54. Han, Y.; Liao, J.Q. Model of development and empirical study on employee job performance construct. J. Manag. Sci. China 2007, 10, 62–77. [Google Scholar]
  55. Hosamane, M.D.; Alroaia, Y.V. Entrepreneurship and Development of Small-Scale Industries in Iran: Strategic Management Tools and Business Performance Assessment. ICFAI J. Entrep. Dev. 2009, 6, 27–40. [Google Scholar]
  56. Kara, A.; Spillan, J.E.; Deshields, O.W. The Effect of a Market Orientation on Business Performance: A Study of Small-Sized Service Retailers Using MARKOR Scale. J. Small Bus. Manag. 2010, 43, 105–118. [Google Scholar] [CrossRef]
  57. Gamage, B.N. Entrepreneurship Orientation, Business Performance Appraisal of Small and Medium Scale Enterprises: Reference to Hambanthota District, Sri Lanka. Int. J. Financ. Serv. Manag. 2015, 3, 174–185. [Google Scholar]
  58. Yoestini, B.K.L.; Kusumawardhani, A. Green business performance-based CSR. Evidence from large-scale enterprises in Indonesia. Qual. Access Success 2018, 19, 56–63. [Google Scholar]
  59. Idewele, I. Effect of Business Performance on Taxation of Small and Medium Enterpries Scale in Bwari Area Council FCT Abuja, Nigeria. SIASAT 2020, 4, 46–57. [Google Scholar] [CrossRef]
  60. Ahmed, I.; Afzal, R.; Rasid, S. Employees’ task performance and propensity to take charge: The role of LMX and leader’s task orientation. J. Manag. Dev. 2021, 40, 224–239. [Google Scholar] [CrossRef]
  61. Harjinder, K.; Biswajyoti, P.; Saranjit, S.; Divakar, J.H. Impact of High-Performance Work-System (Hpws) On Employee-Performance: A Case Study. Stud. Bus. Econ. 2021, 16, 111–126. [Google Scholar]
  62. Dongoran, A.P.; Nazaruddin WR, P. Analysis of effect of leadership style, work motivation and work ability to employee satisfaction in increasing performance of harvesters. IOP Conf. Ser. Mater. Sci. Eng. 2020, 801, 012073. [Google Scholar] [CrossRef]
  63. Lasisi, T.T.; Ozturen, A.; Eluwole, K.K.; Avci, T. Explicating innovation-based human resource management’s influence on employee satisfaction and performance. Empl. Relat. 2020, 42, 1181–1203. [Google Scholar] [CrossRef]
  64. Banin, Q.A.; Eliyana, A.; Latifiyah, E.R. Enhancing employee performance with work motivation as a mediation variable. Syst. Rev. Pharm. 2020, 11, 333–346. [Google Scholar]
  65. Stollberger, J.; Heras, M.L.; Rofcanin, Y.; Bosch, M.J. Serving followers and family? A trickle-down model of how servant leadership shapes employee work performance. J. Vocat. Behav. 2019, 112, 158–171. [Google Scholar] [CrossRef]
  66. Lorinkova, N.M.; Perry, S.J. When Is Empowerment Effective? The Role of Leader-Leader Exchange in Empowering Leadership, Cynicism, and Time Theft. J. Manag. 2017, 43, 1631–1654. [Google Scholar] [CrossRef]
  67. Li, X.; Lin, C. The influence of high-commitment work system on work well-being: The mediating role of psychological empowerment and the moderating role of leader trust. Pers. Rev. 2020, 50, 1128–1147. [Google Scholar] [CrossRef]
  68. Vrhovnik, T.; Marič, M.; Žnidaršič, J.; Jordan, G. The Influence of Teachers’ Perceptions of School Leaders’ Empowering Behaviours on the Dimensions of Psychological Empowerment. Organ. Mag. Manag. Inform. Hum. Resour. 2018, 51, 112–120. [Google Scholar] [CrossRef] [Green Version]
  69. Ciftci, D.O. The Mediating Role of Psychological Empowerment in the Effect of Leader-Member Exchange on Work Engagement. Bus. Econ. Res. J. 2019, 10, 167–186. [Google Scholar]
  70. Hornung, S. Crafting Task and Cognitive Job Boundaries to Enhance Self-Determination, Impact, Meaning and Competence at Work. Behav. Sci. 2019, 9, 136. [Google Scholar] [CrossRef] [Green Version]
  71. Chen, Y.; Liu, B.; Zhang, L.; Qian, S. Can leader ‘humility’ spark employee ‘proactivity’? The mediating role of psychological empowerment. Leadersh. Organ. Dev. J. 2018, 39, 326–339. [Google Scholar] [CrossRef]
  72. Lee, A.N.; Nie, Y. Teachers’ perceptions of school leaders’ empowering behaviours and psychological empowerment. Educ. Manag. Adm. Leadersh. 2017, 45, 260–283. [Google Scholar] [CrossRef] [Green Version]
  73. Hill, N.S.; Kang, J.H.; Seo, M.G. The interactive effect of leader–member exchange and electronic communication on employee psychological empowerment and work outcomes. Leadersh. Q. 2014, 25, 772–783. [Google Scholar] [CrossRef]
  74. Kazlauskaite, R.; Buciuniene, I.; Turauskas, L. Organisational and psychological empowerment in the HRM-performance linkage. Empl. Relat. 2011, 34, 138–158. [Google Scholar] [CrossRef]
  75. Cyboran, V.L. The Influence of Reflection on Employee Psychological Empowerment: Report of an Exploratory Workplace Field Study. Perform. Improv. Q. 2010, 18, 37–49. [Google Scholar] [CrossRef]
  76. Waheed, A.; Abbas, Q.; Malik, O. ‘Perceptions of Performance Appraisal Quality’ and Employee Innovative Behavior: Do Psychological Empowerment and ‘Perceptions of HRM System Strength’ Matter? Behav. Sci. 2018, 8, 114. [Google Scholar] [CrossRef] [Green Version]
  77. Guerrero, S.; Chenevert, D.; Vandenberghe, C.; Tremblay, M.; Ayed, A.K.B. Employees’ psychological empowerment and performance: How customer feedback substitutes for leadership. J. Serv. Mark. 2018, 32, 868–879. [Google Scholar] [CrossRef]
  78. Ambad, S.; Kalimin, K.M.; Damit, D.; Andrew, J.V. The mediating effect of psychological empowerment on leadership styles and task performance of academic staff. Leadersh. Organ. Dev. J. 2021, 42, 763–782. [Google Scholar] [CrossRef]
  79. Matsuo, M.; Matsuo, T.; Arai, K. The influence of an interactive use of management control on individual performance: Mediating roles of psychological empowerment and proactive behavior. J. Account. Organ. Chang. 2021, 17, 263–281. [Google Scholar] [CrossRef]
  80. Tripathi, N.; Bharadwaja, M. Empowering Leadership and Psychological Health: The Mediating Role of Psychological Empowerment. Empl. Responsib. Rights J. 2020, 32, 97–121. [Google Scholar] [CrossRef]
Figure 1. Construction of Psychological Empowerment Mediation Model.
Ijerph 19 06712 g001
Table 1. Perceived Leader Trust Measurement Items.
DimensionNo.Items
Perceived Leader DependenceA11My direct leader is willing to put me in charge of projects that are important to him
A12My direct leader won’t worry about me doing things against him at work
A13What my direct leader thinks is important, he will try to get me involved and have an impact
A14My direct leader would be more than willing to entrust me with key tasks
Perceived Information DisclosureA21My direct leader is willing to share his experience on the job with me
A22My direct leader is willing to tell me about mistakes he made at work
A23My direct leader is willing to share his views on some sensitive issues with me
A24When I have doubts at work, my direct leader will tell me the details of the problem without reservation
A25My direct leader is willing to share personal life or family-related information with me
Table 2. Psychological Empowerment Measurement Items.
DimensionNo.Items
Work MeaningB11My work is very meaningful to me
B12What I do at work means a lot to me personally
B13My work is very important to me
AbilityB21I can decide for myself how my work is done
B22I can decide for myself how to do the work given to me
B23At work, I have a lot of autonomy and independence
AutonomyB31I have all the skills I need to get the job done
B32I am confident that I have all the abilities to do a good job
B33I am confident in my ability to get the job done
InfluenceB41I have a greater facilitation of what happens in the department
B42I have greater control over what happens in the department
B43I have a greater influence on what happens in the department
Table 3. Employee Work Performance Measurement Items.
DimensionNo.Items
Employee Task PerformanceC11I rarely make the same mistakes at work
C12My work always meets the standards required by leader
C13I often plan work and advance work
C14My work is always productive and on time
C15My work performance is quite outstanding in the company
Employee Relationship PerformanceC21I work well with colleagues in a work team
C22I provide support and encouragement when colleagues have problems
C23I am often enthusiastic and proactive in solving problems at work
C24I will often take the initiative to take on additional workloads and strive for better team performance
C25When the leader is not present, I still follow his instructions to complete the work
C26I expect to be assigned or placed in challenging work
Table 4. Descriptive Statistics of Basic Information.
NameOptionFrequencyPercentage (%)
GenderMale13547.04
Female15252.96
Age<255418.82
26–3013245.99
31–408429.27
41–50134.53
>5041.39
EducationHigh school and below51.74
Junior College3913.59
Undergraduate14249.48
Master and above10135.19
PositionGeneral Employee16858.54
Grassroots manager6623.01
Middle manager4816.72
Senior management51.73
Length of service<1 year113.83
1–3 years13848.08
4–6 years8730.31
7–9 years4214.64
>10 years93.14
Unit naturePrivate Enterprise13948.43
State-owned enterprise7827.18
Institutions4515.68
Joint venture217.32
Foreign companies41.39
Table 5. Reliability Analysis of Perceived Leader Trust.
VariableItemCITCα CoefficientCronbach’s α
Perceived Leader DependenceA110.6990.8120.853
A120.6840.818
A130.710.807
A140.6890.817
Perceived Information DisclosureA210.6510.8550.871
A220.7140.839
A230.730.835
A240.7170.839
A250.6720.849
Table 6. Reliability Analysis of Psychological Empowerment.
VariableItemCITCα CoefficientCronbach’s α
Work MeaningB110.7010.7900.843
B120.7070.784
B130.7190.772
AbilityB210.7410.7970.860
B220.7380.802
B230.7270.811
AutonomyB310.6890.7530.826
B320.6950.746
B330.6630.779
InfluenceB410.6730.7890.833
B420.7260.736
B430.6830.779
Table 7. Reliability Analysis of Employee Work Performance.
VariableItemCITCα CoefficientCronbach’s α
Employee Task performanceC110.8640.9400.951
C120.8680.940
C130.8430.944
C140.8870.937
C150.8680.939
Employee Relationship performanceC210.8010.9080.925
C220.7820.908
C230.7820.904
C240.7840.908
C250.7870.911
C260.7790.902
Table 8. KMO and Bartlett Tests of Perceived Leader Trust.
Sampling adequacy of KMO metrics 0.862
Bartlett sphericity testApproximate chi-square812.476
df36
p.0.000
Table 9. KMO and Bartlett Tests of Psychological Empowerment.
Sampling adequacy of KMO metrics 0.833
Bartlett sphericity testApproximate chi-square1109.732
df66
p.0.000
Table 10. KMO and Bartlett Tests of Employee Work Performance.
Sampling adequacy of KMO metrics 0.944
Bartlett sphericity testApproximate chi-square1824.774
df45
p.0.000
Table 11. Regression Analysis of Perceived Leader Trust on Employee Task Performance.
ModelModel SummaryVariance AnalysisUnstandardized CoefficientstSig.
RR2FSig.BStd. Error
(Constant) −0.0700.344−0.2040.839
Perceived Leader Dependence0.6630.44076.9500.0000.4830.0756.4260.000
Perceived Information Disclosure0.6170.0797.8630.000
Table 12. Regression Analysis of Perceived Leader Trust on Employee Relationship Performance.
ModelModel SummaryVariance AnalysisUnstandardized CoefficientstSig.
RR2FSig.BStd. Error
(Constant) 0.4270.2851.5010.135
Perceived Leader Dependence0.6680.44678.7650.0000.4280.0626.8880.000
Perceived Information Disclosure0.4940.0657.5960.000
Table 13. Regression Analysis of Perceived Leader Trust on Employee Work Performance.
ModelModel SummaryVariance AnalysisUnstandardized CoefficientstSig.
RR2FSig.BStd. Error
(Constant) 0.1990.2780.7160.475
Perceived Leader Trust0.7440.554244.6460.0001.1230.07215.6410.000
Table 14. Regression Analysis of Perceived Leader Trust on Work Meaning.
ModelModel SummaryVariance AnalysisUnstandardized CoefficientstSig.
RR2FSig.BStd. Error
(Constant) 2.5920.3417.6100.000
Perceived Leader Dependence0.2940.0869.2400.0000.2540.0743.4080.001
Perceived Information Disclosure0.1040.0781.3340.184
Table 15. Regression Analysis of Perceived Leader Trust on Ability.
ModelModel SummaryVariance AnalysisUnstandardized CoefficientstSig.
RR2FSig.BStd. Error
(Constant) 1.7620.3415.1660.000
Perceived Leader Dependence0.4180.17420.7050.0000.2230.0742.9960.003
Perceived Information Disclosure0.3400.0784.3710.000
Table 16. Regression Analysis of Perceived Leadership Trust on Autonomy.
ModelModel SummaryVariance AnalysisUnstandardized CoefficientstSig.
RR2FSig.BStd. Error
(Constant) 1.5730.3224.8870.000
Perceived Leader Dependence0.4770.22828.8640.0000.2670.0703.7950.000
Perceived Information Disclosure0.3630.0744.9410.000
Table 17. Regression Analysis of Perceived Leadership Trust on Influence.
ModelModel SummaryVariance AnalysisUnstandardized CoefficientstSig.
RR2FSig.BStd. Error
(Constant) 1.5730.3224.8870.000
Perceived Leader Dependence0.4660.21727.2190.0000.1920.0742.6090.001
Perceived Information Disclosure0.4340.0775.6370.000
Table 18. Regression Analysis of Perceived Leader Trust on Psychological Empowerment.
ModelModel SummaryVariance AnalysisUnstandardized CoefficientstSig.
RR2FSig.BStd. Error
(Constant) 1.8520.2188.5120.000
Perceived Leader Trust0.5680.32394.0100.0000.5450.0569.6960.000
Table 19. Regression Analysis of Psychological Empowerment on Employee Task Performance.
ModelModel SummaryVariance AnalysisUnstandardized CoefficientstSig.
RR2FSig.BStd. Error
(Constant) −1.1440.299−3.8200.000
Work Meaning0.8000.64086.2840.0000.1990.0603.3040.001
Ability0.2590.0624.1470.000
Autonomy0.5060.0647.9020.000
Influence0.3760.0596.4310.000
Table 20. Regression Analysis of Psychological Empowerment on Employee Relationship Performance.
ModelModel SummaryVariance AnalysisUnstandardized CoefficientstSig.
RR2FSig.BStd. Error
(Constant) 0.6070.3241.8750.062
Work Meaning0.6260.39231.3320.0000.1150.0651.7610.080
Ability0.2940.0684.3440.000
Autonomy0.0970.0691.4030.162
Influence0.3500.0635.5210.000
Table 21. Regression Analysis of Psychological Empowerment on Employee Work Performance.
ModelModel SummaryVariance AnalysisUnstandardized CoefficientstSig.
RR2FSig.BStd. Error
(Constant) −0.3820.275−1.3870.167
Psychological Empowerment0.7870.620320.8770.0001.2400.06917.9130.000
Table 22. Test of the Mediating Effect of Psychological Empowerment between Perceived Leader Dependence and Employee Task Performance.
Regression ModelVariance AnalysisCoefficient Analysis
X = Perceived Leader Dependence;
M = Psychological Empowerment;
Y = Employee Task Performance
R2FSig.BSig.
Model 1: X → Y 0.26370.3560.0000.6790.000
Model 2: M → Y 0.616316.5350.0001.3600.000
Model 3: X and M → YM → Y0.653184.0930.0001.2000.000
X → Y0.2800.000
ConclusionPsychological Empowerment plays a partial mediating role between Perceived Leader Dependence on Employee Task Performance.
Table 23. Test of the Mediating Effect of Psychological Empowerment between Perceived Leader Dependence and Employee Relationship Performance.
Regression ModelVariance AnalysisCoefficient Analysis
X = Perceived Leader Dependence;
M = Psychological Empowerment;
Y = Employee Relationship Performance
R2FSig.BSig.
Model 1: X → Y 0.28277.5130.0000.5860.000
Model 2: M → Y 0.366113.8320.0000.8730.000
Model 3: X and M → YM → Y0.45581.7640.0000.6650.000
X → Y0.3650.000
ConclusionPsychological Empowerment plays a partial mediating role between Perceived Leader Dependence and Employee Relationship Performance.
Table 24. Test of the Mediating Effect of Psychological Empowerment between Perceived Information Disclosure and Employee Task Performance.
Regression ModelVariance AnalysisCoefficient Analysis
X = Perceived Leader Dependence;
M = Psychological Empowerment;
Y = Employee Task Performance
R2FSig.BSig.
Model 1: X → Y 0.32293.4820.0000.7860.000
Model 2: M → Y 0.616316.5350.0001.3600.000
Model 3: X and M → YM → Y0.660190.4720.0001.1560.000
X → Y0.3330.000
ConclusionPsychological Empowerment plays a partial mediating role between Perceived Information Disclosure and Employee Task Performance.
Table 25. Test of the Mediating Effect of Psychological Empowerment between Perceived Information Disclosure and Employee Relationship Performance.
Regression ModelVariance AnalysisCoefficient Analysis
X = Perceived Information Disclosure;
M = Psychological Empowerment;
Y = Employee Relationship Performance
R2FSig.BSig.
Model 1: X → Y 0.31189.0850.0000.6430.000
Model 2: M → Y 0.366113.8320.0000.8730.000
Model 3: X and M → YM → Y0.45682.2220.0000.6290.000
X → Y0.3970.000
ConclusionPsychological Empowerment plays a partial mediating role between Perceived Information Disclosure and Employee Relationship Performance.
Table 26. Test of the Mediating Effect of Psychological Empowerment between Perceived Leader Trust and Employee Work Performance.
Regression ModelVariance AnalysisCoefficient Analysis
X = Perceived Leader Trust;
M = Psychological Empowerment;
Y = Employee Work Performance
R2FSig.BSig.
Model 1: X → Y 0.544244.6460.0001.1230.000
Model 2: M → Y 0.620320.8770.0001.2400.000
Model 3: X and M → YM → Y0.750293.6840.0000.8470.000
X → Y0.6620.000
ConclusionPsychological Empowerment plays a partial mediating role between Perceived Leader Trust and Employee Work Performance.
Table 27. Summary of Research Hypotheses.
No.Research HypothesesTest Result
H1Perceived Leader Trust positively affects Employee Work Performance.Valid
H1aPerceived Leader Dependence positively affects Employee Task Performance.Valid
H1bPerceived Information Disclosure positively affects Employee Task Performance.Valid
H1cPerceived Leader Dependence positively affects Employee Relationship Performance.Valid
H1dPerceived Information Disclosure positively affects Employee Relationship Performance.Valid
H2Perceived Leader Trust positively affects Employee Psychological Empowerment.Partial Valid
H2aPerceived Leader Dependence positively affects Employee Work Meaning.Valid
H2bPerceived Leader Dependence positively affects Employee Ability.Valid
H2cPerceived Leader Dependence positively affects Employee Autonomy.Valid
H2dPerceived Leader Dependence positively affects Employee Influence.Valid
H2ePerceived Information Disclosure positively affects Employee Work Meaning.Non-valid
H2fPerceived Information Disclosure positively affects Employee Ability.Valid
H2gPerceived Information Disclosure positively affects Employee Autonomy.Valid
H2hPerceived Information Disclosure positively affects Employee Influence.Valid
H3Psychological Empowerment positively affects Employee Work Performance.Partial Valid
H3aWork Meaning positively affects Employee Task Performance.Valid
H3bAbility positively affects Employee Task Performance.Valid
H3cAutonomy positively affects Employee Task Performance.Valid
H3dInfluence positively affects Employee Task Performance.Valid
H3eWork Meaning positively affects Employee Relationship Performance.Non-valid
H3fAbility positively affects Employee Relationship Performance.Valid
H3gAutonomy positively affects Employee Relationship Performance.Non-valid
H3hInfluence positively affects Employee Relationship Performance.Valid
H4Psychological Empowerment mediates between Perceived Leader Trust and Employee Work Performance.Partial Mediation
H4aPsychological Empowerment mediates between Perceived Leader Dependence and Employee Task Performance.Partial Mediation
H4bPsychological Empowerment mediates between Perceived Leader Dependence and Employee Relationship Performance.Partial Mediation
H4cPsychological Empowerment mediates between Perceived Information Disclosure and Employee Task Performance.Partial Mediation
H4dPsychological Empowerment mediates between Perceived Information Disclosure and Employee Relationship Performance.Partial Mediation
Publisher’s Note: MDPI stays neutral with regard to jurisdictional claims in published maps and institutional affiliations.

