
The Control of Metabolic CO2 in Public Transport as a Strategy to Reduce the Transmission of Respiratory Infectious Diseases


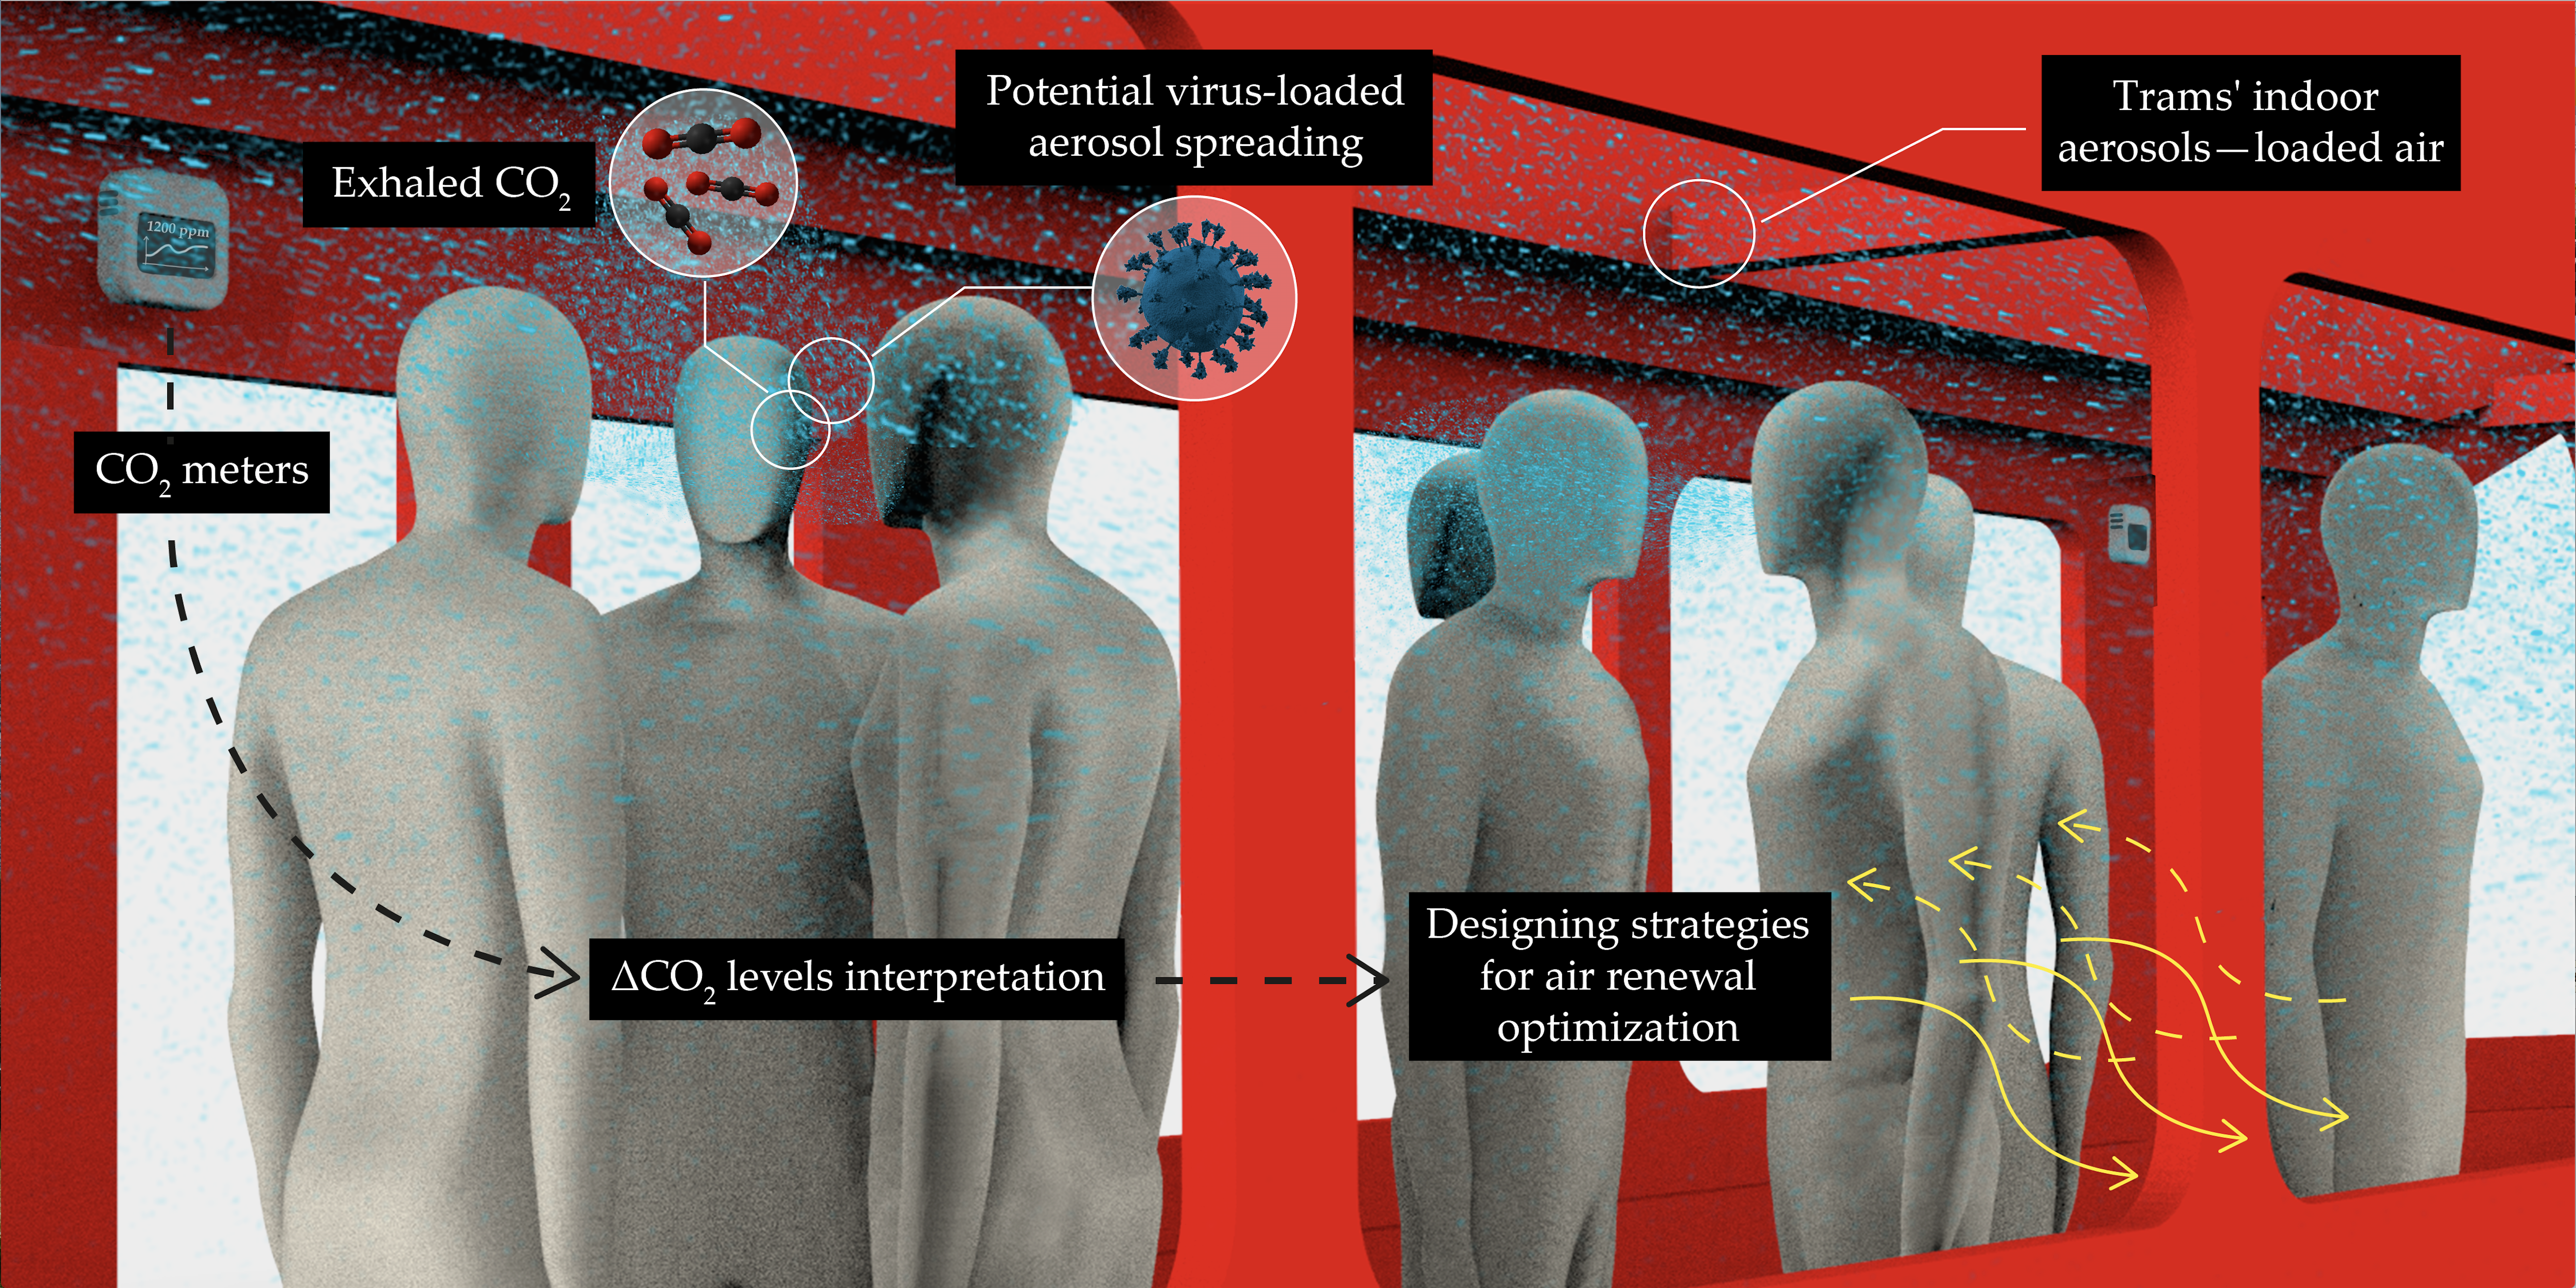
Abstract
: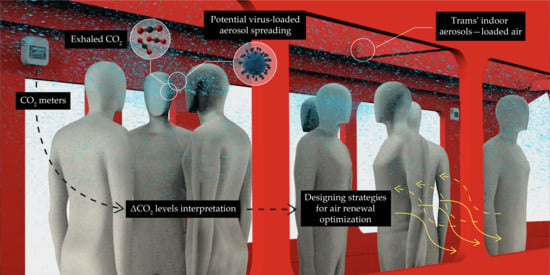
1. Introduction
2. Materials and Methods
2.1. Measurement of Metabolic CO2
2.2. Probability of Contagion Determination by the CO2 Level
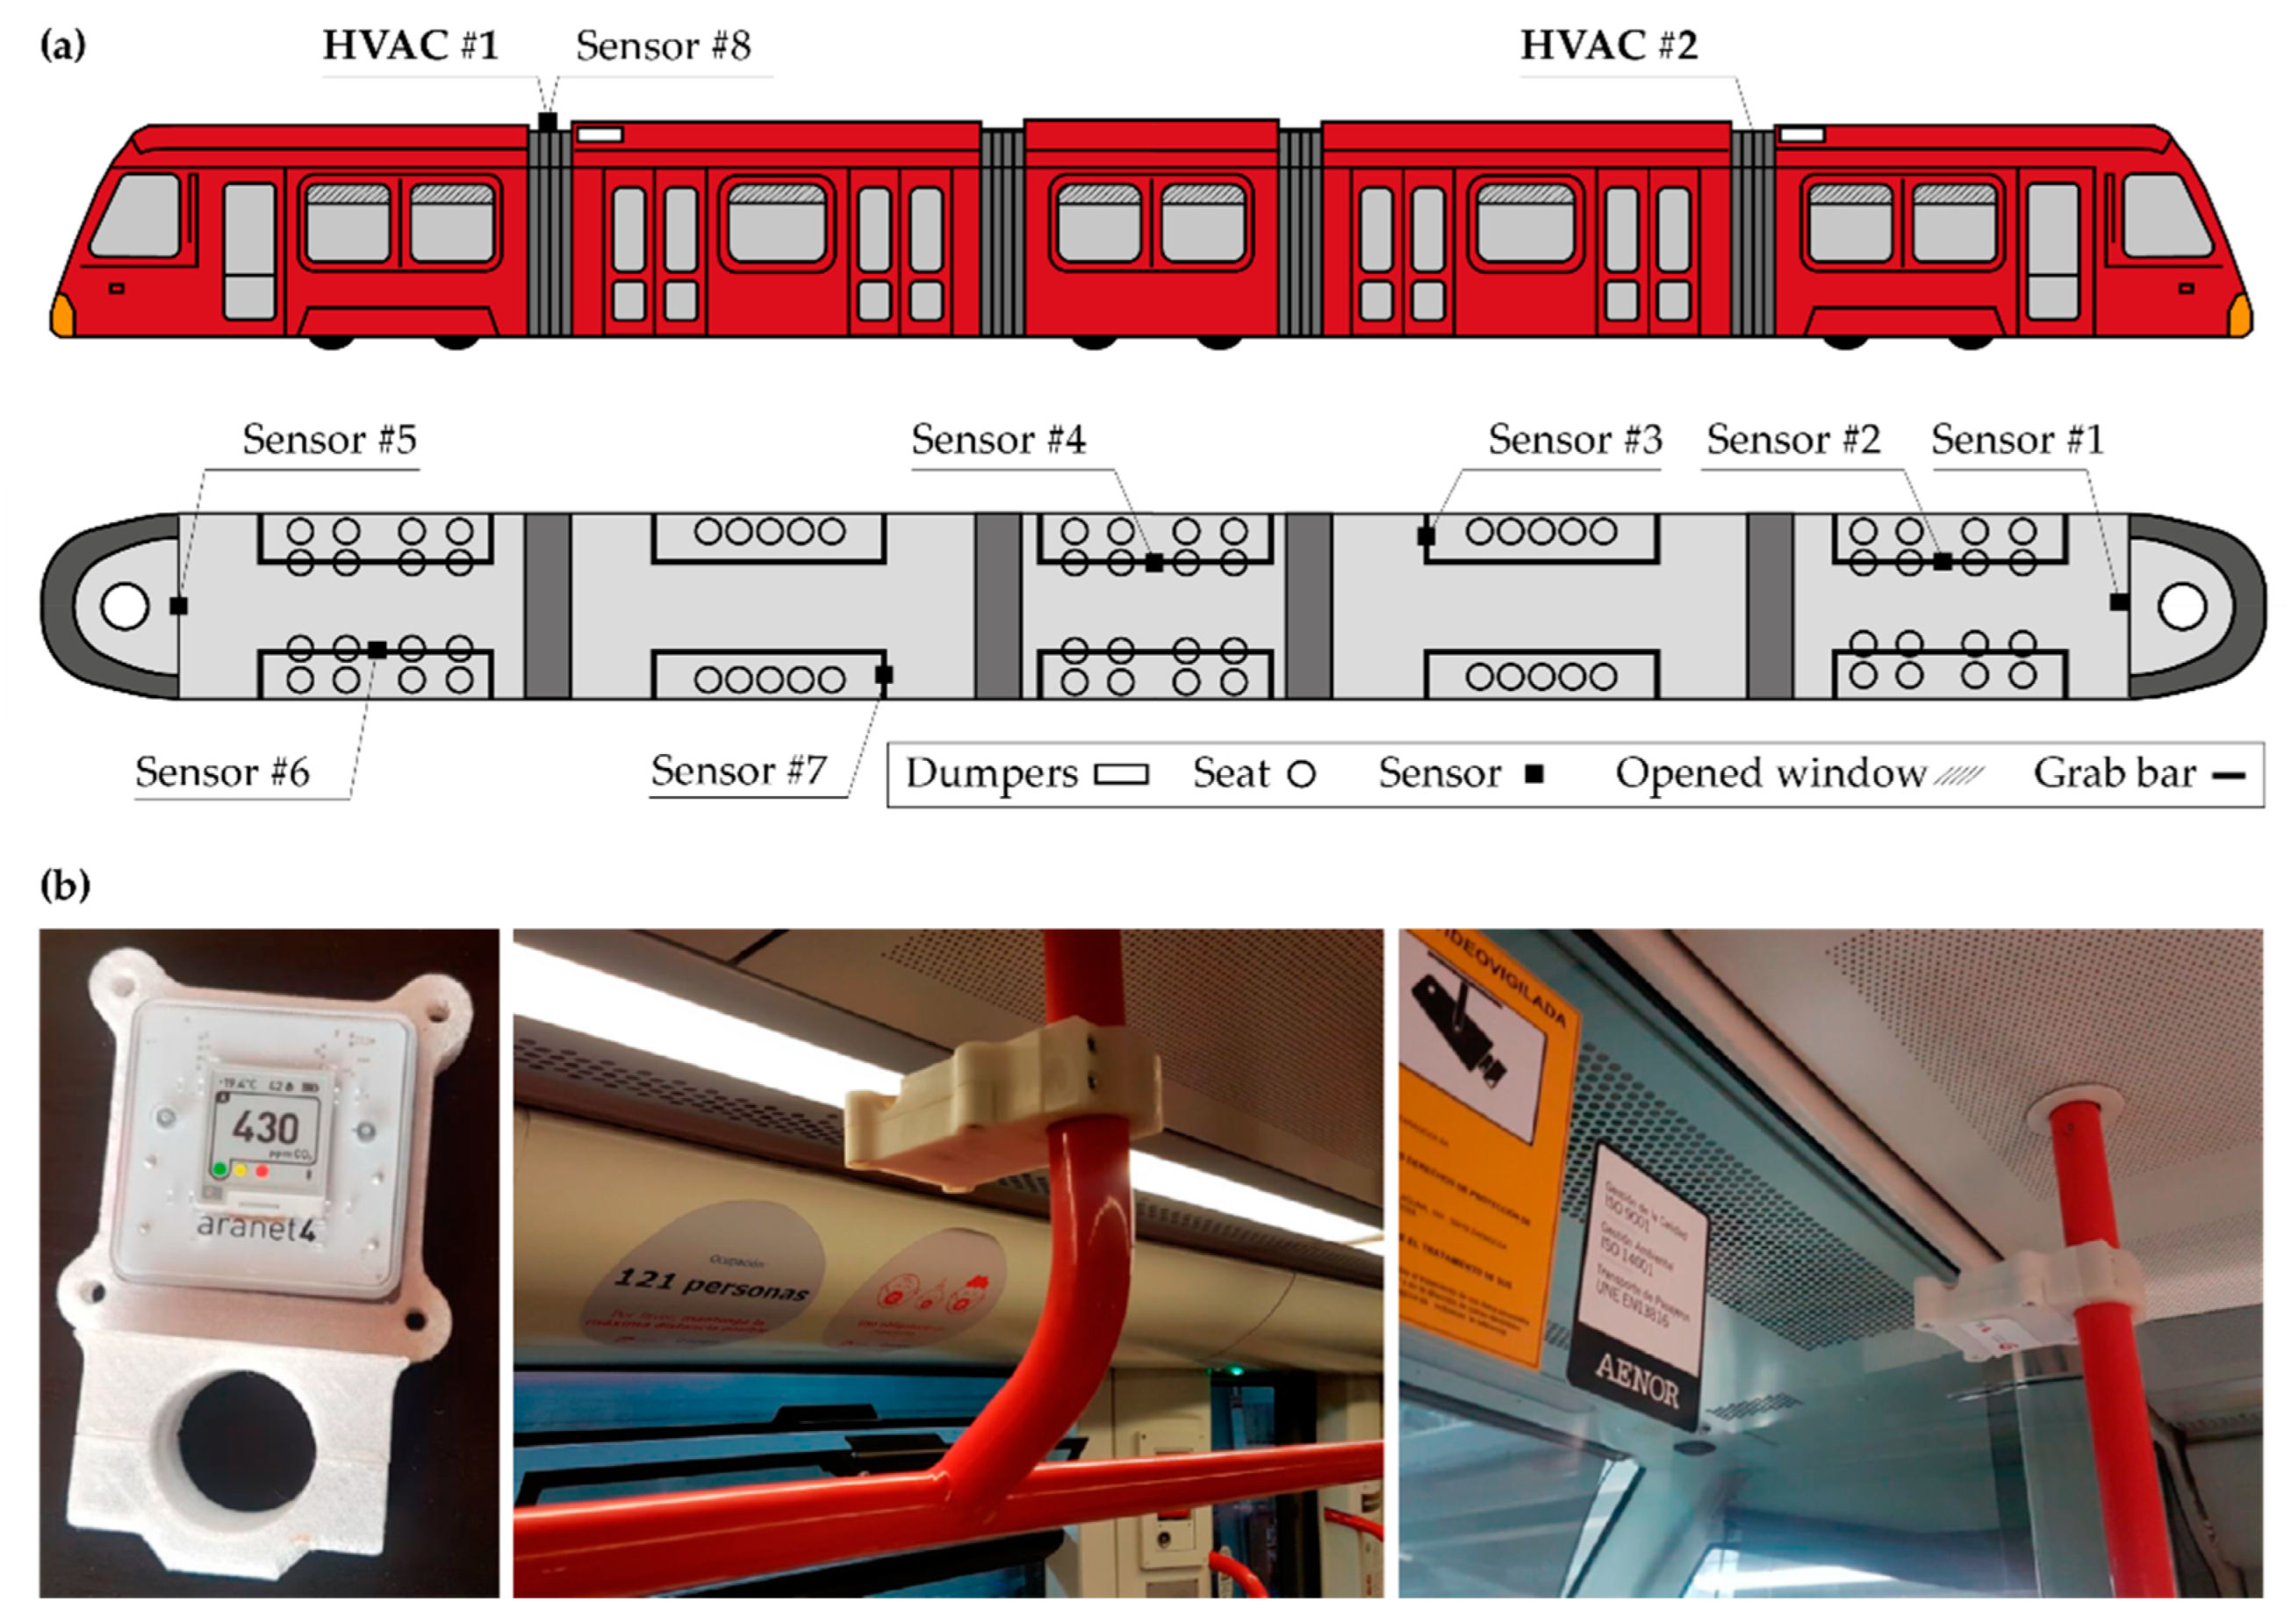
2.3. Studied Routes of the Zaragoza Tram
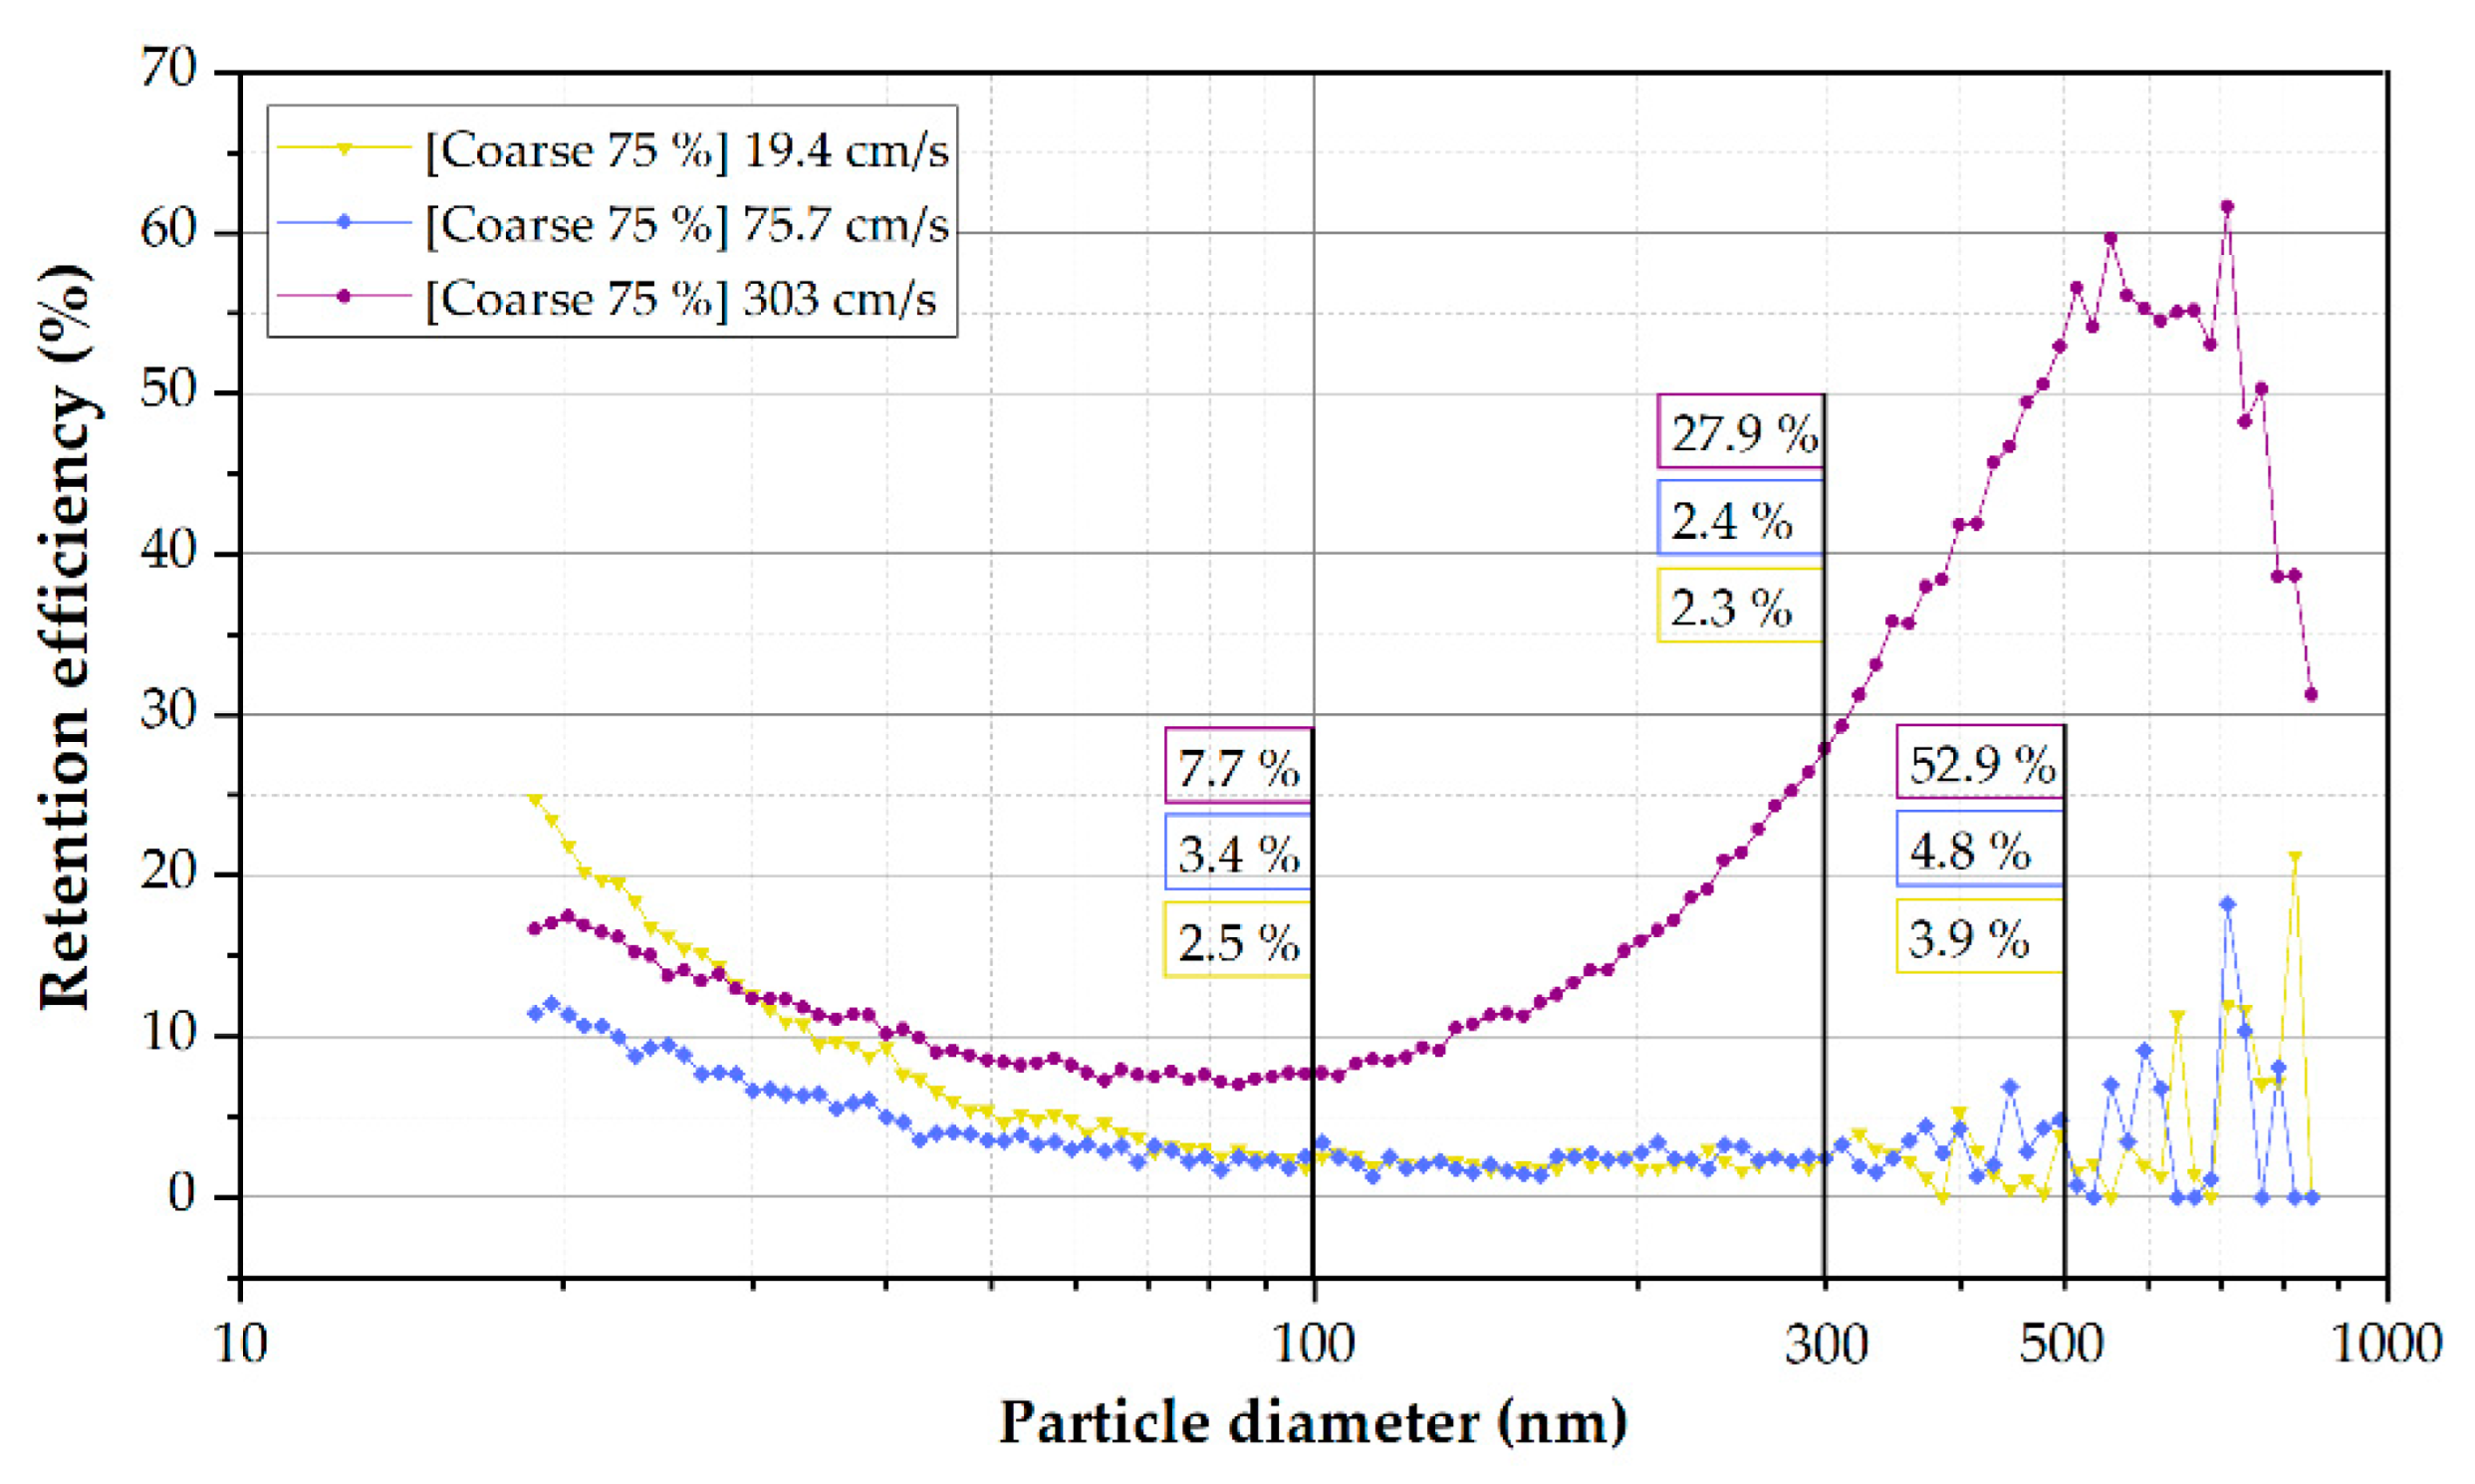
2.4. Determination of Filtration Efficiency against Submicron Particles and Filters’ Pressure Drop
2.5. Statistic Analysis
3. Results
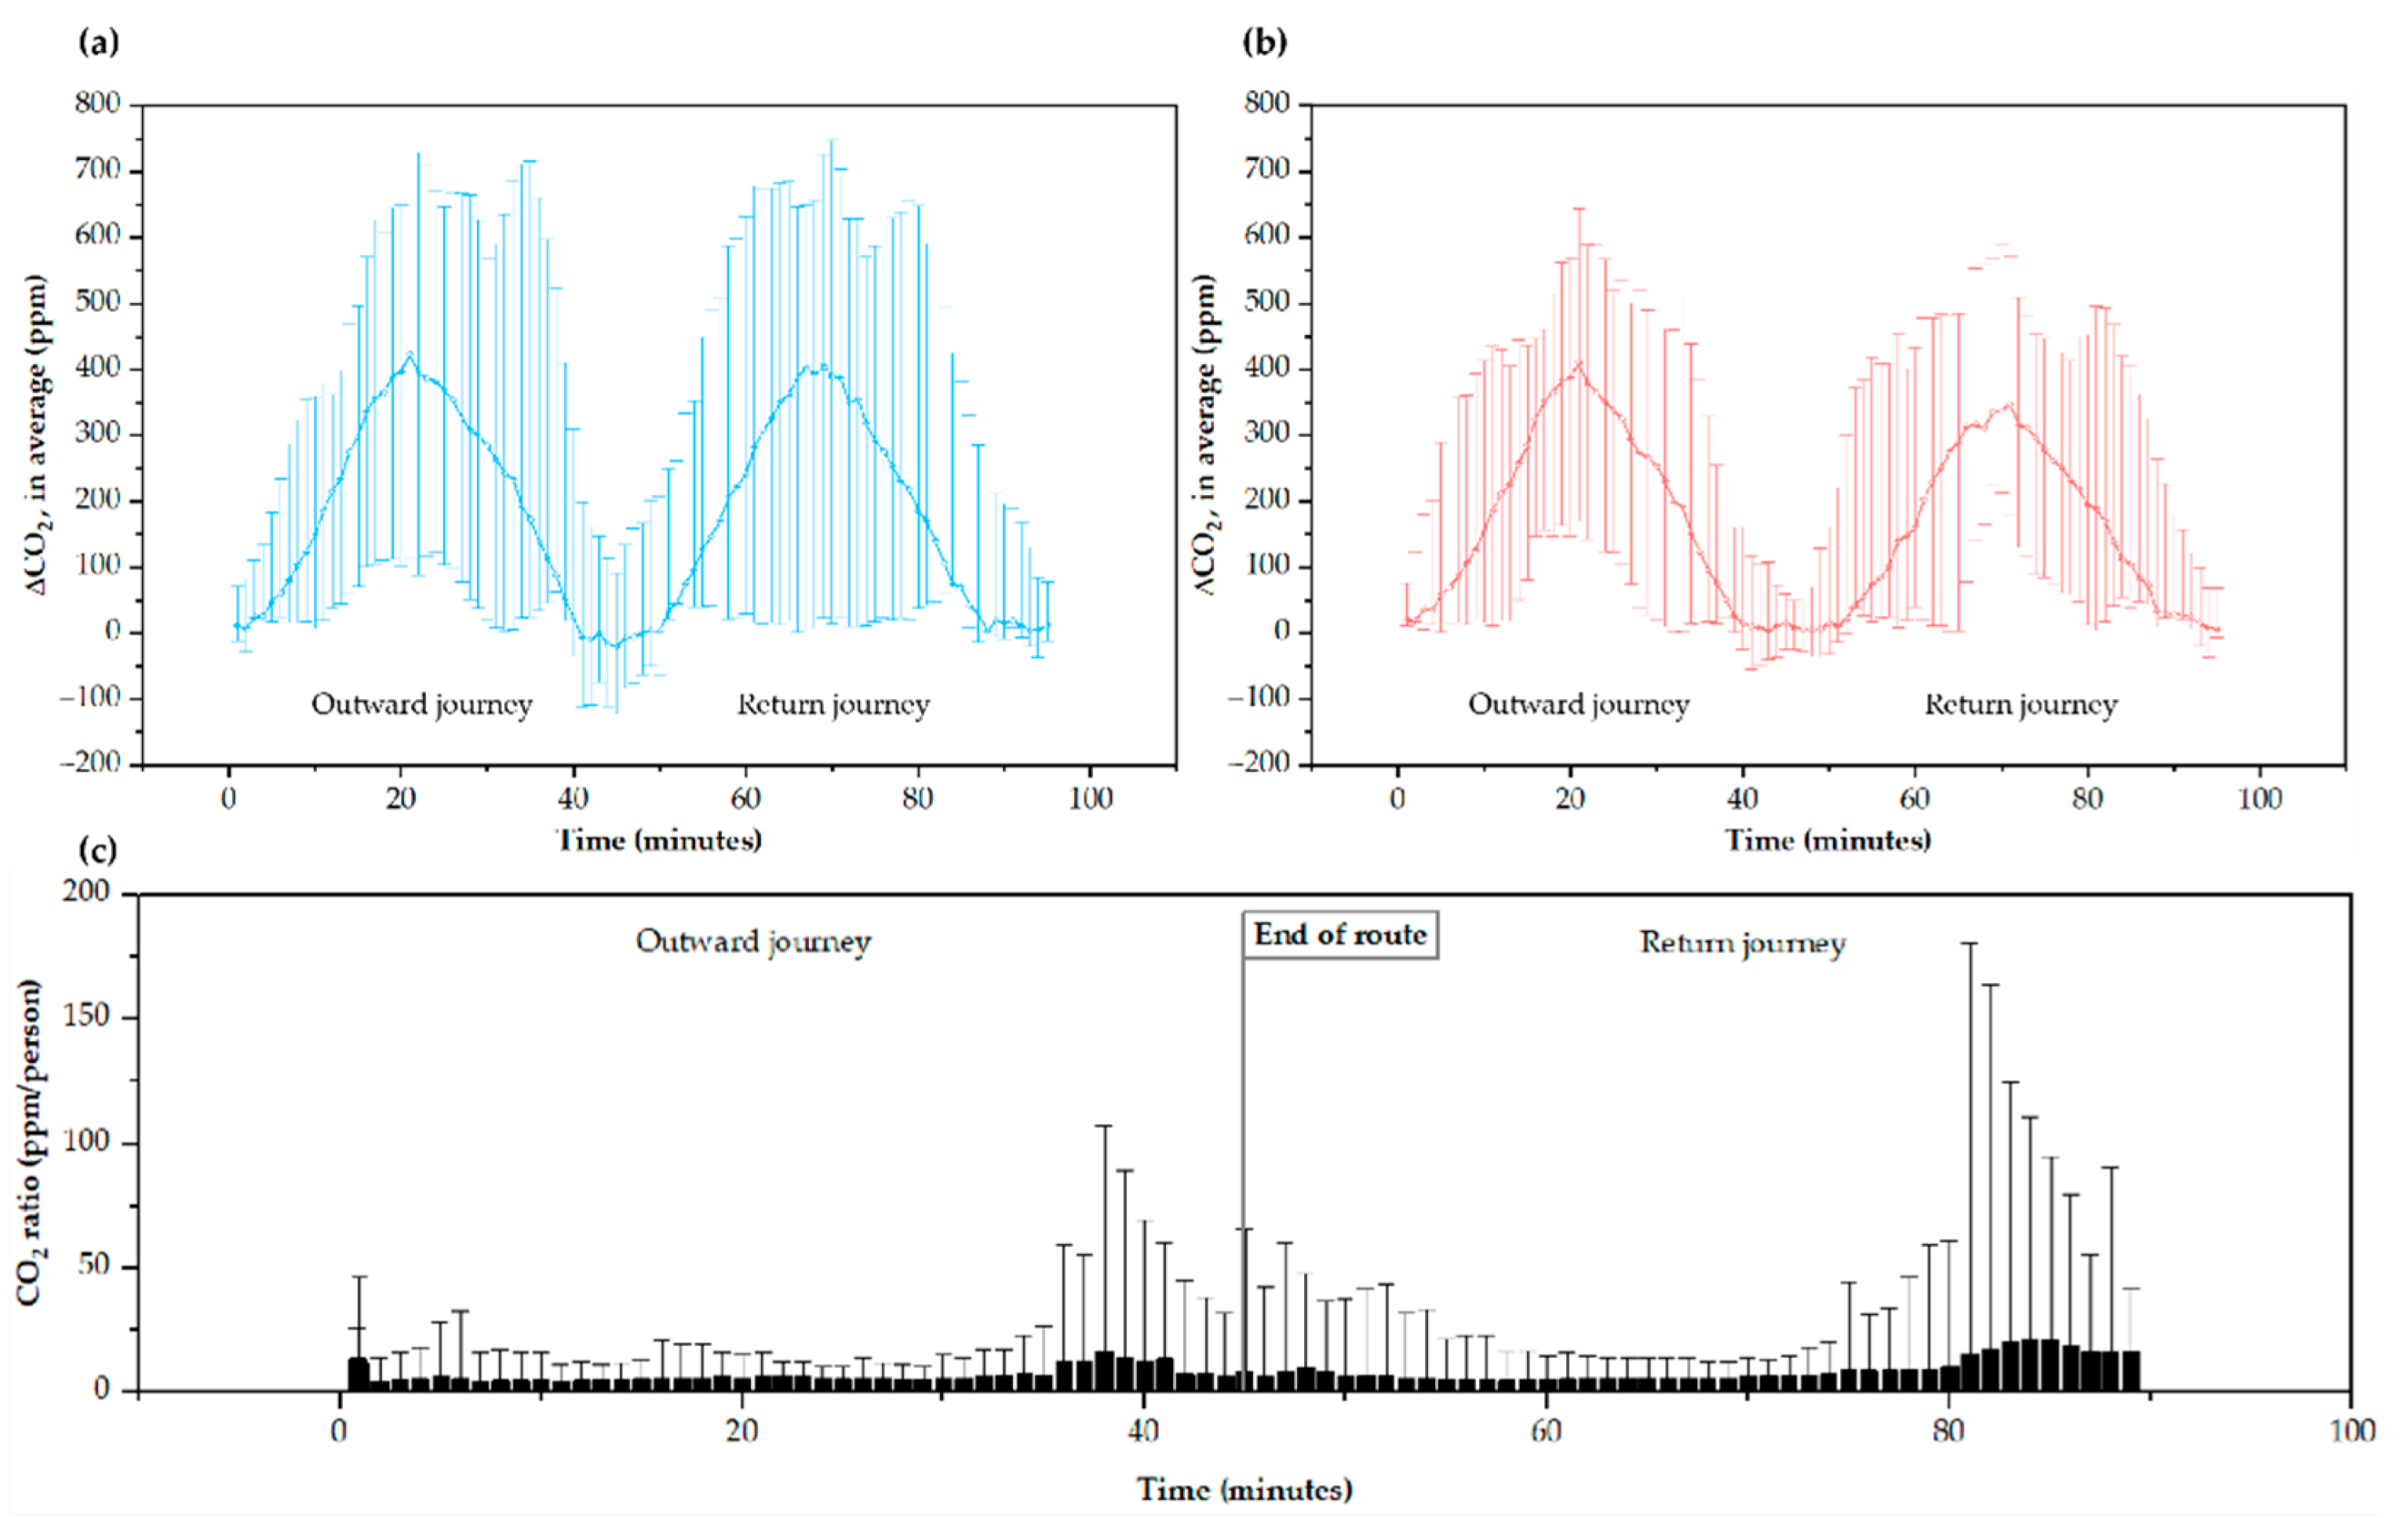
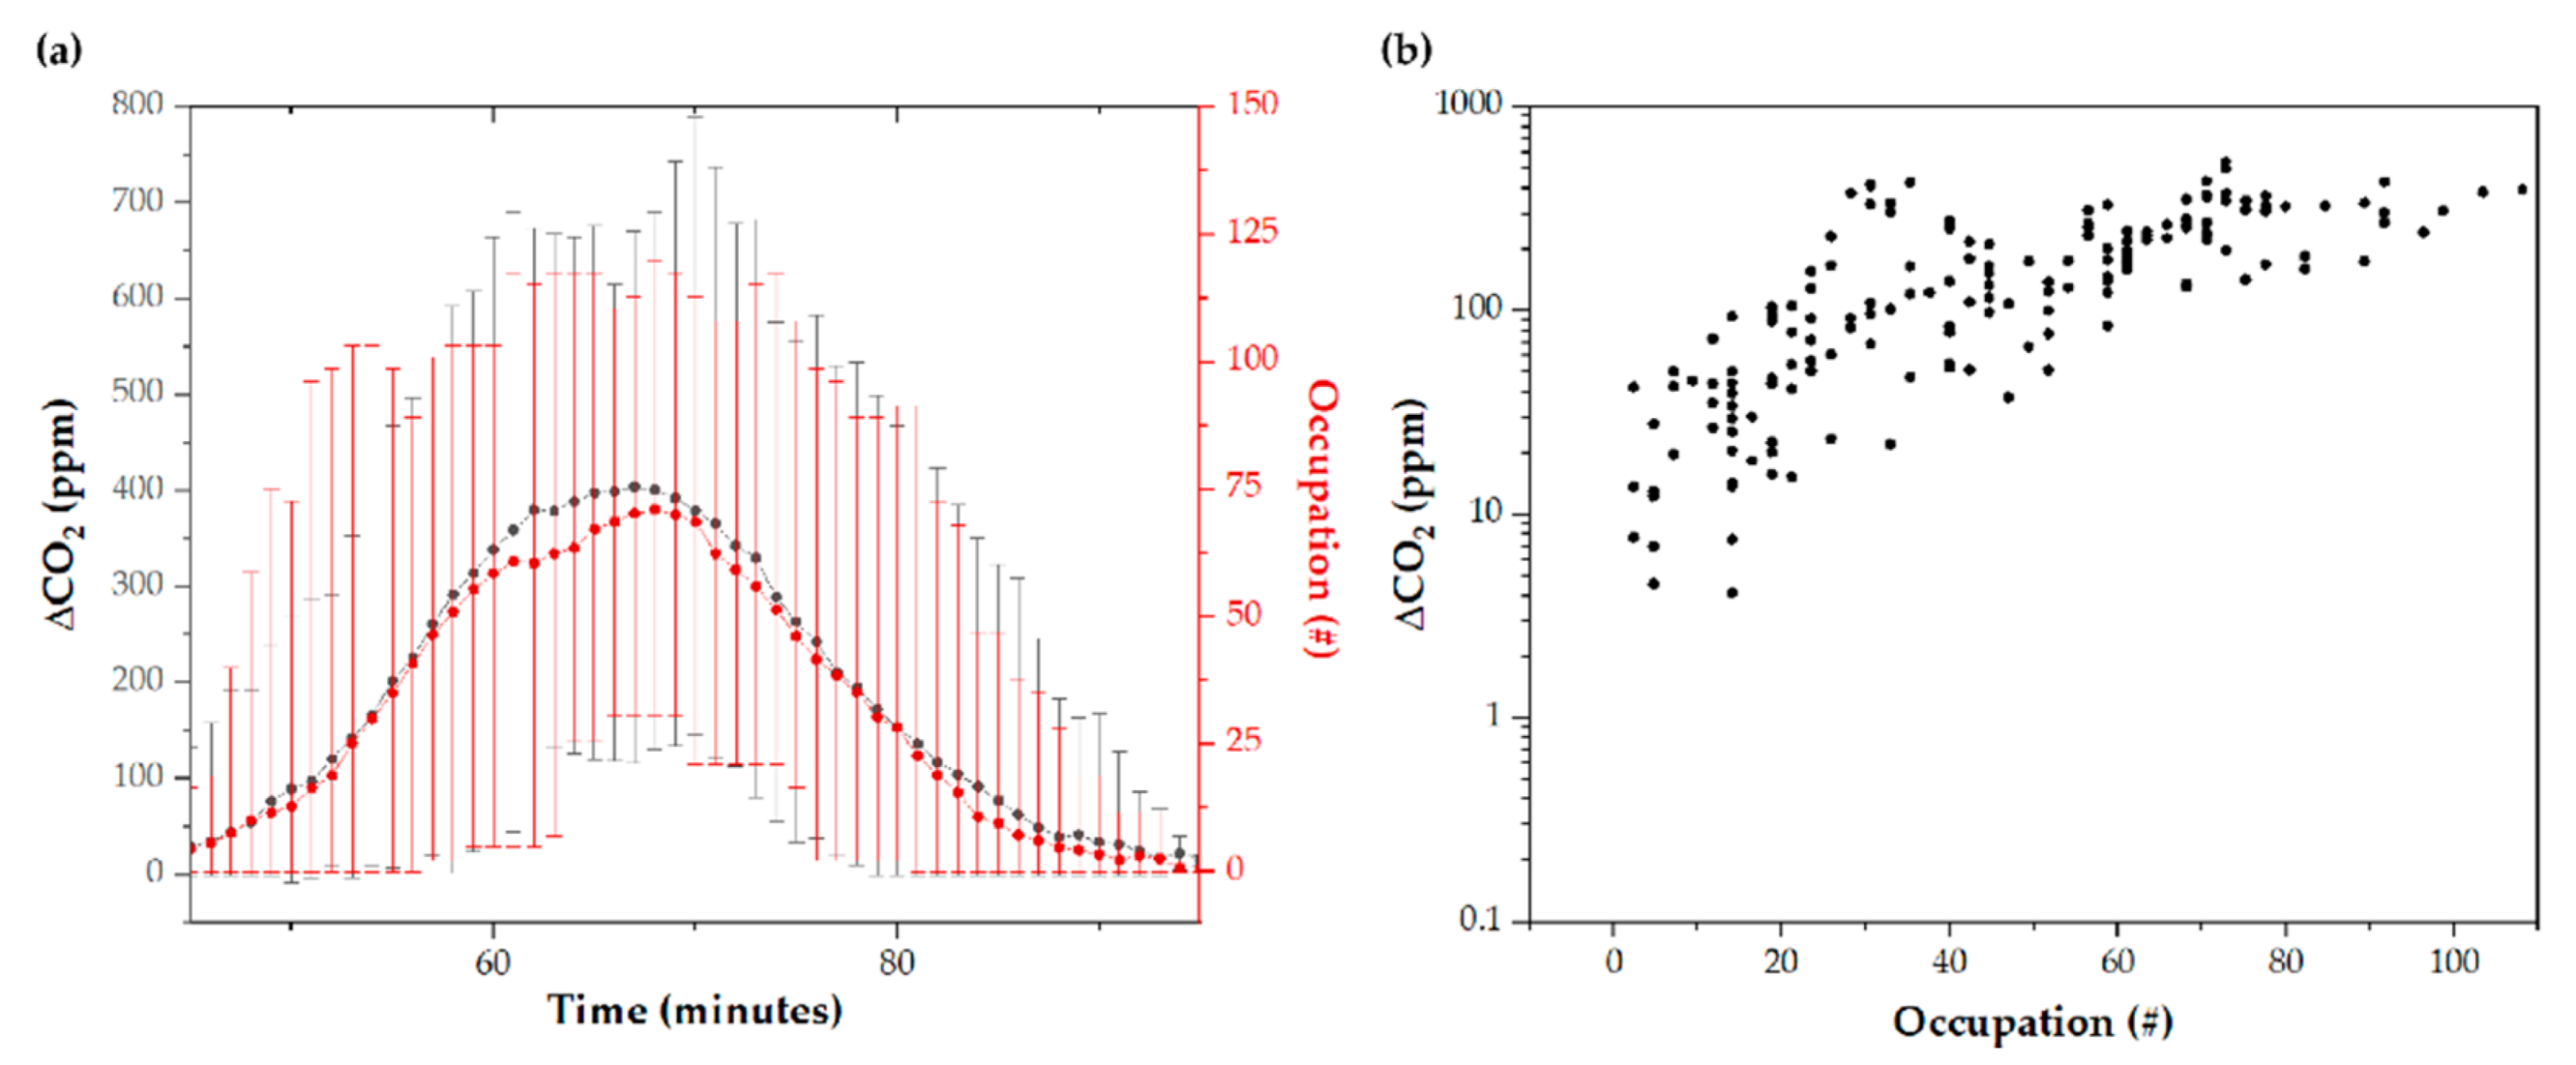
3.1. CO2 Levels along the Route Are Closely Related to Occupancy
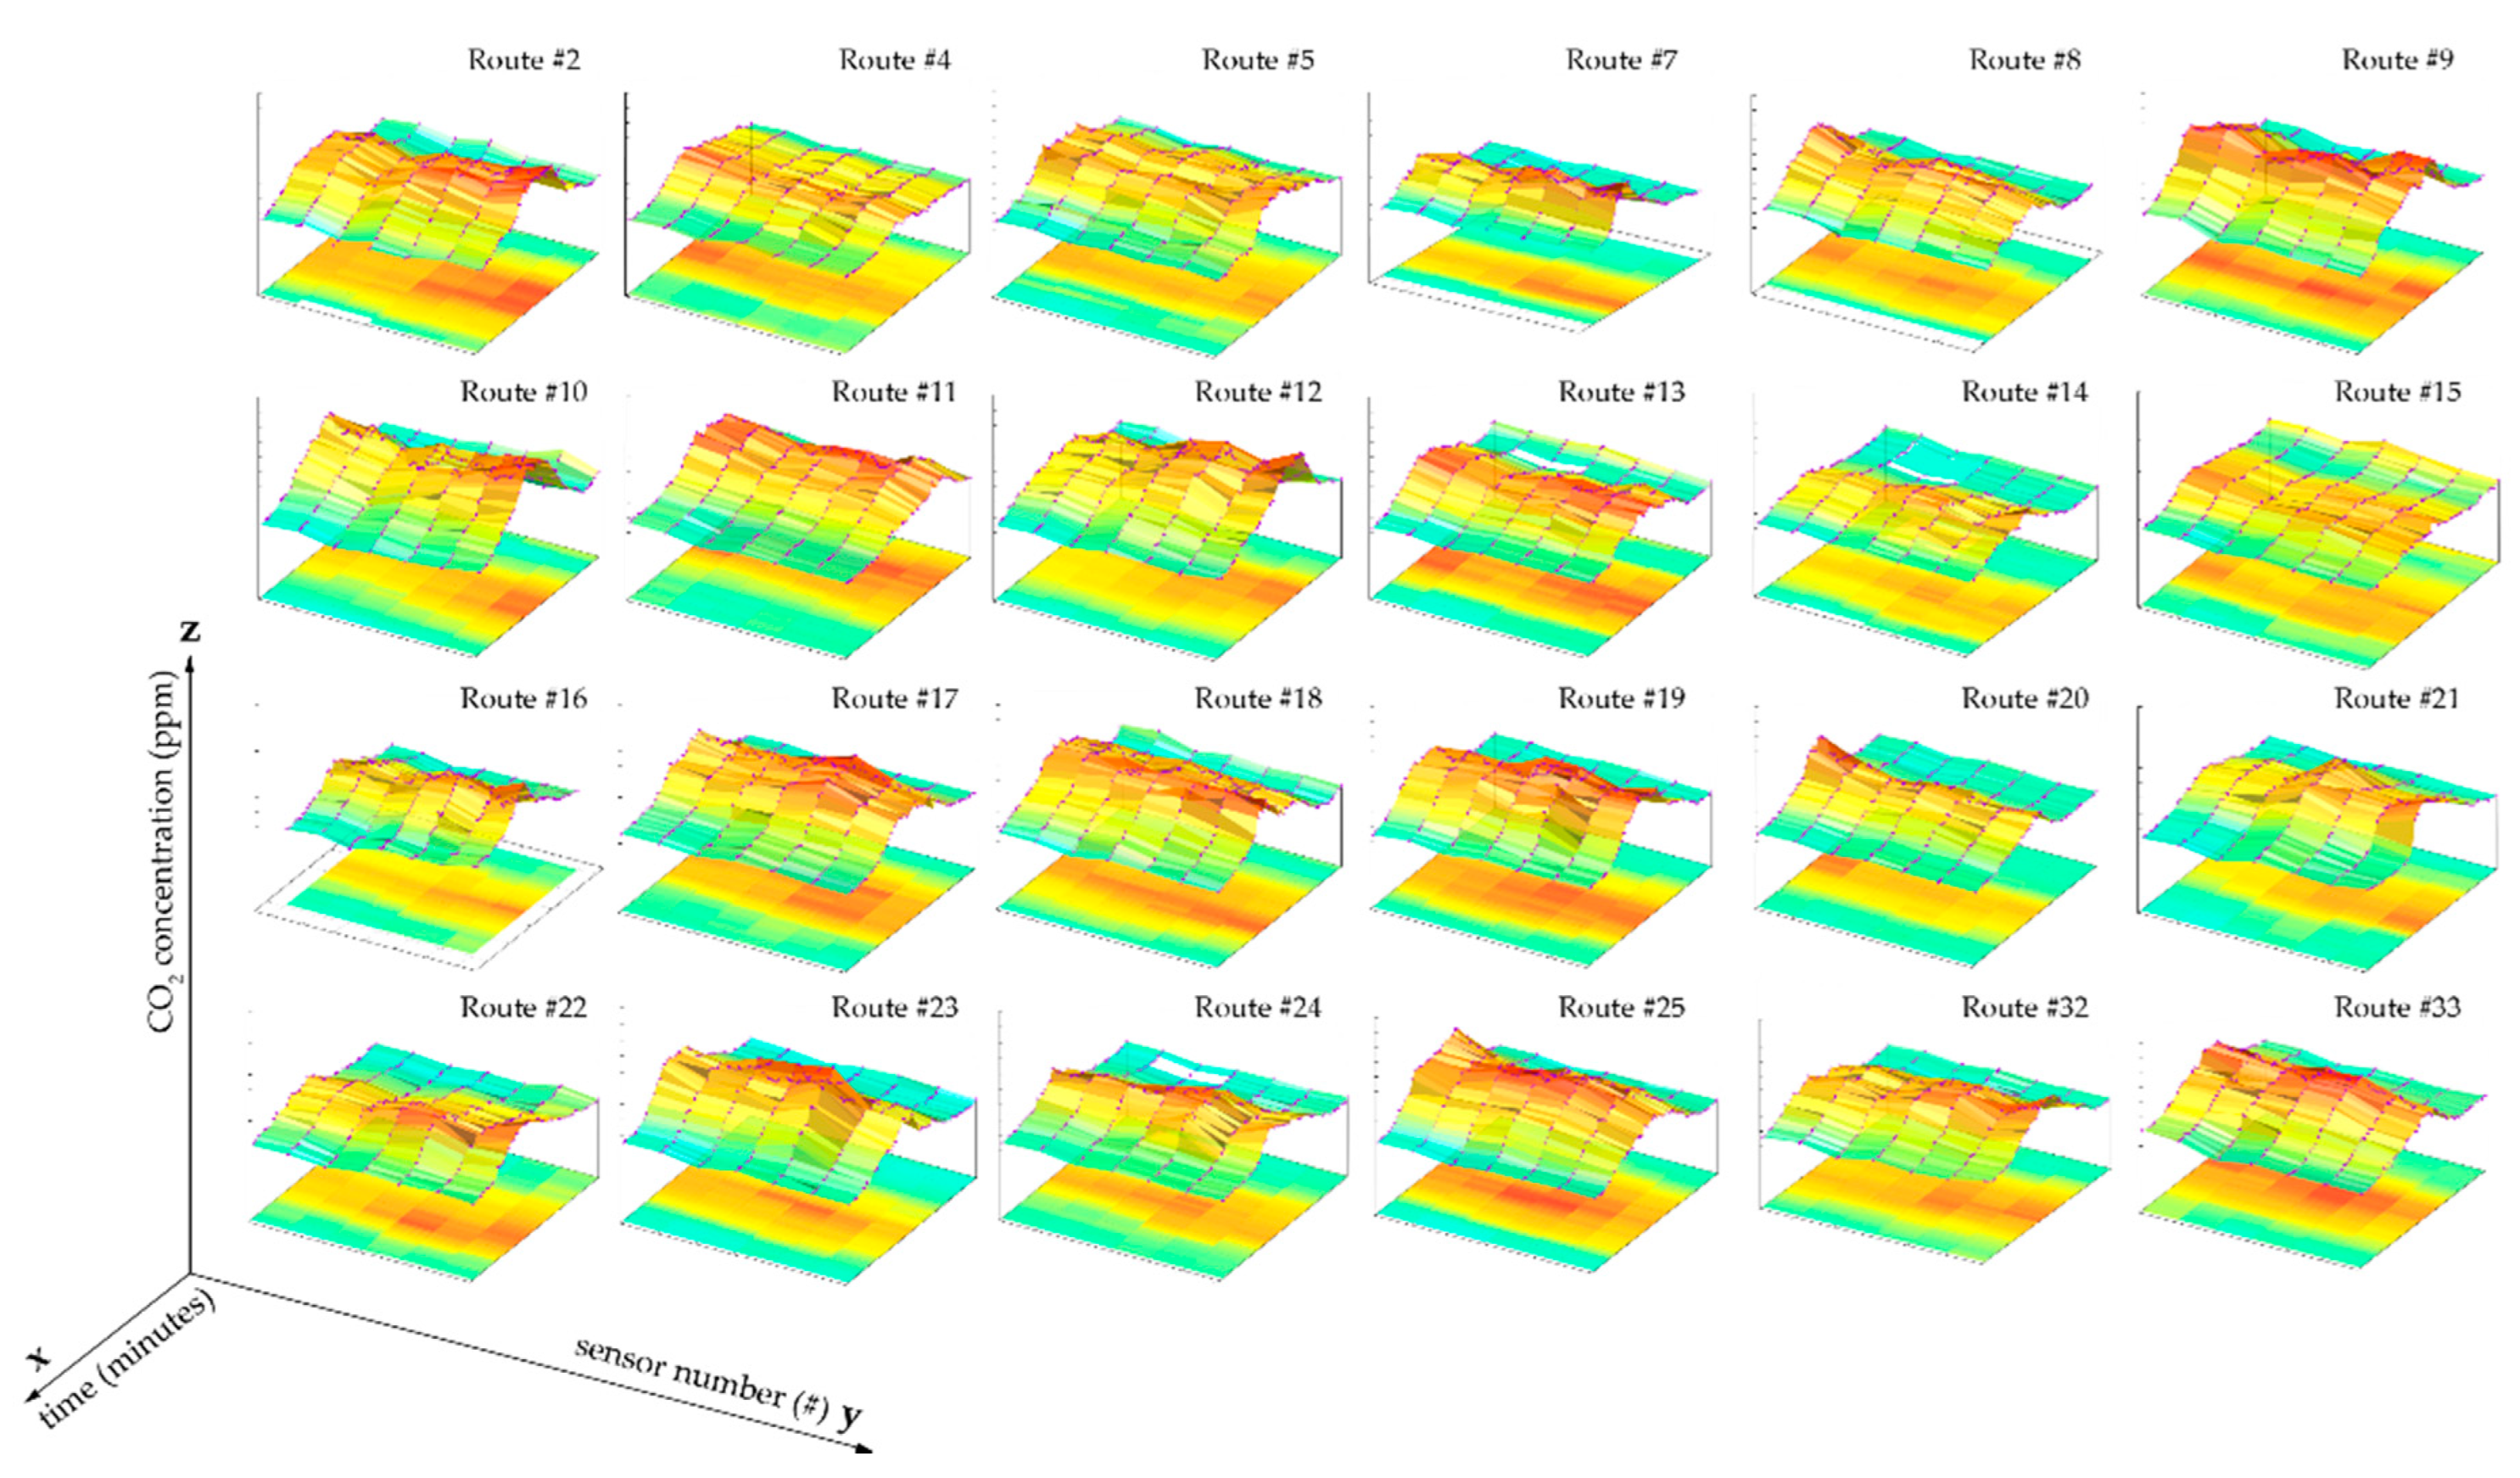
3.2. CO2 Levels Distribution Is Similar at Different Points Inside the Tram
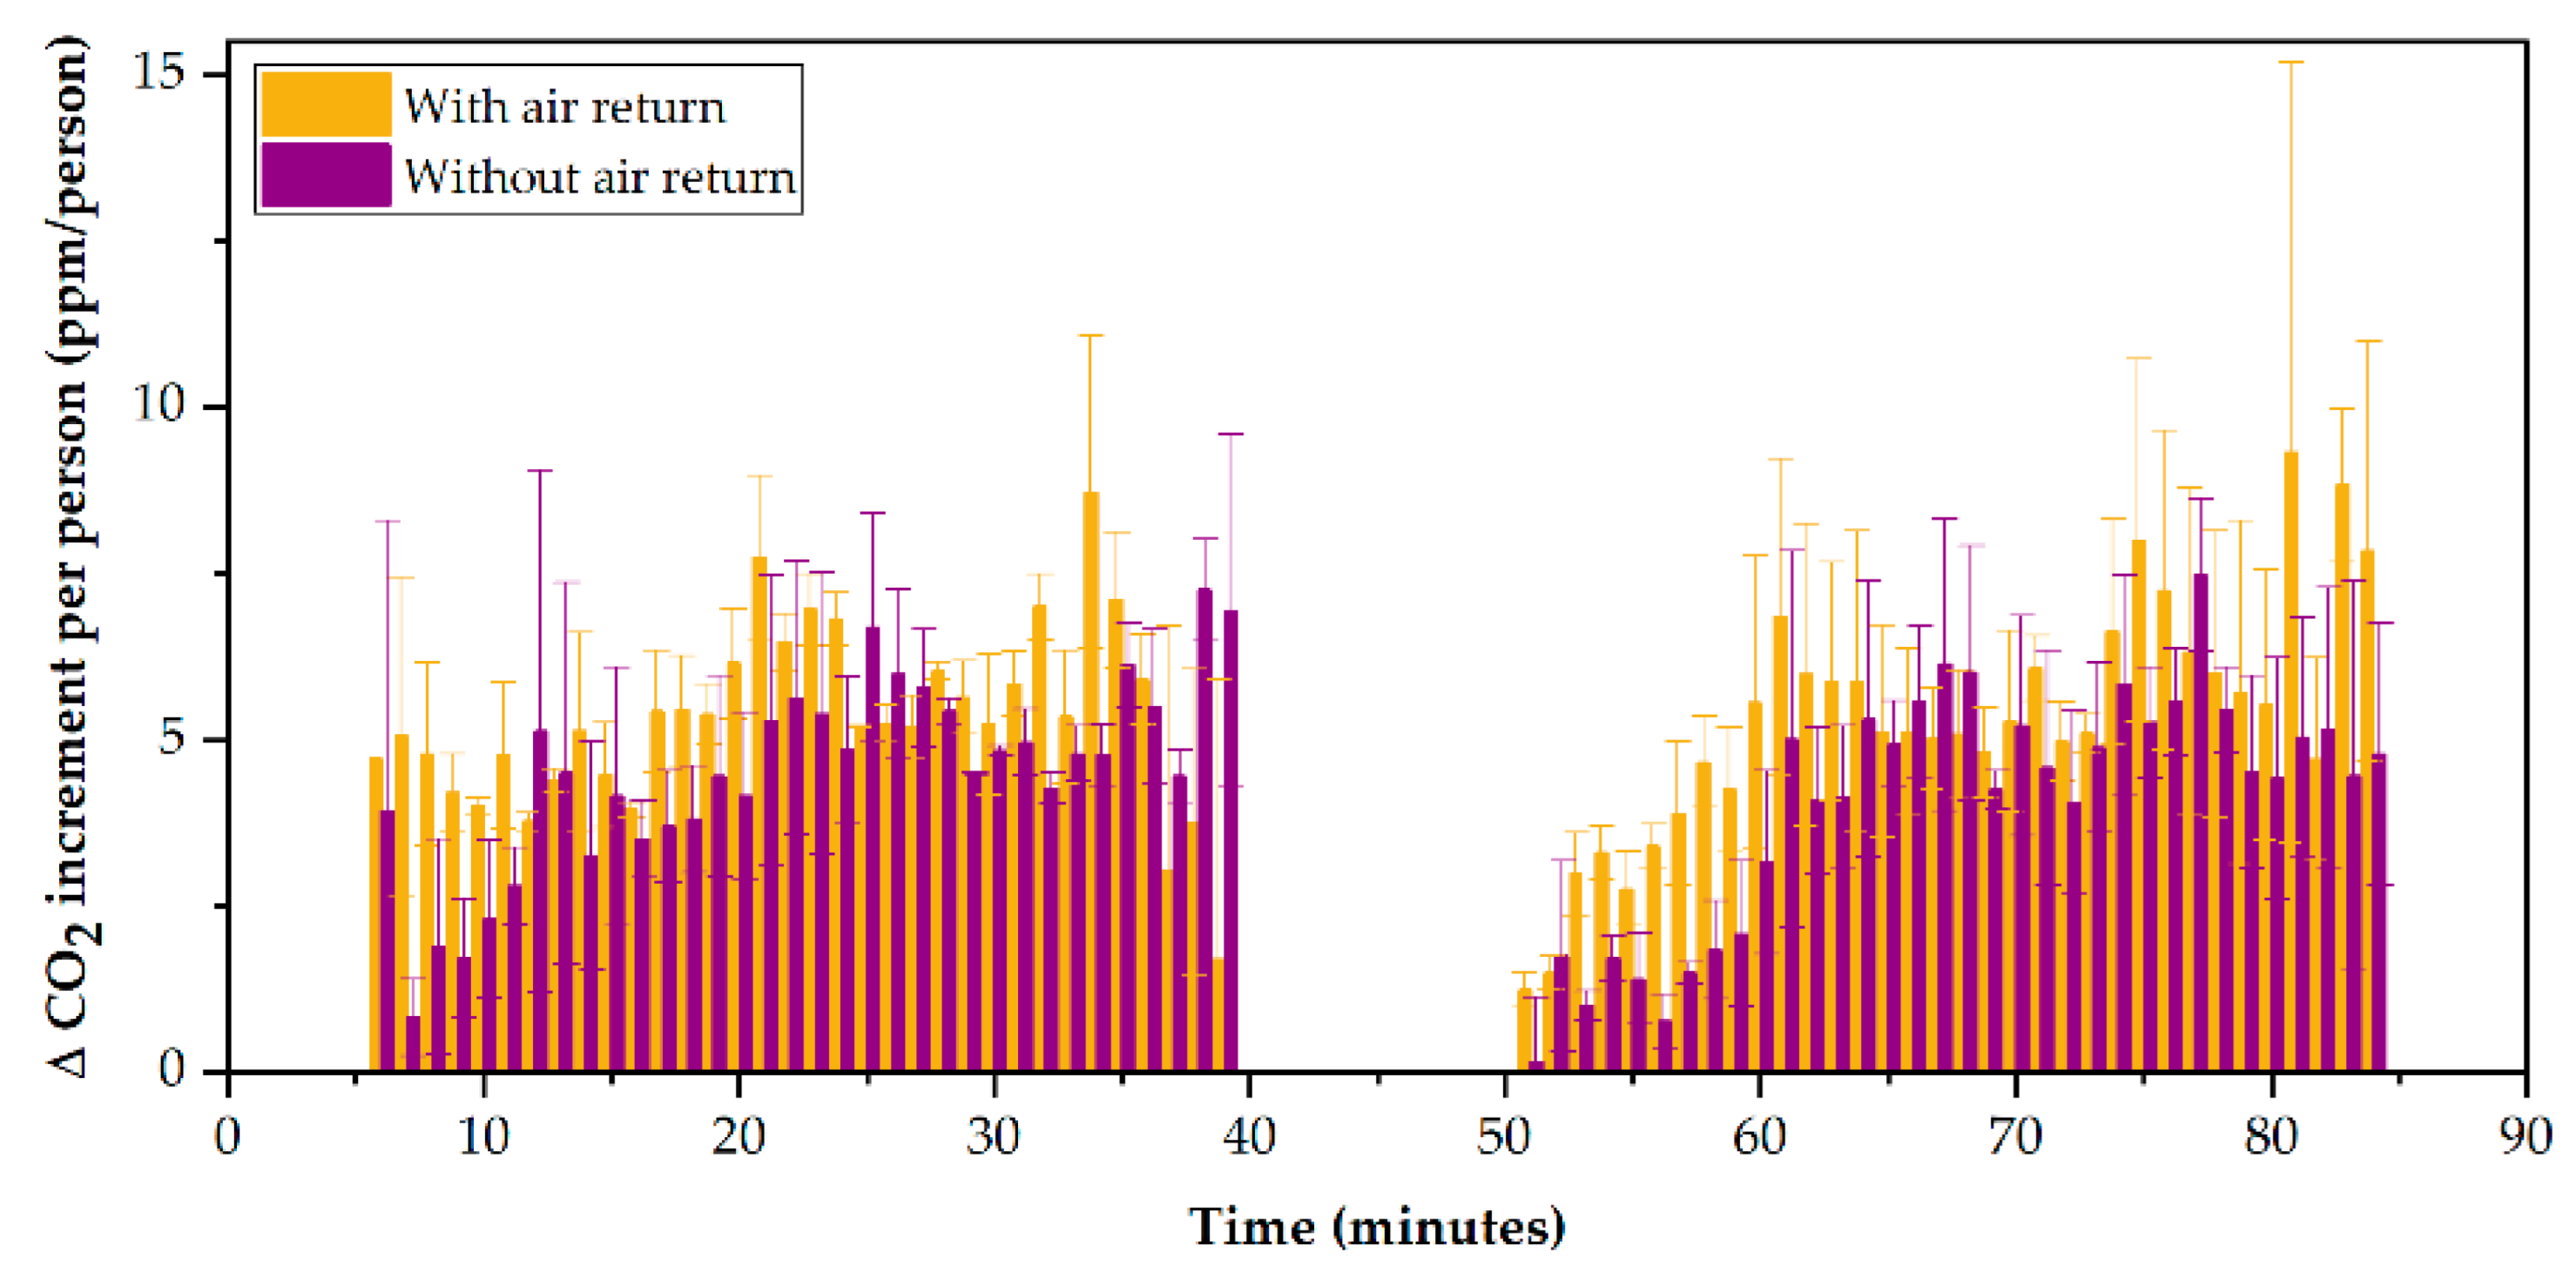
3.3. Improving the Air Renewal by the Closing of the Air Return
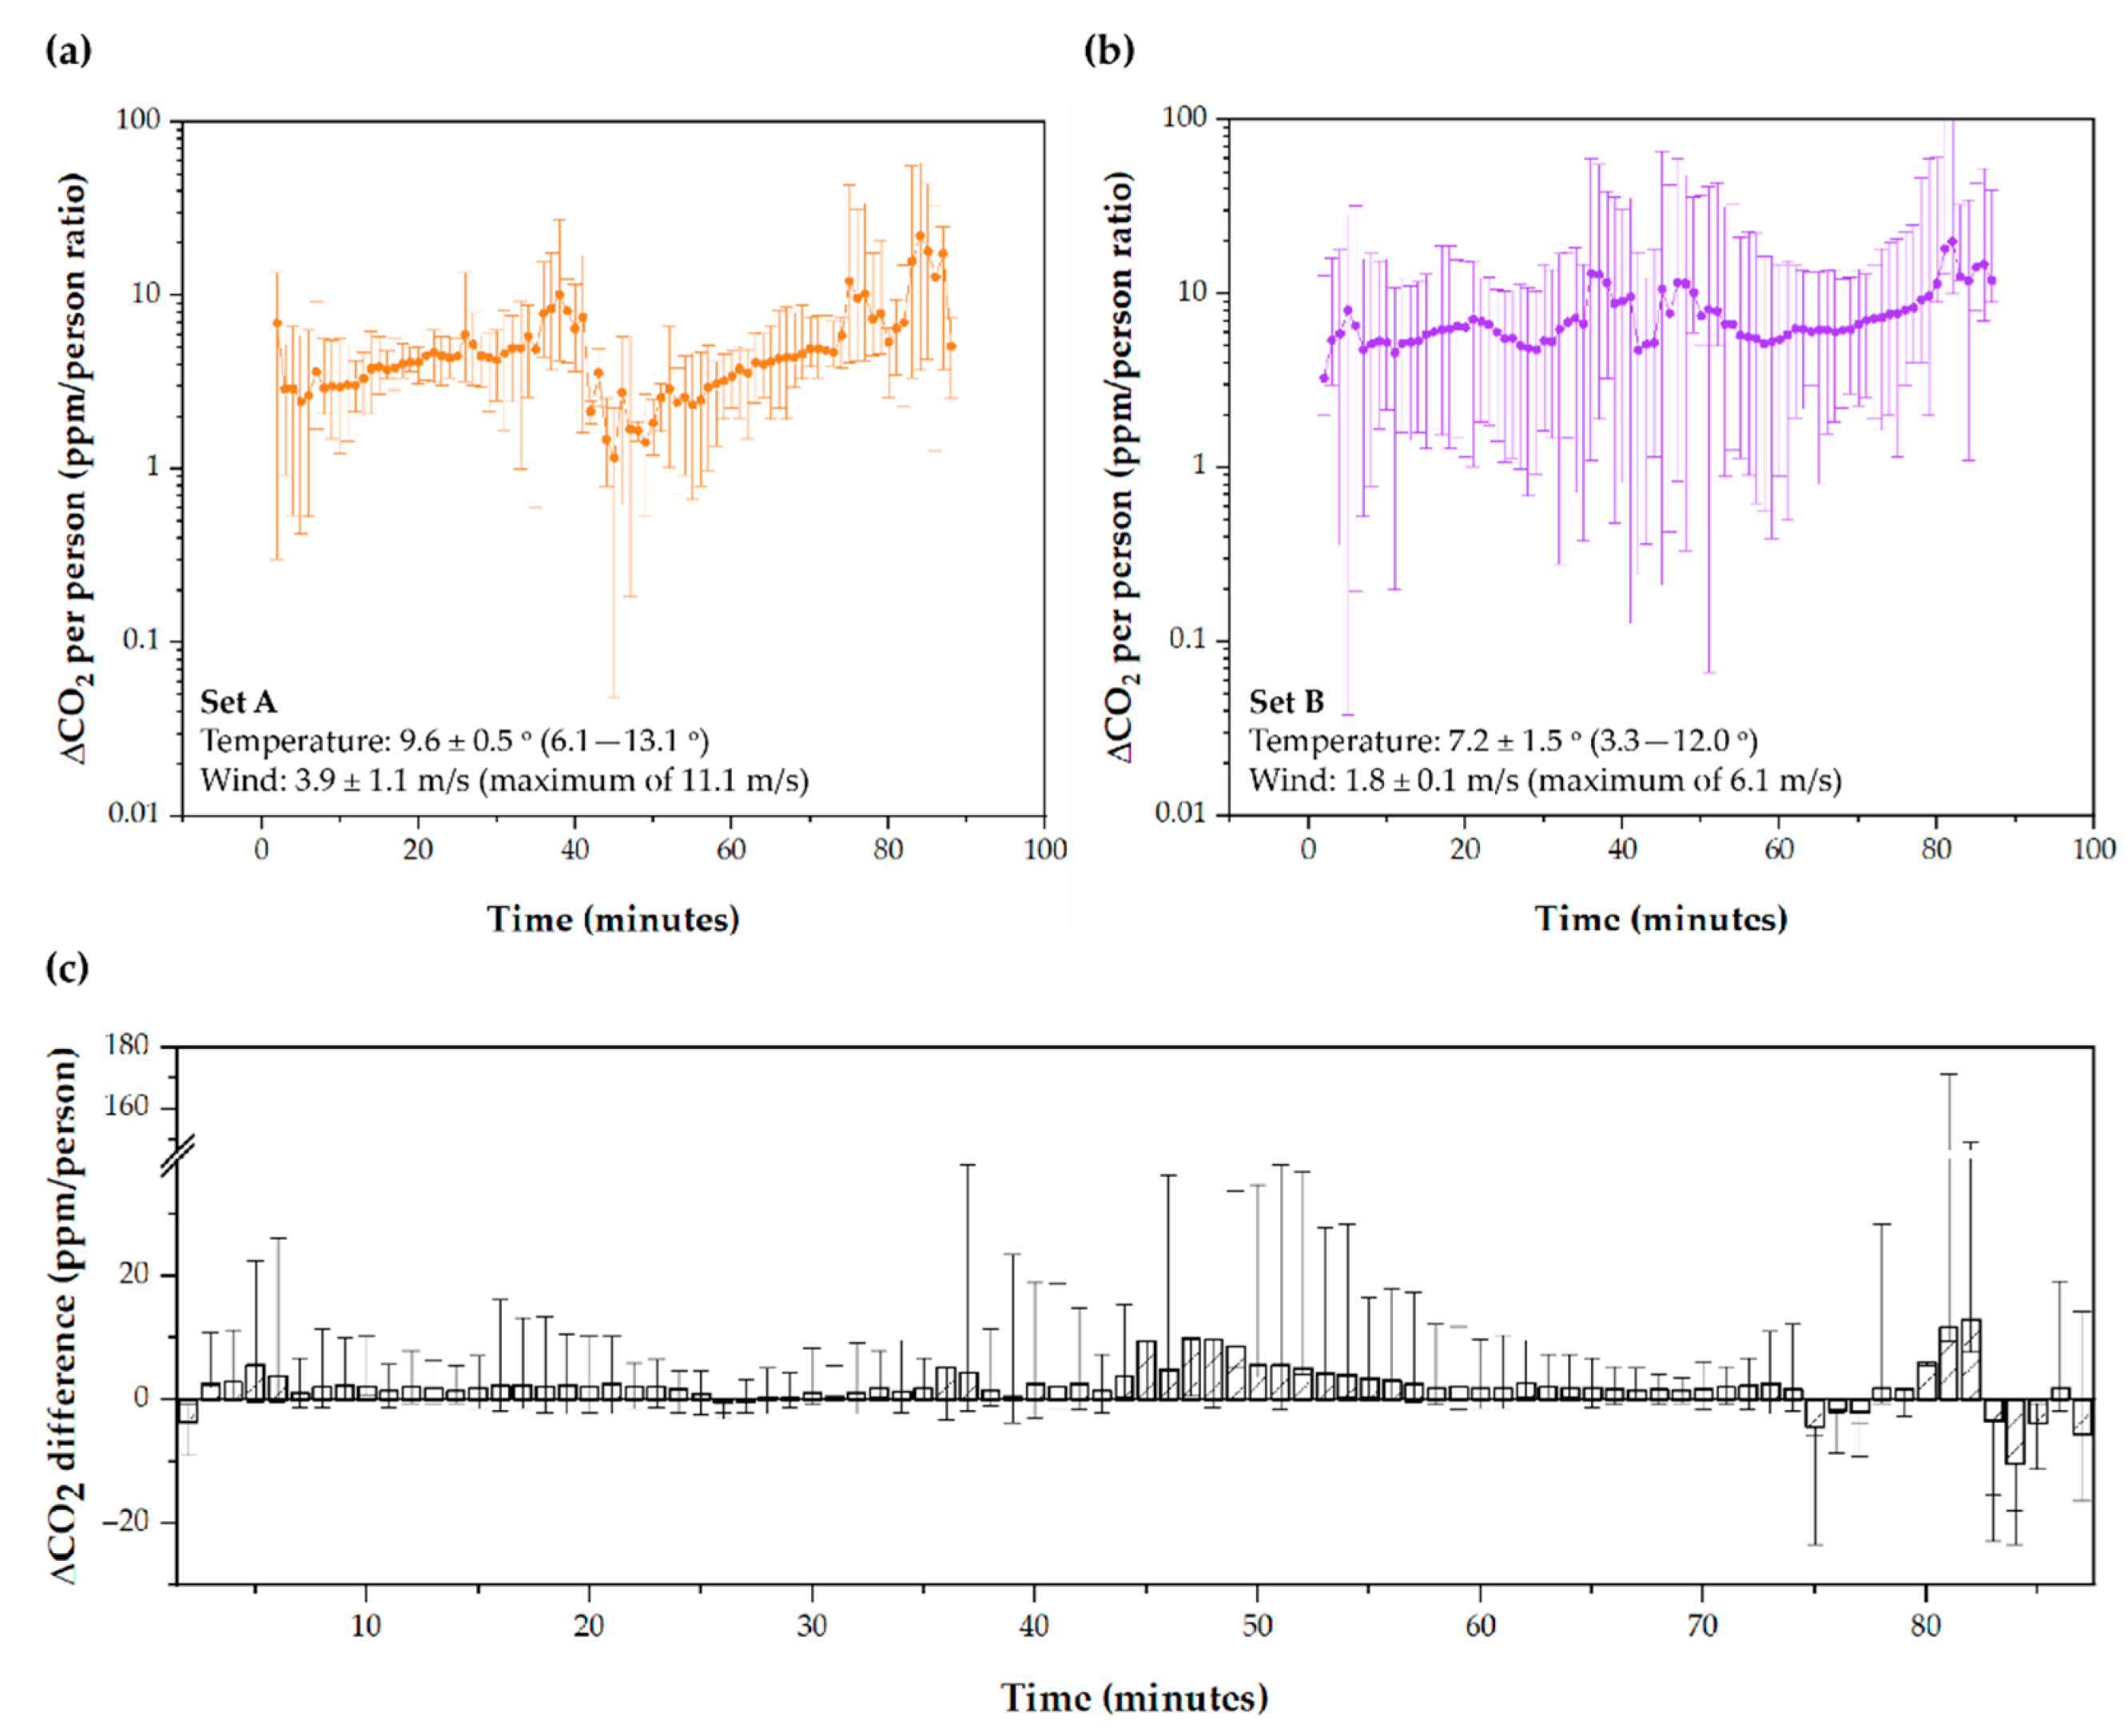
3.4. Wind Speed Contributes to Increasing Ventilation Rates
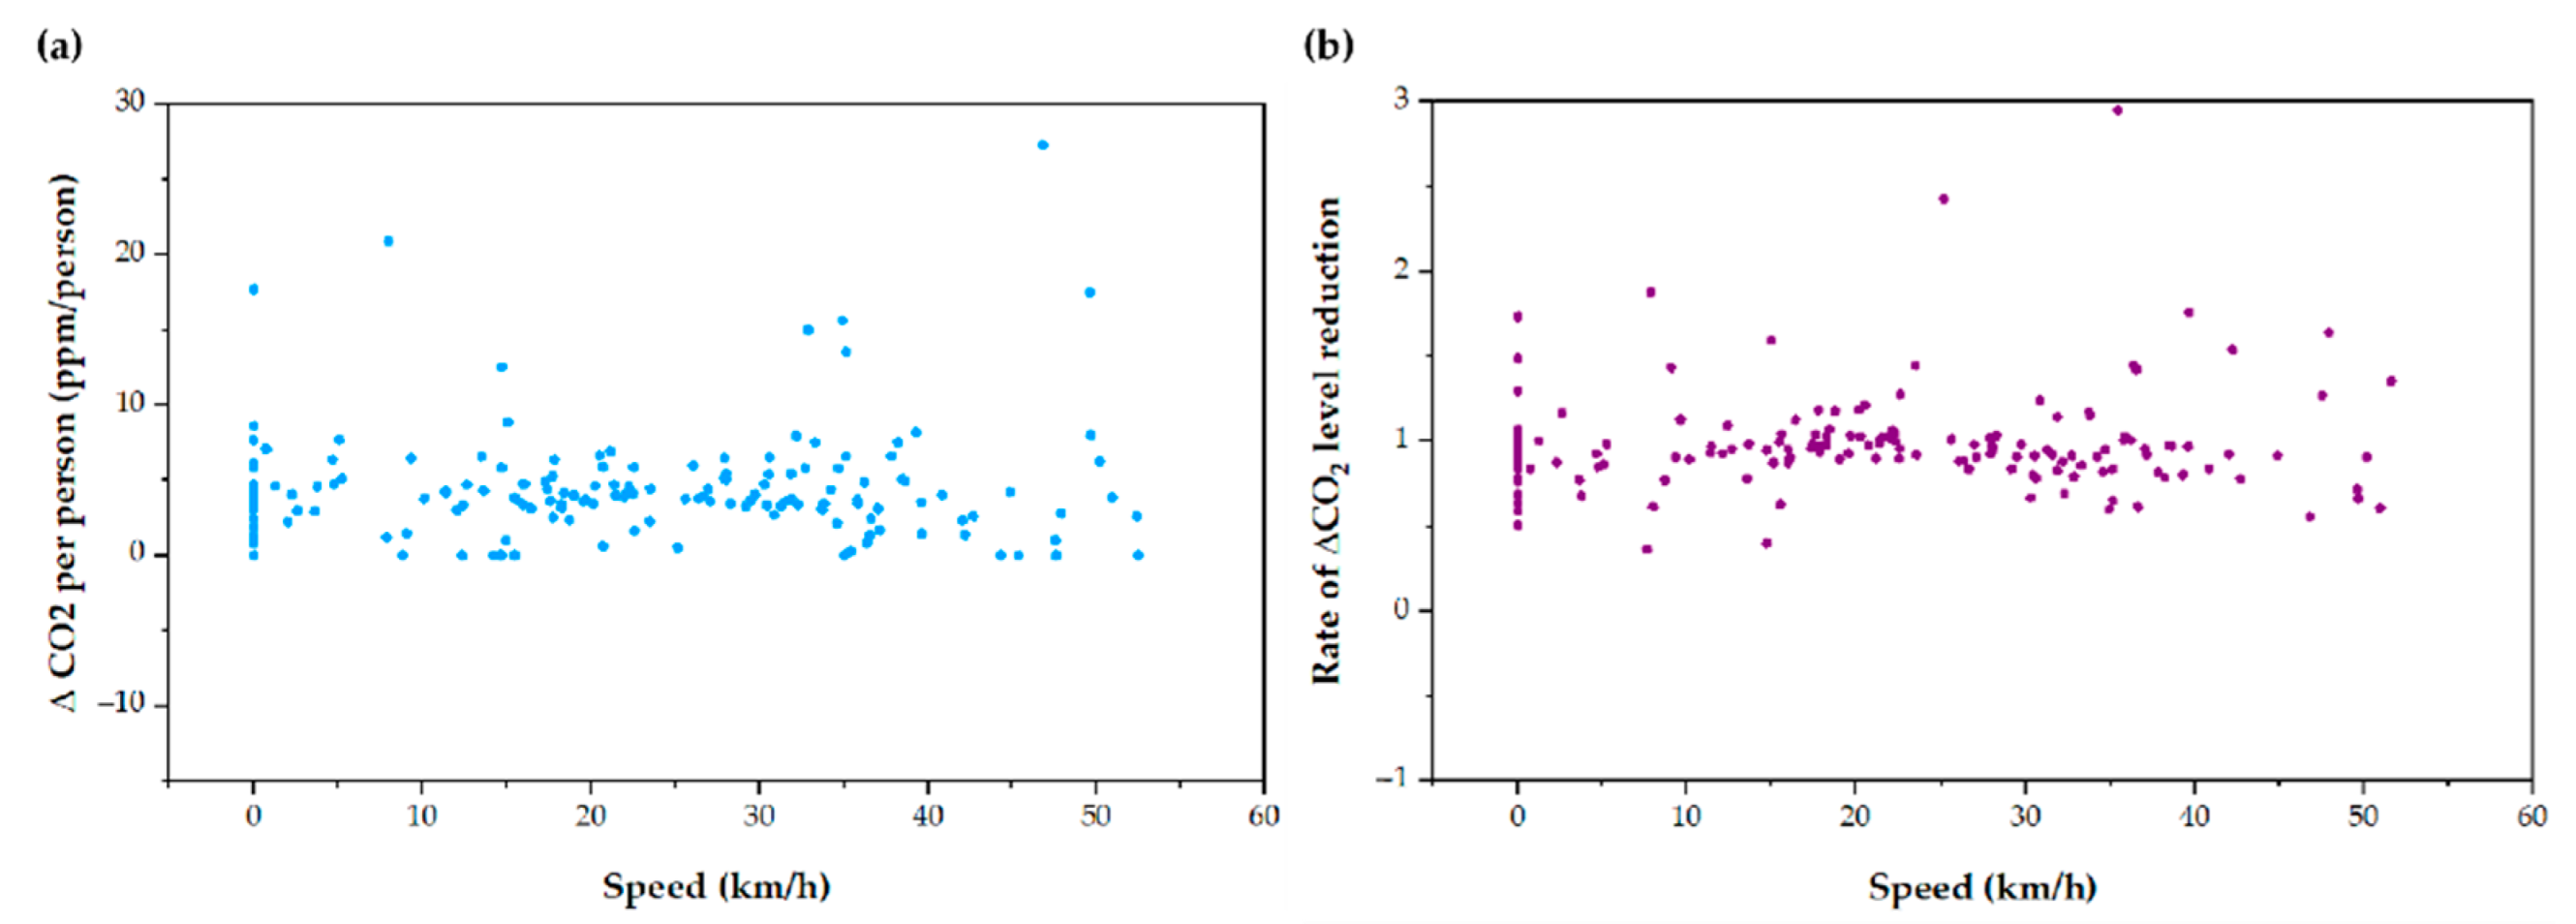
3.5. Tram Speed Does Not Influence the Indoor Ventilation Rate
3.6. The Filtration System Is Not Efficient against Submicron Matter
3.7. Probability of Infection
4. Discussion
5. Conclusions and Recommendations
- Maximize outside air intake: by opening windows, increasing door openings in stations, and minimizing the rate of return air in HVAC units;
- Completely recirculate the air between outbound and return routes to avoid exposing new passengers to the air breathed by previous passengers;
- Consider implementing efficient filtration systems against particles (0.1–100 μm) instead of coarse-type filters, efficient against pollen or dust. Additionally to filtration systems, other air purification technologies can be beneficial in improving air quality. Even so, its performance needs to be demonstrated under operating conditions and not just in the laboratory or theoretically;
- Limit the respiratory activity of passengers to calm breathing and speech and the use of masks and other personal protection equipment and promote interpersonal distance.
- Initially, characterizing the distribution of CO2 inside the vehicle is essential so that the location of the sensors allows representative measurements of the space to be taken;
- Analyzing the increase in CO2 instead of absolute CO2 allows for quantifying only the CO2 generated by passengers, discriminating external pollution. Additionally, we propose to use the ppm/person ratio as the main indicator to compare the exhaled CO2 measurements on different scenarios. This ratio can be easily calculated by dividing the increase by the number of people. For example, if the increase in CO2 is 500 and there are 50 people, the ratio will be 10 ppm/person. In case of studying two separate days, for example with different weather, we can find that one day the ratio is 10 ppm/person and another day it is 30 ppm/person. With this information, we can determine how the change of variables affects independently of the occupation.
- Place the gauges at a sufficient height to avoid the direct exhalation of the passengers. For example, they were placed 2.25 m above ground level for this work. Moreover, locating meters near doors and windows should avoid underestimating CO2 levels.
- Evaluate weather conditions, especially airspeed, to interpret the measurement results on measurement days correctly. For example, in our study, the weather substantially affected the ventilation ratio inside the Tram. On the days with the greatest wind, ppm/person rates of up to 44% lower were recorded with respect to the days with the least wind.
- Recording occupancy levels (number of passengers) is essential to estimate the ventilation rate and to be able to compare data in different samples.
- Deduct the minimum number of meters to obtain representative measurements of the space. The heterogeneity in vehicle occupancy requires a consistent distribution of meters. For example, a meter was placed for every 35 m3 of air in this work.
- Considering the respiratory activity of the vehicle occupants is desirable when normalizing the ppm/person rates. In addition, the CO2 records must be individually interpreted depending on variables such as interpersonal distance, the use of masks or other PPE, and the implemented filtration systems (or other air purification devices).
Supplementary Materials
Author Contributions
Funding
Acknowledgments
Conflicts of Interest
References
- Siegel, J.D.; Rhinehart, E.; Jackson, M.; Chiarello, L. Healthcare Infection Control Practices Advisory Committee 2007 Guideline for Isolation Precautions: Preventing Transmission of Infectious Agents in Healthcare Settings (Updated July 2019). Cent. Diasease Control. Prev. 2019, 35, S65–S164. [Google Scholar] [CrossRef]
- Wang, C.C.; Prather, K.A.; Sznitman, J.; Jimenez, J.L.; Lakdawala, S.S.; Tufekci, Z.; Marr, L.C. Airborne Transmission of Respiratory Viruses. Science 2021, 373, eabd9149. [Google Scholar] [CrossRef] [PubMed]
- Beldomenico, P.M. Do Superspreaders Generate New Superspreaders? A Hypothesis to Explain the Propagation Pattern of COVID-19. Int. J. Infect. Dis. 2020, 96, 19–22. [Google Scholar] [CrossRef]
- Lewis, B.D. Why the WHO Took Two Years to Say COVID Is Airborne. Nature 2022, 604, 26–31. [Google Scholar] [CrossRef]
- Greenhalgh, T.; Jimenez, J.L.; Prather, K.A.; Tufekci, Z.; Fisman, D.; Schooley, R. Ten Scientific Reasons in Support of Airborne Transmission of SARS-CoV-2. Lancet 2021, 397, 1603–1605. [Google Scholar] [CrossRef]
- Kim, J.-M.; Chung, Y.-S.; Jo, H.J.; Lee, N.-J.; Kim, M.S.; Woo, S.H.; Park, S.; Kim, J.W.; Kim, H.M.; Han, M.-G. Article History: Identification of Coronavirus Isolated from a Patient in Korea with COVID-19 Osong Public Health and Research Perspectives. Public Health Res. Perspect. 2020, 11, 3–7. [Google Scholar] [CrossRef] [PubMed] [Green Version]
- Park, W.B.; Kwon, N.J.; Choi, S.J.; Kang, C.K.; Choe, P.G.; Kim, J.Y.; Yun, J.; Lee, G.W.; Seong, M.W.; Kim, N.J.; et al. Virus Isolation from the First Patient with SARS-CoV-2 in Korea. J. Korean Med. Sci. 2020, 35, 10–14. [Google Scholar] [CrossRef]
- Wölfel, R.; Corman, V.M.; Guggemos, W.; Seilmaier, M.; Zange, S.; Müller, M.A.; Niemeyer, D.; Jones, T.C.; Vollmar, P.; Rothe, C.; et al. Virological Assessment of Hospitalized Patients with COVID-2019. Nature 2020, 581, 465–469. [Google Scholar] [CrossRef] [Green Version]
- Lee, B.U. Minimum Sizes of Respiratory Particles Carrying SARS-CoV-2 and the Possibility of Aerosol Generation. Int. J. Environ. Res. Public Health 2020, 17, 6960. [Google Scholar] [CrossRef]
- Liu, Y.; Ning, Z.; Chen, Y.; Guo, M.; Liu, Y.; Gali, N.K.; Sun, L.; Duan, Y.; Cai, J.; Westerdahl, D.; et al. Aerodynamic Analysis of SARS-CoV-2 in Two Wuhan Hospitals. Nature 2020, 582, 557–560. [Google Scholar] [CrossRef]
- Chia, P.Y.; Coleman, K.K.; Tan, Y.K.; Ong, S.W.X.; Gum, M.; Lau, S.K.; Lim, X.F.; Lim, A.S.; Sutjipto, S.; Lee, P.H.; et al. Detection of Air and Surface Contamination by SARS-CoV-2 in Hospital Rooms of Infected Patients. Nat. Commun. 2020, 11, 2800. [Google Scholar] [CrossRef] [PubMed]
- Kenarkoohi, A.; Noorimotlagh, Z.; Falahi, S.; Amarloei, A.; Abbas, S. Hospital Indoor Air Quality Monitoring for the Detection of SARS-CoV-2 (COVID-19) Virus. Sci. Total Environ. 2020, 748, 141324. [Google Scholar] [CrossRef] [PubMed]
- Stern, R.A.; Koutrakis, P.; Martins, M.A.G.; Lemos, B.; Dowd, S.E.; Sunderland, E.M.; Garshick, E. Characterization of Hospital Airborne SARS-CoV-2. Respir. Res. 2021, 22, 73. [Google Scholar] [CrossRef] [PubMed]
- Kutter, J.S.; de Meulder, D.; Bestebroer, T.M.; Lexmond, P.; Mulders, A.; Richard, M.; Fouchier, R.A.M.; Herfst, S. SARS-CoV and SARS-CoV-2 Are Transmitted through the Air between Ferrets over More than One Meter Distance. Nat. Commun. 2021, 12, 1653. [Google Scholar] [CrossRef]
- Shi, J.; Wen, Z.; Zhong, G.; Yang, H.; Wang, C.; Huang, B.; Liu, R.; He, X.; Shuai, L.; Sun, Z.; et al. Susceptibility of Ferrets, Cats, Dogs and Other Domesticated Animals to SARS-Coronavirus 2. Science 2020, 368, 1016–1020. [Google Scholar] [CrossRef] [PubMed] [Green Version]
- Lewis, B.D. The Superspreading Problem. Nature 2021, 950, 544–548. [Google Scholar] [CrossRef] [PubMed]
- Eichler, N.; Thornley, C.; Swadi, T.; Devine, T.; McElnay, C.; Sherwood, J.; Brunton, C.; Williamson, F.; Freeman, J.; Berger, S.; et al. Transmission of Severe Acute Respiratory Syndrome Coronavirus 2 during Border Quarantine and Air Travel, New Zealand (Aotearoa). Emerg. Infect. Dis. 2021, 27, 1274–1278. [Google Scholar] [CrossRef]
- Johansson, M.A.; Quandelacy, T.M.; Kada, S.; Prasad, P.V.; Steele, M.; Brooks, J.T.; Slayton, R.B.; Biggerstaff, M.; Butler, J.C. SARS-CoV-2 Transmission from People without COVID-19 Symptoms. JAMA Netw. Open 2021, 4, e2035057. [Google Scholar] [CrossRef]
- Bulfone, T.C.; Malekinejad, M.; Rutherford, G.W.; Razani, N. Outdoor Transmission of SARS-CoV-2 and Other Respiratory Viruses: A Systematic Review. J. Infect. Dis. 2021, 223, 550–561. [Google Scholar] [CrossRef]
- Shen, Y.; Li, C.; Dong, H.; Wang, Z.; Martinez, L.; Sun, Z.; Handel, A.; Chen, Z.; Chen, E.; Ebell, M.H.; et al. Community Outbreak Investigation of SARS-CoV-2 Transmission among Bus Riders in Eastern China. JAMA Intern. Med. 2020, 180, 1665–1671. [Google Scholar] [CrossRef]
- He, X.; Lau, E.H.Y.; Wu, P.; Deng, X.; Wang, J.; Hao, X.; Lau, Y.C.; Wong, J.Y.; Guan, Y.; Tan, X.; et al. Temporal Dynamics in Viral Shedding and Transmissibility of COVID-19. Nat. Med. 2020, 26, 672–675. [Google Scholar] [CrossRef] [PubMed] [Green Version]
- Peng, Z.; Jimenez, J.L. Exhaled CO2 as a COVID-19 Infection Risk Proxy for Different Indoor Environments and Activities. Environ. Sci. Technol. Lett. 2021, 8, 392–397. [Google Scholar] [CrossRef]
- De Chaumont, F. On the Theory of Ventilation: An Attempt to Establish a Positive Basis for the Calculation of the Amount of Fresh Air Required for an Inhabited Air-Space. Proc. R. Soc. Lond. 1875, 23, 187–201. [Google Scholar]
- Schibuola, L.; Scarpa, M.; Tambani, C. Natural Ventilation Level Assessment in a School Building by CO2 Concentration Measures. Energy Procedia 2016, 101, 257–264. [Google Scholar] [CrossRef]
- Milton, D.K. Risk of Sick Leave Associated with Outdoor Air Supply Rate, Humidification and Occupant Complaints. Indoor Air 2000, 10, 212–221. [Google Scholar] [CrossRef]
- Zemitis, J.; Bogdanovics, R.; Bogdanovica, S. The Study of CO2 Concentration in A Classroom during the Covid-19 Safety Measures. E3S Web Conf. 2021, 246, 01004. [Google Scholar] [CrossRef]
- Trilles, S.; Juan, P.; Chaudhuri, S.; Fortea, A.B.V. Data on CO2, Temperature and Air Humidity Records in Spanish Classrooms during the Reopening of Schools in the COVID-19 Pandemic. Data Br. 2021, 39, 107489. [Google Scholar] [CrossRef]
- Kappelt, N.; Russell, H.S.; Kwiatkowski, S.; Afshari, A.; Johnson, M.S. Correlation of Respiratory Aerosols and Metabolic Carbon Dioxide. Sustainability 2021, 13, 12203. [Google Scholar] [CrossRef]
- Baselga, M.; Güemes, A.; Alba, J.J.; Schuhmacher, A.J. SARS-CoV-2 Droplet and Airborne Transmission Heterogeneity. J. Clin. Med. 2022, 11, 2607. [Google Scholar] [CrossRef]
- Schade, W.; Reimer, V.; Seipenbusch, M.; Willer, U. Experimental Investigation of Aerosol and CO2 Dispersion for Evaluation of Covid-19 Infection Risk in a Concert Hall. Int. J. Environ. Res. Public Health 2021, 18, 3037. [Google Scholar] [CrossRef]
- Aireamos Covid Risk Airborne. Available online: https://www.aireamos.org/herramienta/ (accessed on 26 May 2022).
- Liu, L.J.S.; Krahmer, M.; Fox, A.; Feigley, C.E.; Featherstone, A.; Saraf, A.; Larsson, L. Investigation of the Concentration of Bacteria and Their Cell Envelope Components in Indoor Air in Two Elementary Schools. J. Air Waste Manag. Assoc. 2000, 50, 1957–1967. [Google Scholar] [CrossRef] [PubMed] [Green Version]
- Johnson, G.R.; Morawska, L.; Ristovski, Z.D.; Hargreaves, M.; Mengersen, K.; Chao, C.Y.H.; Wan, M.P.; Li, Y.; Xie, X.; Katoshevski, D.; et al. Modality of Human Expired Aerosol Size Distributions. J. Aerosol Sci. 2011, 42, 839–851. [Google Scholar] [CrossRef]
- Shim, E.; Tariq, A.; Choi, W.; Lee, Y.; Chowell, G. Transmission Potential and Severity of COVID-19 in South Korea. Int. J. Infect. Dis. 2020, 93, 339–344. [Google Scholar] [CrossRef] [PubMed]
- Zauzmer, J. Washington-Post ‘Take It Very Seriously’: Pastor at Arkansas Church Where 34 People Came down with Coronavirus Sends a Warning. Available online: https://www.washingtonpost.com/religion/2020/03/24/pastor-arkansas-church-coronavirus-warning-greers-ferry (accessed on 26 May 2022).
- Mackie, R. The Guardian. Did Singing Together Spread Coronavirus to Four Choirs? Available online: https://www.theguardian.com/world/2020/may/17/did-singing-together-spread-coronavirus-to-four-choirs (accessed on 26 May 2022).
- Dashboard of the COVID-19 Virus Outbreak in Singapore. Available online: https://covid19.who.int/region/wpro/country/sg (accessed on 26 May 2022).
- Adam, D.C.; Wu, P.; Wong, J.Y.; Lau, E.H.Y.; Tsang, T.K.; Cauchemez, S.; Leung, G.M.; Cowling, B.J. Clustering and Superspreading Potential of SARS-CoV-2 Infections in Hong Kong. Nat. Med. 2020, 26, 1714–1719. [Google Scholar] [CrossRef] [PubMed]
- DW. Coronavirus: German Slaughterhouse Outbreak Crosses. Available online: https://www.dw.com/en/coronavirus-german-slaughterhouse-outbreak-crosses-1000/a-53883372 (accessed on 26 May 2022).
- Cannon, A. Spike in COVID-19 Cases in Iowa Packing Plants a Big Part of 389 New Cases, State’s Largest Single-Day Increase. Available online: https://eu.desmoinesregister.com/story/news/2020/04/19/coronavirus-iowa-largest-single-day-increase-iowa-covid-19-cases-tied-meatpacking-plants/5162127002/ (accessed on 26 May 2022).
- GOV.UK. All Schools to Receive Carbon Dioxide Monitors. Available online: https://www.gov.uk/government/news/all-schools-to-receive-carbon-dioxide-monitors (accessed on 26 May 2022).
- The White House. Biden Administration Launches Effort to Improve Ventilation and Reduce the Spread of COVID-19 in Buildings. Available online: https://www.whitehouse.gov/briefing-room/statements-releases/2022/03/17/fact-sheet-biden-administration-launches-effort-to-improve-ventilation-and-reduce-the-spread-of-covid-19-in-buildings/#:~:text=Today%20the%20Administration%20is%20launching,their%20buildings%20and%20reduce%20the (accessed on 26 May 2022).
- Ryukyu, A.; Haebaru, H.; Ono, K. Providing Visualized Information on “Safety and Security” Installation of CO2 Concentration Monitors for Customers at Aeon Stores. 2021, pp. 1–3. Available online: https://www.aeondelight.co.jp/english/news/20210901_installation-of-co2-concentration-monitors-for-customers-at-aeon-stores.pdf (accessed on 26 May 2022).
- Salthammer, T.; Fauck, C.; Omelan, A.; Wientzek, S.; Uhde, E. Time and Spatially Resolved Tracking of the Air Quality in Local Public Transport. Sci. Rep. 2022, 12, 3262. [Google Scholar] [CrossRef]
- Querol, X.; Alastuey, A.; Moreno, N.; Minguillón, M.C.; Moreno, T.; Karanasiou, A.; Jimenez, J.L.; Li, Y.; Morguí, J.A.; Felisi, J.M. How Can Ventilation Be Improved on Public Transportation Buses? Insights from CO2 Measurements. Environ. Res. 2022, 205, 112451. [Google Scholar] [CrossRef]
- Woodward, H.; Fan, S.; Bhagat, R.K.; Dadonau, M.; Wykes, M.D.; Martin, E.; Hama, S.; Tiwari, A.; Dalziel, S.B.; Jones, R.L.; et al. Air Flow Experiments on a Train Carriage—Towards Understanding the Risk of Airborne Transmission. Atmosphere 2021, 12, 1267. [Google Scholar] [CrossRef]
- Bazant, M.Z.; Kodio, O.; Cohen, A.E.; Khan, K.; Gu, Z.; Bush, J.W.M. Monitoring Carbon Dioxide to Quantify the Risk of Indoor Airborne Transmission of COVID-19. Flow 2021, 1, 1–18. [Google Scholar] [CrossRef]
- Chillon, S.A.; Millan, M.; Aramendia, I.; Fernandez-Gamiz, U.; Zulueta, E.; Mendaza-Sagastizabal, X. Natural Ventilation Characterization in a Classroom under Different Scenarios. Int. J. Environ. Res. Public Health 2021, 18, 5425. [Google Scholar] [CrossRef]
- Zhang, D.; Ding, E.; Bluyssen, P.M. Guidance to Assess Ventilation Performance of a Classroom Based on CO2 Monitoring. Indoor Built Environ. 2022, 31, 1107–1126. [Google Scholar] [CrossRef]
- McNeill, V.F.; Corsi, R.; Huffman, J.A.; King, C.; Klein, R.; Lamore, M.; Maeng, D.Y.; Miller, S.L.; Lee Ng, N.; Olsiewski, P.; et al. Room-Level Ventilation in Schools and Universities. Atmos. Environ. X 2022, 13, 100152. [Google Scholar] [CrossRef] [PubMed]
- Avella, F.; Gupta, A.; Peretti, C.; Fulici, G.; Verdi, L.; Belleri, A.; Babich, F. Low-Invasive CO2-Based Visual Alerting Systems to Manage Natural Ventilation and Improve IAQ in Historic School Buildings. Heritage 2021, 4, 3442–3468. [Google Scholar] [CrossRef]
- Zivelonghi, A.; Lai, M. Mitigating Aerosol Infection Risk in School Buildings: The Role of Natural Ventilation, Volume, Occupancy and CO2 Monitoring. Build. Environ. 2021, 204, 108139. [Google Scholar] [CrossRef]
- Jones, G.; Parodi, E.; Heinrich, M. Italian Study Shows Ventilation Can Cut School COVID Cases by 82%. Reuters. Available online: https://www.reuters.com/world/europe/italian-study-shows-ventilation-can-cut-school-covid-cases-by-82-2022-03-22/ (accessed on 26 May 2022).
- Ingenieros Industriales de Aragón y la Rioja. Guía de Referencia Covid; Ingenieros Industriales de Aragón y la Rioja: Zaragoza, Spain, 2021; Available online: http://www.zaragoza.es/contenidos/coronavirus/guia-referencia-covid.pdf (accessed on 26 May 2022).
- Cheng, S.Y.; Wang, C.J.; Shen, A.C.T.; Chang, S.C. How to Safely Reopen Colleges and Universities during COVID-19: Experiences from Taiwan. Ann. Intern. Med. 2020, 173, 638–641. [Google Scholar] [CrossRef]
- Verma, A.; Raturi, V.; Kanimozhee, S. Urban Transit Technology Selection for Many-to-Many Travel Demand Using Social Welfare Optimization Approach. J. Urban Plan. Dev. 2018, 144, 04017021. [Google Scholar] [CrossRef]
- Lan, I.; Wei, C.; Id, Y.H.; Christiani, D.C. Work-Related COVID-19 Transmission in Six Asian Countries Areas: A Follow-up Study. PLoS ONE 2020, 15, e0233588. [Google Scholar] [CrossRef]
- Chan, M.Y. Commuters’ Exposure to Carbon Monoxide and Carbon Dioxide in Air-Conditioned Buses in Hong Kong. Indoor Built Environ. 2005, 14, 397–403. [Google Scholar] [CrossRef]
- Huang, H.L.; Hsu, D.J. Exposure Levels of Particulate Matter in Long-Distance Buses in Taiwan. Indoor Air 2009, 19, 234–242. [Google Scholar] [CrossRef]
- Hsu, D.J.; Huang, H.L. Concentrations of Volatile Organic Compounds, Carbon Monoxide, Carbon Dioxide and Particulate Matter in Buses on Highways in Taiwan. Atmos. Environ. 2009, 43, 5723–5730. [Google Scholar] [CrossRef]
- Chiu, C.F.; Chen, M.H.; Chang, F.H. Carbon Dioxide Concentrations and Temperatures within Tour Buses under Real-Time Traffic Conditions. PLoS ONE 2015, 10, e0125117. [Google Scholar] [CrossRef] [PubMed] [Green Version]
- Barmparesos, N.; Assimakopoulos, V.D.; Assimakopoulos, M.N.; Tsairidi, E. Particulate Matter Levels and Comfort Conditions in the Trains and Platforms of the Athens Underground Metro. AIMS Environ. Sci. 2016, 3, 199–219. [Google Scholar] [CrossRef]
- Bascompta Massanés, M.; Sanmiquel Pera, L.; Oliva Moncunill, J. Ventilation Management System for Underground Environments. Tunn. Undergr. Space Technol. 2015, 50, 516–522. [Google Scholar] [CrossRef]
- Riley, C.E.; Murphy, G.; Riley, R.L. Copyright O 1978 by The Johns Hopkins University School of Hygiene and Public Health. Am. J. Epidemiol. 1978, 107, 421–432. [Google Scholar] [CrossRef]
- Rudnick, S.; Milton, D. Risk of Indoor Airborne Infection Transmission Estimated from Carbon Dioxide Concentration. Indoor Air 2003, 13, 237–245. [Google Scholar] [CrossRef]
- Anonymous. RWiki in Proyecto R UCA. Available online: http://knuth.uca.es/R/doku.php?id=r_wiki (accessed on 26 May 2022).
- Yeh, H.; Liu, B. Aerosol Filtraton by Fibrous Filters. I: Theoretical. J. Aerosol Sci. 1974, 5, 191–204. [Google Scholar] [CrossRef]
- Yeh, H.; Liu, B. Aerosol Filtraton by Fibrous Filters. II: Experimental. J. Aerosol Sci. 1974, 5, 205–217. [Google Scholar] [CrossRef]
- Ma, J.; Qi, X.; Chen, H.; Li, X.; Zhang, Z.; Wang, H.; Sun, L.; Zhang, L.; Guo, J.; Morawska, L.; et al. Exhaled Breath Is a Significant Source of SARS-CoV-2 Emission. medRxiv 2020, 1–8. [Google Scholar] [CrossRef]
- Malik, M.; Kunze, A.; Bahmer, T.; Herget-rosenthal, S.; Kunze, T. SARS-CoV-2: Viral Loads of Exhaled Breath and Oronasopharyngeal Specimens in Hospitalized Patients with COVID-19. Int. J. Infect. Dis. 2021, 110, 105–110. [Google Scholar] [CrossRef]
- Viklund, E.; Kokelj, S.; Larsson, P.; Nordén, R.; Andersson, M.; Beck, O.; Westin, J.; Olin, A.C. Severe Acute Respiratory Syndrome Coronavirus 2 Can Be Detected in Exhaled Aerosol Sampled during a Few Minutes of Breathing or Coughing. Influenza Other Respi. Viruses 2022, 16, 402–410. [Google Scholar] [CrossRef]
- Chen, G.M.; Ji, J.J.; Jiang, S.; Xiao, Y.Q.; Zhang, R.L.; Huang, D.N.; Liu, H.; Yu, S.Y. Detecting Environmental Contamination of Acute Respiratory Syndrome Coronavirus 2 (SARS-CoV-2) in Isolation Wards and Fever Clinics. Biomed. Environ. Sci. 2020, 33, 943–947. [Google Scholar] [CrossRef] [PubMed]
- Santarpia, J.L.; Rivera, D.N.; Herrera, V.L.; Morwitzer, M.J.; Creager, H.M.; Santarpia, G.W.; Crown, K.K.; Brett-Major, D.M.; Schnaubelt, E.R.; Broadhurst, M.J.; et al. Aerosol and Surface Contamination of SARS-CoV-2 Observed in Quarantine and Isolation Care. Sci. Rep. 2020, 10, 12732. [Google Scholar] [CrossRef] [PubMed]
- Zhou, A.J.; Otter, J.A.; Price, J.R.; Cimpeanu, C.; Garcia, M.; Kinross, J.; Boshier, P.R.; Mason, S.; Bolt, F.; Alison, H.; et al. Investigating SARS-CoV-2 Surface and Air Contamination in an Acute Healthcare 2 Setting during the Peak of the COVID-19 Pandemic in London. medRxiv Prepr. 2020, 73, e1870–e1877. [Google Scholar]
- Moore, G.; Rickard, H.; Stevenson, D.; Aranega-Bou, P.; Pitman, J.; Crook, A.; Davies, K.; Spencer, A.; Burton, C.; Easterbrook, L.; et al. Detection of SARS-CoV-2 within the Healthcare Environment: A Multi-Centre Study Conducted during the First Wave of the COVID-19 Outbreak in England. J. Hosp. Infect. 2021, 108, 189–196. [Google Scholar] [CrossRef] [PubMed]
- Dumont-Leblond, N.; Veillette, M.; Mubareka, S.; Yip, L.; Longtin, Y.; Jouvet, P.; Paquet Bolduc, B.; Godbout, S.; Kobinger, G.; McGeer, A.; et al. Low Incidence of Airborne SARS-CoV-2 in Acute Care Hospital Rooms with Optimized Ventilation. Emerg. Microbes Infect. 2020, 9, 2597–2605. [Google Scholar] [CrossRef] [PubMed]
- Song, Z.G.; Chen, Y.M.; Wu, F.; Xu, L.; Wang, B.F.; Shi, L.; Chen, X.; Dai, F.H.; She, J.L.; Chen, J.M.; et al. Identifying the Risk of SARS-CoV-2 Infection and Environmental Monitoring in Airborne Infectious Isolation Rooms (AIIRs). Virol. Sin. 2020, 35, 785–792. [Google Scholar] [CrossRef]
- Moreno, T.; Pintó, R.M.; Bosch, A.; Moreno, N.; Alastuey, A.; Minguillón, M.C.; Anfruns-Estrada, E.; Guix, S.; Fuentes, C.; Buonanno, G.; et al. Tracing Surface and Airborne SARS-CoV-2 RNA inside Public Buses and Subway Trains. Environ. Int. 2021, 147, 106326. [Google Scholar] [CrossRef]
- Lelieveld, J.; Helleis, F.; Borrmann, S.; Cheng, Y.; Drewnick, F.; Haug, G.; Klimach, T.; Sciare, J.; Su, H.; Pöschl, U. Model Calculations of Aerosol Transmission and Infection Risk of COVID-19 in Indoor Environments. Int. J. Environ. Res. Public Health 2020, 17, 8114. [Google Scholar] [CrossRef]
- Park, J.; Kim, G. Risk of Covid-19 Infection in Public Transportation: The Development of a Model. Int. J. Environ. Res. Public Health 2021, 18, 12790. [Google Scholar] [CrossRef]
- Yang, X.; Ou, C.; Yang, H.; Liu, L.; Song, T.; Kang, M.; Lin, H.; Hang, J. Transmission of Pathogen-Laden Expiratory Droplets in a Coach Bus. J. Hazard. Mater. 2020, 397, 122609. [Google Scholar] [CrossRef]
- Zhang, Z.; Han, T.; Yoo, K.H.; Capecelatro, J.; Boehman, A.L.; Maki, K. Disease Transmission through Expiratory Aerosols on an Urban Bus. Phys. Fluids 2021, 33, 015116. [Google Scholar] [CrossRef] [PubMed]
- Li, F.; Lee, E.S.; Zhou, B.; Liu, J.; Zhu, Y. Effects of the Window Openings on the Micro-Environmental Condition in a School Bus. Atmos. Environ. 2017, 167, 434–443. [Google Scholar] [CrossRef]
- Edwards, N.J.; Widrick, R.; Wilmes, J.; Breisch, B.; Gerschefske, M.; Sullivan, J.; Potember, R.; Espinoza-Calvio, A. Reducing COVID-19 Airborne Transmission Risks on Public Transportation Buses: An Empirical Study on Aerosol Dispersion and Control. Aerosol Sci. Technol. 2021, 55, 1378–1397. [Google Scholar] [CrossRef]
- Hartmann, A.; Kriegel, M. Risk Assessment of Aerosols Loaded with Virus Based on CO2 Concentration. Hermann Rietschel Inst. (Fachgebiet Gebäude-Energie-Systeme), 2020. Available online: https://d-nb.info/1214708838/34 (accessed on 26 May 2022).
- Kriegel, M.; Hartmann, A.; Buchholz, U.; Seifried, J.; Baumgarte, S.; Gastmeier, P. Sars-Cov-2 Aerosol Transmission Indoors: A Closer Look at Viral Load, Infectivity, the Effectiveness of Preventive Measures and a Simple Approach for Practical Recommendations. Int. J. Environ. Res. Public Health 2022, 19, 220. [Google Scholar] [CrossRef] [PubMed]
- Pang, Z.; Hu, P.; Lu, X.; Wang, Q.; Neill, Z.O. A Smart CO2-Based Ventilation Control Framework to Minimize the Infection Risk of COVID-19 in Public Buildings. 2021. Available online: https://www.researchgate.net/publication/349121056_A_Smart_CO2-Based_Ventilation_Control_Framework_to_Minimize_the_Infection_Risk_of_COVID-19_In_Public_Buildings (accessed on 26 May 2022).
- Hawks, S.A.; Prussin, A.J.; Kuchinsky, S.C.; Pan, J.; Marr, L.C.; Duggal, N.K. Infectious SARS-CoV-2 Is Emitted in Aerosol Particles. bioRxiv 2021, 12, e02527-21. [Google Scholar] [CrossRef] [PubMed]
- Ku, D.; Yeon, C.; Lee, S.; Lee, K.; Hwang, K.; Li, Y.C.; Wong, S.C. Safe Traveling in Public Transport amid COVID-19. Sci. Adv. 2021, 7, eabg3691. [Google Scholar] [CrossRef] [PubMed]
- Hussein, T.; Löndahl, J.; Thuresson, S.; Alsved, M.; Al-Hunaiti, A.; Saksela, K.; Aqel, H.; Junninen, H.; Mahura, A.; Kulmala, M. Indoor Model Simulation for Covid-19 Transport and Exposure. Int. J. Environ. Res. Public Health 2021, 18, 2972. [Google Scholar] [CrossRef]
- Bar-On, Y.M.; Flamholz, A.; Phillips, R.; Milo, R. SARS-CoV-2 (COVID-19) by the Numbers. Elife 2020, 9, e57309. [Google Scholar] [CrossRef]
- Li, Y.; Guo, Y.P.; Wong, K.C.T.; Chung, W.Y.J.; Gohel, M.D.I.; Leung, H.M.P. Transmission of Communicable Respiratory Infections and Facemasks. J. Multidiscip. Healthc. 2008, 1, 17–27. [Google Scholar] [CrossRef] [Green Version]
- Sharma, A.; Omidvarborna, H.; Kumar, P. Efficacy of Facemasks in Mitigating Respiratory Exposure to Submicron Aerosols. J. Hazard. Mater. 2022, 422, 126783. [Google Scholar] [CrossRef]
- Williams, C.M.; Pan, D.; Decker, J.; Wisniewska, A.; Fletcher, E.; Sze, S.; Assadi, S.; Haigh, R.; Abdulwhhab, M.; Bird, P.; et al. Exhaled SARS-CoV-2 Quantified by Face-Mask Sampling in Hospitalised Patients with COVID-19. J. Infect. 2021, 82, 253–259. [Google Scholar] [CrossRef] [PubMed]
- Spena, A.; Palombi, L.; Corcione, M.; Carestia, M.; Spena, V.A. On the Optimal Indoor Air Conditions for Sars-Cov-2 Inactivation. An Enthalpy-Based Approach. Int. J. Environ. Res. Public Health 2020, 17, 6083. [Google Scholar] [CrossRef] [PubMed]
- Drag, M. Model-Based Fiber Diameter Determination Approach to Fine Particulate Matter Fraction (Pm2.5) Removal in Hvac Systems. Appl. Sci. 2021, 11, 1014. [Google Scholar] [CrossRef]
- Chao, C.Y.H.; Wan, M.P.; Morawska, L.; Johnson, G.R.; Ristovski, Z.D.; Hargreaves, M.; Mengersen, K.; Corbett, S.; Li, Y.; Xie, X.; et al. Characterization of Expiration Air Jets and Droplet Size Distributions Immediately at the Mouth Opening. J. Aerosol Sci. 2009, 40, 122–133. [Google Scholar] [CrossRef] [Green Version]
- Shao, S.; Zhou, D.; He, R.; Li, J.; Zou, S.; Mallery, K.; Kumar, S.; Yang, S.; Hong, J. Risk Assessment of Airborne Transmission of COVID-19 by Asymptomatic Individuals under Different Practical Settings. J. Aerosol Sci. 2021, 151, 105661. [Google Scholar] [CrossRef]
- Fabian, P.; Brain, J.; Houseman, E.; Gern, J.; Milton, D. Origin of Exhaled Breath Particles from Healthy and Human Rhinovirus-Infected Subjects. J. Aerosol Med. Pulm. Drug Deliv. 2011, 24, 137–147. [Google Scholar] [CrossRef] [Green Version]
- Hinds, W. Aerosol Technology: Properties, Behavior, and Measurement of Airborne Particles; John Wiley & Sons, Inc.: Hoboken, NJ, USA, 1999. [Google Scholar]
- Van Doremalen, N.; Bushmaker, T.; Morris, D.; Holbrook, M.; Gamble, A.; Williamson, B.; Munster, V. Aerosol and Surface Stability of SARS-CoV-2 as Compared with SARS-CoV-1. N. Engl. J. Med. 2020, 382, 1177–1179. [Google Scholar] [CrossRef]


| Parameters measured | CO2 | <9999 ppm |
| Temperature | 0–50 °C | |
| Relative humidity | 0–85% | |
| Atmospheric pressure | 0.3–1.1 atm | |
| Sensor type | N-DIR (Non-Dispersive Infrarred) | |
| Communication technology | Bluetooth (−12–4 dBm) | |
| Sampling frequency | 1 min | |
| Precision | ±50 ppm (CO2) | |
| Dimensions/Weight | 70 × 70 × 24 mm/104 g | |
| Day | ||||||||
|---|---|---|---|---|---|---|---|---|
| A | 9.6 °C | 6.1 °C | 13.1 °C | 30° | 3.1 m/s | 8.9 m/s | 996.8 atm | 990.0 atm |
| B | 8.2 °C | 4.4 °C | 11.9 °C | 16° | 1.7 m/s | 6.1 m/s | 996.8 atm | 990.0 atm |
| C | 5.4 °C | 3.3 °C | 7.4 °C | 10° | 1.9 m/s | 5.0 m/s | 998.2 atm | 996.0 atm |
| D | 7.9 °C | 3.8 °C | 12.0 °C | 16° | 1.9 m/s | 5.6 m/s | 994.7 atm | 990.8 atm |
| E | 8.9 °C | 6.2 °C | 11.6 °C | 31° | 4.7 m/s | 11.1 m/s | 994.9 atm | 992.4 atm |
| Day | ||||||
|---|---|---|---|---|---|---|
| Set A | 9.6 ± 0.5 °C | 6.1 °C | 13.1 °C | 30 ± 0.5° | 3.9 ± 1.1 m/s | 11.1 m/s |
| Set B | 7.2 ± 1.5 °C | 3.3 °C | 12.0 °C | 14 ±3.5° | 1.8 ± 0.1 m/s | 6.1 m/s |
| Area | Flow Rate | Velocity in Filter | Pressure Drop |
|---|---|---|---|
| 2281.6 cm2 | ~161.8 m3/h | 19.4 cm/s | 6 Pa |
| 2281.6 cm2 | ~621.8 m3/h | 75.7 cm/s | 34 Pa |
| 2281.6 cm2 | ~2488.8 m3/h | 303.0 cm/s | 440 Pa |
| Scenario | Facemask | Occupation | Exposure Time | CO2 Level | Variant | Attack Rate | |
|---|---|---|---|---|---|---|---|
| #1 (global average) | Surgical mask | 60 pax | 10 min | 689 ppm (average)/1038 ppm (max) | Omicron | 0.01% * | 0.04% * |
| #2 (maximum average) | Surgical mask | 60 pax | 10 min | 810 ppm (average)/1520 ppm (max) | Omicron | 0.01% * | 0.06% * |
Publisher’s Note: MDPI stays neutral with regard to jurisdictional claims in published maps and institutional affiliations. |
© 2022 by the authors. Licensee MDPI, Basel, Switzerland. This article is an open access article distributed under the terms and conditions of the Creative Commons Attribution (CC BY) license (https://creativecommons.org/licenses/by/4.0/).
Share and Cite
Baselga, M.; Alba, J.J.; Schuhmacher, A.J. The Control of Metabolic CO2 in Public Transport as a Strategy to Reduce the Transmission of Respiratory Infectious Diseases. Int. J. Environ. Res. Public Health 2022, 19, 6605. https://doi.org/10.3390/ijerph19116605
Baselga M, Alba JJ, Schuhmacher AJ. The Control of Metabolic CO2 in Public Transport as a Strategy to Reduce the Transmission of Respiratory Infectious Diseases. International Journal of Environmental Research and Public Health. 2022; 19(11):6605. https://doi.org/10.3390/ijerph19116605
Chicago/Turabian StyleBaselga, Marta, Juan J. Alba, and Alberto J. Schuhmacher. 2022. "The Control of Metabolic CO2 in Public Transport as a Strategy to Reduce the Transmission of Respiratory Infectious Diseases" International Journal of Environmental Research and Public Health 19, no. 11: 6605. https://doi.org/10.3390/ijerph19116605
APA StyleBaselga, M., Alba, J. J., & Schuhmacher, A. J. (2022). The Control of Metabolic CO2 in Public Transport as a Strategy to Reduce the Transmission of Respiratory Infectious Diseases. International Journal of Environmental Research and Public Health, 19(11), 6605. https://doi.org/10.3390/ijerph19116605