
Epiphytic Bryophytes in an Urban Landscape: Which Factors Determine Their Distribution, Species Richness, and Diversity? A Case Study in Wroclaw, Poland


Abstract
:1. Introduction
2. Materials and Methods
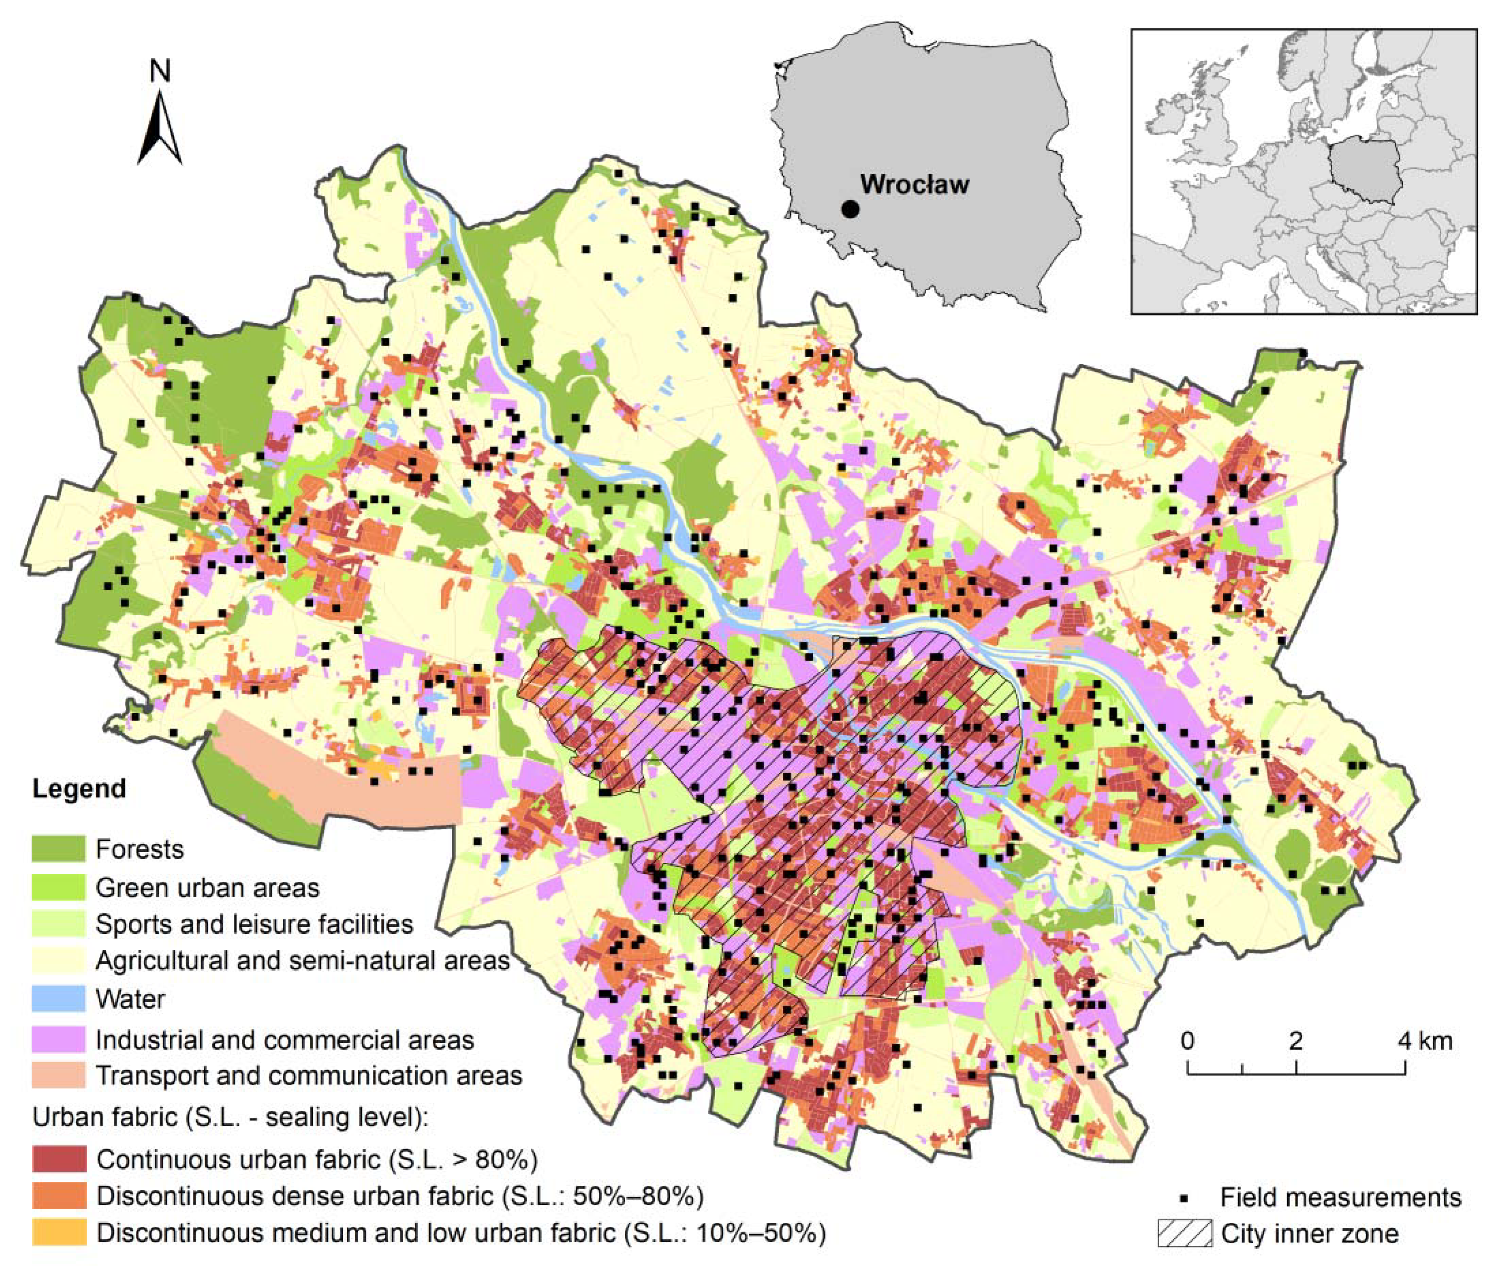
2.1. Study Area
2.2. Data Sampling
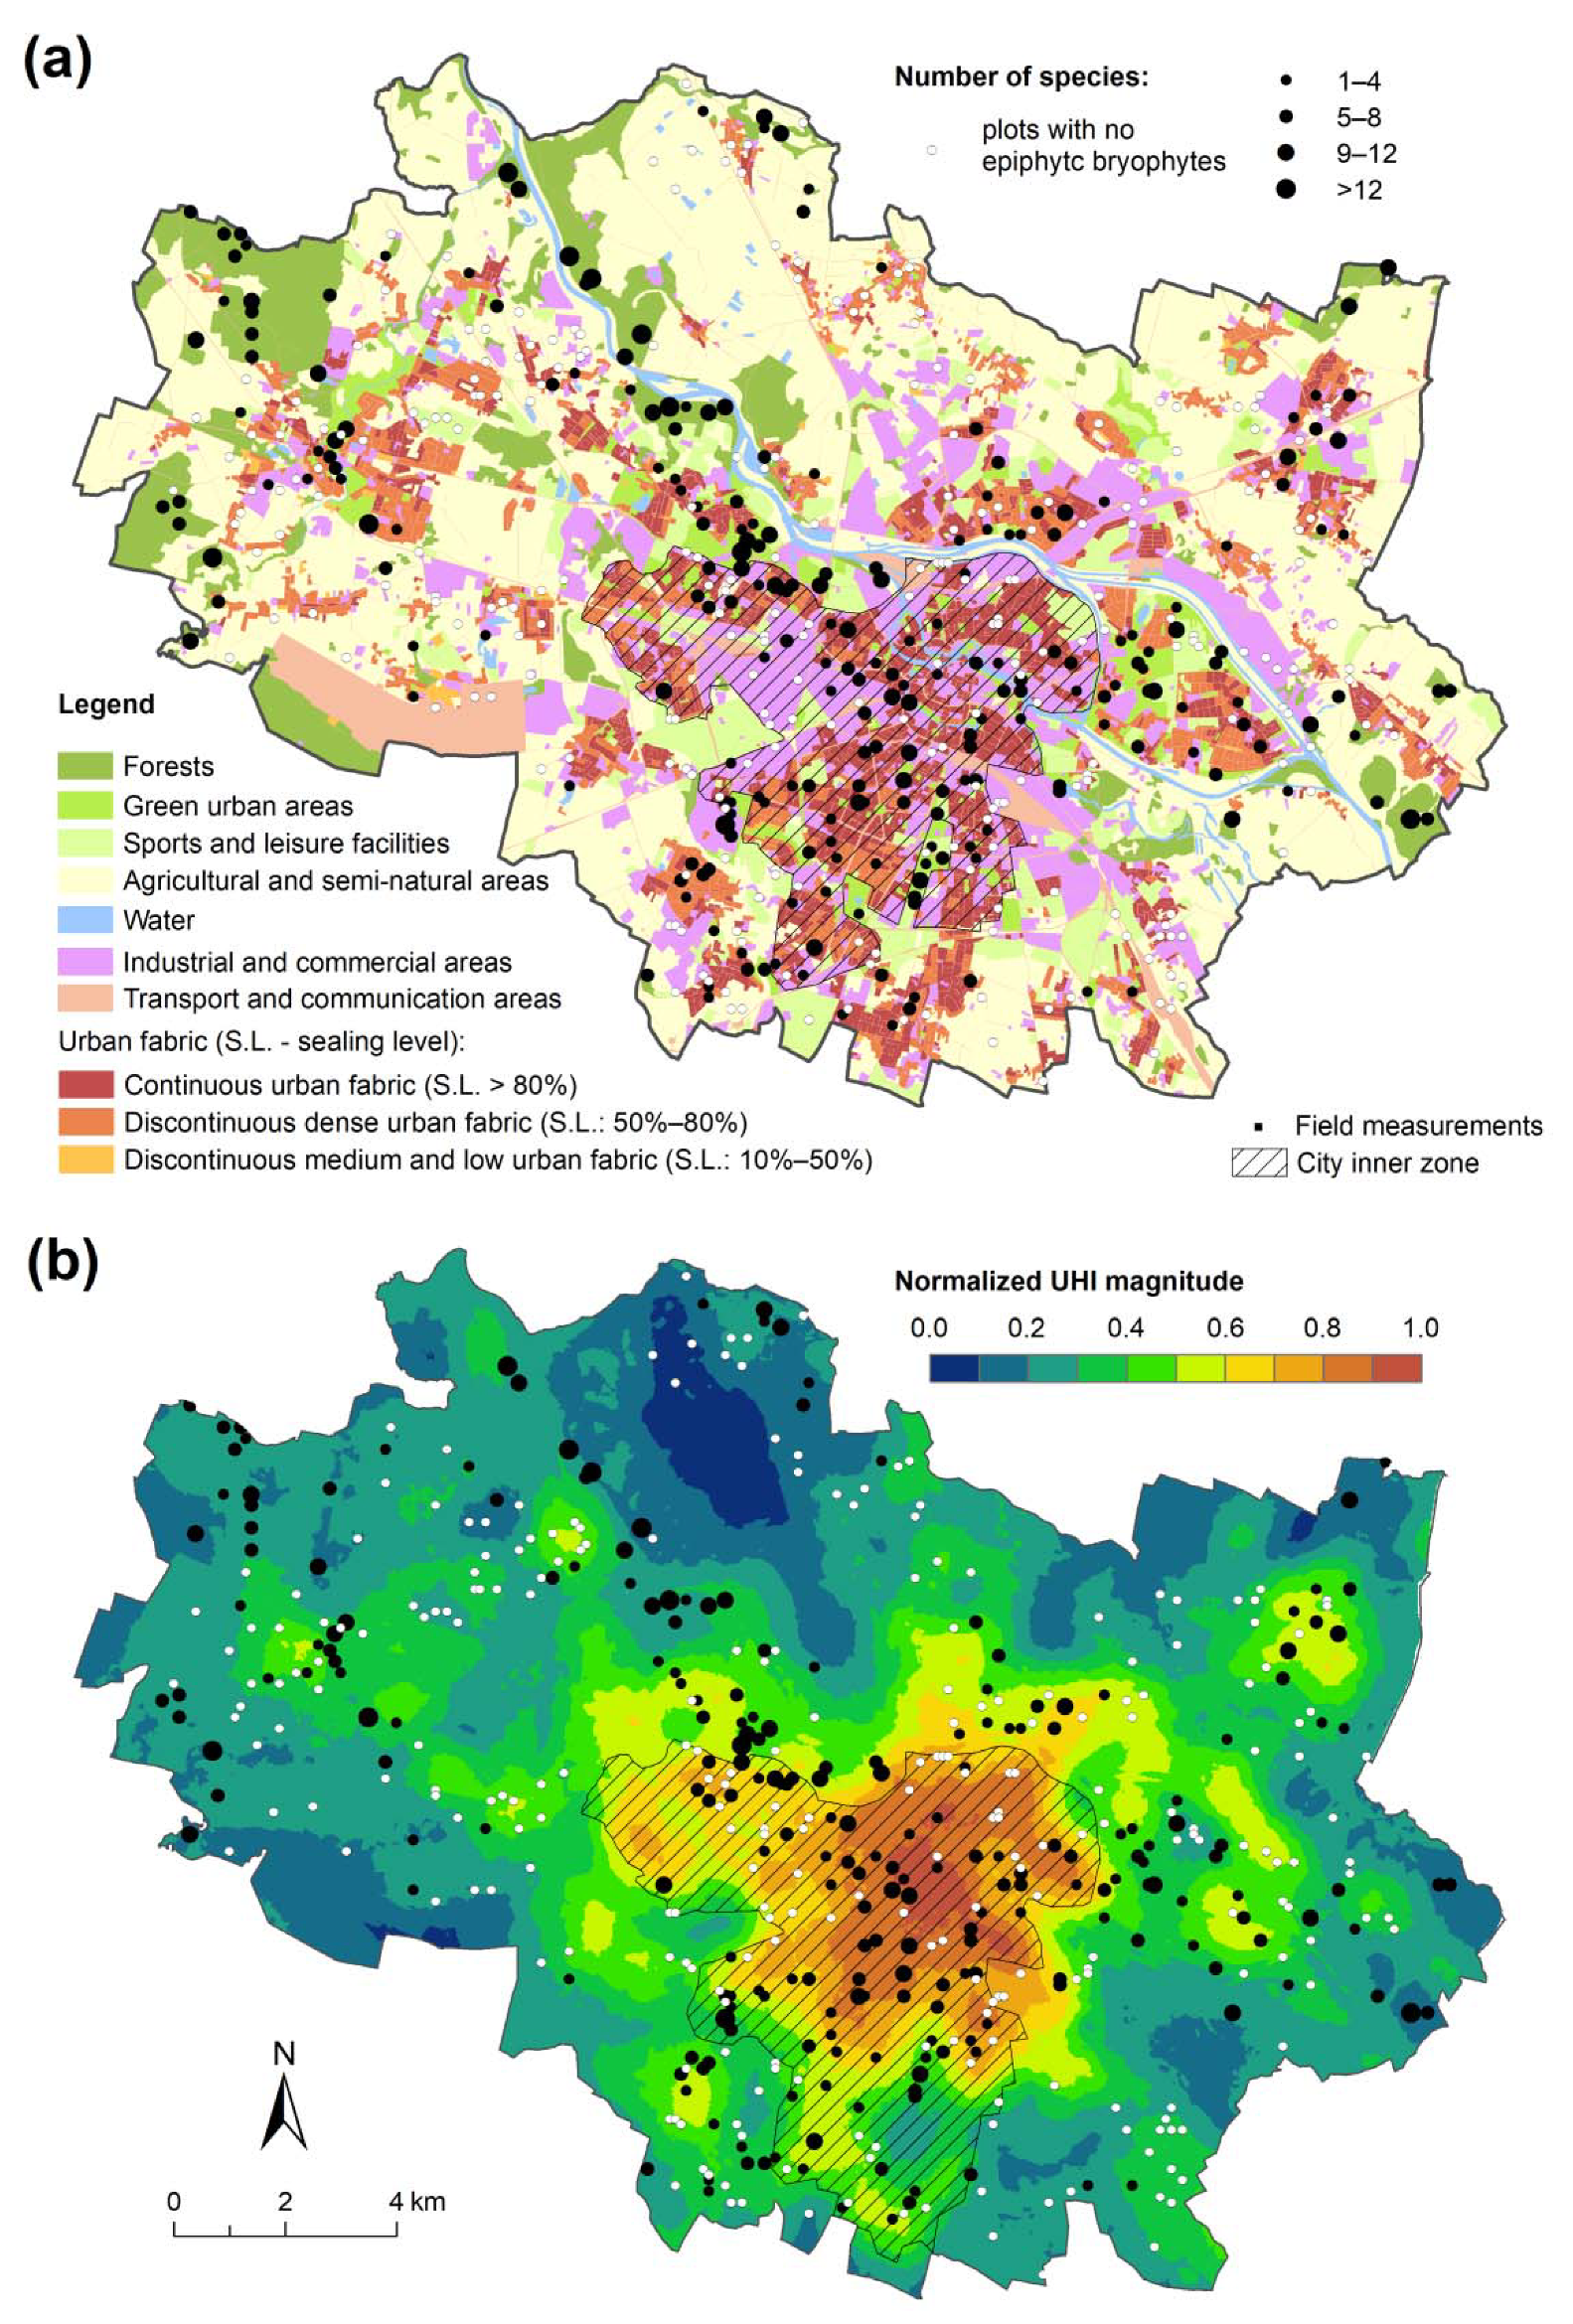
2.3. Field Surveys
2.4. Acquiring Urban Environmental Data
2.5. Variables Used in Analyses
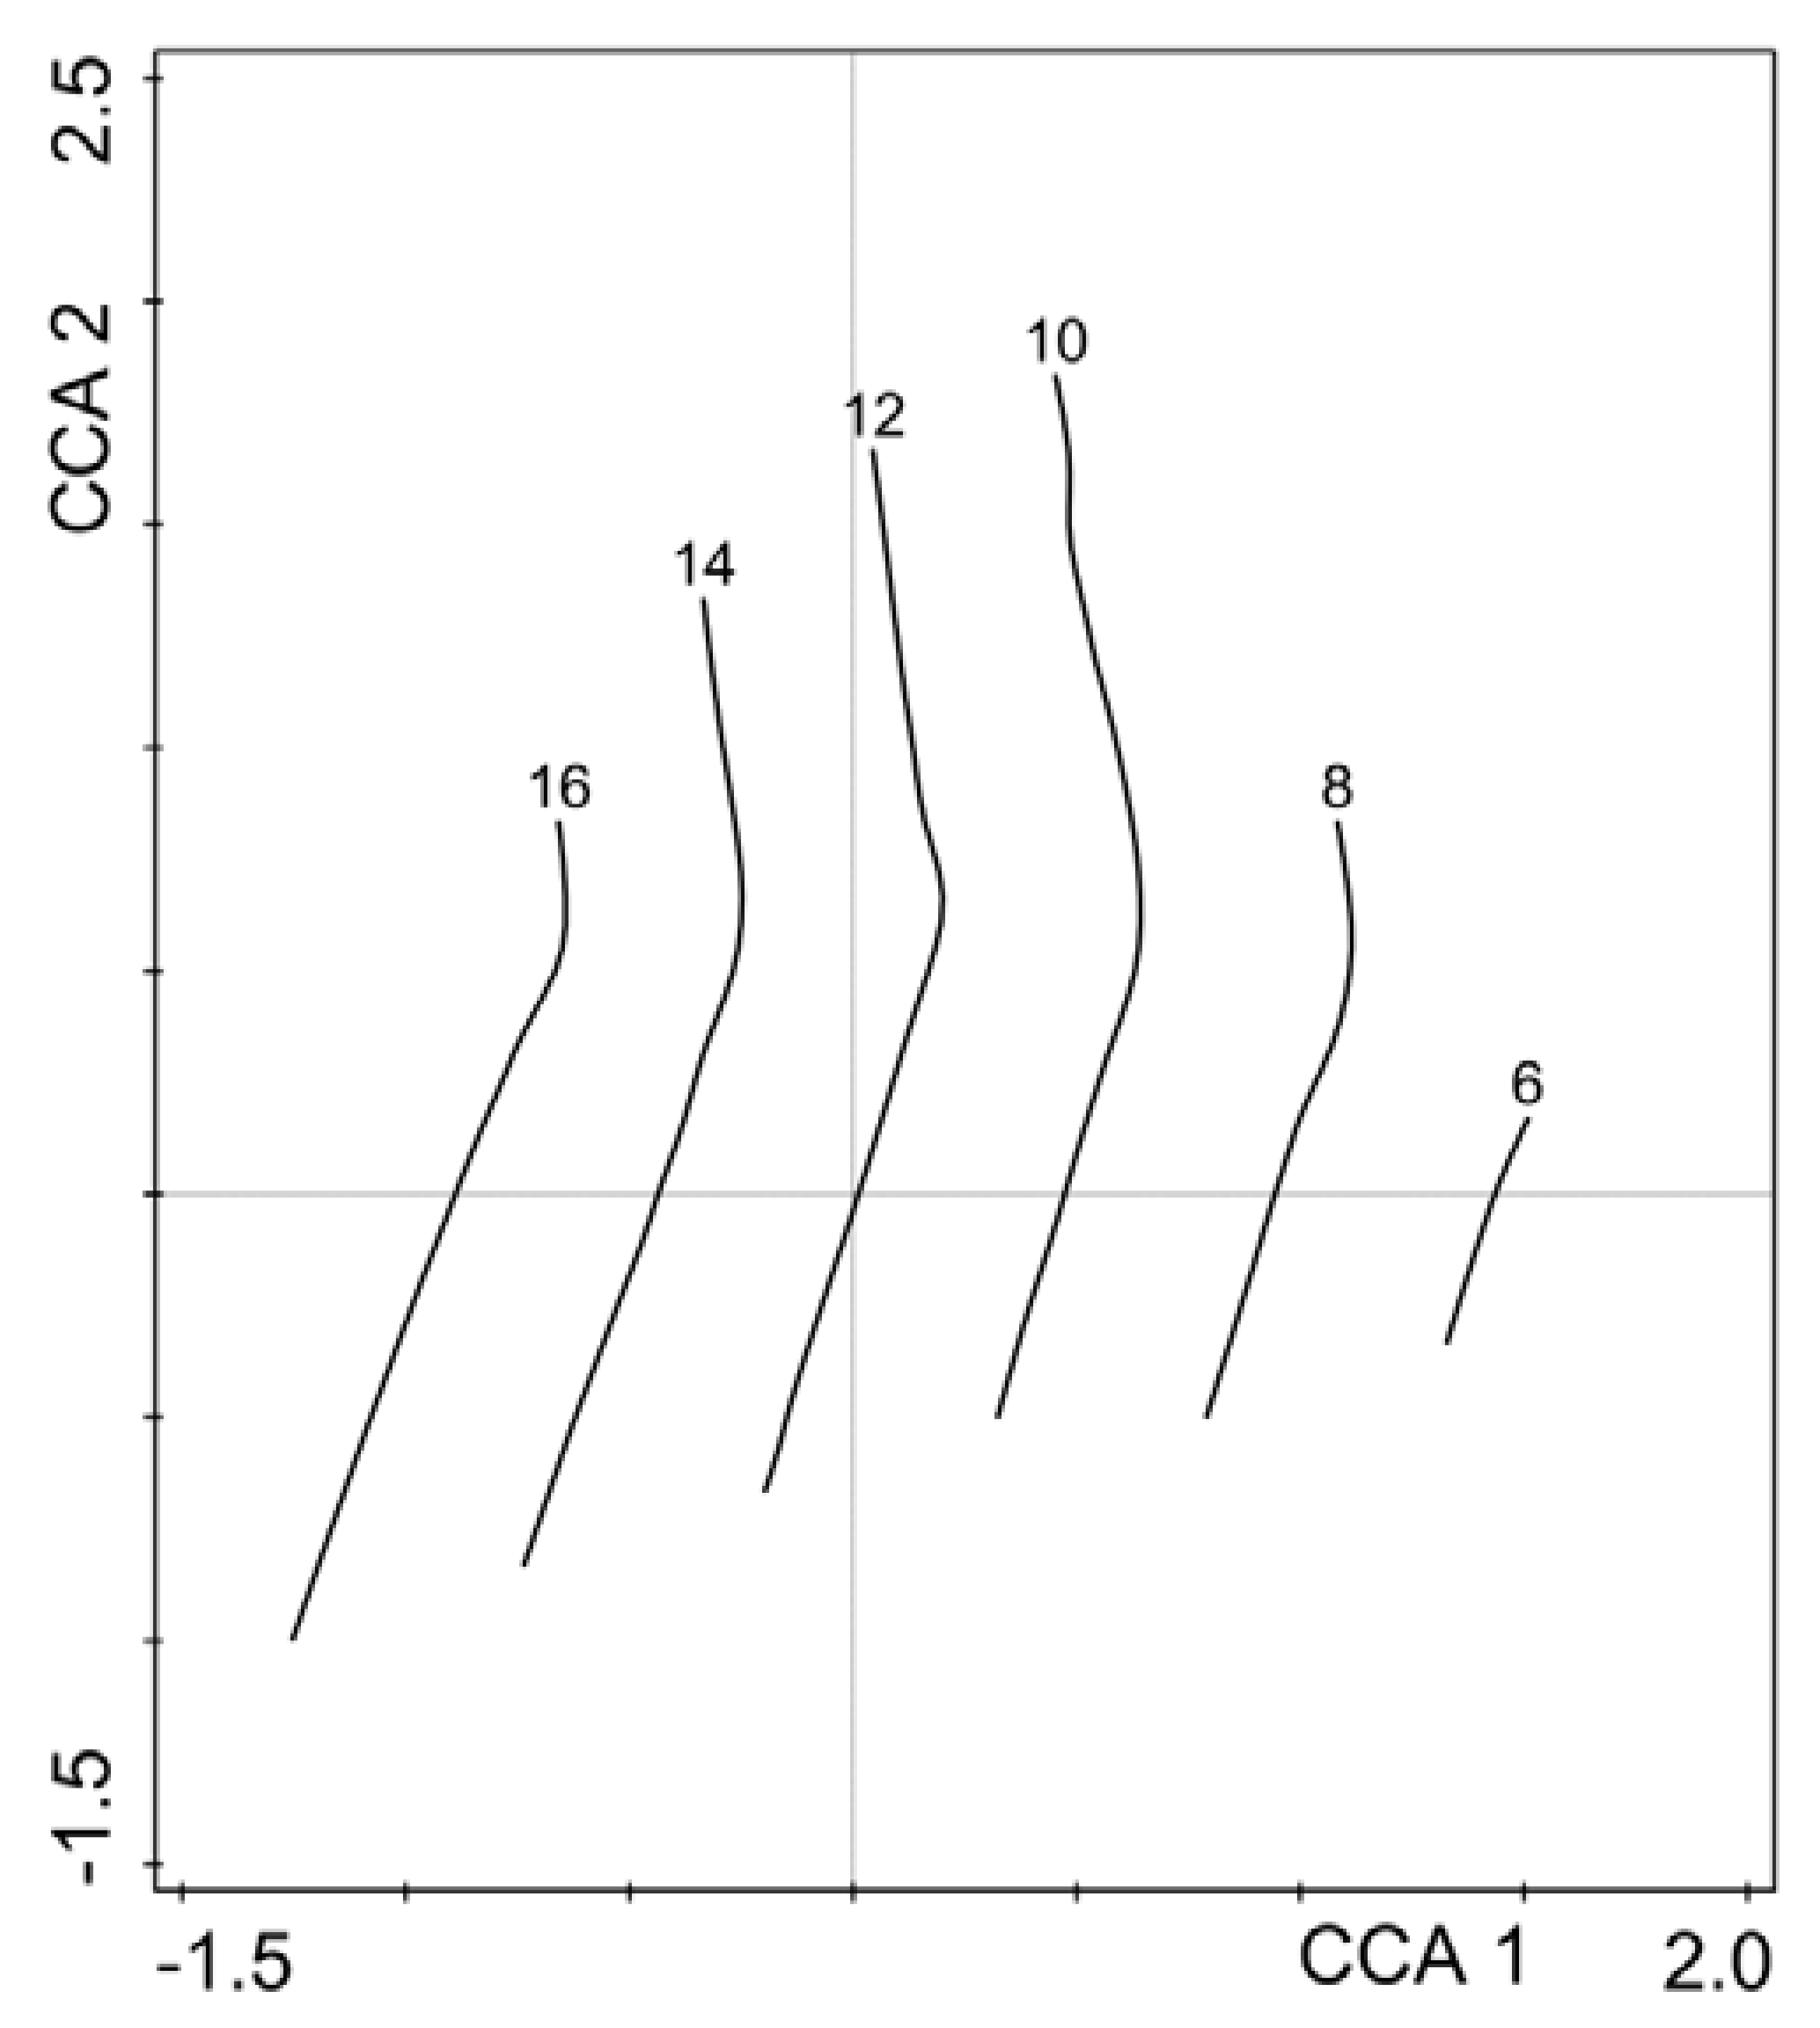
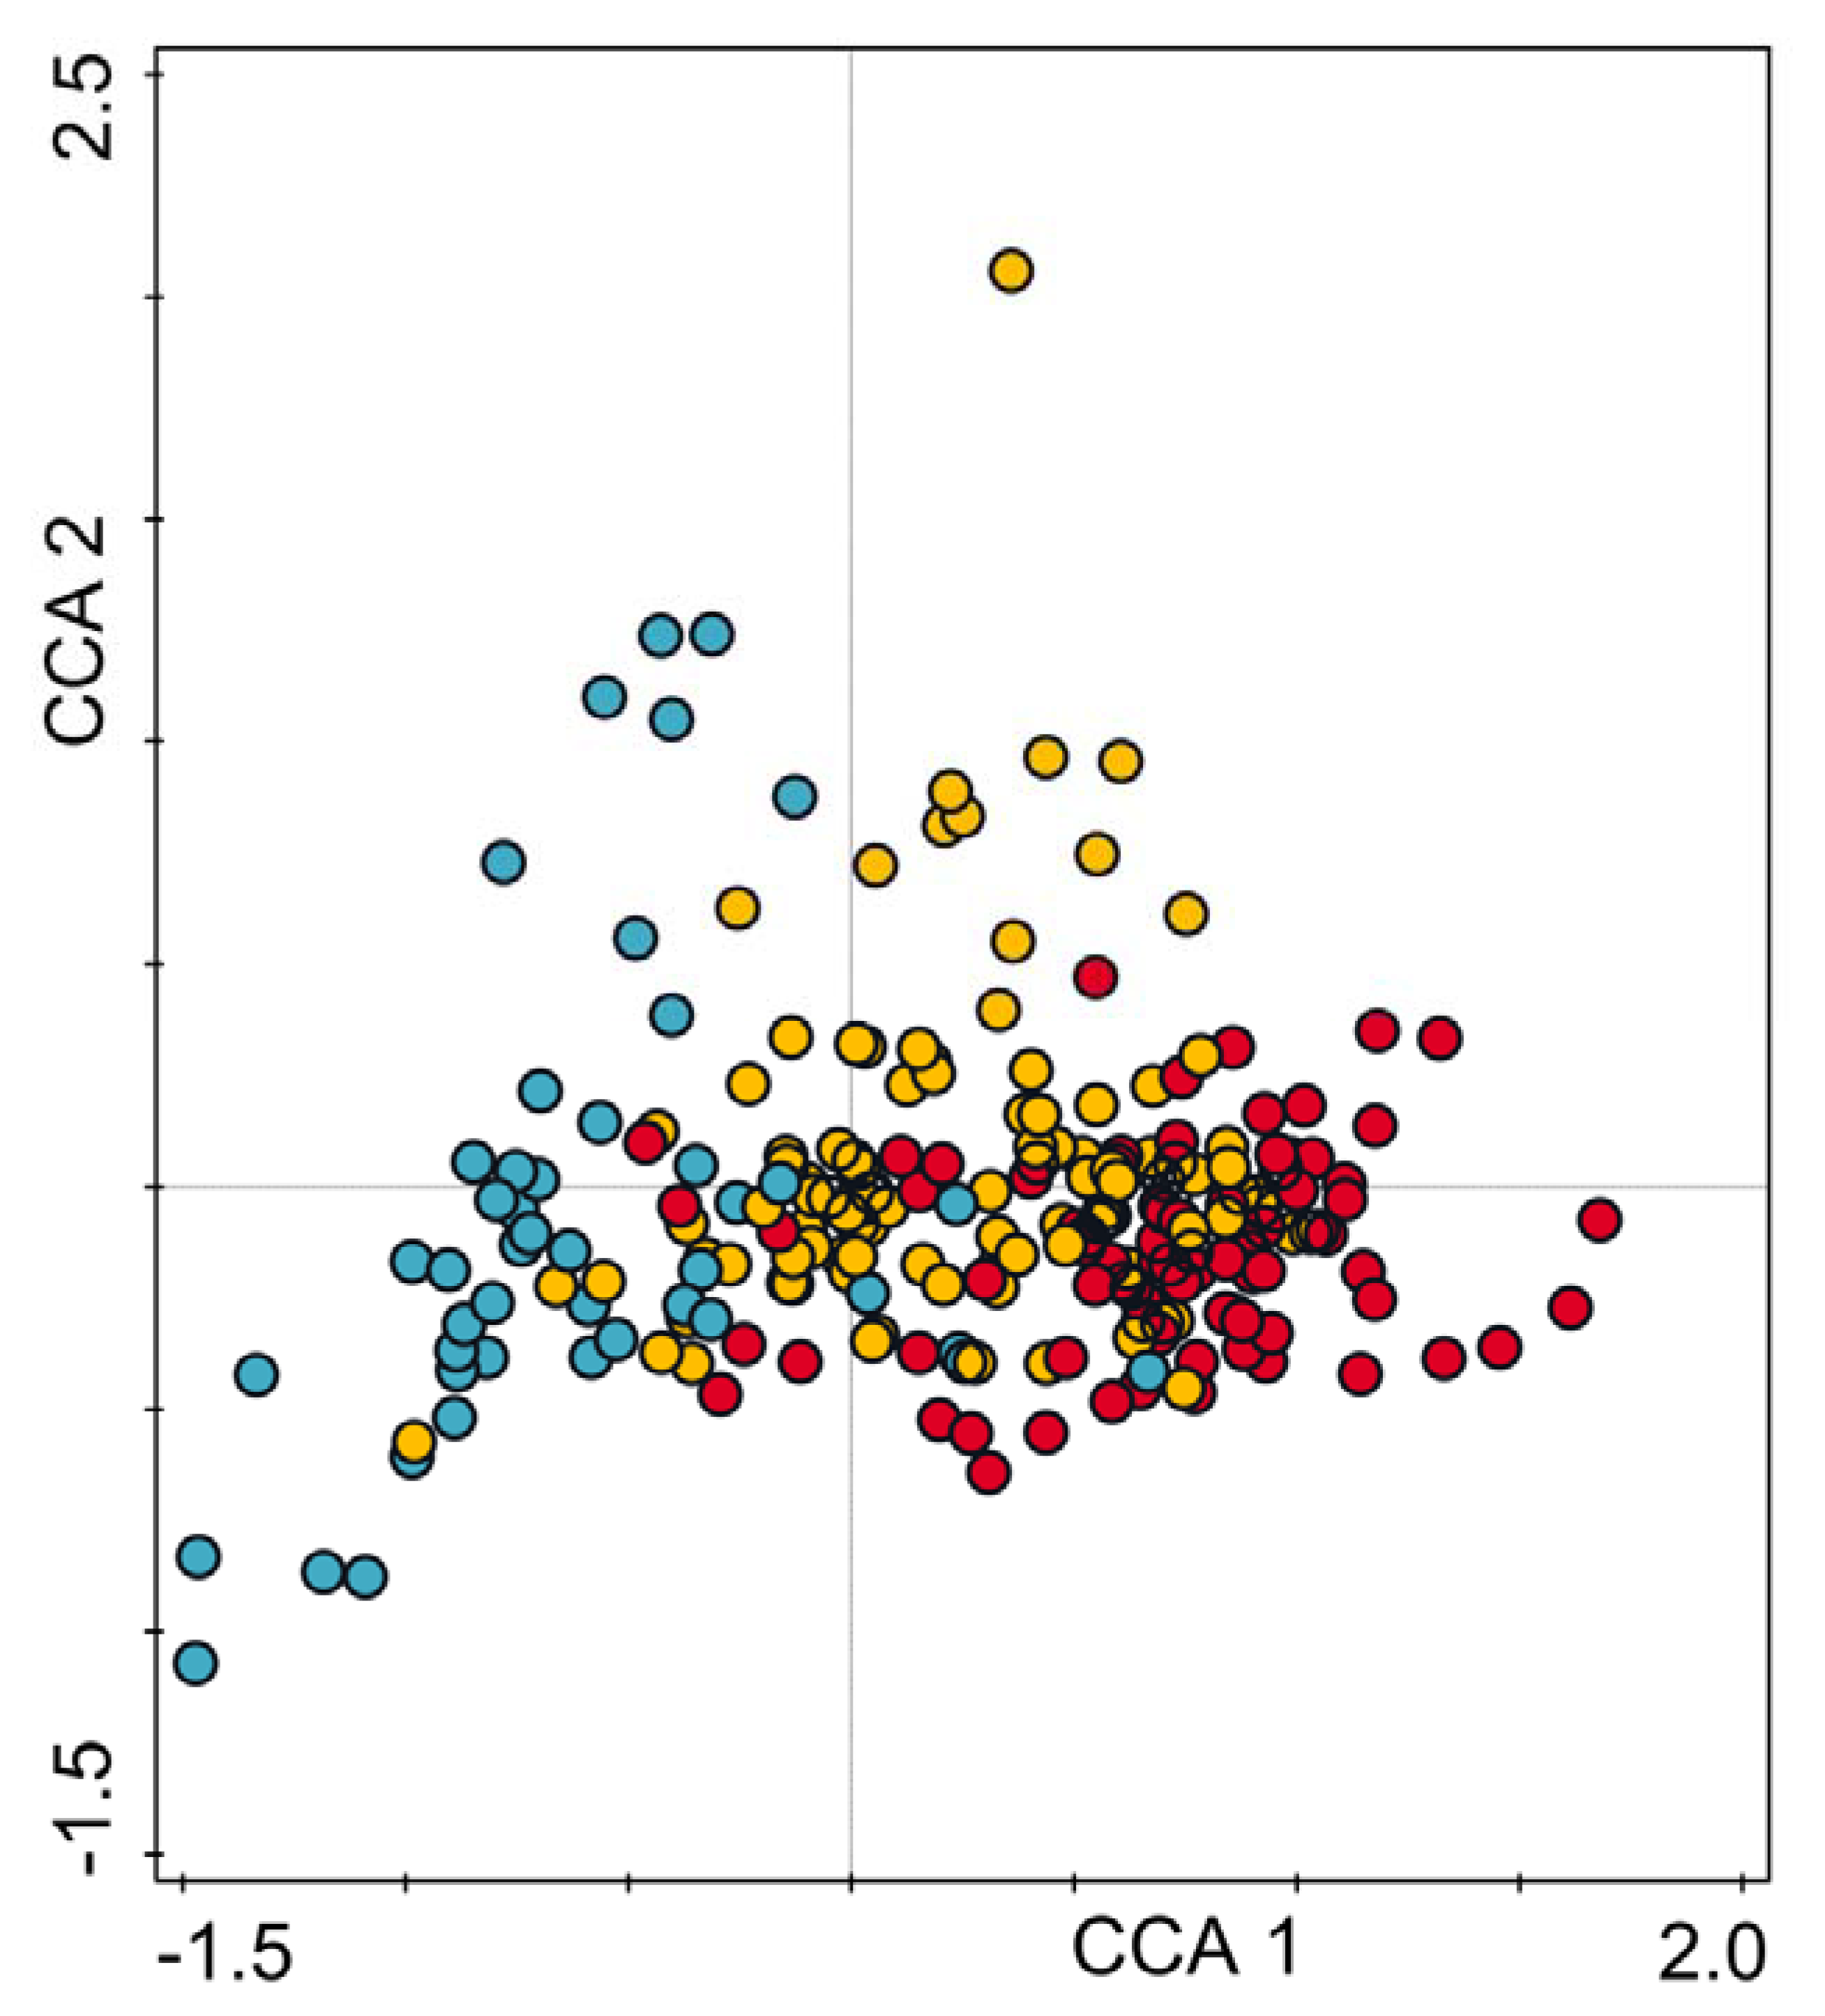
2.6. Data Analysis
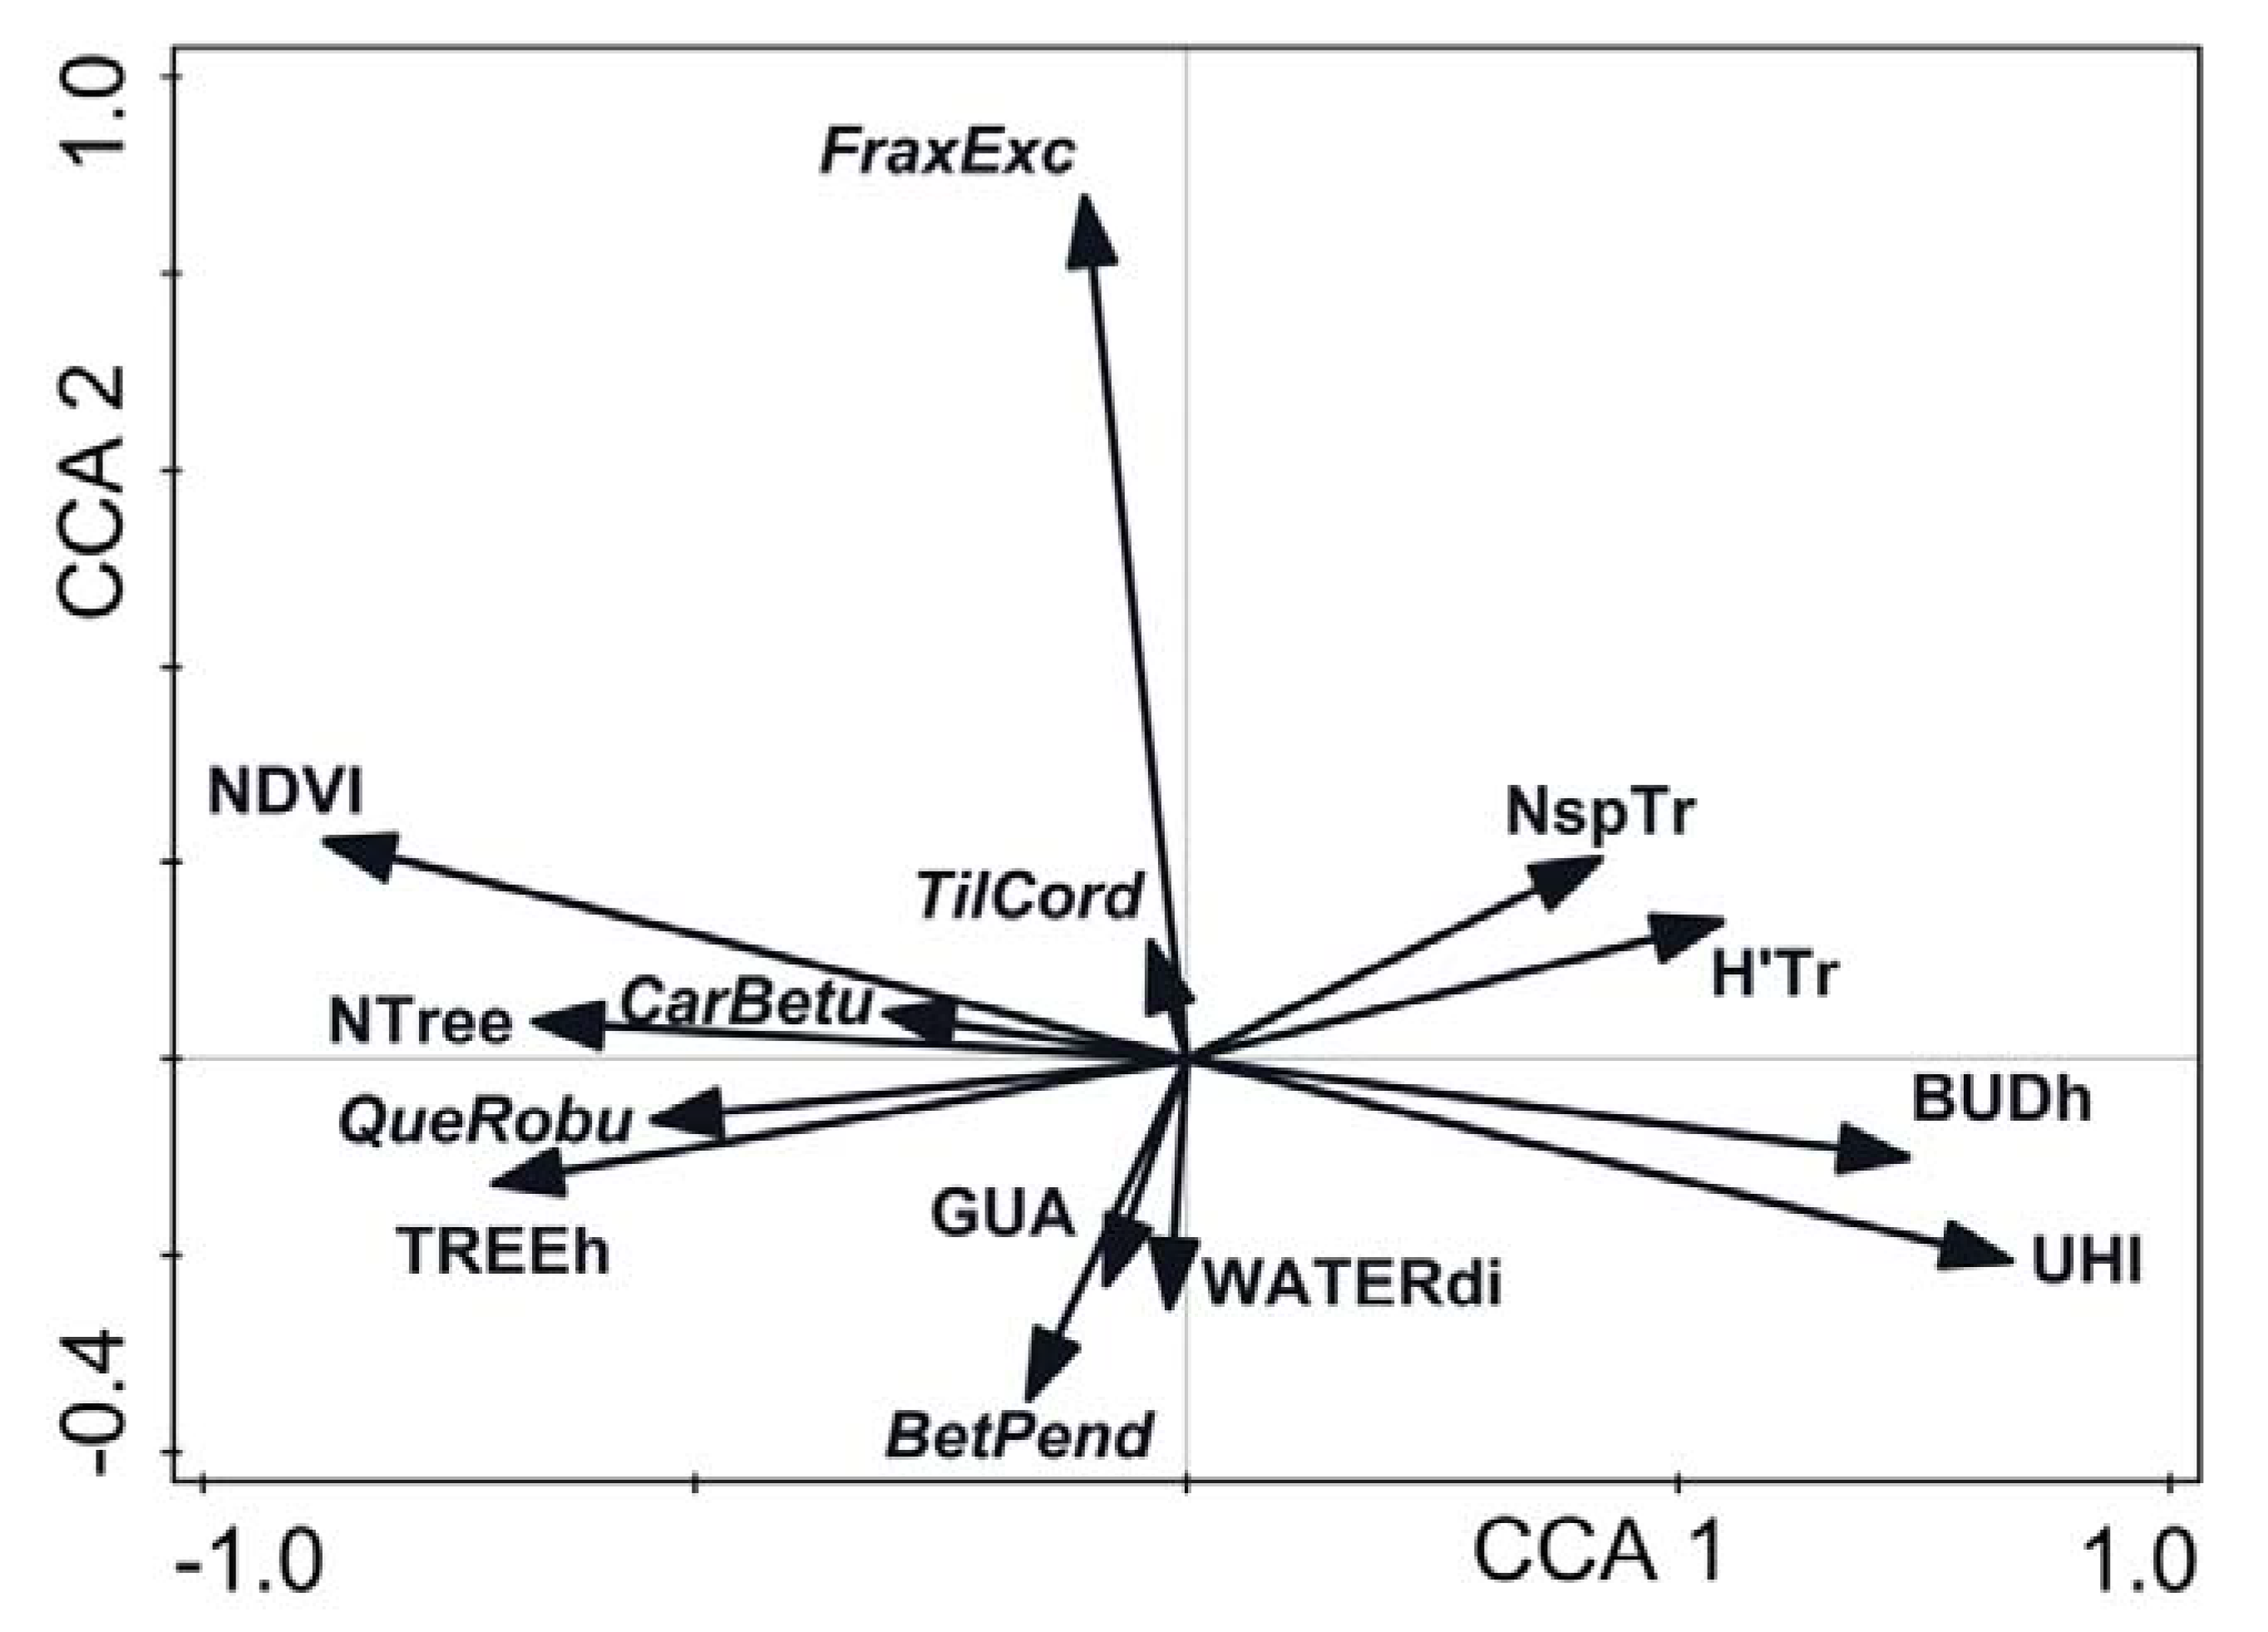
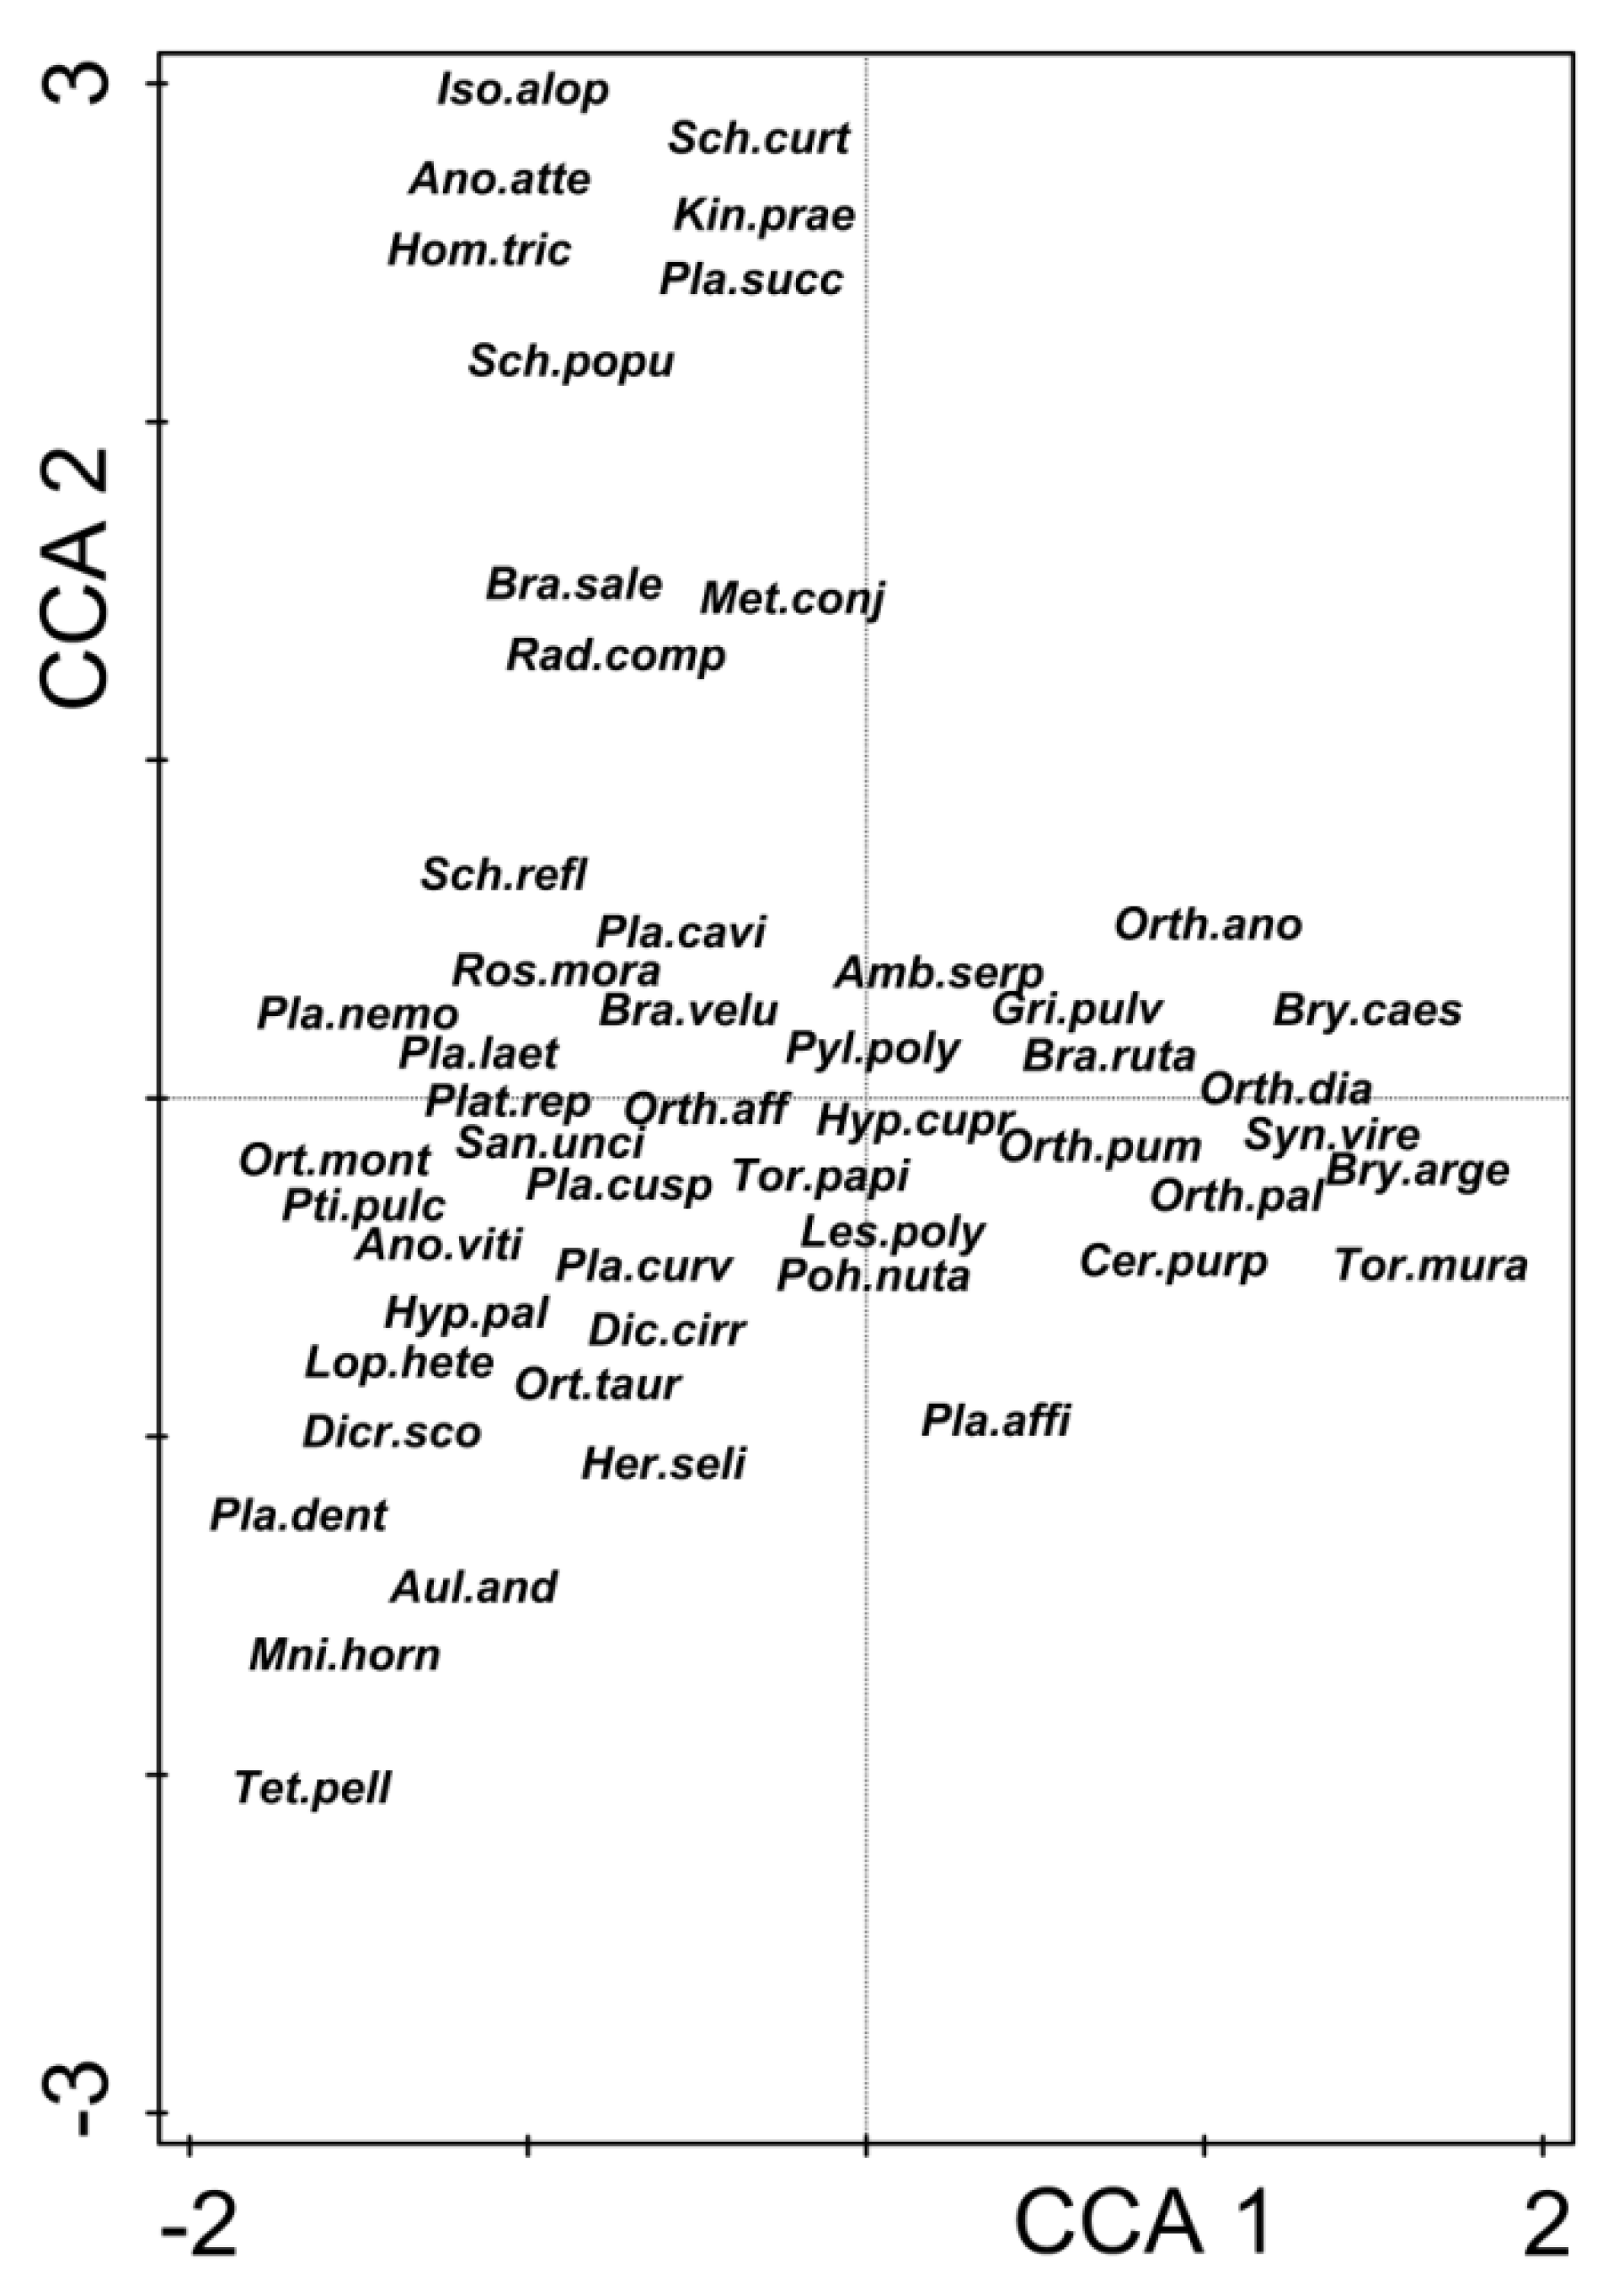
3. Results
4. Discussion
5. Conclusions
Author Contributions
Funding
Institutional Review Board Statement
Informed Consent Statement
Data Availability Statement
Conflicts of Interest
Appendix A

| Species Name | Abbreviation | Number of Plots in Which the Species Was Recorded |
|---|---|---|
| Amblystegium serpens *e | Amb.serp | 141 |
| Anomodon attenuates ** | Ano.atte | 6 |
| Anomodon viticulosus ** | Ano.viti | 1 |
| Aulacomnium androgynum ○ | Aul.and | 16 |
| Brachytheciastrum velutinum *m | Bra.velu | 30 |
| Brachythecium rutabulum *m | Bra.ruta | 86 |
| Brachythecium salebrosum *m | Bra.sale | 11 |
| Bryum argenteum ○ | Bry.arge | 33 |
| Bryum caespiticium ○ | Bry.caes | 2 |
| Ceratodon purpureus *m | Cer.purp | 78 |
| Dicranoweisia cirrata ** | Dic.cirr | 67 |
| Dicranum scoparium *e | Dicr.sco | 24 |
| Grimmia pulvinate ○ | Gri.pulv | 3 |
| Herzogiella seligeri ○ | Her.seli | 2 |
| Homalia trichomanoides ** | Hom.tric | 8 |
| Hypnum cupressiforme *e | Hyp.cupr | 187 |
| Hypnum pallescens ** | Hyp.pal | 18 |
| Isothecium alopecuroides ** | Iso.alop | 1 |
| Kindbergia praelonga *m | Kin.prae | 2 |
| Leskea polycarpa ** | Les.poly | 13 |
| Lophocolea heterophylla *e | Lop.hete | 23 |
| Metzgeria furcate ** | Met.conj | 2 |
| Mnium hornum *m | Mni.horn | 2 |
| Orthodicranum montanum ** | Ort.mont | 15 |
| Orthodicranum tauricum ** | Ort.taur | 12 |
| Orthotrichum affine ** | Orth.aff | 49 |
| Orthotrichum anomalum ○ | Orth.ano | 5 |
| Orthotrichum diaphanum *e | Orth.dia | 176 |
| Orthotrichum pallens *e | Orth.pal | 22 |
| Orthotrichum pumilum ** | Orth.pum | 132 |
| Plagiomnium affine *m | Pla.affi | 2 |
| Plagiomnium cuspidatum *m | Pla.cusp | 3 |
| Plagiothecium curvifolium *m | Pla.curv | 2 |
| Plagiothecium denticulatum *m | Pla.dent | 1 |
| Plagiothecium laetum ** | Pla.laet | 7 |
| Plagiothecium nemorale *m | Pla.nemo | 2 |
| Platygyrium repens ** | Plat.rep | 61 |
| Pohlia nutans *m | Poh.nuta | 2 |
| Ptilidium pulcherrimum ** | Pti.pulc | 1 |
| Pylasia polyantha *e | Pyl.poly | 3 |
| Radula complanate ** | Rad.comp | 11 |
| Rosulabryum moravicum *e | Ros.mora | 32 |
| Sanionia uncinate *e | San.unci | 2 |
| Sciuro-hypnum reflexum *e | Sch.refl | 1 |
| Sciuro-hypnum curtum *m | Sch.curt | 1 |
| Sciuro-hypnum populeum *e | Sch.popu | 4 |
| Syntrichia virescens *e | Syn.vire | 37 |
| Tetraphis pellucida ○ | Tet.pell | 2 |
| Tortula latifolia ** | Tor.lati | 1 |
| Tortula muralis ○ | Tor.mura | 2 |
| Tortula papillosa ** | Tor.papi | 1 |
References
- Andić, B.; Dragićević, S.; Stešević, D.; Jančić, D.; Krivokapić, S. Comparative analysis of trace elements in the mosses—Bryum argenteum Hedw. and Hypnum cupressiforme Hedw. in Podgorica (Montenegro). J. Mater. Environ. Sci. 2015, 6, 333–342. [Google Scholar]
- Barkman, J.J. Phytosociology and Ecology of Cryptogamic Epiphytes; Van Gorcum & Comp.: Assen, The Netherlands, 1958; p. 628. [Google Scholar]
- Oishi, Y. The influence of microclimate on bryophyte diversity in an urban Japanese garden landscape. Landsc. Ecol. Eng. 2019, 15, 167–176. [Google Scholar] [CrossRef]
- Oishi, Y. Urban heat island effects on moss gardens in Kyoto, Japan. Landsc. Ecol. Eng 2019, 15, 177–184. [Google Scholar] [CrossRef]
- Fudali, E. The ecological structure of the bryoflora of Wrocław’s park and cemeteries in relation to their localization and origin. Acta Soc. Bot. Pol. 2001, 70, 229–235. [Google Scholar] [CrossRef] [Green Version]
- Fudali, E. Distribution of epiphytic bryophytes in Wroclaw in relation to urban use complexes. Biodiv. Res. Conserv. 2019, 51, 11–21. [Google Scholar] [CrossRef] [Green Version]
- Giordano, S.; Sorbo, S.; Adamo, P.; Basile, A.; Spagnuolo, V.; Cobianchi, R.S. Biodiversity and trace element content of epiphytic bryophytes in urban and extraurban sites of southern Italy. Plant Ecol. 2004, 170, 1–14. [Google Scholar] [CrossRef]
- Davies, L.; Bates, J.W.; Bell, J.N.B.; James, P.W.; Purvis, O.W. Diversity and sensitivity of epiphytes to oxides of nitrogen in London. Environ. Pollut. 2006, 146, 299–310. [Google Scholar] [CrossRef]
- Sérgio, C.; Carvalho, P.; Garcia, C.A.; Almeida, E.; Novais, V.; Sim-Sim, M.; Jordão, H.; Sousa, A.J. Floristic changes of epiphytic flora in the Metropolitan Lisbon area between 1980-1981 and 2010-2011 related to urban air quality. Ecol. Indic. 2016, 67, 839–852. [Google Scholar] [CrossRef]
- Stebel, A.; Fojcik, B. Changes in the epiphytic bryophyte flora in Katowice city (Poland). Cryptogam. Bryol. 2016, 37, 399–414. [Google Scholar] [CrossRef]
- Dymytrova, L. Epiphytic lichens and bryophytes as indicators of air pollution in Kyiv city (Ukraine). Folia Cryptogam. Estonica 2009, 46, 33–44. [Google Scholar]
- Richter, S.; Schultze, P.; Bruelheide, H. Modelling epiphytic bryophyte vegetation in an urban landscape. J. Bryol. 2009, 31, 159–168. [Google Scholar] [CrossRef]
- Mežaka, A.; Brūmelis, G.; Piterāns, A. The distribution of epiphytic bryophyte and lichen species in relation to phorophyte characters in Latvian natural old-growth broad leaved forests. Folia Cryptogam. Est. 2008, 44, 89–99. [Google Scholar]
- Király, I.; Ódor, P. The effect of stand structure and tree species composition on epiphytic bryophytes in mixed decidu-ous-coniferous forests of Western Hungary. Biol. Conserv. 2010, 143, 2063–2069. [Google Scholar] [CrossRef]
- Mežaka, A.; Brūmelis, G.; Piterāns, A. Tree and stand-scale factors affecting richness and composition of epiphytic bryophytes and lichens in deciduous woodland key habitats. Biodivers. Conserv. 2012, 21, 3221–3241. [Google Scholar] [CrossRef]
- Király, I.; Nascimbene, J.; Tinya, F.; Ódor, P. Factors influencing epiphytic bryophyte and lichen species richness at different spatial scales in managed temperate forests. Biodivers. Conserv. 2013, 22, 209–223. [Google Scholar] [CrossRef] [Green Version]
- Ódor, P.; Király, I.; Tinya, F.; Bortignon, F.; Nascimbene, J. Patterns and drivers of species composition of epiphytic bryophytes and lichens in managed temperate forests. For. Ecol. Manag. 2013, 306, 256–265. [Google Scholar] [CrossRef] [Green Version]
- Alberti, M.; Marzluff, J.M.; Bradley, G.; Ryan, C.; Shulenberger, E.; Zumbrunnen, C. Integrating humans into ecology: Oppor-tunities and challenges for studying urban ecosystems. Bioscience 2003, 53, 1169–1179. [Google Scholar] [CrossRef] [Green Version]
- Godefroid, S.; Koedam, N. Urban plant species patterns are highly driven by density and function of built-up areas. Landsc. Ecol. 2007, 22, 1227–1239. [Google Scholar] [CrossRef]
- Aronson, M.F.J.; Lepczyk, C.A.; Evans, K.L.; Goddard, M.A.; Lerman, S.B.; MacIvor, J.S.; Nilon, C.H.; Vargo, T. Biodiversity in the city: Key challenges for urban green space management. Front. Ecol. Environ. 2017, 15, 189–196. [Google Scholar] [CrossRef] [Green Version]
- Szymanowski, M.; Wieczorek, M.; Namyślak, M.; Kryza, M.; Migała, K. Spatio-temporal changes in atmospheric presipitation over south-western Poland between te periods 1891-1930 and 1981-2010. Theor. Appl. Climatol. 2019, 135, 505–518. [Google Scholar] [CrossRef] [Green Version]
- Landsberg, H.E. The Urban Climate; International Geophysics Series; Academic Press: New York, NY, USA, 1981; Volume 28, p. 275. [Google Scholar] [CrossRef]
- Oke, T.R. Boundary Layer Climates; Routledge: London, UK, 1987; p. 464. [Google Scholar] [CrossRef]
- Szymanowski, M. Interactions between thermal advection in frontal zones and the urban heat island of Wrocław, Poland. Theor. Appl. Climatol. 2005, 82, 207–224. [Google Scholar] [CrossRef]
- Szymanowski, M.; Kryza, M. Local regression models for spatial interpolation of urban heat island—An example from Wrocław, SW Poland. Theor. Appl. Climatol. 2012, 108, 53–71. [Google Scholar] [CrossRef] [Green Version]
- Fudali, E.; Żołnierz, L. Epiphytic bryophytes in urban forests of Wroclaw (SW Poland). Biodiv. Res. Conserv. 2019, 53, 73–83. [Google Scholar] [CrossRef] [Green Version]
- Dierssen, K. Distribution, ecological amplitude and phytosociological characterization of European bryophytes. Bryophyt. Bibl. 2001, 56, 1–289. [Google Scholar]
- Szymanowski, M. The Urban Heat Island in Wrocław; Wydawnictwo Uniwersytetu Wrocławskiego: Wrocław, Poland, 2004; p. 229. [Google Scholar]
- Weiss, A. Topographic Position and landforms Analysis, Poster presentation. In Proceedings of the 21nd ESRI User Conference, San Diego, CA, USA, 9–13 July 2001. [Google Scholar]
- Beven, K.J.; Kirkby, M.J. A physically based variable contributing area model of basin hydrology. Hydrol. Sci. Bull. 1979, 24, 43–69. [Google Scholar] [CrossRef] [Green Version]
- Suder, A.; Szymanowski, M. Determination of ventilation channels in urban area: A case study of Wrocław (Poland). Pure Appl. Geophys. 2014, 171, 965–975. [Google Scholar] [CrossRef] [Green Version]
- Jiménez-Muñoz, J.C.; Cristóbal, J.; Sobrino, J.A.; Sória, G.; Ninyerola, M.; Pons, X. revision of the single-channel algorithm for land surface temperature retrieval from Landsat thermal-infrared data. IEEE Trans. Geosci. Remote Sens. 2009, 47, 339–349. [Google Scholar] [CrossRef]
- Walawender, J.P.; Szymanowski, M.; Hajto, M.J.; Bokwa, A. Land Surface Temperature Patterns in the Urban Agglomeration of Krakow (Poland) Derived from Landsat-7/ETM+ Data. Pure Appl. Geophys. 2014, 171, 913–940. [Google Scholar] [CrossRef] [Green Version]
- Tucker, C.J. Red and photographic infrared linear combinations for monitoring vegetation. Remote Sens. Environ. 1979, 8, 127–150. [Google Scholar] [CrossRef] [Green Version]
- Wilson, E.H.; Sader, S.A. Detection of forest harvest type using multiple dates of Landsat TM imaginery. Remote Sens. Environ. 2002, 80, 385–396. [Google Scholar] [CrossRef]
- Zha, Y.; Gao, Y.; Ni, S. Use of normalized difference built-up index in automatically mapping urban areas from TM imagery. Int. J. Remote Sens. 2003, 24, 583–594. [Google Scholar] [CrossRef]
- ArcGIS; Version 10.2; Environmental Systems Research Institute: Redlands, CA, USA, 2013.
- Conrad, O.; Bechtel, B.; Bock, M.; Dietrich, H.; Fischer, E.; Gerlitz, L.; Wehberg, J.; Wichmann, V.; Böhner, J. System for Automated Geoscientific Analyses (SAGA). Version 2.1.4. Free Open Source Software. Geosci. Model Dev. 2015, 8, 1991–2007. [Google Scholar] [CrossRef] [Green Version]
- Multi-Variate Statistical Package; v3.131; Kovach Computing Services: Anglesey, UK, 2004.
- Statistica (Data Analysis Software System); Version 13; TIBCO Software Inc.: Palo Alto, CA, USA, 2018; Available online: http://statistica.io (accessed on 25 January 2018).
- Ter Braak, C.J.F.; Šmilauer, P. Canoco Reference Manual and User’s Guide: Software for Ordination, Version 5.0; Microcomputer Power: Ithaca, NY, USA, 2012. [Google Scholar]
- Jongman, R.H.G.; Ter Braak, C.J.F.; van Tongeren, D.F.R. Data Analysis in Community and Landscape Ecology; Pudoc: Wageningen, The Netherlands, 1987; p. 290. [Google Scholar]
- Friedel, A.; Oheimb, G.V.; Dengler, J.; Härdtle, W. Species diversity and species composition of epiphytic bryophytes and lichens—A comparison of managed and unmanaged beech forests in NE Germany. Feddes Repert. 2006, 117, 172–185. [Google Scholar] [CrossRef]
- Stebel, A.; Żarnowiec, J. Primeval species in the moss flora of the Bieszczady National Park (Eastern Carpathians). Roczniki Bieszcz. 2014, 22, 259–277. [Google Scholar]
- Stapper, N.J.; Kricke, R. Epiphytische Moose und Flechten als Bioindikatoren von städtischer Überwärmung Standorteutro-phierung und verkehrsbedingten Immissionen. Limprichtia 2004, 24, 187–208. [Google Scholar] [CrossRef]
- Larsen, R.S.; Bell, J.N.B.; James, P.W.; Chimonides, P.J.; Rumsey, F.J. Lichen and bryophyte distribution on oak in London in relation to air pollution and bark acidity. Environ. Pollut. 2007, 146, 332–340. [Google Scholar] [CrossRef]
- Oishi, Y.; Hiura, T. Bryophytes as bioindicators of the atmospheric environment in urban-forest landscapes. Landsc. Urban Plan. 2017, 167, 348–355. [Google Scholar] [CrossRef]
- Aude, E.; Poulsen, R.S. Influence of management on the species composition of epiphytic cryptogams in Danish Fagus forest. Appl. Veg. Sci. 2000, 3, 81–88. [Google Scholar] [CrossRef]
- Putna, S.; Mežaka, A. Preferences of epiphytic bryophytes for forest stand and substrate in North-East Latvia. Folia Cryptogam. Estonica 2014, 51, 75–83. [Google Scholar] [CrossRef]
- Fritz, Ő.; Niklasson, M.; Churski, M. Tree age is a key factor for the conservation of epiphytic lichens and bryophytes in beech forests. Appl. Veg. Sci. 2008, 12, 93–106. [Google Scholar] [CrossRef]
- Bates, W.; Proctor, M.C.F.; Preston, C.D.; Hodgetts, N.G.; Perry, A.R. Occurrence of epiphytic bryophytes in a ‘tetrad’ transect across southern Britain. 1. Geographical trends in abundance and evidence of recent change. J. Bryol. 1997, 19, 685–714. [Google Scholar] [CrossRef]
- Pentecost, A. The cryptogamic epiphytes of ash (Fraxinus excelsior L.) in an ancient pasture-woodland: Relationships with some environmental variables of relevance to woodland epiphyte management. Cryptogam. Bryol. 2014, 35, 19–36. [Google Scholar] [CrossRef]
- Woziwoda, B.; Staniaszek-KIk, M.; Stefańska-Krzaczek, E. Assemblages of native bryophytes in secondary forests with introduced Quercus rubra. Nord. J. Bot. 2017, 35, 111–120. [Google Scholar] [CrossRef]
- Fudali, E.; Szymanowski, M. Epiphytic bryophytes on alien host tree species in Wroclaw (SW Poland). Cryptogam. Bryol. 2019, 40, 119–129. [Google Scholar] [CrossRef]

| Source Dataset | Data Model | Minimum Mapping Unit | Spatial Resolution (Pixel Size) | Year of Origin | Coordinate Reference Datum/ Projection EPSG Code |
|---|---|---|---|---|---|
| Land use/land cover: Urban Atlas 2012 (https://land.copernicus.eu/local/urban-atlas/, accessed on day 22 September 2017) | Vector | 2500 m2 | - | 2012 | ETRS89/LAEA EPSG: 3035 |
| Satellite imagery: Landsat 8 L1TP product, 11 August 2015: LC08_L1TP_190024_20150811_20170406_01_T1 (https://earthexplorer.usgs.gov/, accessed on 22 September 2017) | Raster | - | 30 × 30 m | 2015 | WGS84/UTM33N EPSG: 32633 |
| LiDAR data: Digital Elevation Model, Digital Surface Model ISOK project, Poland (http://www.gugik.gov.pl/projekty/isok/produkty, accessed on 15 April 2013) | Raster | - | 1 × 1 m | 2011 | ETRS89/Poland CS92 EPSG: 2180 |
| Urban Heat Island data: [28] | Raster | - | 25 × 25 m | Measured: 2001-2002 Modelled: 2012 | ETRS89/Poland CS92 EPSG: 2180 |
| Variable | Abbreviation | Unit | Mean | SD | Range |
|---|---|---|---|---|---|
| In-field sampled data | |||||
| Number of trees | NTree | number | 72.01 | 10.67 | 5–524 |
| Shannon-Wiener diversity index for trees | H’Tr | – | 1.73 | 0.27 | 0.14–2.93 |
| Shannon-Wiener evenness index for trees | J’Tr | – | 0.80 | 0.02 | 0.16–1.0 |
| Number of tree species | NspTr | number | 9.50 | 1.33 | 2–27 |
| Land use/land cover data | |||||
| Agricultural and seminatural areas | AgrSn | m2 | 1157.1 | 0 | 0–10,000 |
| Continuous urban fabric >80% | CUF | m2 | 1902.8 | 0 | 0–10,000 |
| Discontinuous dense urban fabric 50–80% | DDUF | m2 | 1355.7 | 0 | 0–9985 |
| Discontinuous medium density urban fabric 30–50% | DMDUF | m2 | 61.4 | 0 | 0–5388 |
| Forests | FOR | m2 | 1609.2 | 0 | 0–10,000 |
| Green urban areas | GUA | m2 | 1182.2 | 0 | 0–10,000 |
| Industrial commercial public military and private units | IndMil | m2 | 1364.4 | 0 | 0–10,000 |
| Sports and leisure facilities | SLF | m2 | 418.0 | 0 | 0–10,000 |
| Nearest Water Body Distance | WATERdi | m | 950.3 | 118.6 | 1–3575 |
| Satellite imagery derivatives | |||||
| Land Surface Temperature | LST | °C | 37.9 | 0.48 | 32.2–45.5 |
| Normalized Difference Vegetation Index | NDVI | – | 0.25 | 0.04 | −0.005–0.402 |
| Normalized Difference Moisture Index | NDMI | – | 0.13 | 0.05 | −0.023–0.2862 |
| Normalized Difference Built-up Index | NDBI | – | −0.13 | 0.05 | −0.2862–0.0230 |
| LiDAR scan derivatives | |||||
| Built-up Area | BUDAREA | m2 | 1034.0 | 0 | 0–8100 |
| Buildings height | BUDh | m | 7.36 | 1.58 | 0–33.4 |
| Tree Covered Area | TrCA | m2 | 3553 | 1117.8 | 1–9846 |
| Trees Mean Height | TREEh | m | 9.35 | 1.83 | 2.51–22.11 |
| Roughness length | z0 | m | 0.97 | 0.27 | 0–4.893 |
| Porosity | POROSITY | – | 0.79 | 0.10 | 0–0.99 |
| Altitude | Alt | m a.s.l | 119.2 | 0.91 | 110–135 |
| Slope | Slp | deg. | 1.97 | 0.80 | 0.381–12.440 |
| Topographic Position Index | TPI | – | 0.02 | 0.03 | −0.899–2.616 |
| Topographic Wetness Index | TWI | – | 8.45 | 0.37 | 5.408–12.421 |
| Climatological data | |||||
| Urban Heat Island | UHI | 0.470 | 0.01 | 0.058–0.948 | |
| Variable | Explains % | Pseudo-F | p | P (adj) |
|---|---|---|---|---|
| Simple Term Effects | ||||
| NDVI | 12.4 | 33.2 | 0.002 | 0.03992 |
| UHI | 11.4 | 30.2 | 0.002 | 0.03992 |
| BUDh | 9.3 | 24.2 | 0.002 | 0.03992 |
| BUDarea | 8.7 | 22.4 | 0.002 | 0.03992 |
| TREEh | 8.4 | 21.4 | 0.002 | 0.03992 |
| NTree | 7.4 | 18.7 | 0.002 | 0.03992 |
| POROSITY | 6.6 | 16.6 | 0.002 | 0.03992 |
| Frax.exe | 5.5 | 13.6 | 0.002 | 0.03992 |
| Que.robu | 5.4 | 13.3 | 0.002 | 0.03992 |
| H’Tr | 5.1 | 12.8 | 0.002 | 0.03992 |
| Ace.pseu | 3.7 | 9.1 | 0.002 | 0.03992 |
| NspTr | 3.4 | 8.3 | 0.002 | 0.03992 |
| Ace.plat | 3.1 | 7.6 | 0.002 | 0.03992 |
| Rob.pseu | 2.4 | 5.8 | 0.002 | 0.03992 |
| Car.betu | 2.4 | 5.8 | 0.002 | 0.03992 |
| WATERdi | 2.0 | 4.8 | 0.002 | 0.03992 |
| GUA | 1.9 | 4.4 | 0.002 | 0.03992 |
| Bet.pend | 1.5 | 3.7 | 0.016 | 0.31936 |
| Til.cord | 0.8 | 1.9 | 0.047 | 0.95808 |
| Pic.abie | 0.6 | 1.4 | 0.120 | 1.00000 |
| Conditional Term Effects | ||||
| NDVI | 12.39 | 33.2 | 0.002 | 0.03992 |
| Frax.exe | 5.28 | 15.0 | 0.002 | 0.03992 |
| TREEh | 2.86 | 8.4 | 0.002 | 0.03992 |
| WATERdi | 2.38 | 7.2 | 0.002 | 0.03992 |
| GUA | 1.45 | 4.4 | 0.002 | 0.03992 |
| Bet.pend | 1.14 | 3.5 | 0.002 | 0.03992 |
| Car.betu | 1.03 | 3.2 | 0.004 | 0.03992 |
| NTree | 1.05 | 3.3 | 0.002 | 0.03992 |
| H’Tr | 0.99 | 3.1 | 0.002 | 0.03992 |
| Que.robu | 0.72 | 2.3 | 0.002 | 0.03992 |
| UHI | 0.73 | 2.4 | 0.002 | 0.03992 |
| Til.cord | 0.67 | 2.2 | 0.008 | 0.15968 |
| BUDh | 0.51 | 1.6 | 0.040 | 0.79840 |
| NspTr | 0.48 | 1.6 | 0.046 | 0.91816 |
| POROSITY | 0.44 | 1.4 | 0.096 | 1.00000 |
| BUDarea | 0.43 | 1.4 | 0.100 | 1.00000 |
| Ace.pseu | 0.41 | 1.3 | 0.176 | 1.00000 |
| Ace.plat | 0.37 | 1.2 | 0.200 | 1.00000 |
| Rob.pseu | 0.33 | 1.1 | 0.330 | 1.00000 |
| Pic.abie | 0.28 | 0.9 | 0.547 | 1.00000 |
Publisher’s Note: MDPI stays neutral with regard to jurisdictional claims in published maps and institutional affiliations. |
© 2022 by the authors. Licensee MDPI, Basel, Switzerland. This article is an open access article distributed under the terms and conditions of the Creative Commons Attribution (CC BY) license (https://creativecommons.org/licenses/by/4.0/).
Share and Cite
Żołnierz, L.; Fudali, E.; Szymanowski, M. Epiphytic Bryophytes in an Urban Landscape: Which Factors Determine Their Distribution, Species Richness, and Diversity? A Case Study in Wroclaw, Poland. Int. J. Environ. Res. Public Health 2022, 19, 6274. https://doi.org/10.3390/ijerph19106274
Żołnierz L, Fudali E, Szymanowski M. Epiphytic Bryophytes in an Urban Landscape: Which Factors Determine Their Distribution, Species Richness, and Diversity? A Case Study in Wroclaw, Poland. International Journal of Environmental Research and Public Health. 2022; 19(10):6274. https://doi.org/10.3390/ijerph19106274
Chicago/Turabian StyleŻołnierz, Ludwik, Ewa Fudali, and Mariusz Szymanowski. 2022. "Epiphytic Bryophytes in an Urban Landscape: Which Factors Determine Their Distribution, Species Richness, and Diversity? A Case Study in Wroclaw, Poland" International Journal of Environmental Research and Public Health 19, no. 10: 6274. https://doi.org/10.3390/ijerph19106274
APA StyleŻołnierz, L., Fudali, E., & Szymanowski, M. (2022). Epiphytic Bryophytes in an Urban Landscape: Which Factors Determine Their Distribution, Species Richness, and Diversity? A Case Study in Wroclaw, Poland. International Journal of Environmental Research and Public Health, 19(10), 6274. https://doi.org/10.3390/ijerph19106274