
GIS-Based Modeling of Human Settlement Suitability for the Belt and Road Regions


Abstract
:1. Introduction
2. Materials and Methods
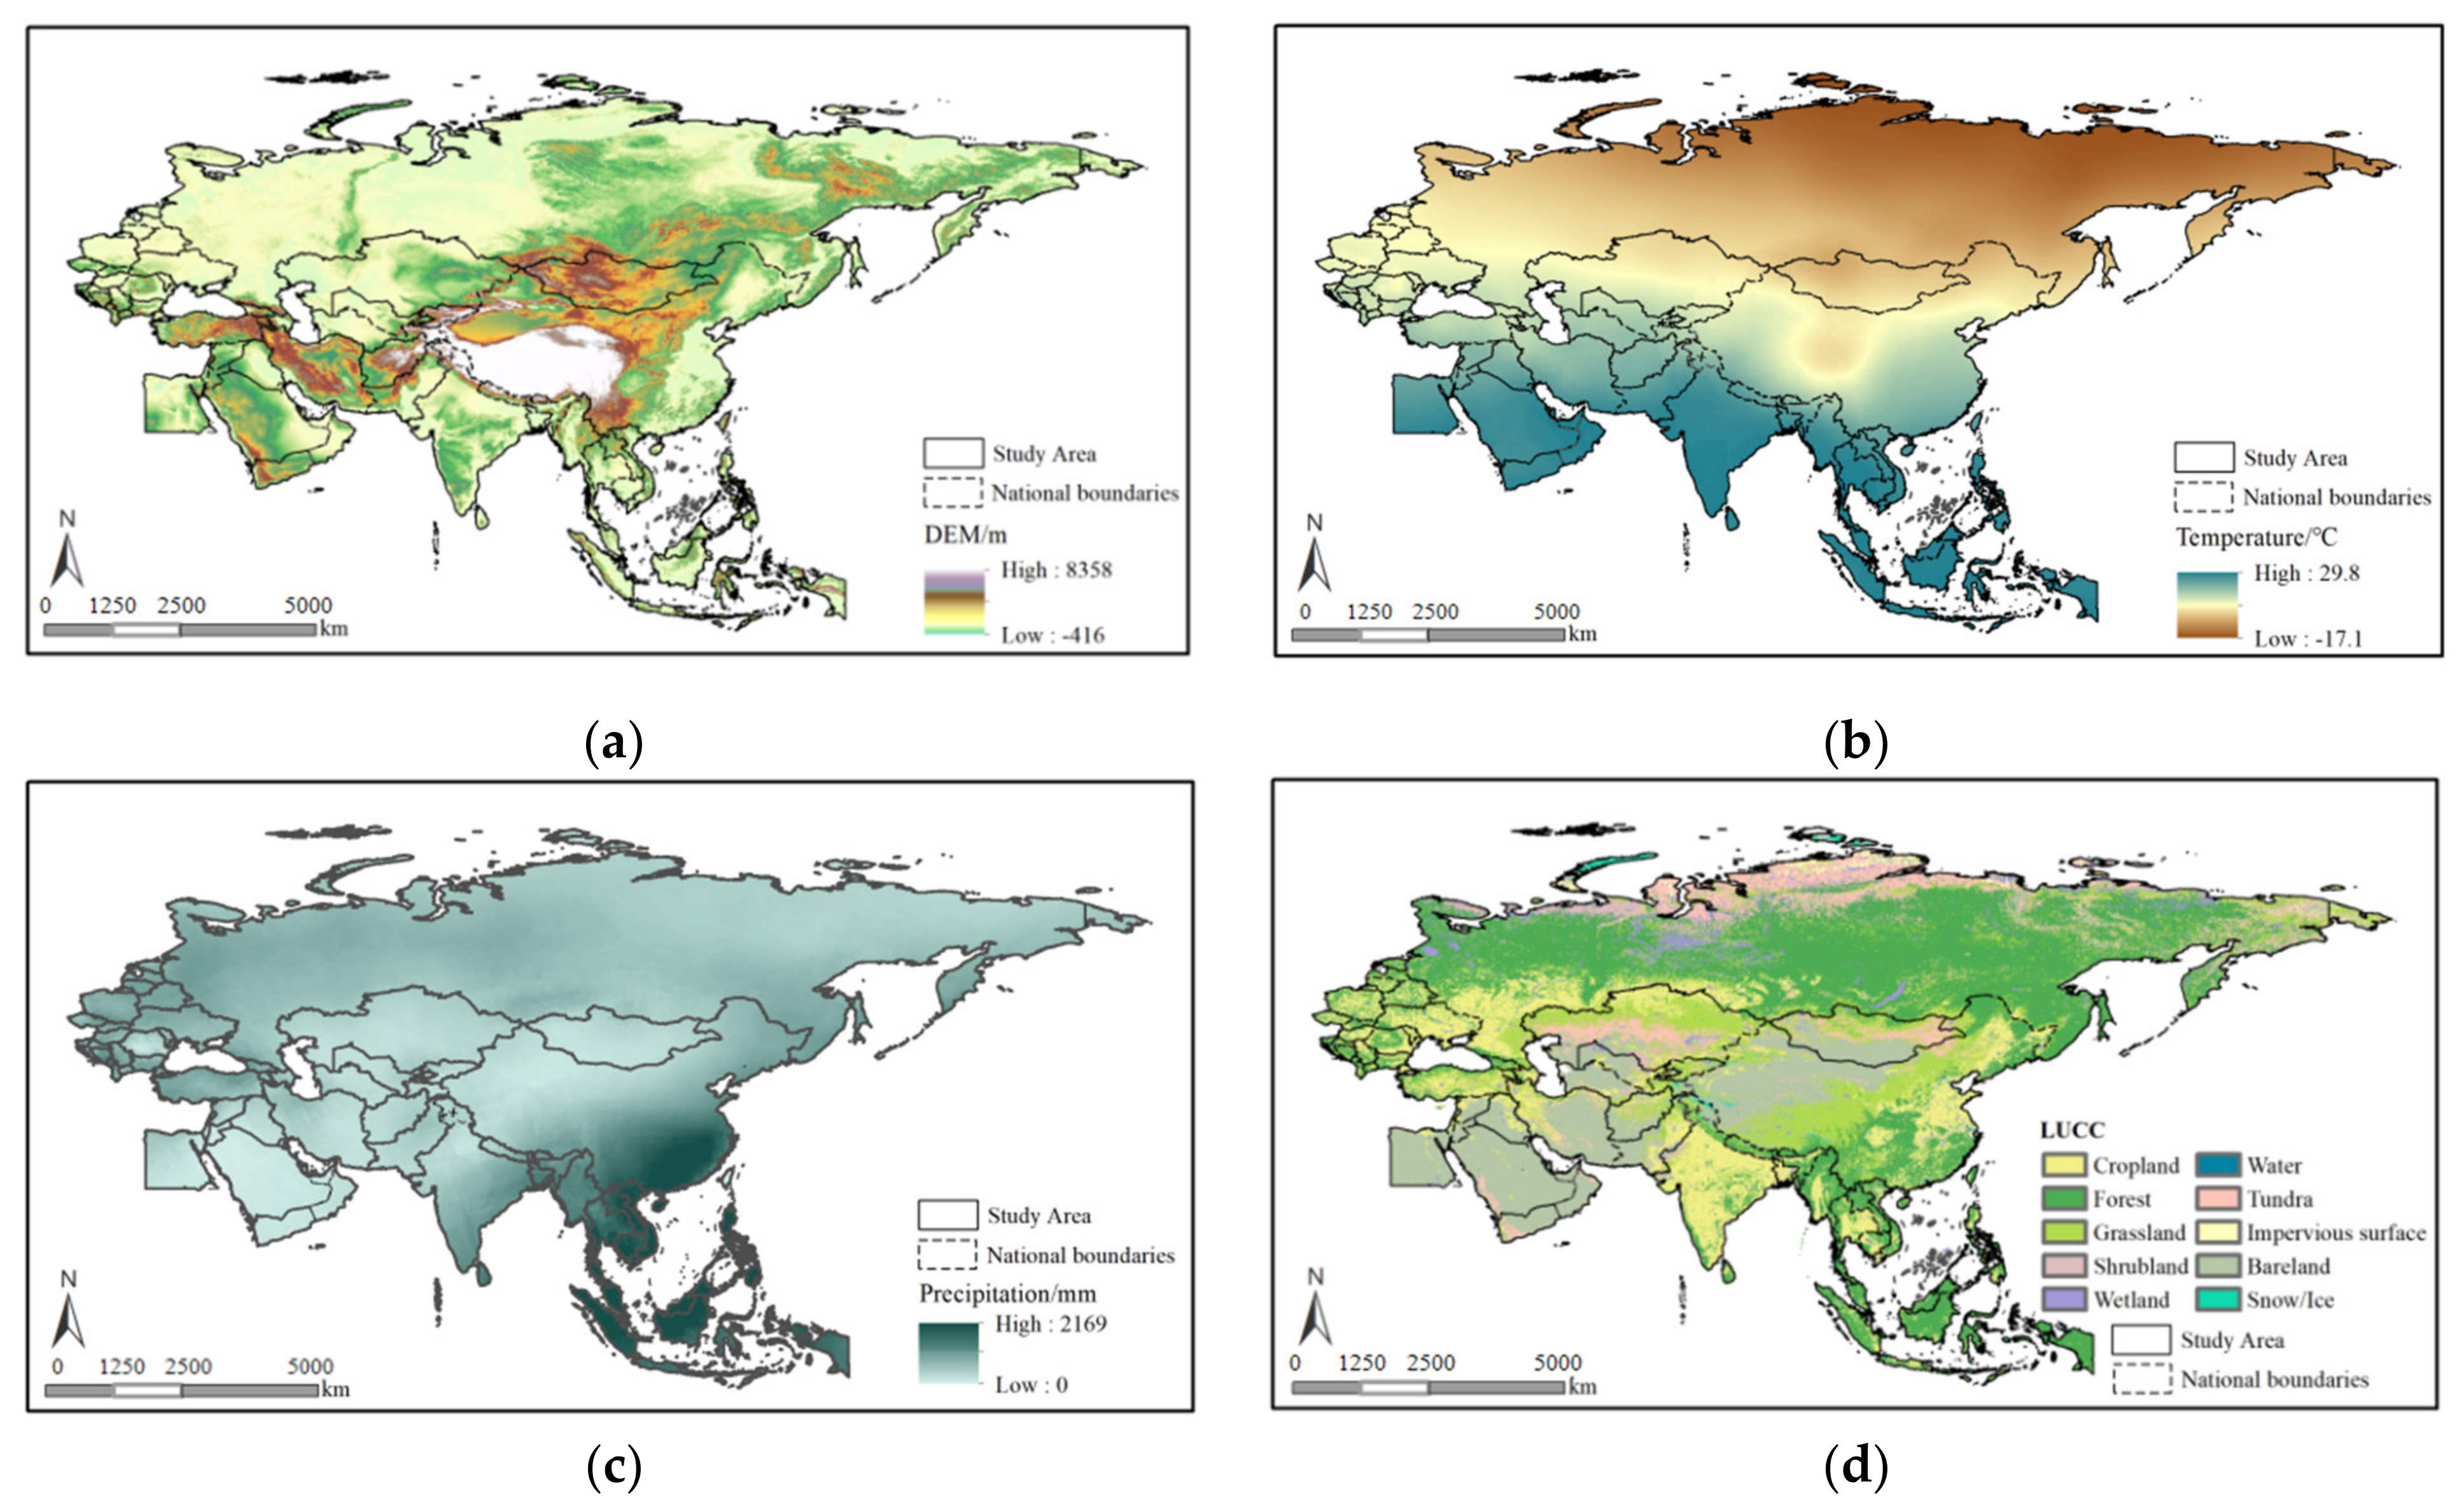
2.1. Materials
2.1.1. Global Digital Elevation Model (GDEM) Data
2.1.2. Monthly Ground Climate Datasets
2.1.3. Land–Surface Water Index and Normalized Difference Vegetation Index
2.1.4. Global Land Cover Data
2.2. Methods
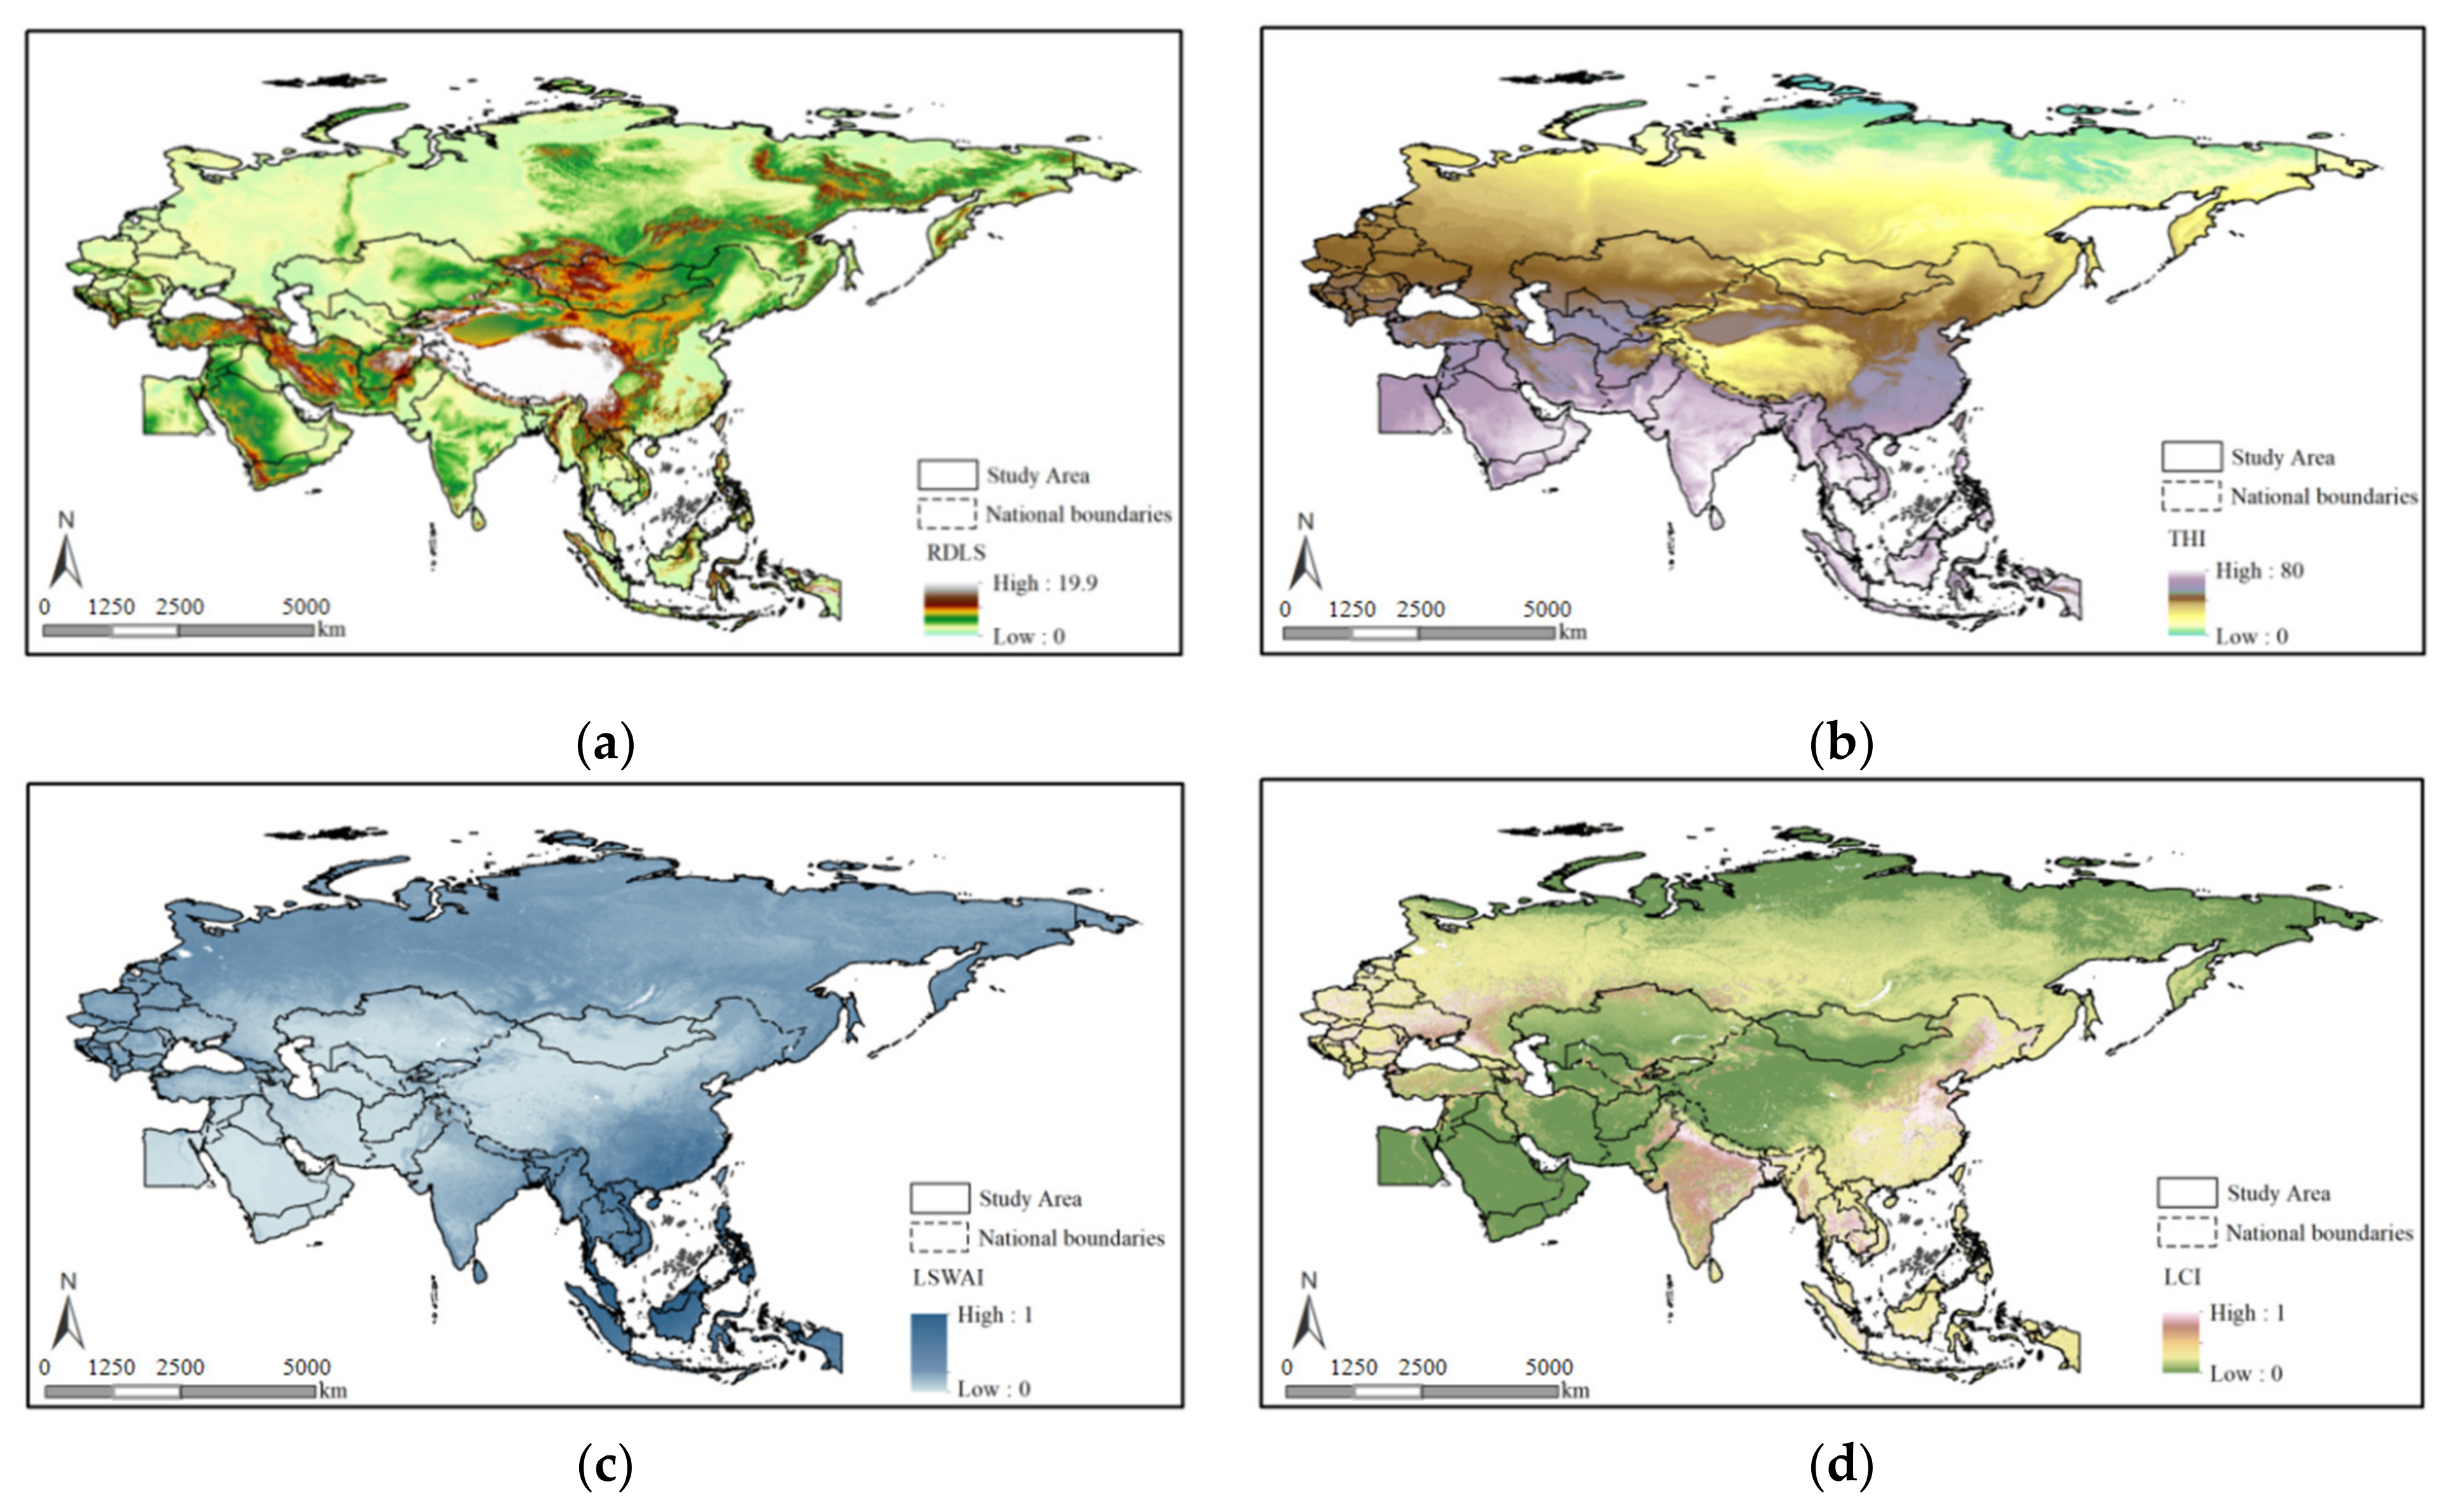
2.2.1. RDLS
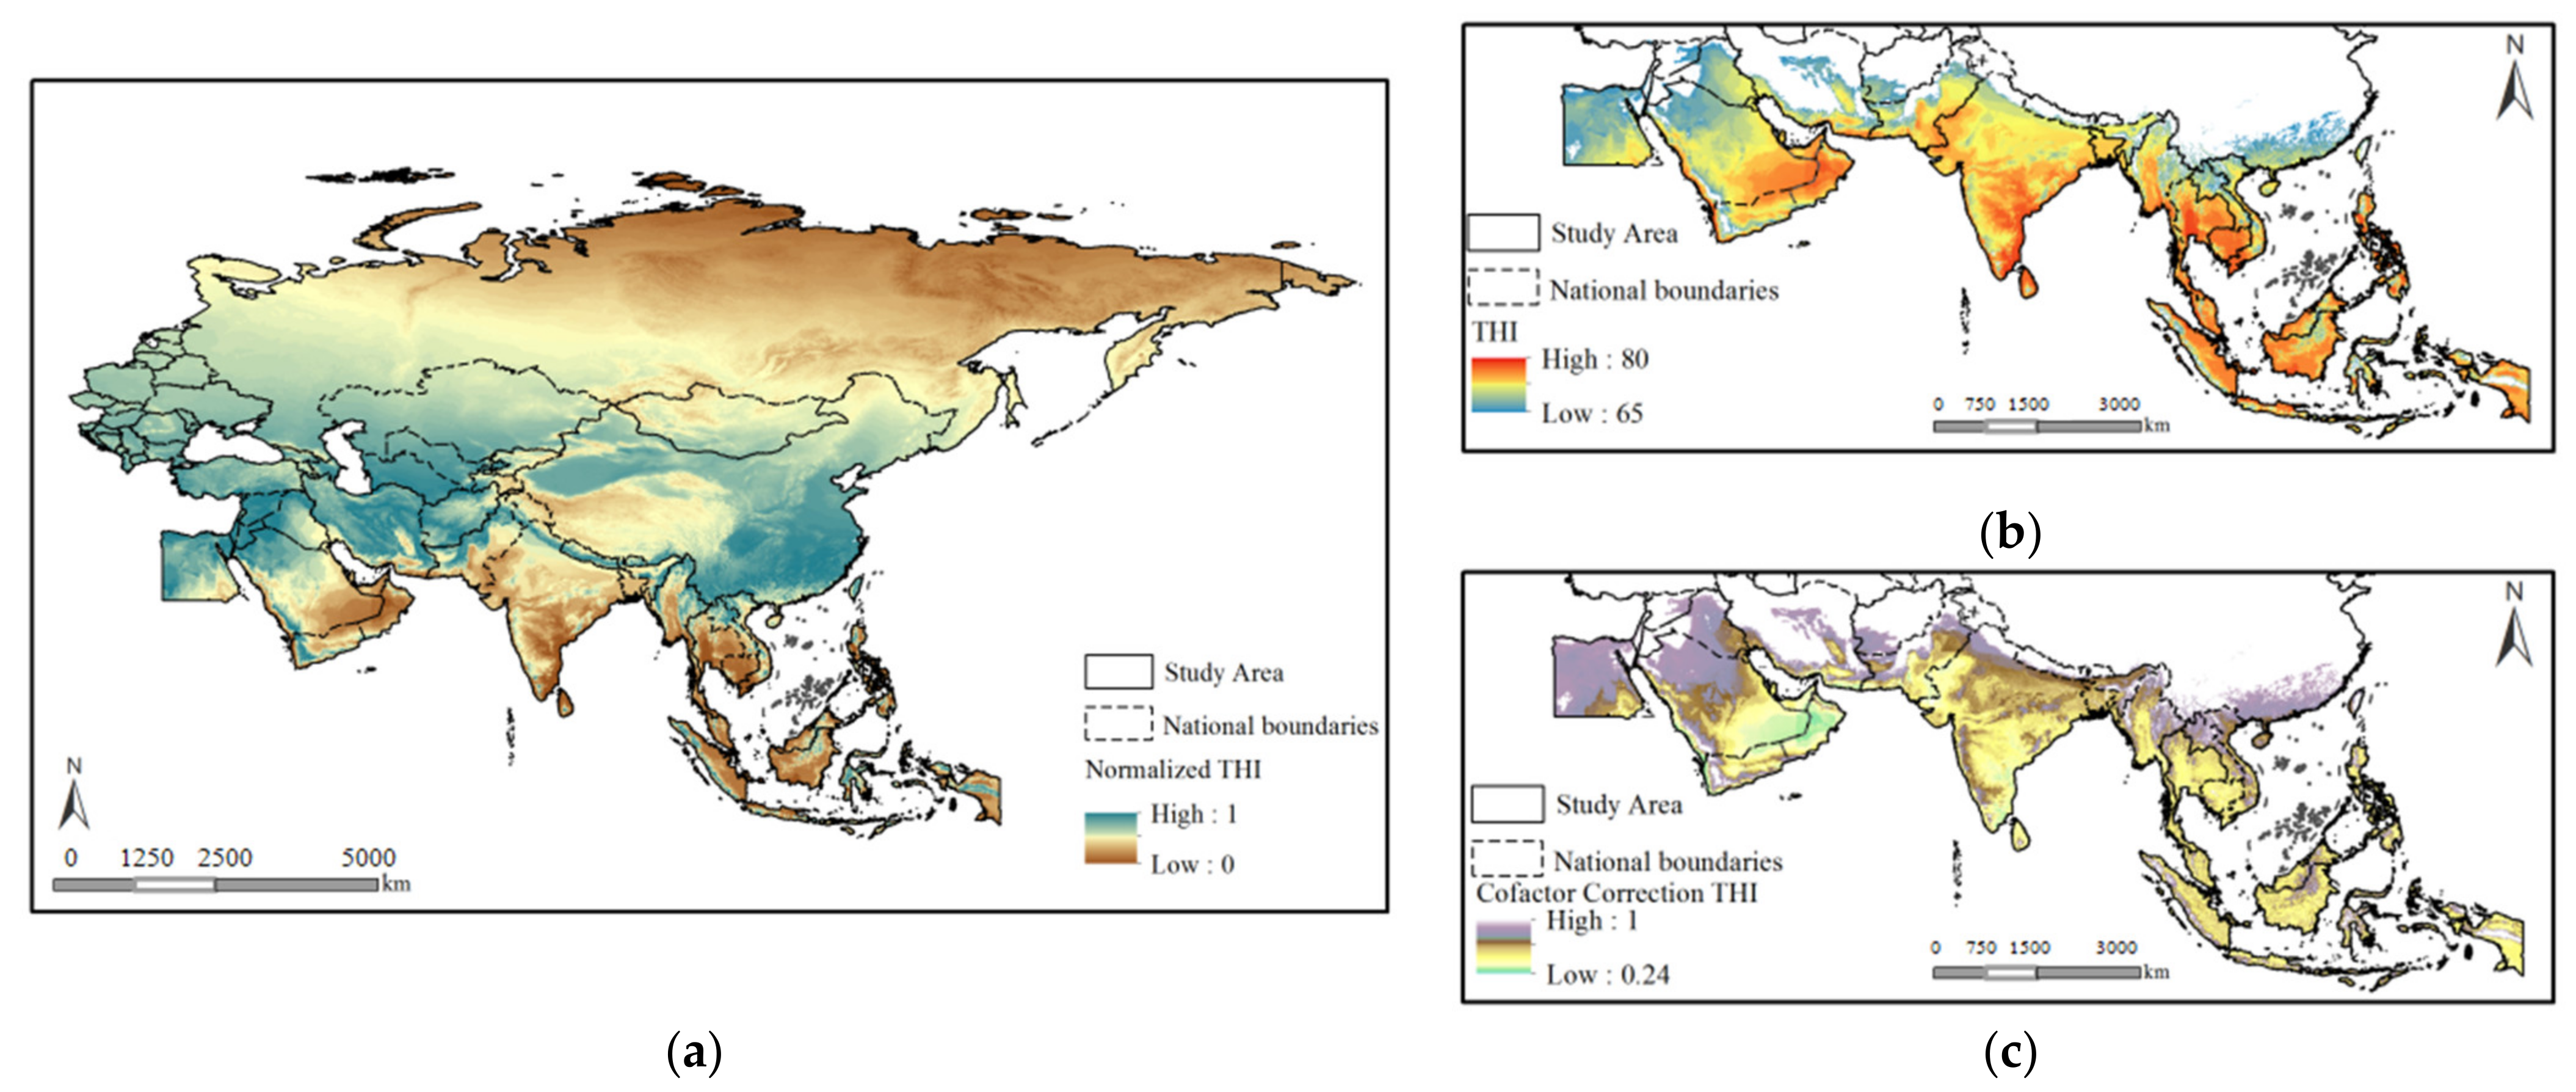
2.2.2. THI
2.2.3. LSWAI
2.2.4. LCI
2.3. Details of the Study Area
3. Results
3.1. Single-Factor Index Analysis and Factor Correlations of Human Settlements
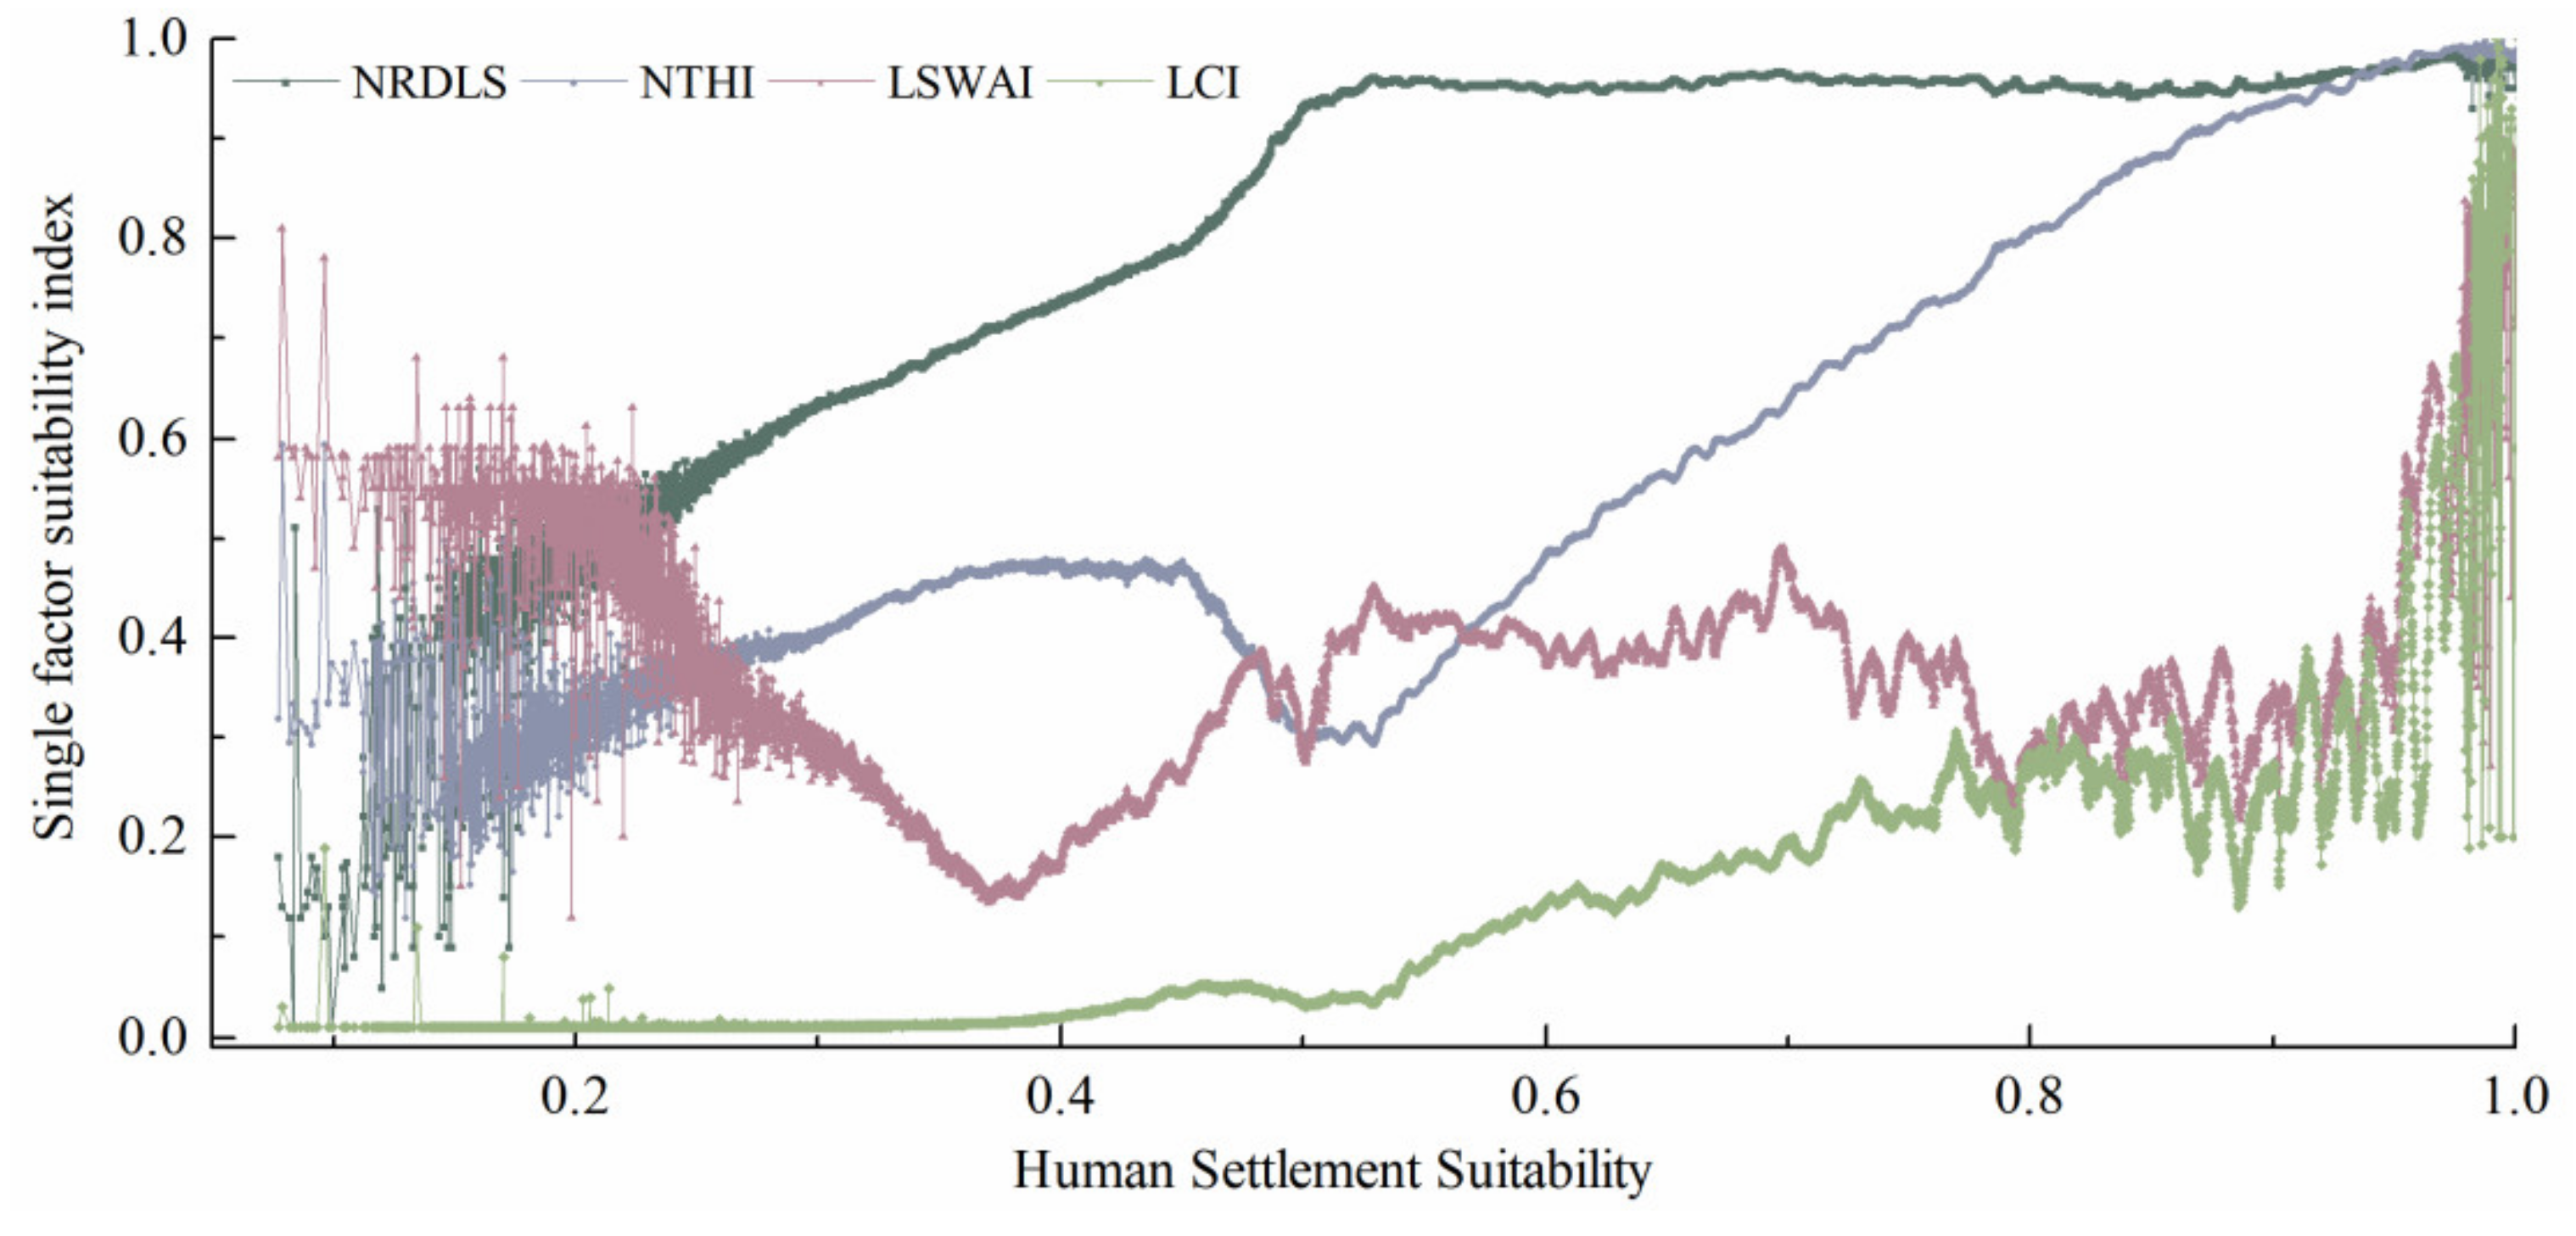
3.1.1. Single-Factor Index Analysis of Human Settlements in the BRI
3.1.2. Correlation Analysis of Single-Factor Suitability Indices in the BRI
3.2. Construction of Comprehensive Evaluation Models for HSS
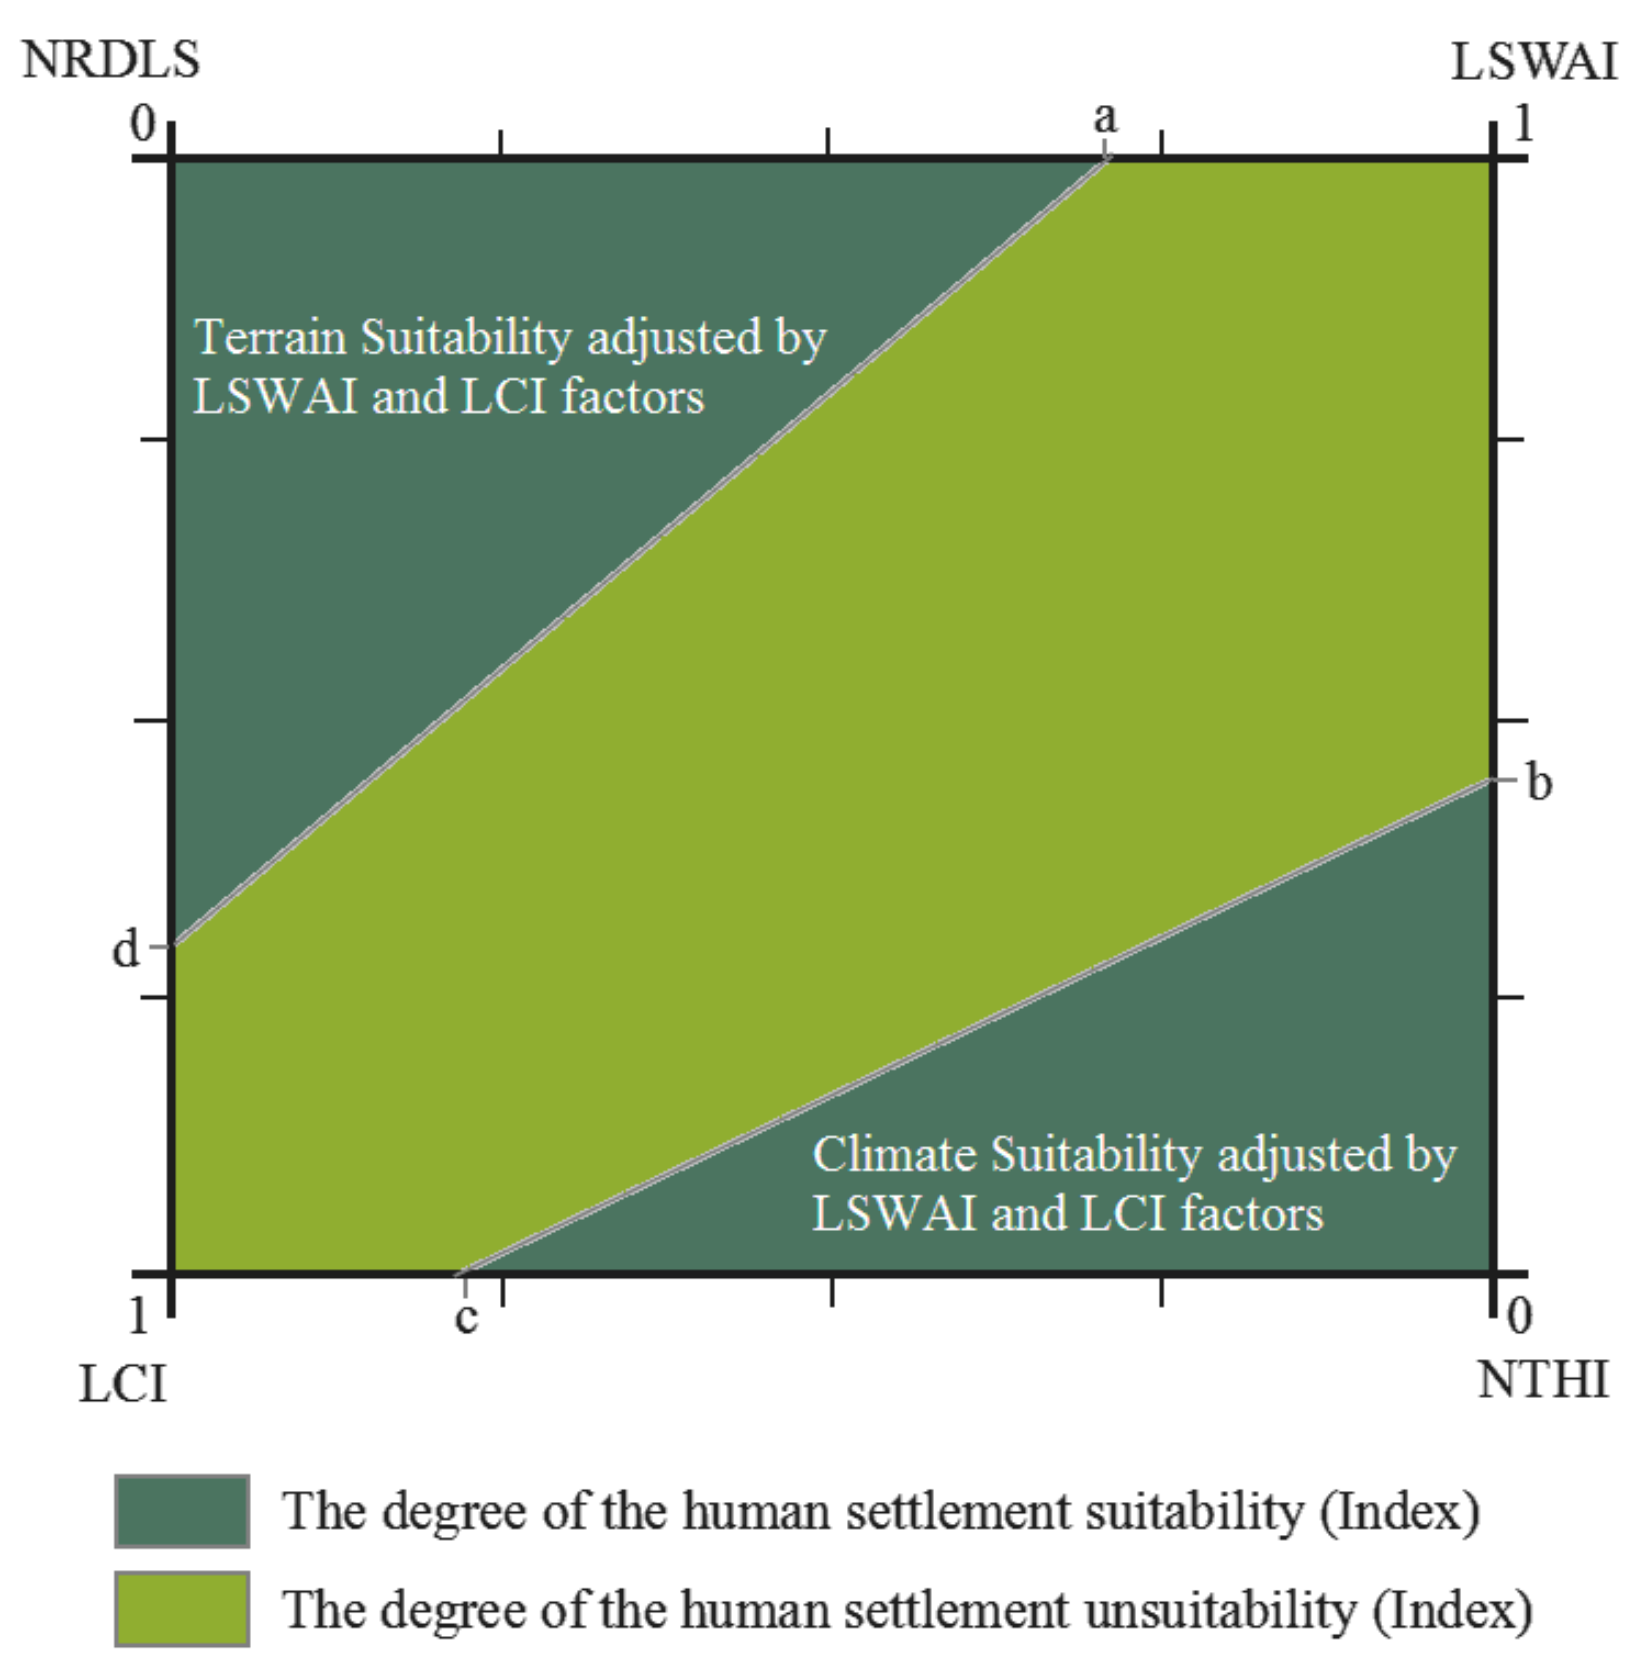
3.2.1. Construction of a Spatial Evaluation Model for HSS in the BRI
3.2.2. Construction of a Comprehensive Evaluation Index Model for HSS in the BRI
- The comprehensive evaluation index model for HSS
- Correction of the single-factor indices
3.3. Comprehensive Evaluation of the HSS in the BRI
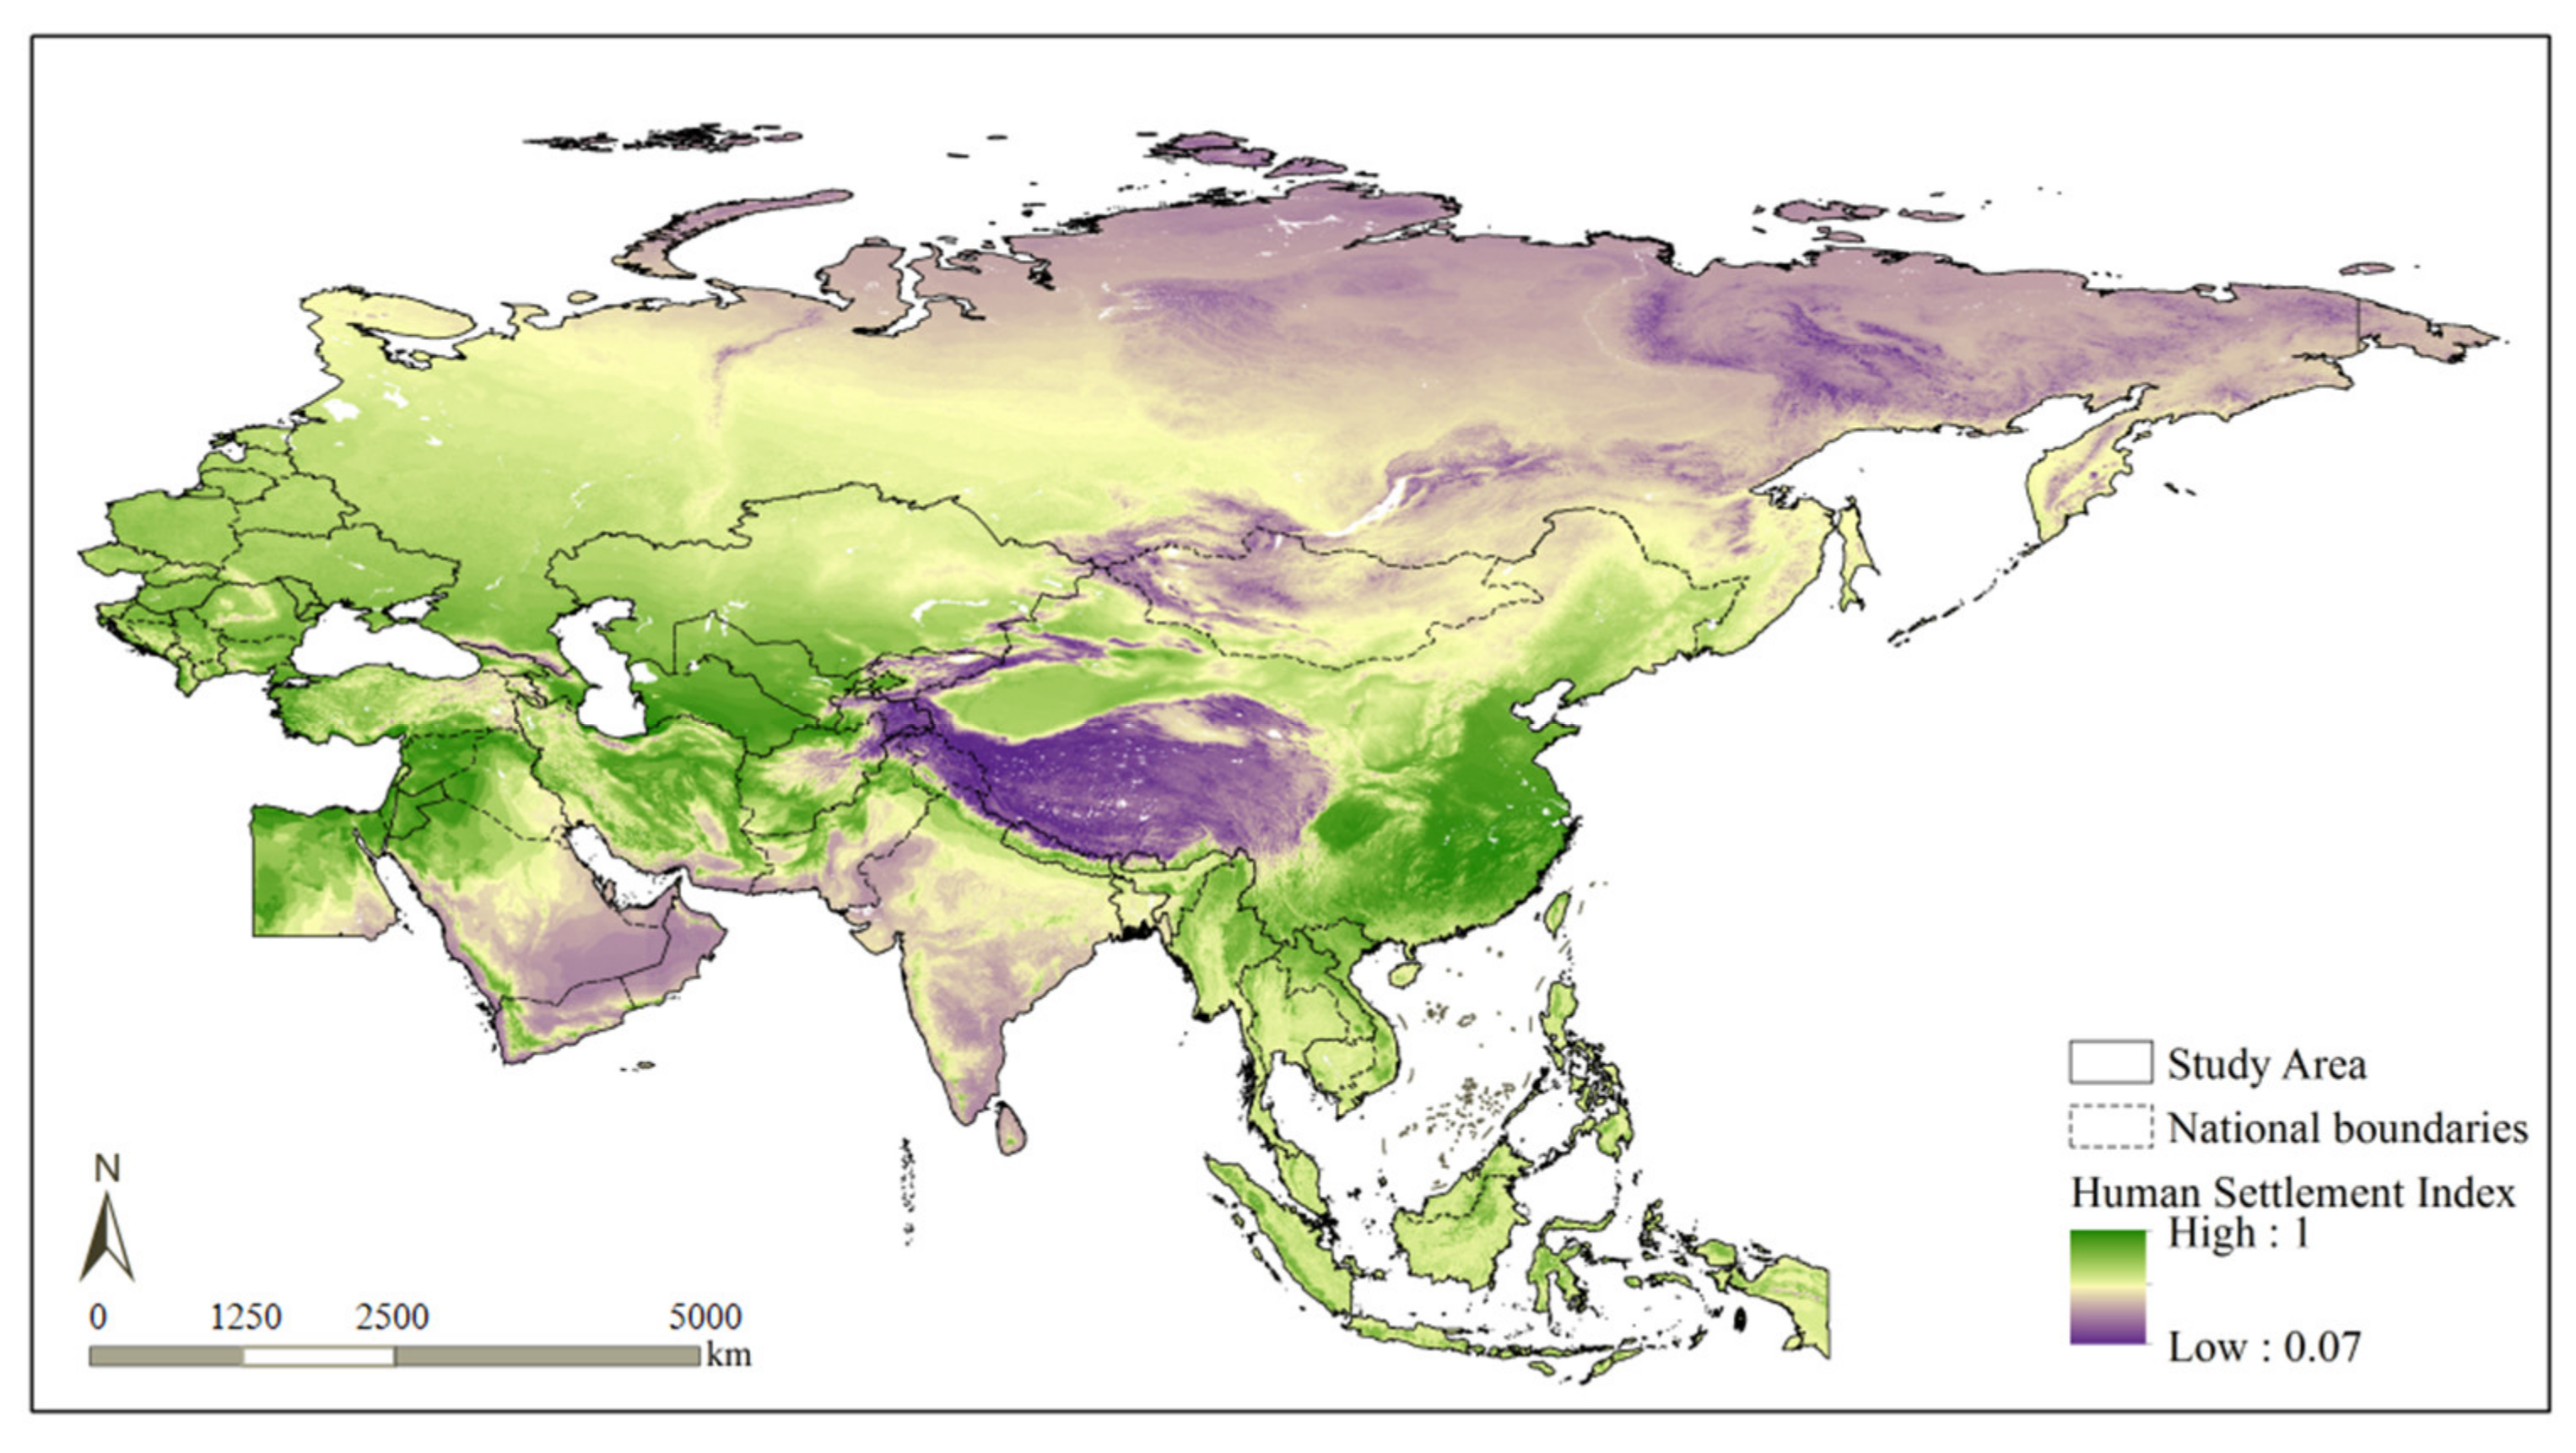
3.3.1. Characteristics of the HSS Index for the BRI Area
3.3.2. Zoning for Suitability Based on HSS in the BRI
4. Discussion
5. Conclusions
Author Contributions
Funding
Institutional Review Board Statement
Informed Consent Statement
Data Availability Statement
Conflicts of Interest
References
- Sami, K. The Interaction of Environment, Space and the Human Being in Rural Alevi Culture—The Case of Two Villages. Bilig 2013, 67, 169–194. [Google Scholar] [CrossRef]
- Song, F.; Yang, X.; Wu, F. Suitable Pattern of the Natural Environment of Human Settlements in the Lower Reaches of the Yangtze River. Atmosphere 2019, 10, 200. [Google Scholar] [CrossRef] [Green Version]
- Wang, Y.; Jin, C.; Lu, M.Q. Assessing the suitability of regional human settlements environment from a different preferences perspective: A case study of Zhejiang Province, China. Habitat Int. 2017, 70, 1–12. [Google Scholar] [CrossRef]
- Feng, Z.M.; Tang, Y.; Yang, Y.Z.; Zhang, D. Relief degree of land surface and its influence on population distribution in China. J. Geogr. Sci. 2008, 18, 237–246. [Google Scholar] [CrossRef]
- Halik, W.; Mamat, A.; Dang, J.H.; Deng, B.S.; Tiyip, T. Suitability analysis of human settlement environment within the Tarim Basin in Northwestern China. Quat. Int. 2013, 311, 175–180. [Google Scholar] [CrossRef]
- Wang, H.f.; Chiou, S.C. Study on the Sustainable Development of Human Settlement Space Environment in Traditional Villages. Sustainability 2019, 11, 4186. [Google Scholar] [CrossRef] [Green Version]
- Du, P.; Xu, M.; Li, R. Impacts of climate change on water resources in the major countries along the Belt and Road. Peerj 2021, 9, e12201. [Google Scholar] [CrossRef]
- Saha, S. The climate risks of China’s Belt and Road Initiative. Bull. Atomic Sci. 2020, 76, 249–255. [Google Scholar] [CrossRef]
- Immerzeel, W.W.; van Beek, L.P.H.; Bierkens, M.F.P. Climate Change Will Affect the Asian Water Towers. Science 2010, 328, 1382–1385. [Google Scholar] [CrossRef]
- Wang, S.; Song, J.; Wang, X.; Yang, W. The Spatial and Temporal Research on the Coupling and Coordinated Relationship between Social Economy and Energy Environment in the Belt and Road Initiatives. Sustainability 2019, 11, 407. [Google Scholar] [CrossRef] [Green Version]
- Li, P.Y.; Qian, H.; Howard, K.W.F.; Wu, J.H. Building a new and sustainable “Silk Road economic belt”. Environ. Earth Sci. 2015, 74, 7267–7270. [Google Scholar] [CrossRef]
- Wang, P.Y.; Qin, X.F.; Li, Y.R. Satisfaction Evaluation of Rural Human Settlements in Northwest China: Method and Application. Land 2021, 10, 813. [Google Scholar] [CrossRef]
- Zhang, D.W.; WU, L.L.; Huang, S.Q.; Zhang, Z.Y.; Ahmad, F.; Zhang, G.L.; Shi, N.; Xu, H. Ecology and environment of the Belt and Road under global climate change: A systematic review of spatial patterns, cost efficiency, and ecological footprints. Ecol. Indic. 2021, 131, 108237. [Google Scholar] [CrossRef]
- Zhao, S.; Yan, Y.; Han, J. Industrial Land Change in Chinese Silk Road Cities and Its Influence on Environments. Land 2021, 10, 806. [Google Scholar] [CrossRef]
- You, Z.; Feng, Z.M.; Yang, Y.Z.; Shi, H.; Li, P. Evaluation of human settlement environmental suitability in Tibet based on gridded data. Resour. Sci. 2020, 42, 394–406. [Google Scholar] [CrossRef]
- Feng, Z.M.; Tang, Y.; Yang, Y.Z.; Zhang, D. Establishment and Application of Human Settlements Environment Index Model (HEI) Based on GIS. Acta Geogr. Sin. 2008, 63, 1327–1336. [Google Scholar]
- Ding, Y.P.; Shi, B.; Su, G.J.; Li, Q.Q.; Meng, J.; Jiang, Y.J.; Qin, Y.; Dai, L.W.; Song, S. Assessing Suitability of Human Settlements in High-Altitude Area Using a Comprehensive Index Method: A Case Study of Tibet, China. Sustainability 2021, 13, 1485. [Google Scholar] [CrossRef]
- Zhou, J.X.; Lin, L.; Li, H.; Pei, D.M. Evaluation and analysis on suitability of human settlement environment in Qingdao. PLoS ONE 2021, 16, e0256502. [Google Scholar]
- Qing, W.; Wang, X.M. The New Perspective of Research on Settlement Patterns in China Cities-Environment-behavior Studies. In Proceedings of the International Conference on Civil Engineering and Building Materials (CEBM), Kunming, China, 18 June 2011. [Google Scholar]
- Ascensao, F.; Fahrig, L.; Clevenger, A.P.; Corlett, R.T.; Jaeger, J.A.G.; Laurance, W.F.; Pereira, H.M. Environmental challenges for the belt and road initiative. Nat. Sustain. 2018, 1, 206–209. [Google Scholar] [CrossRef]
- Naversnik, K.; Jurecic, R. Humidity-corrected Arrhenius equation: The reference condition approach. Int. J. Pharm. 2016, 500, 360–365. [Google Scholar] [CrossRef]
- Sattar, A.; Hussain, M.N.; Ilyas, M. An Impact Evaluation of Belt and Road Initiative (BRI) on Environmental Degradation. Sage Open 2022, 12, 1–19. [Google Scholar] [CrossRef]
- Zhang, J.L.; Lei, Y.L. Research on Low-Carbon Development Ecological Efficiency and its Spatial Correlation for Countries along the “One Belt and Road”. Ekoloji 2019, 28, 1155–1164. [Google Scholar]
- Li, S.Z.; Suo, Y.H.; Li, R.X.; Yu, S.Y.; Yang, G.X.; Somerville, I. Tianshan Orogen along the Silk Road (Volume 3): Orogen links, geochemistry, geochronology, mineral deposits, and environments. Geol. J. 2018, 53, 3–7. [Google Scholar] [CrossRef]
- Zhang, C.L.; Chen, S.F.; Qiao, H.J.; Dong, L.H.; Huang, Z.; Ou, C.Q. Small hydropower sustainability evaluation for the countries along the Belt and Road. Environ. Dev. 2020, 34, 100528. [Google Scholar] [CrossRef]
- Ariken, M.; Zhang, F.; Chan, N.W.; Kung, H.T. Coupling coordination analysis and spatio-temporal heterogeneity between urbanization and eco-environment along the silk road economic belt in China. Ecol. Indic. 2021, 121, 107191. [Google Scholar] [CrossRef]
- Li, S.Z.; Suo, Y.H.; Li, R.X.; Yu, S.Y.; Yang, G.X.; Somerville, I. Central China Orogen along the Silk Road (Part 2): Mineral deposits, hydrocarbons, geohazards, and environments. Geol. J. 2018, 53, 4–7. [Google Scholar] [CrossRef]
- Huang, J.H.; Li, F. Coupling Coordination Degree Measurement and Spatial Distribution between Economic Development and Ecological Environment of Countries along the Belt and Road. Polish J. Environ. Stud. 2021, 30, 3615–3626. [Google Scholar] [CrossRef]
- Wang, M.; Yan, J.S.; Wang, R.S. Ecological engineering for water in sustainable settlements construction. Int. J. Sustain. Dev. World Ecol. 2007, 14, 556–564. [Google Scholar]
- Esch, T.; Heldens, W.; Hirner, A.; Keil, M.; Marconcini, M.; Roth, A. Breaking new ground in mapping human settlements from space—The global urban footprint. ISPRS J. Photogramm. Remote Sens. 2017, 134, 30–42. [Google Scholar] [CrossRef] [Green Version]
- Mcbean, G.; Ajibade, I. Climate change, related hazards and human settlements. Curr. Opin. Environ. Sustain. 2009, 2, 179–186. [Google Scholar] [CrossRef]


| (a) | |||||
| Terrain Suitability | RDLS | Normalized RDLS (NRDLS) | Altitude | Relative Height Difference | Landform |
| Highly suitable | 0~0.2 | 0.97~1 | <120 | <50 | Plains |
| Moderately suitable | 0.2~0.4 | 0.96~0.97 | 120~180 | 40~110 | Hills |
| Generally suitable | 0.4~1.3 | 0.92~0.96 | 180~530 | 110~395 | Mountains |
| Critically suitable | 1.3~4.2 | 0.77~0.92 | 530~3500 | 37~535 | Mountains and plateaus |
| Unsuitable | 4.2~6.5 | 0.66~0.77 | 3500~5300 | 219~620 | High mountains |
| Uninhabited | >6.5 | <0.66 | >5300 | >620 | Extremely high mountains |
| (b) | |||||
| Climatic Suitability | THI | Somatic Sensation | |||
| Highly suitable | 60~70 | Warm and cool, and very comfortable | |||
| Moderately suitable | 50~60 | Fresh and comfortable | |||
| Generally suitable | 45~50, 70~75 | Relatively cold (hot) and relatively comfortable | |||
| Critically suitable | 40~45, 75~80 | Cold (hot and humid) and uncomfortable | |||
| Unsuitable | 30~40, >80 | Cold (extremely hot and humid) and uncomfortable | |||
| Uninhabited | <30 | Extremely cold and extremely uncomfortable | |||
| Correlation Coefficient | RDLS | THI | LSWAI | LCI |
|---|---|---|---|---|
| RDLS | 0.155 | 0.186 | 0.244 | |
| THI | 0.422 | 0.657 | ||
| LSWAI | 0.047 | |||
| Extremely strongly correlated | Strongly correlated | Moderately correlated | Weakly correlated | Extremely weakly correlated |
| 0.8–1.0 | 0.6–0.8 | 0.4–0.6 | 0.2–0.4 | 0.0–0.2 |
| Threshold Determination | HSS | NRDLS | NTHI | LSWAI | LCI | Physical Meaning |
|---|---|---|---|---|---|---|
| Limited by the NRDLS and NTHI | 0.35 | 0.68 | 0.45 | 0.20 | 0.01 | Extremely high mountains, cold, lack of surface water, and low surface coverage |
| 0.41 | 0.75 | 0.47 | 0.21 | 0.03 | Plateaus, cold, lack of surface water, and low surface coverage | |
| 0.45 | 0.79 | 0.47 | 0.26 | 0.05 | Mountains, cold, lack of surface water, and low surface coverage | |
| Limited by the NRDLS or NTHI | 0.61 | 0.95 | 0.50 | 0.37 | 0.14 | Hills, cold, lack of surface water, and relatively low surface coverage |
| Gradual increase in the NRDLS or NTHI | 0.70 | 0.96 | 0.64 | 0.47 | 0.19 | Plains and hills, cold (hot and humid), relatively abundant surface water, and relatively low surface coverage |
| Gradual increase in the NRDLS or NTHI | 0.74 | 0.96 | 0.71 | 0.33 | 0.21 | Plains and hills, relatively cold (hot), relatively abundant surface water, and relatively high surface coverage |
| Gradual increase in the NRDLS or NTHI | 0.78 | 0.95 | 0.78 | 0.29 | 0.25 | Plains and hills, cool, relatively abundant surface water, and relatively high surface coverage |
| Two factors are suitable, as well improved by the NRDLS and NTHI | 0.88 | 0.95 | 0.92 | 0.37 | 0.23 | Plains and hills, warm, relatively abundant surface water, and relatively high surface coverage |
| 0.97 | 0.98 | 0.99 | 0.56 | 0.48 | Plains, warm, abundant surface water, and high surface coverage | |
| Single-factor suitability level | Unsuitable | Critically suitable | Generally suitable | Moderately suitable | Highly suitable |
Publisher’s Note: MDPI stays neutral with regard to jurisdictional claims in published maps and institutional affiliations. |
© 2022 by the authors. Licensee MDPI, Basel, Switzerland. This article is an open access article distributed under the terms and conditions of the Creative Commons Attribution (CC BY) license (https://creativecommons.org/licenses/by/4.0/).
Share and Cite
Li, W.; Li, P.; Feng, Z.; Xiao, C. GIS-Based Modeling of Human Settlement Suitability for the Belt and Road Regions. Int. J. Environ. Res. Public Health 2022, 19, 6044. https://doi.org/10.3390/ijerph19106044
Li W, Li P, Feng Z, Xiao C. GIS-Based Modeling of Human Settlement Suitability for the Belt and Road Regions. International Journal of Environmental Research and Public Health. 2022; 19(10):6044. https://doi.org/10.3390/ijerph19106044
Chicago/Turabian StyleLi, Wenjun, Peng Li, Zhiming Feng, and Chiwei Xiao. 2022. "GIS-Based Modeling of Human Settlement Suitability for the Belt and Road Regions" International Journal of Environmental Research and Public Health 19, no. 10: 6044. https://doi.org/10.3390/ijerph19106044
APA StyleLi, W., Li, P., Feng, Z., & Xiao, C. (2022). GIS-Based Modeling of Human Settlement Suitability for the Belt and Road Regions. International Journal of Environmental Research and Public Health, 19(10), 6044. https://doi.org/10.3390/ijerph19106044