
Short-Term Joint Effects of PM10, NO2 and SO2 on Cardio-Respiratory Disease Hospital Admissions in Cape Town, South Africa

 , ,
, ,  ,
,
Abstract
:1. Introduction
2. Methods
2.1. Study Area
2.2. Hospital Admission Data
2.3. Air Pollution Data
2.4. Meteorological Data
2.5. Statistical Analysis
3. Results
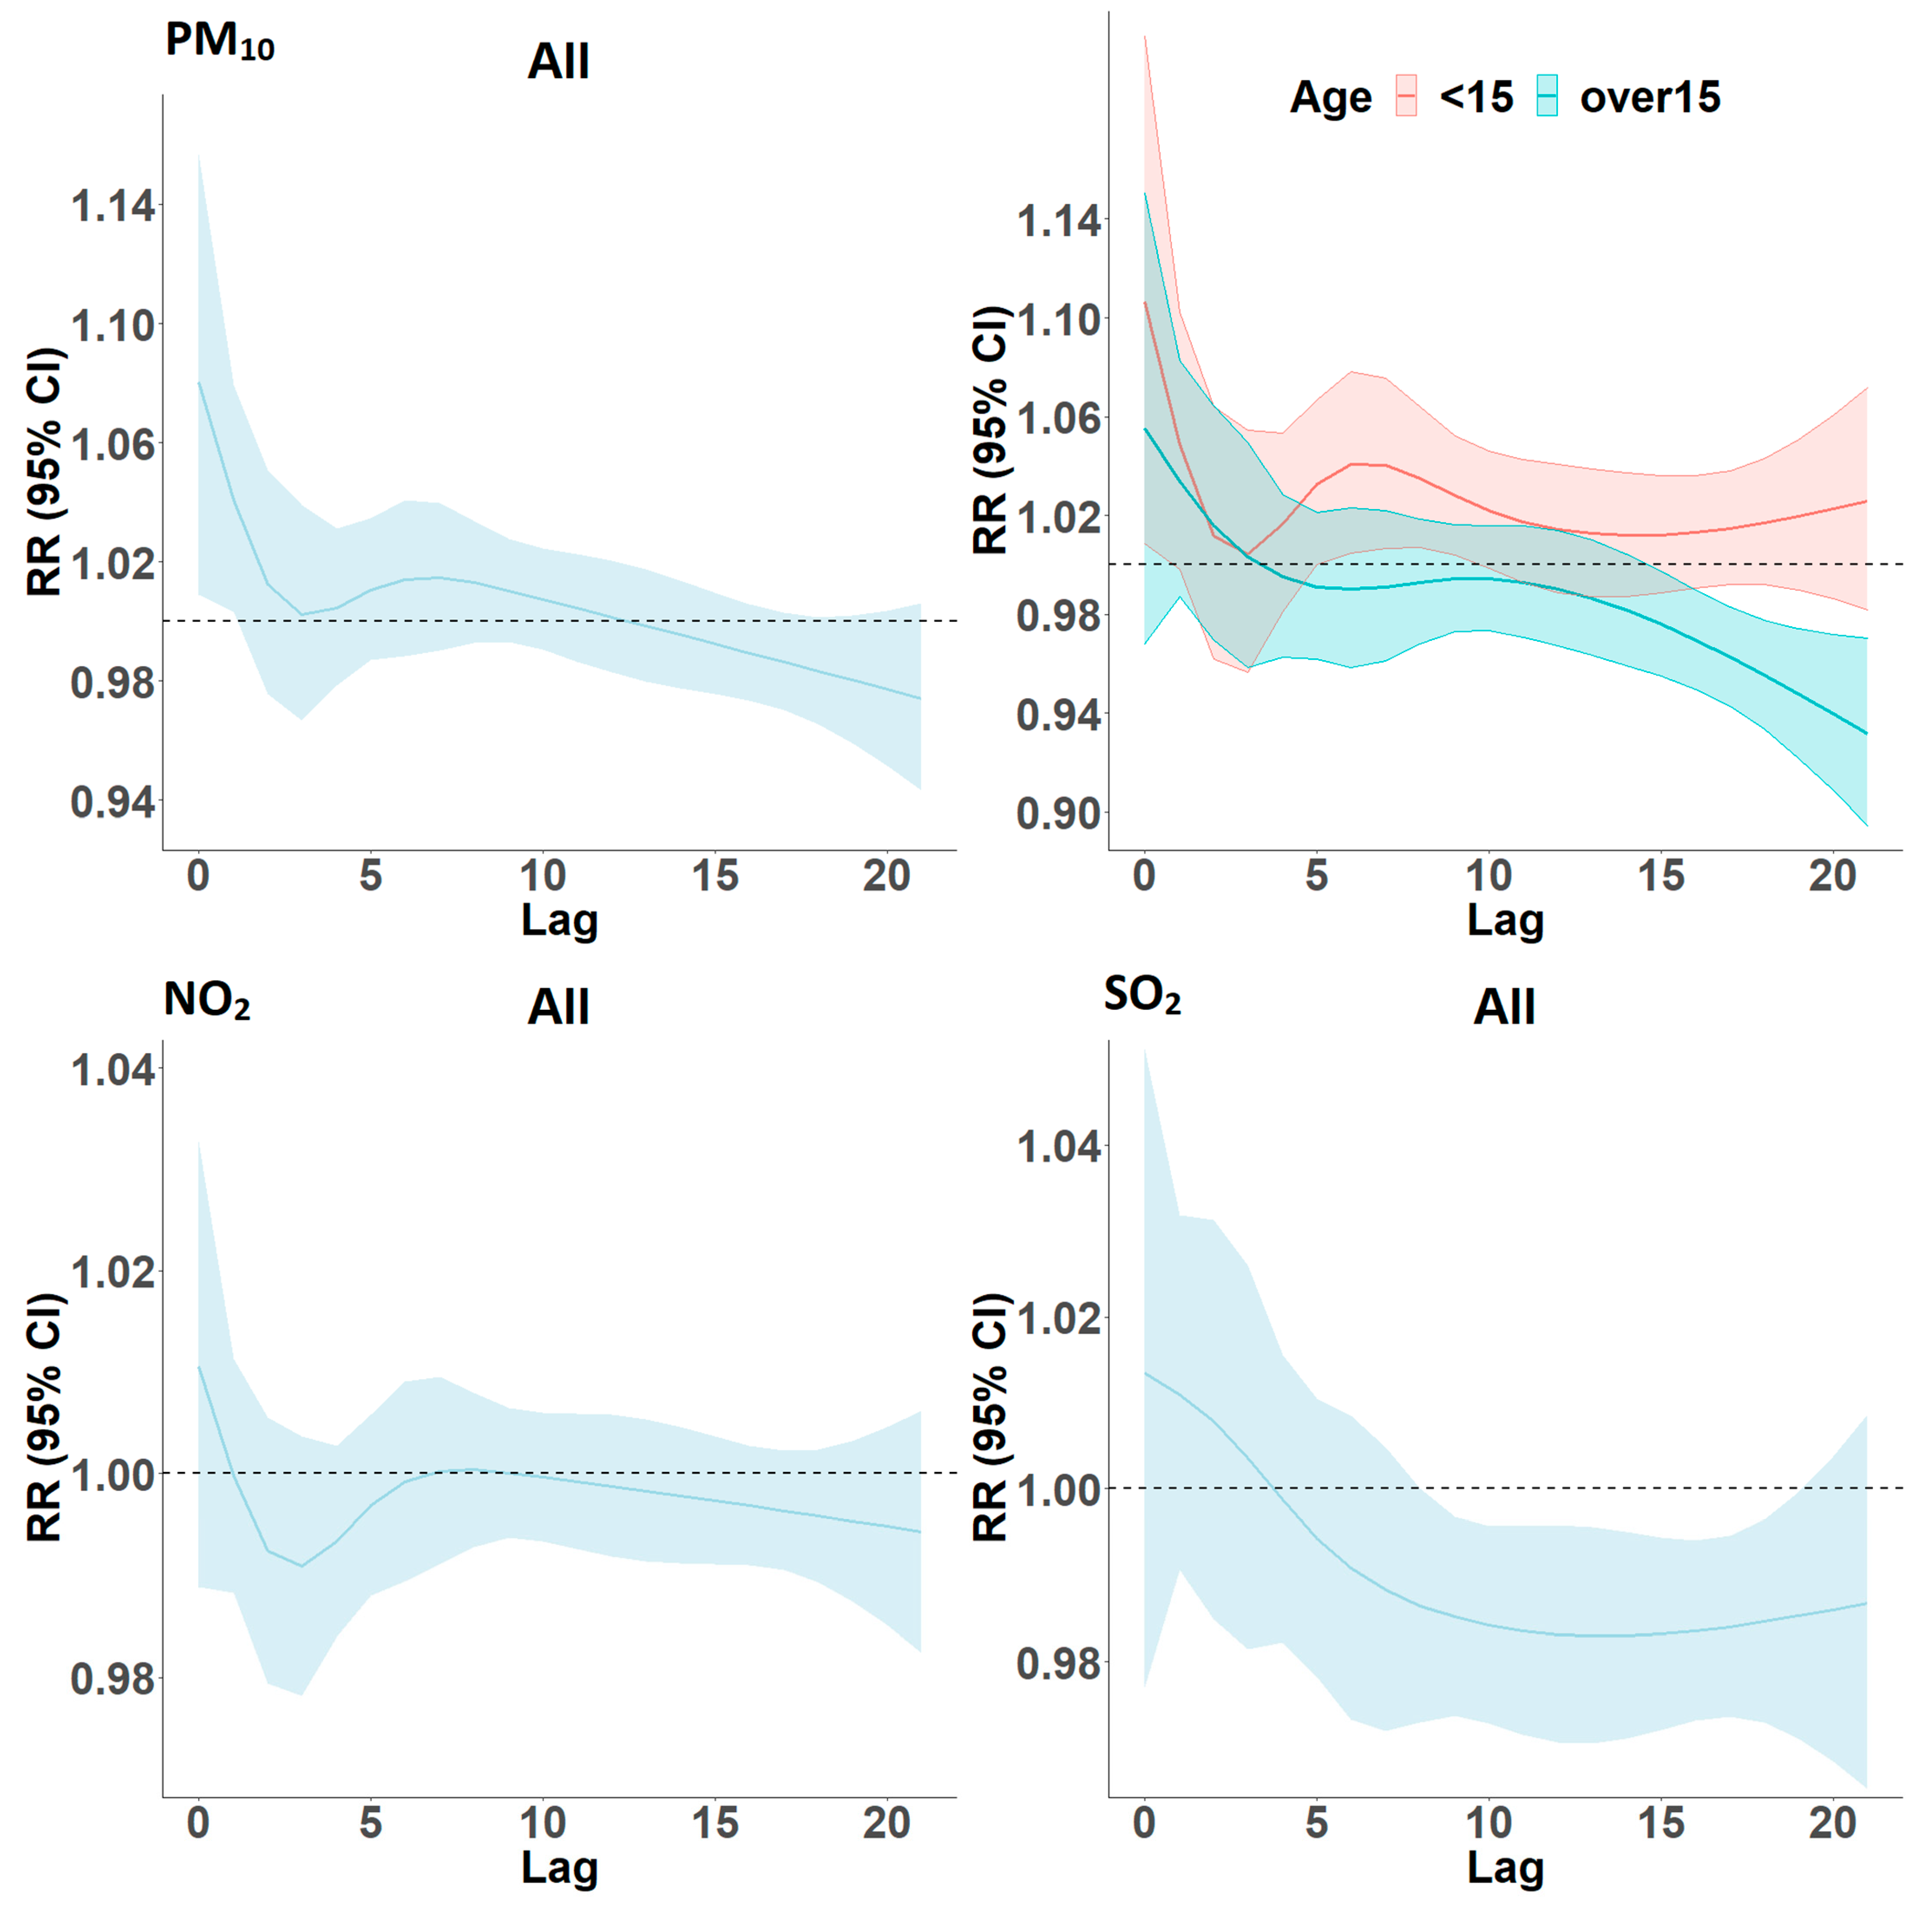
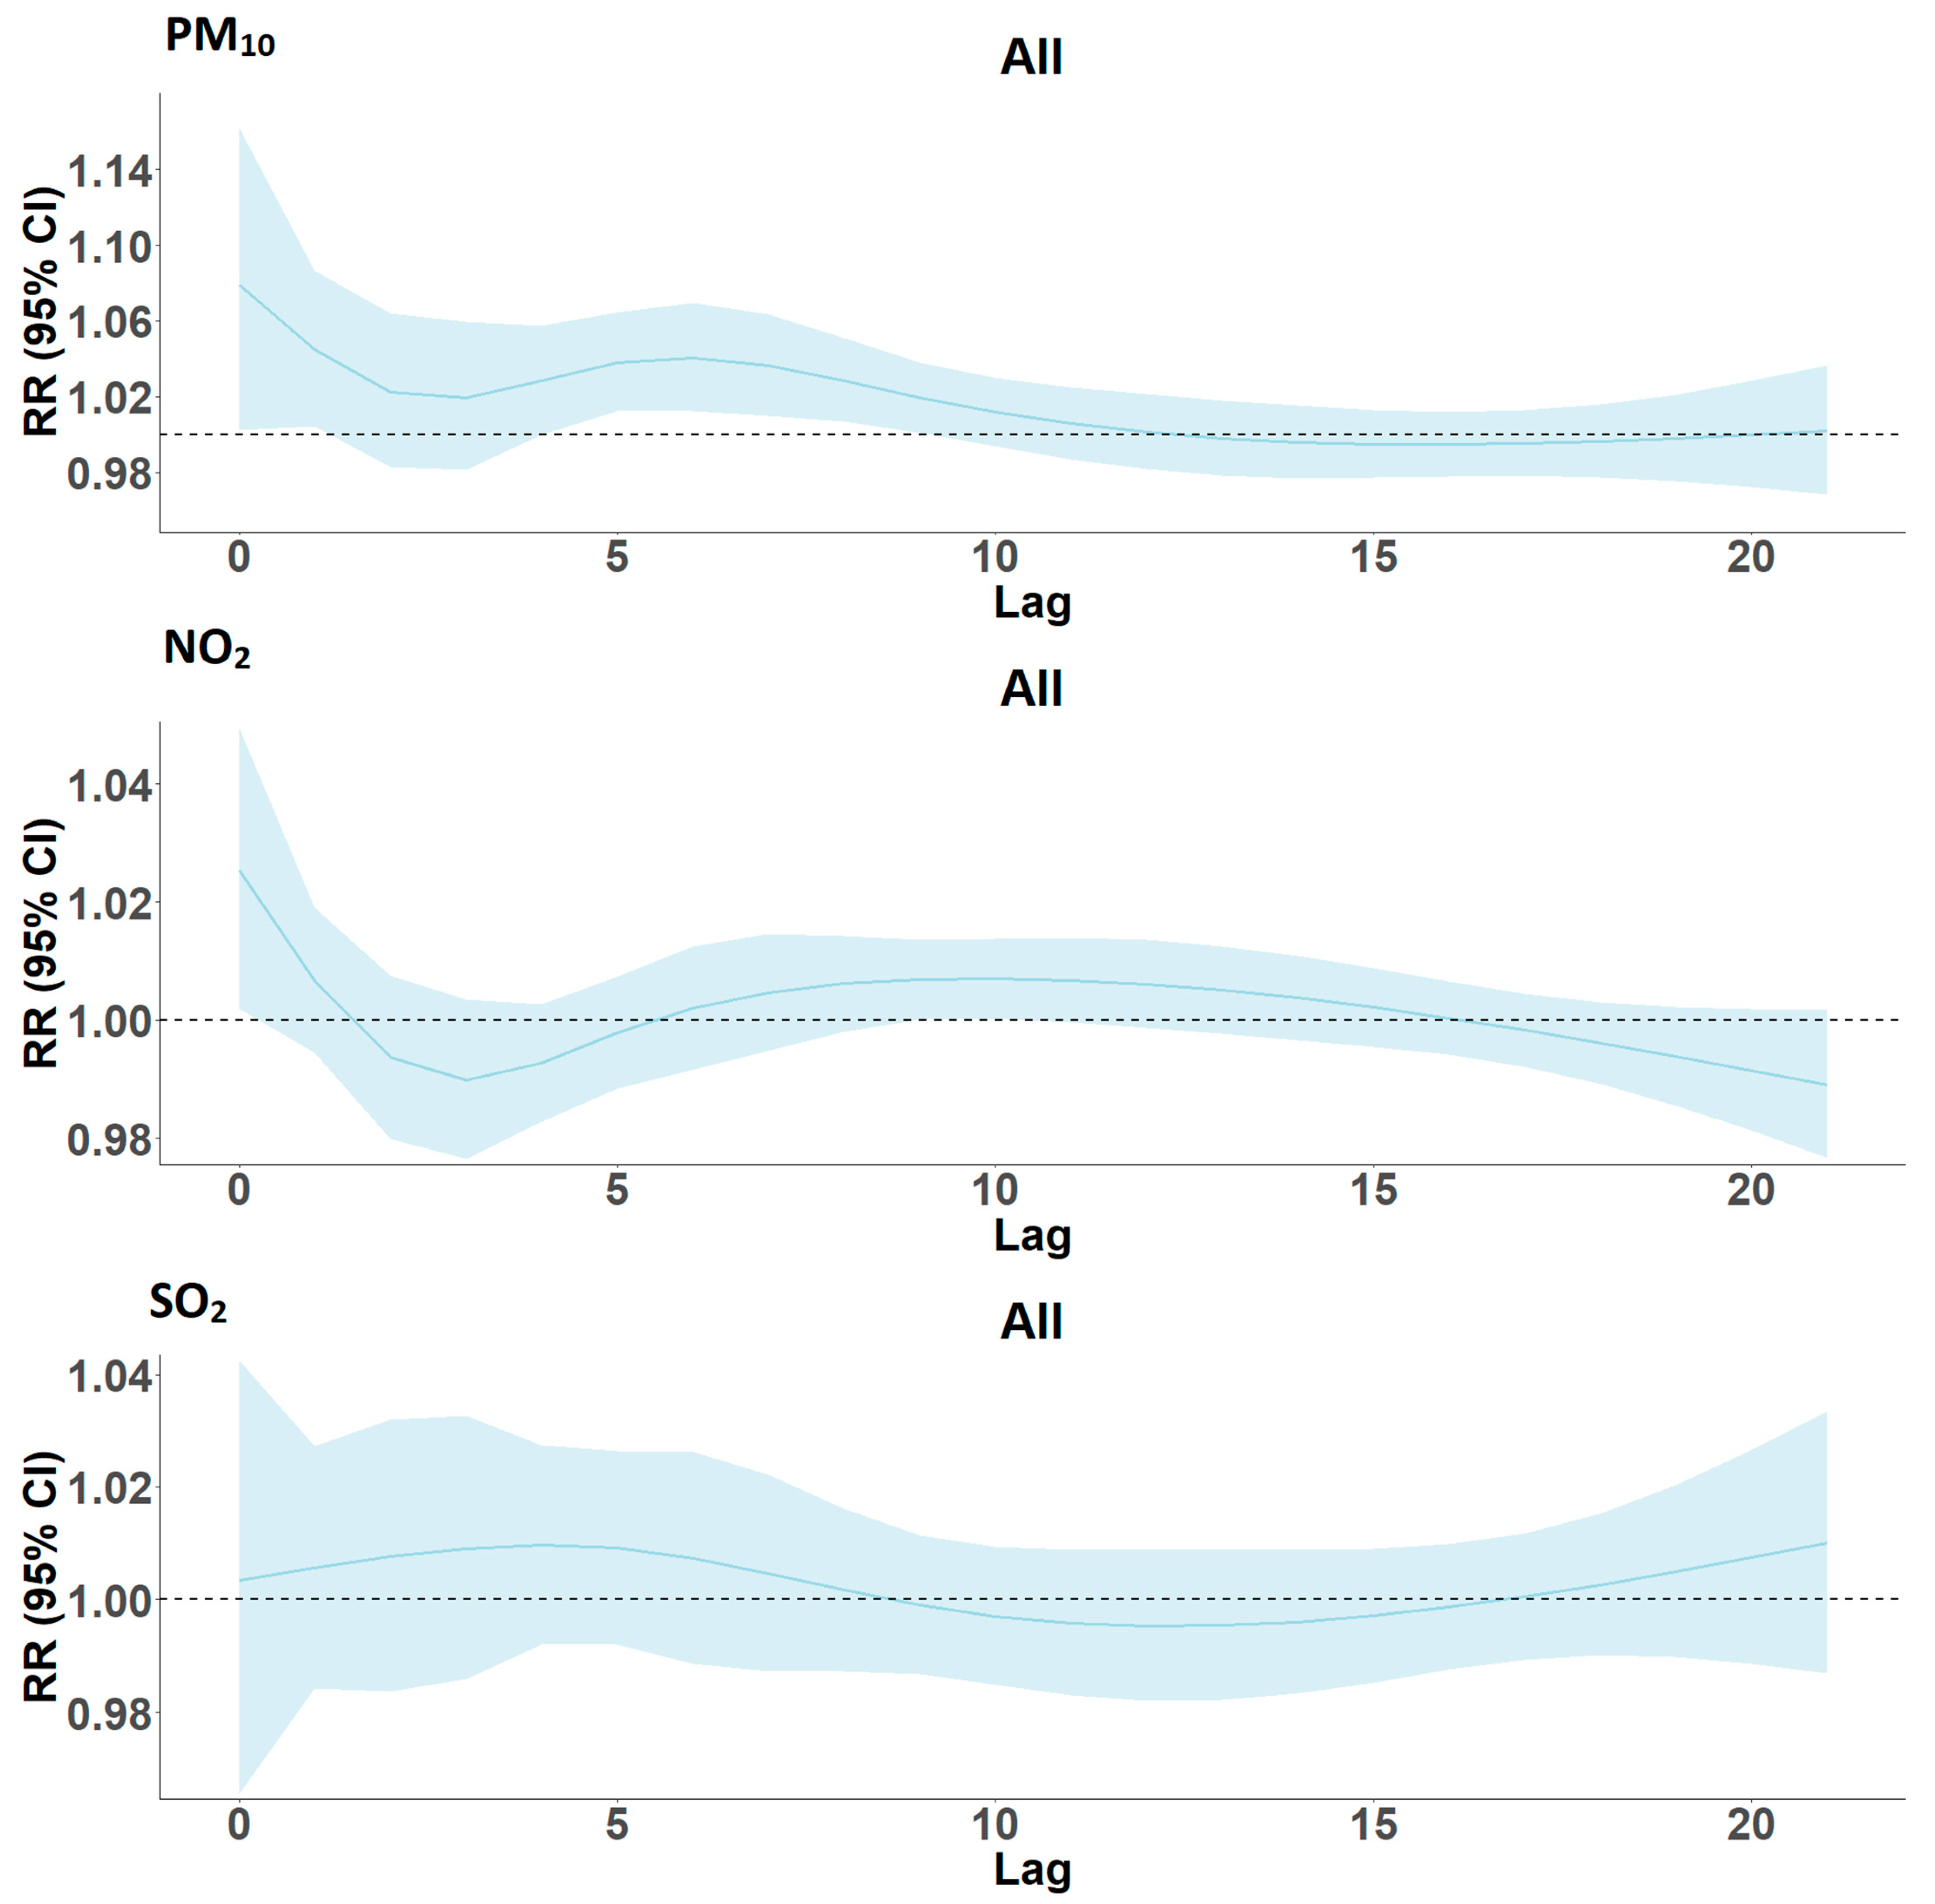
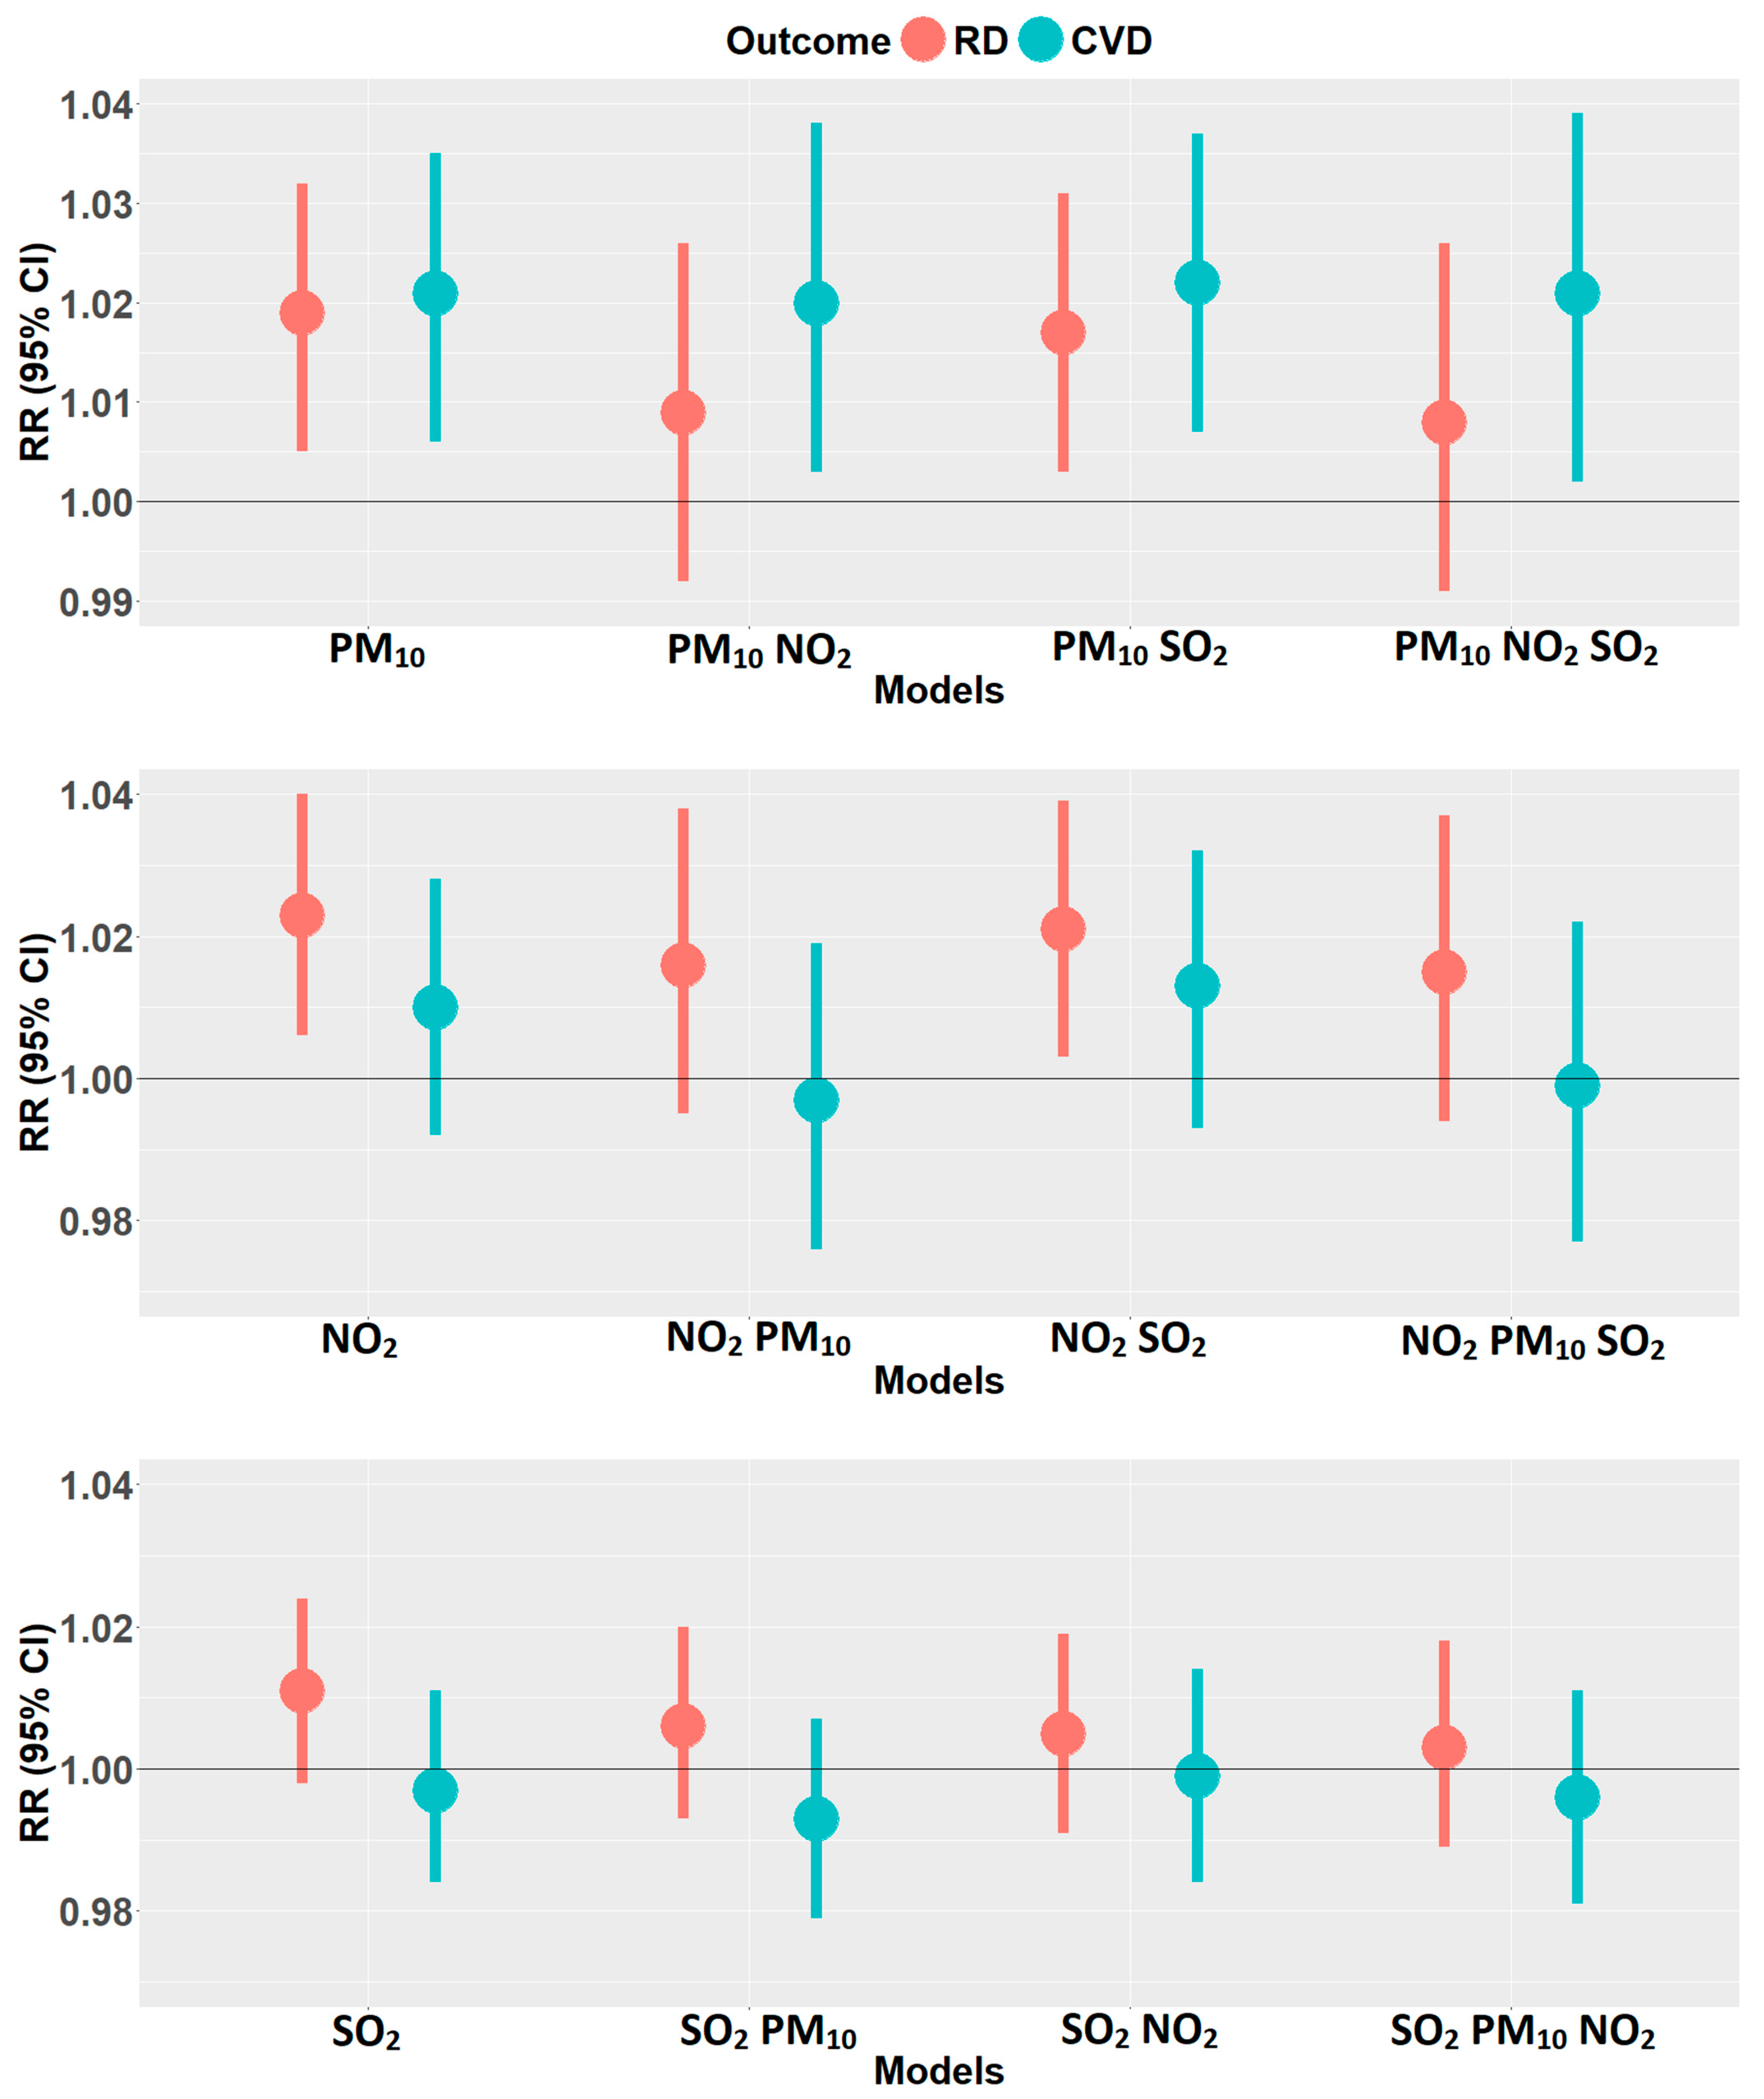
Lag Models
4. Discussion
4.1. Overall Association of Hospital Admissions and NO2
4.2. Overall Association of Hospital Admissions and SO2
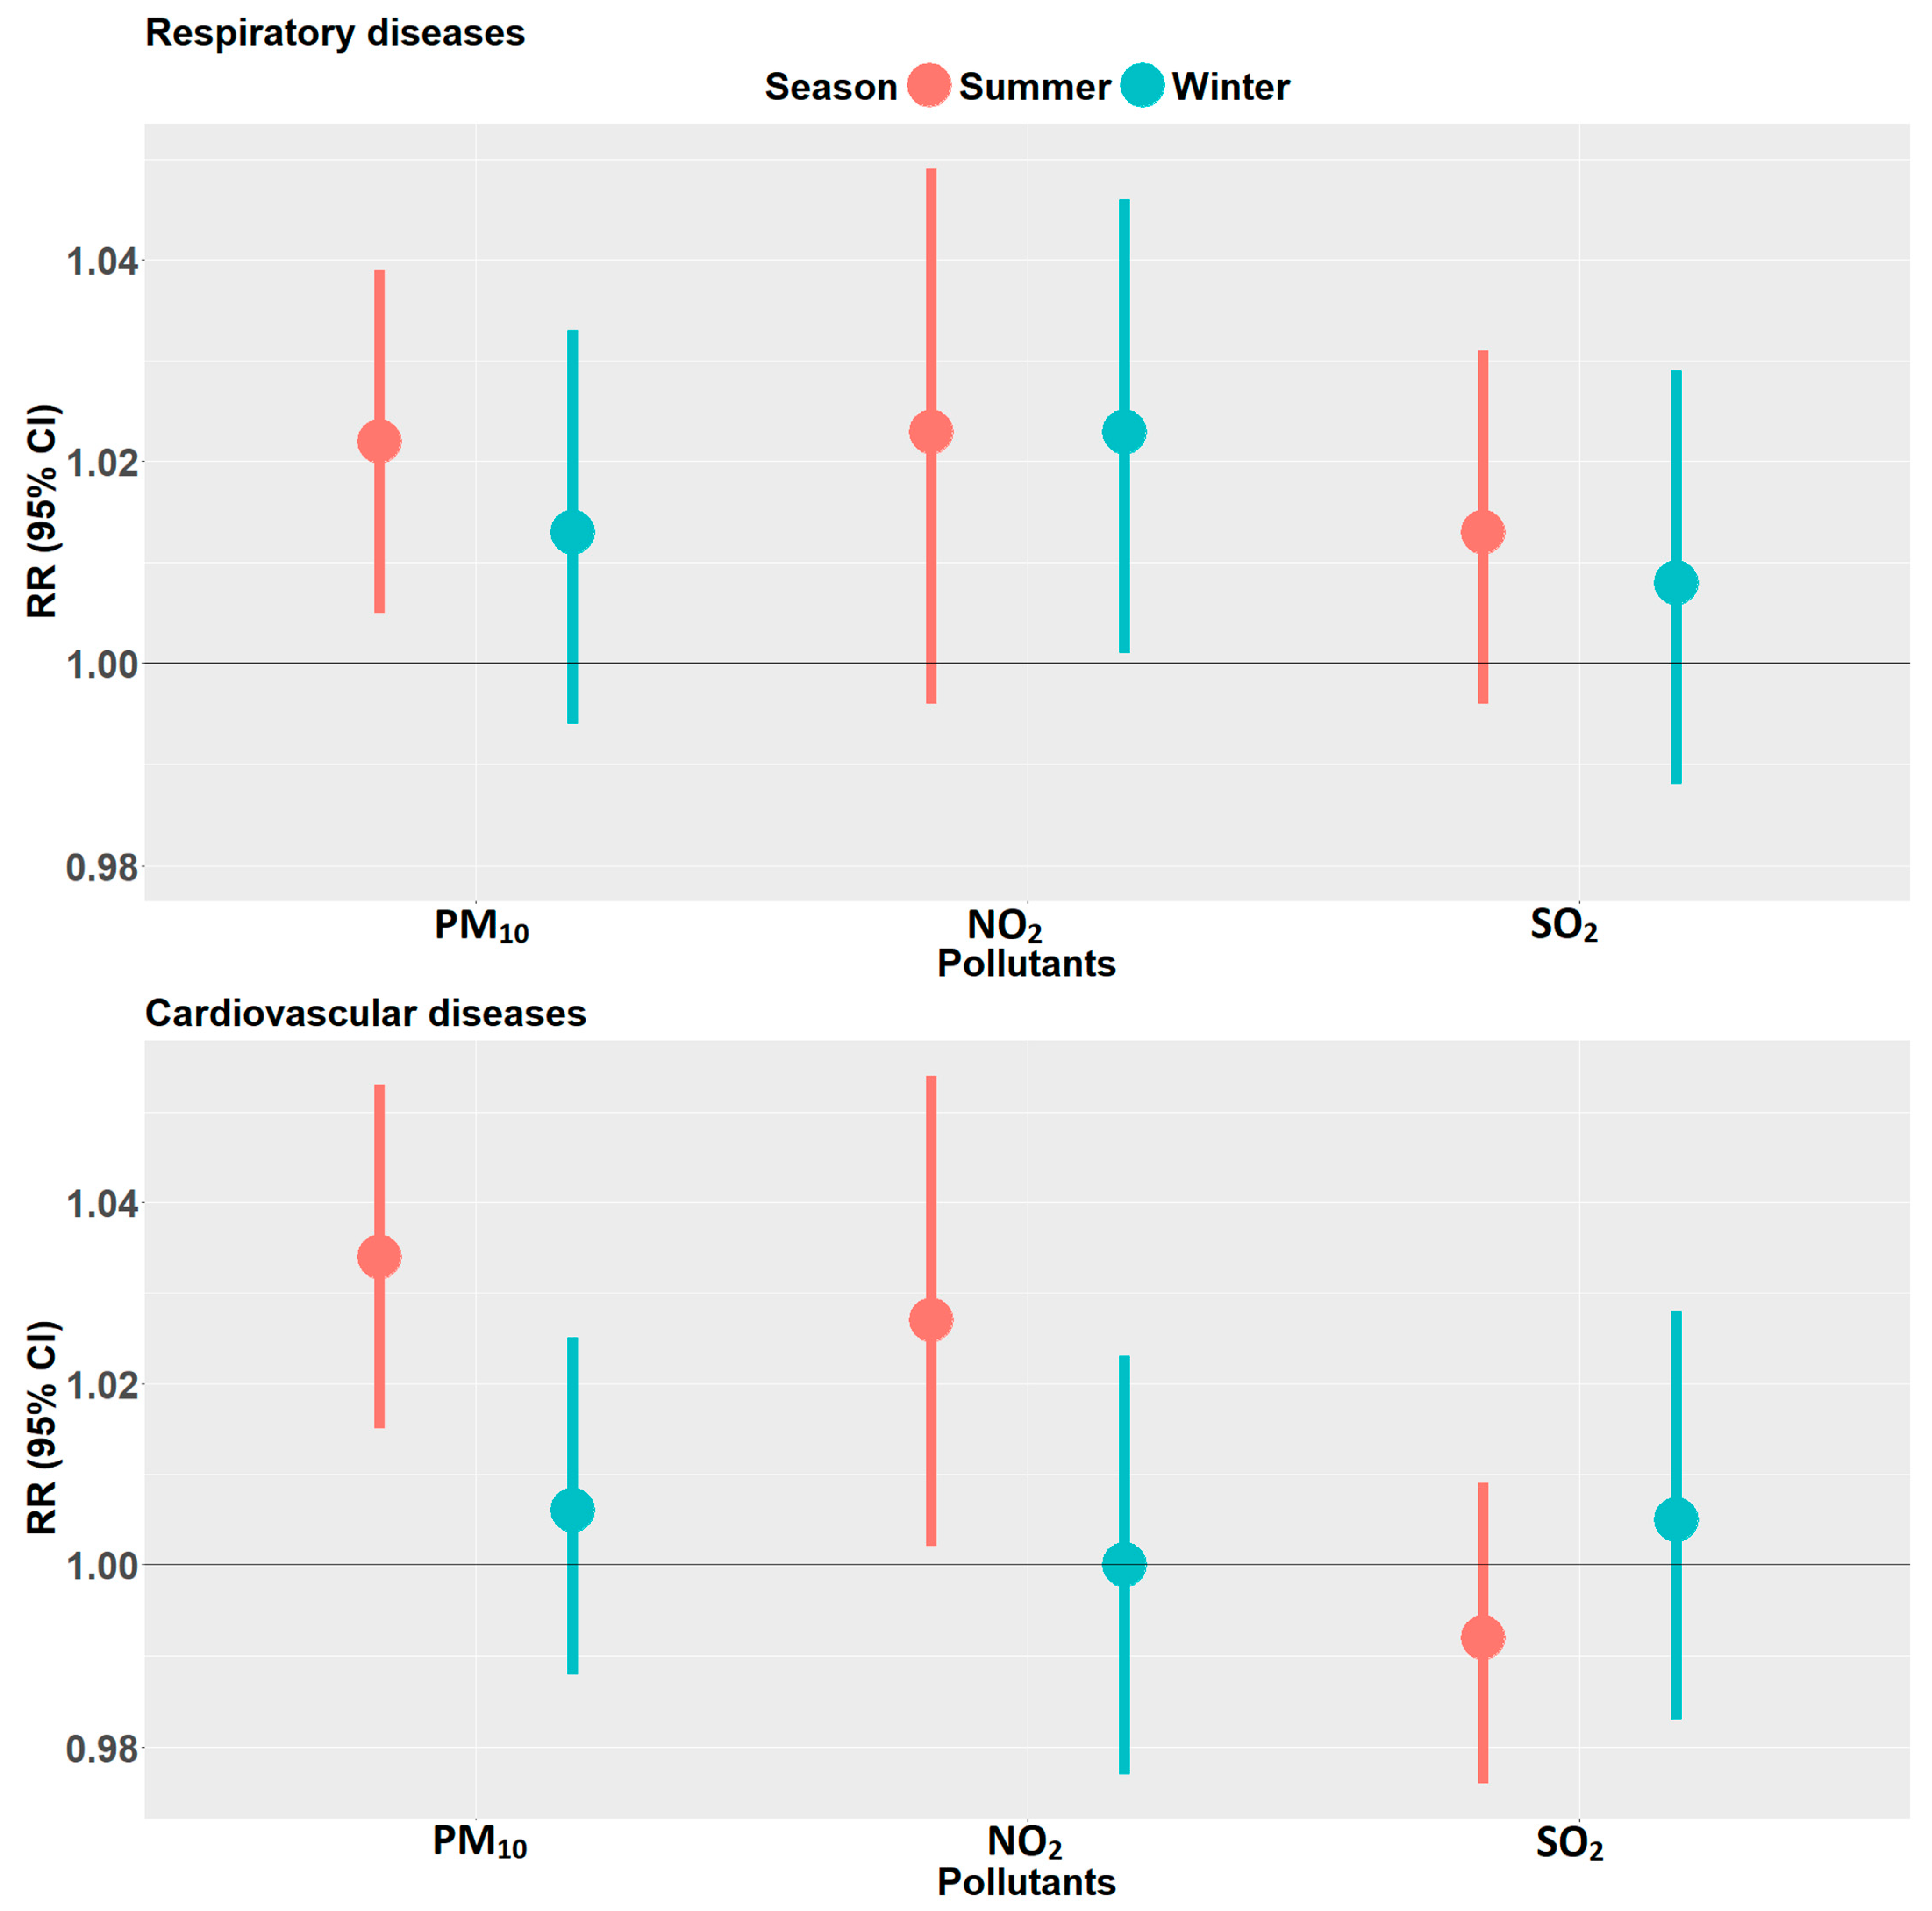
4.3. Effect Modification by Age Group, Sex, and Season
4.4. Strength and Limitations
5. Conclusions
Supplementary Materials
Author Contributions
Funding
Informed Consent Statement
Data Availability Statement
Acknowledgments
Conflicts of Interest
Ethical Approval
References
- World Health Organization. WHO | Ambient Air Pollution. Available online: https://www.who.int/airpollution/ambient/en/ (accessed on 16 March 2019).
- World Health Organization. Ten Threats to Global Health in 2019. Available online: https://www.who.int/vietnam/news/feature-stories/detail/ten-threats-to-global-health-in-2019 (accessed on 16 March 2019).
- World Health Organization. WHO Global Air Quality Guidelines: Particulate Matter (PM2.5 and PM10), Ozone, Nitrogen Dioxide, Sulfur Dioxide and Carbon Monoxide; World Health Organization: Geneva, Switzerland, 2021. [Google Scholar]
- Faustini, A.; Stafoggia, M.; Colais, P.; Berti, G.; Bisanti, L.; Cadum, E.; Cernigliaro, A.; Mallone, S.; Scarnato, C.; Forastiere, F. Air pollution and multiple acute respiratory outcomes. Eur. Respir. J. 2013, 42, 304–313. [Google Scholar] [CrossRef] [Green Version]
- Collart, P.; Dubourg, D.; Levêque, A.; Sierra, N.B.; Coppieters, Y. Short-term effects of nitrogen dioxide on hospital admissions for cardiovascular disease in Wallonia, Belgium. Int. J. Cardiol. 2018, 255, 231–236. [Google Scholar] [CrossRef] [PubMed]
- Liu, C.; Chen, R.; Sera, F.; Vicedo-Cabrera, A.M.; Guo, Y.; Tong, S.; Coelho, M.S.Z.S.; Saldiva, P.H.N.; Lavigne, E.; Matus, P.; et al. Ambient Particulate Air Pollution and Daily Mortality in 652 Cities. N. Engl. J. Med. 2019, 381, 705–715. [Google Scholar] [CrossRef] [PubMed]
- Coker, E.; Kizito, S. A Narrative Review on the Human Health Effects of Ambient Air Pollution in Sub-Saharan Africa: An Urgent Need for Health Effects Studies. Int. J. Environ. Res. Public Health 2018, 15, 427. [Google Scholar] [CrossRef] [PubMed] [Green Version]
- World Health Organization. Ambient Air Pollution: A Global Assessment of Exposure and Burden of Disease; 9241511354; World Health Organization: Geneva, Switzerland, 2016. [Google Scholar]
- Lauri Myllyvirta Greenpeace Global Air Pollution Unit: Ranking the World’s Worst SO2 and NO2 Emission Hotspots 2019. Available online: https://www.greenpeace.org/static/planet4-africa-stateless/2019/03/625c2655-ranking-so2-and-no2-hotspots_19-march-2019.pdf (accessed on 20 September 2019).
- Zhao, L.; Liang, H.R.; Chen, F.Y.; Chen, Z.; Guan, W.J.; Li, J.H. Association between air pollution and cardiovascular mortality in China: A systematic review and meta-analysis. Oncotarget 2017, 8, 66438–66448. [Google Scholar] [CrossRef] [Green Version]
- Wichmann, J.; Voyi, K. Ambient air pollution exposure and respiratory, cardiovascular and cerebrovascular mortality in Cape Town, South Africa: 2001–2006. Int. J. Environ. Res. Public Health 2012, 9, 3978–4016. [Google Scholar] [CrossRef]
- Lokotola, C.L.; Wright, C.Y.; Wichmann, J. Temperature as a modifier of the effects of air pollution on cardiovascular disease hospital admissions in Cape Town, South Africa. Environ. Sci. Pollut. Res. Int. 2020, 27, 16677–16685. [Google Scholar] [CrossRef]
- Thabethe, N.D.L.; Voyi, K.; Wichmann, J. Association between ambient air pollution and cause-specific mortality in Cape Town, Durban, and Johannesburg, South Africa: Any susceptible groups? Environ. Sci. Pollut. Res. 2021, 28, 42868–42876. [Google Scholar] [CrossRef]
- Department of Environmental Affairs. National Ambient Air Quality Standard for Particulate Mathher with Aerodynamic Diameter Less Than 2.5 Micron Meters; Department of Environmental Affairs: Pretoria, South Africa, 2012.
- Department of Environmental Affairs National Environmental Management Act: Air Quality Act, (No 39 of 2004). Available online: https://www.environment.gov.za/legislation/actsregulations (accessed on 14 May 2019).
- Arowosegbe, O.O.; Röösli, M.; Künzli, N.; Saucy, A.; Adebayo-Ojo, T.C.; Jeebhay, M.F.; Dalvie, M.A.; de Hoogh, K. Comparing Methods to Impute Missing Daily Ground-Level PM(10) Concentrations between 2010-2017 in South Africa. Int. J. Environ. Res. Public Health 2021, 18, 3374. [Google Scholar] [CrossRef]
- C3S. Copernicus Climate Change Service (C3S): ERA5: Fifth Generation of ECMWF Atmospheric Reanalyses of the Global Climate; Copernicus Climate Change Service, 2018; Available online: https://cds.climate.copernicus.eu/cdsapp#!/dataset/reanalysis-era5-single-levels?tab=form (accessed on 20 April 2019).
- Gasparrini, A.; Scheipl, F.; Armstrong, B.; Kenward, M.G. A penalized framework for distributed lag non-linear models. Biometrics 2017, 73, 938–948. [Google Scholar] [CrossRef]
- Gasparrini, A. Distributed Lag Linear and Non-Linear Models in R: The Package dlnm. J. Stat. Softw. 2011, 43, 1–20. [Google Scholar] [CrossRef] [PubMed] [Green Version]
- Brook, R.D.; Rajagopalan, S.; Pope, C.A., III; Brook, J.R.; Bhatnagar, A.; Diez-Roux, A.V.; Holguin, F.; Hong, Y.; Luepker, R.V.; Mittleman, M.A.; et al. Particulate matter air pollution and cardiovascular disease: An update to the scientific statement from the American Heart Association. Circulation 2010, 121, 2331–2378. [Google Scholar] [CrossRef] [PubMed] [Green Version]
- Newby, D.E.; Mannucci, P.M.; Tell, G.S.; Baccarelli, A.A.; Brook, R.D.; Donaldson, K.; Forastiere, F.; Franchini, M.; Franco, O.; Graham, I.; et al. Expert position paper on air pollution and cardiovascular disease. Eur. Heart J. 2014, 36, 83–93. [Google Scholar] [CrossRef] [PubMed] [Green Version]
- Bourdrel, T.; Bind, M.A.; Béjot, Y.; Morel, O.; Argacha, J.F. Cardiovascular effects of air pollution. Arch. Cardiovasc. Dis. 2017, 110, 634–642. [Google Scholar] [CrossRef] [PubMed]
- EPA. Integrated Science Assessment for Particulate Matter; US Environmental Protection Agency: Washington, DC, USA, 2009.
- Berend, N. Contribution of air pollution to COPD and small airway dysfunction. Respirology 2016, 21, 237–244. [Google Scholar] [CrossRef]
- Newell, K.; Kartsonaki, C.; Lam, K.B.H.; Kurmi, O.P. Cardiorespiratory health effects of particulate ambient air pollution exposure in low-income and middle-income countries: A systematic review and meta-analysis. Lancet Planet. Health 2017, 1, e368–e380. [Google Scholar] [CrossRef] [Green Version]
- Perez, L.; Grize, L.; Infanger, D.; Künzli, N.; Sommer, H.; Alt, G.-M.; Schindler, C. Associations of daily levels of PM10 and NO2 with emergency hospital admissions and mortality in Switzerland: Trends and missed prevention potential over the last decade. Environ. Res. 2015, 140, 554–561. [Google Scholar] [CrossRef]
- Ayres, J. Cardiovascular Disease and Air Pollution: A Report by the Medical Committee on the Effects of Air Pollution; Department of Health: London, UK, 2006.
- Department of Environmental Affairs 2nd South Africa Environment Outlook: A Report on the State of the Environment; Air Quality: Pretoria, South Africa, 2016.
- City of Cape Town. Statement City Fire Safety Campaign; City of Cape Town: Cape Town, South Africa, 2015.
- Molepo, K.M.; Abiodun, B.J.; Magoba, R.N. The transport of PM10 over Cape Town during high pollution. Episodes. Atmos. Environ. 2019, 213, 116–132. [Google Scholar] [CrossRef] [Green Version]
- Williams, J.; Petrik, L.; Wichmann, J. PM2.5 chemical composition and geographical origin of air masses in Cape Town, South Africa. Air Qual. Atmos. Health 2020, 31, 1–12. [Google Scholar]
- Vos, T.; Lim, S.S.; Abbafati, C.; Abbas, K.M.; Abbasi, M.; Abbasifard, M.; Murray, C.J.L. Global burden of 369 diseases and injuries in 204 countries and territories, 1990–2019: A systematic analysis for the Global Burden of Disease Study 2019. Lancet 2020, 396, 1204–1222. [Google Scholar] [CrossRef]
- Mills, I.C.; Atkinson, R.W.; Kang, S.; Walton, H.; Anderson, H.R. Quantitative systematic review of the associations between short-term exposure to nitrogen dioxide and mortality and hospital admissions. BMJ Open 2015, 5, e006946. [Google Scholar] [CrossRef]
- Carugno, M.; Consonni, D.; Randi, G.; Catelan, D.; Grisotto, L.; Bertazzi, P.A.; Biggeri, A.; Baccini, M. Air pollution exposure, cause-specific deaths and hospitalizations in a highly polluted Italian region. Environ. Res. 2016, 147, 415–424. [Google Scholar] [CrossRef] [Green Version]
- Ab Manan, N.; Noor Aizuddin, A.; Hod, R. Effect of Air Pollution and Hospital Admission: A Systematic Review. Ann. Glob. Health 2018, 84, 670–678. [Google Scholar] [CrossRef] [Green Version]
- Akumu, J. Africa’s Progress to Cleaner Fuels and Vehicles; United Nation Environment: 2019; Available online: http://airqualityandmobility.org/PDFs/sadc2019/OverviewAfricaprogress.pdf (accessed on 5 May 2021).
- Milojevic, A.; Wilkinson, P.; Armstrong, B.; Bhaskaran, K.; Smeeth, L.; Hajat, S. Short-term effects of air pollution on a range of cardiovascular events in England and Wales: Case-crossover analysis of the MINAP database, hospital admissions and mortality. Heart 2014, 100, 1093–1098. [Google Scholar] [CrossRef]
- Newell, K.; Kartsonaki, C.; Lam, K.B.H.; Kurmi, O. Cardiorespiratory health effects of gaseous ambient air pollution exposure in low and middle income countries: A systematic review and meta-analysis. Environ. Health 2018, 17, 41. [Google Scholar] [CrossRef] [Green Version]
- Darlington, T.; Heiken, J.G.; Kahlbaum, D. Nationwide and State-by-State Emission Benefits of a Gasoline Sulfur Limit. Emission Inventory Living Glob. Environ. 1999, 1, 578–596. [Google Scholar]
- Esposito, S.; Galeone, C.; Lelii, M.; Longhi, B.; Ascolese, B.; Senatore, L.; Prada, E.; Montinaro, V.; Malerba, S.; Patria, M.F.; et al. Impact of air pollution on respiratory diseases in children with recurrent wheezing or asthma. BMC Pulmonary Med. 2014, 14, 130. [Google Scholar] [CrossRef] [Green Version]
- Zhu, L.; Ge, X.; Chen, Y.; Zeng, X.; Pan, W.; Zhang, X.; Ben, S.; Yuan, Q.; Xin, J.; Shao, W.; et al. Short-term effects of ambient air pollution and childhood lower respiratory diseases. Sci. Rep. 2017, 7, 4414. [Google Scholar] [CrossRef] [Green Version]
- Nhung, N.T.T.; Schindler, C.; Dien, T.M.; Probst-Hensch, N.; Perez, L.; Künzli, N. Acute effects of ambient air pollution on lower respiratory infections in Hanoi children: An eight-year time series study. Environ. Int. 2018, 110, 139–148. [Google Scholar] [CrossRef]
- Schwartz, J. Air Pollution and Children’s Health. Pediatrics 2004, 113 (Suppl. 3), 1037–1043. [Google Scholar] [CrossRef]
- World Health Organization. Effects of Air Pollution on Children’s Health and Development: A Review of the Evidence; World Health Organization: Geneva, Switzerland, 2005. [Google Scholar]
- Olaniyan, T.; Jeebhay, M.; Roosli, M.; Naidoo, R.; Baatjies, R.; Kunzil, N.; Tsai, M.; Davey, M.; De Hoogh, K.; Berman, D.; et al. A prospective cohort study on ambient air pollution and respiratory morbidities including childhood asthma in adolescents from the western Cape Province: Study protocol. BMC Public Health 2017, 17, 712. [Google Scholar] [CrossRef] [Green Version]
- Gauderman, W.J.; Avol, E.; Gilliland, F.; Vora, H.; Thomas, D.; Berhane, K.; McConnell, R.; Künzli, N.; Lurmann, F.; Rappaport, E.; et al. The effect of air pollution on lung development from 10 to 18 years of age. N. Engl. J. Med. 2004, 351, 1057–1067. [Google Scholar] [CrossRef] [Green Version]
- Gauderman, W.J.; Vora, H.; McConnell, R.; Berhane, K.; Gilliland, F.; Thomas, D.; Lurmann, F.; Avol, E.; Künzli, N.; Jerrett, M.; et al. Effect of exposure to traffic on lung development from 10 to 18 years of age: A cohort study. Lancet 2007, 369, 571–577. [Google Scholar] [CrossRef]
- Bateson, T.F.; Schwartz, J. Children’s response to air pollutants. J. Toxicol. Environ. Health A 2008, 71, 238–243. [Google Scholar] [CrossRef]
- Anderson, H.R.; Atkinson, R.W.; Bremner, S.A.; Marston, L. Particulate air pollution and hospital admissions for cardiorespiratory diseases: Are the elderly at greater risk? Eur. Respir. J. 2003, 21 (Suppl. 40), 39s–46s. [Google Scholar] [CrossRef] [Green Version]
- Boss, G.R.; Seegmiller, J.E. Age-related physiological changes and their clinical significance. West J. Med. 1981, 135, 434–440. [Google Scholar]
- van Loenhout, J.A.F.; Delbiso, T.D.; Kiriliouk, A.; Rodriguez-Llanes, J.M.; Segers, J.; Guha-Sapir, D. Heat and emergency room admissions in the Netherlands. BMC Public Health 2018, 18, 108. [Google Scholar] [CrossRef] [Green Version]
- Kelly, F.J.; Dunster, C.; Mudway, I. Air pollution and the elderly: Oxidant/antioxidant issues worth consideration. Eur. Respir. J. 2003, 21 (Suppl. 40), 70s–75s. [Google Scholar] [CrossRef] [Green Version]
- Bell, M.L.; Zanobetti, A.; Dominici, F. Evidence on vulnerability and susceptibility to health risks associated with short-term exposure to particulate matter: A systematic review and meta-analysis. Am. J. Epidemiol. 2013, 178, 865–876. [Google Scholar] [CrossRef] [Green Version]
- Janssen, N.A.; de Hartog, J.J.; Hoek, G.; Brunekreef, B.; Lanki, T.; Timonen, K.L.; Pekkanen, J. Personal exposure to fine particulate matter in elderly subjects: Relation between personal, indoor, and outdoor concentrations. J. Air Waste Manag. Assoc. 2000, 50, 1133–1143. [Google Scholar] [CrossRef]
- Zeger, S.L.; Thomas, D.; Dominici, F.; Samet, J.M.; Schwartz, J.; Dockery, D.; Cohen, A. Exposure measurement error in time-series studies of air pollution: Concepts and consequences. Environ. Health Perspect. 2000, 108, 419–426. [Google Scholar] [CrossRef] [PubMed]
- Ataguba, J. Health care financing in South Africa: Moving towards universal coverage. Contin. Med. Educ. 2010, 28, 74–78. [Google Scholar]
- National Department of Health. National Digital Health Strategy for South Africa 2019–2024; National Department of Health Republic of South Africa: Pretoria, South Africa, 2020.
- Shah, A.S.; Lee, K.K.; McAllister, D.A.; Hunter, A.; Nair, H.; Whiteley, W.; Langrish, J.P.; E Newby, D.; Mills, N. Short term exposure to air pollution and stroke: Systematic review and meta-analysis. BMJ 2015, 350, h1295. [Google Scholar] [CrossRef] [PubMed] [Green Version]
- Mannocci, A.; Ciarlo, I.; D’Egidio, V.; Del Cimmuto, A.; de Giusti, M.; Villari, P.; La Torre, G. Socioeconomic Deprivation Status and Air Pollution by PM10 and NO2: An Assessment at Municipal Level of 11 Years in Italy. J. Environ. Public Health 2019, 2019, 2058467. [Google Scholar] [CrossRef] [Green Version]
- Laurent, O.; Bard, D.; Filleul, L.; Segala, C. Effect of socioeconomic status on the relationship between atmospheric pollution and mortality. J. Epidemiol. Community Health 2007, 61, 665–675. [Google Scholar] [CrossRef] [Green Version]
- Abed Al Ahad, M.; Sullivan, F.; Demšar, U.; Melhem, M.; Kulu, H. The effect of air-pollution and weather exposure on mortality and hospital admission and implications for further research: A systematic scoping review. PLoS ONE 2020, 15, e0241415. [Google Scholar] [CrossRef] [PubMed]


| Percentiles | By Season–Mean (SD) | |||||||||
|---|---|---|---|---|---|---|---|---|---|---|
| Variable | Mean | SD | Min | Max | IQR | 25th | 50th | 75th | Warm | Cold |
| Cardiovascular disease | n = 35,487 | n = 19,331 | ||||||||
| All ages and sex n = 54,818 | 25.7 | 13 | 2 | 66 | 23 | 13 | 27 | 36 | 25.5 (13.2) | 26.2 (12.6) |
| 0–14 years n = 498 | 0.2 | 0.5 | 0 | 3 | 0 | 0 | 0 | 0 | 0.2 (0.5) | 0.2 (0.5) |
| 15–64 years n = 27,225 | 12.8 | 7 | 0 | 33 | 12 | 6 | 13 | 18 | 12.8 (7.1) | 12.7 (6.9) |
| >65 years n = 27,095 | 12.7 | 6.9 | 0 | 43 | 11 | 7 | 12 | 18 | 12.4 (7) | 13.3 (6.8) |
| Female n = 22,914 | 10.8 | 5.9 | 0 | 35 | 10 | 5 | 11 | 15 | 10.6 (6) | 11.1 (5.9) |
| Male n = 31,904 | 15 | 8.1 | 1 | 40 | 13 | 8 | 15 | 21 | 14.9 (8.2) | 15.1 (7.8) |
| Respiratory disease | n = 33,840 | n = 24,477 | ||||||||
| All ages and sex n = 58,317 | 27.4 | 13.1 | 1 | 75 | 21 | 16 | 27 | 37 | 24.3 (12) | 33.2 (13) |
| 0–14 years n = 28,518 | 13.4 | 7.4 | 0 | 37 | 11 | 7 | 13 | 18 | 11.8 (7) | 16.3 (7.3) |
| 15–64 years n = 19,418 | 9.1 | 5.4 | 0 | 32 | 8 | 5 | 9 | 13 | 8.2 (5.1) | 10.9 (5.5) |
| >65 years n = 10,381 | 4.9 | 2.9 | 0 | 17 | 4 | 3 | 4 | 7 | 4.3 (2.6) | 6 (3.1) |
| Female n = 29,741 | 14 | 7.2 | 0 | 44 | 11 | 8 | 13 | 19 | 12.2 (6.6) | 17.2 (7.3) |
| Male n = 28,576 | 13.4 | 6.9 | 0 | 40 | 10 | 8 | 13 | 18 | 12.1 (6.5) | 16 (6.9) |
| Air pollutants | ||||||||||
| PM10 (µg/m3) | 24.4 | 9.5 | 6.9 | 80.2 | 12 | 17.3 | 22.7 | 29.3 | 24.1 (8.7) | 25 (10.7) |
| NO2 (µg/m3) | 15 | 5.5 | 3.9 | 42 | 7.3 | 10.9 | 14.1 | 18.2 | 13.5 (4.8) | 17.8 (5.8) |
| SO2 (µg/m3) | 9.4 | 2.8 | 2.6 | 23.2 | 3.6 | 7.3 | 9 | 10.9 | 9.3 (2.9) | 9.6 (2.8) |
| Meteorological data | ||||||||||
| Temperature (°C) | 17.3 | 4.3 | 7.5 | 29.3 | 7 | 13.8 | 17 | 20.8 | 19.4 (3.6) | 13.5 (2.3) |
| Relative humidity (%) | 68.6 | 10.5 | 30.7 | 100 | 15 | 61 | 69 | 76 | 65.6 (9.4) | 74.2 (10.1) |
| PM10 | NO2 | SO2 | Temperature | Humidity | |
|---|---|---|---|---|---|
| PM10 | 1 | ||||
| NO2 | 0.30 | 1 | |||
| SO2 | 0.20 | 0.27 | 1 | ||
| Temperature | 0.23 | −0.38 | 0.01 | 1 | |
| Humidity | −0.29 | 0.02 | −0.11 | −0.39 | 1 |
| Respiratory Disease Hospitalization by Pollutants | |||||||||
| Per 12 µg/m3 PM10 | Per 7.3 µg/m3 NO2 | Per 3.6 µg/m3 SO2 | |||||||
| Groups | RR | 95% Confidence Interval | RR | 95% Confidence Interval | RR | 95% Confidence Interval | |||
| Lower | Upper | Lower | Upper | Lower | Upper | ||||
| All | 1.019 | 1.005 | 1.032 | 1.023 | 1.006 | 1.04 | 1.011 | 0.998 | 1.024 |
| Age 0–14 | 1.02 | 1.002 | 1.039 | 1.031 | 1.007 | 1.056 | 1.015 | 0.997 | 1.033 |
| Age 15–64 | 1.009 | 0.988 | 1.03 | 1.003 | 0.976 | 1.03 | 1.011 | 0.99 | 1.032 |
| Age ≥ 65 | 1.019 | 0.994 | 1.046 | 1.005 | 0.972 | 1.039 | 0.989 | 0.963 | 1.015 |
| Female | 1.014 | 0.997 | 1.032 | 1.013 | 0.991 | 1.036 | 1.006 | 0.989 | 1.023 |
| Male | 1.02 | 1.002 | 1.037 | 1.019 | 0.997 | 1.042 | 1.015 | 0.998 | 1.032 |
| Cardiovascular Disease Hospitalizations by Pollutants | |||||||||
| Per 12 µg/m3 PM10 | Per 7.3 µg/m3 NO2 | Per 3.6 µg/m3 SO2 | |||||||
| Groups | RR | 95% Confidence Interval | RR | 95% Confidence Interval | RR | 95% Confidence Interval | |||
| Lower | Upper | Lower | Upper | Lower | Upper | ||||
| All | 1.021 | 1.006 | 1.035 | 1.01 | 0.992 | 1.028 | 0.997 | 0.984 | 1.011 |
| Age 15–64 | 1.021 | 1.002 | 1.039 | 1.006 | 0.983 | 1.03 | 0.998 | 0.98 | 1.015 |
| Age ≥ 65 | 1.022 | 1.004 | 1.041 | 1.017 | 0.994 | 1.041 | 0.995 | 0.978 | 1.012 |
| Female | 1.02 | 1.001 | 1.04 | 1.007 | 0.983 | 1.033 | 1.009 | 0.99 | 1.028 |
| Male | 1.021 | 1.003 | 1.038 | 1.015 | 0.993 | 1.037 | 0.987 | 0.971 | 1.003 |
Publisher’s Note: MDPI stays neutral with regard to jurisdictional claims in published maps and institutional affiliations. |
© 2022 by the authors. Licensee MDPI, Basel, Switzerland. This article is an open access article distributed under the terms and conditions of the Creative Commons Attribution (CC BY) license (https://creativecommons.org/licenses/by/4.0/).
Share and Cite
Adebayo-Ojo, T.C.; Wichmann, J.; Arowosegbe, O.O.; Probst-Hensch, N.; Schindler, C.; Künzli, N. Short-Term Joint Effects of PM10, NO2 and SO2 on Cardio-Respiratory Disease Hospital Admissions in Cape Town, South Africa. Int. J. Environ. Res. Public Health 2022, 19, 495. https://doi.org/10.3390/ijerph19010495
Adebayo-Ojo TC, Wichmann J, Arowosegbe OO, Probst-Hensch N, Schindler C, Künzli N. Short-Term Joint Effects of PM10, NO2 and SO2 on Cardio-Respiratory Disease Hospital Admissions in Cape Town, South Africa. International Journal of Environmental Research and Public Health. 2022; 19(1):495. https://doi.org/10.3390/ijerph19010495
Chicago/Turabian StyleAdebayo-Ojo, Temitope Christina, Janine Wichmann, Oluwaseyi Olalekan Arowosegbe, Nicole Probst-Hensch, Christian Schindler, and Nino Künzli. 2022. "Short-Term Joint Effects of PM10, NO2 and SO2 on Cardio-Respiratory Disease Hospital Admissions in Cape Town, South Africa" International Journal of Environmental Research and Public Health 19, no. 1: 495. https://doi.org/10.3390/ijerph19010495
APA StyleAdebayo-Ojo, T. C., Wichmann, J., Arowosegbe, O. O., Probst-Hensch, N., Schindler, C., & Künzli, N. (2022). Short-Term Joint Effects of PM10, NO2 and SO2 on Cardio-Respiratory Disease Hospital Admissions in Cape Town, South Africa. International Journal of Environmental Research and Public Health, 19(1), 495. https://doi.org/10.3390/ijerph19010495