
The Correlation of Serum Myostatin Levels with Gait Speed in Kidney Transplantation Recipients


Abstract
:1. Introduction
2. Materials and Methods
2.1. Participants
2.2. Measurement of Blood Pressure, Body Weight, and Height
2.3. Measurement of Skeletal Muscle Index, Handgrip Strength, and Gait Speed
2.4. Biochemical and Myostatin Investigations
2.5. Statistical Analysis
3. Results
4. Discussion
5. Conclusions
Author Contributions
Funding
Institutional Review Board Statement
Informed Consent Statement
Data Availability Statement
Conflicts of Interest
References
- Joulia-Ekaza, D.; Cabello, G. The myostatin gene: Physiology and pharmacological relevance. Curr. Opin. Pharmacol. 2007, 7, 310–315. [Google Scholar] [CrossRef]
- Verzola, D.; Barisione, C.; Picciotto, D.; Garibotto, G.; Koppe, L. Emerging role of myostatin and its inhibition in the setting of chronic kidney disease. Kidney Int. 2019, 95, 506–517. [Google Scholar] [CrossRef]
- McPherron, A.C.; Lawler, A.M.; Lee, S.J. Regulation of skeletal muscle mass in mice by a new TGF-beta superfamily member. Nature 1997, 387, 83–90. [Google Scholar] [CrossRef] [PubMed]
- Thomas, M.; Langley, B.; Berry, C.; Sharma, M.; Kirk, S.; Bass, J.; Kambadur, R. Myostatin, a negative regulator of muscle growth, functions by inhibiting myoblast proliferation. J. Biol. Chem. 2000, 275, 40235–40243. [Google Scholar] [CrossRef] [PubMed] [Green Version]
- Carnac, G.; Vernus, B.; Bonnieu, A. Myostatin in the pathophysiology of skeletal muscle. Curr. Genom. 2007, 8, 415–422. [Google Scholar]
- Rooks, D.; Praestgaard, J.; Hariry, S.; Laurent, D.; Petricoul, O.; Perry, R.G.; Lach-Trifilieff, E.; Roubenoff, R. Treatment of Sarcopenia with Bimagrumab: Results from a Phase II, Randomized, Controlled, Proof-of-Concept Study. J. Am. Geriatr. Soc. 2017, 65, 1988–1995. [Google Scholar] [CrossRef] [PubMed]
- Amor, M.; Itariu, B.K.; Moreno-Viedma, V.; Keindl, M.; Jürets, A.; Prager, G.; Langer, F.; Grablowitz, V.; Zeyda, M.; Stulnig, T.M. Serum Myostatin is Upregulated in Obesity and Correlates with Insulin Resistance in Humans. Exp. Clin. Endocrinol. Diabetes 2019, 127, 550–556. [Google Scholar] [CrossRef]
- Cleasby, M.E.; Jarmin, S.; Eilers, W.; Elashry, M.; Andersen, D.K.; Dickson, G.; Foster, K. Local overexpression of the myostatin propeptide increases glucose transporter expression and enhances skeletal muscle glucose disposal. Am. J. Physiol. Endocrinol. Metab. 2014, 306, E814–E823. [Google Scholar] [CrossRef]
- Bataille, S.; Chauveau, P.; Fouque, D.; Aparicio, M.; Koppe, L. Myostatin and muscle atrophy during chronic kidney disease. Nephrol. Dial. Transplant. 2020, 36, 1986–1993. [Google Scholar] [CrossRef]
- Han, D.S.; Chen, Y.M.; Lin, S.Y.; Chang, H.H.; Huang, T.M.; Chi, Y.C.; Yang, W.S. Serum myostatin levels and grip strength in normal subjects and patients on maintenance haemodialysis. Clin. Endocrinol. 2011, 75, 857–863. [Google Scholar] [CrossRef]
- Koyun, D.; Nergizoglu, G.; Kir, K.M. Evaluation of the relationship between muscle mass and serum myostatin levels in chronic hemodialysis patients. Saudi J. Kidney Dis. Transpl. 2018, 29, 809–815. [Google Scholar] [CrossRef]
- Morioka, T. Myostatin: The Missing Link between Sarcopenia and Cardiovascular Disease in Chronic Kidney Disease? J. Atheroscler. Thromb. 2020, 27, 1036–1038. [Google Scholar] [CrossRef]
- Esposito, P.; Verzola, D.; Porta, E.; Milanesi, S.; Grignano, M.A.; Avella, A.; Gregorini, M.; Abelli, M.; Ticozzelli, E.; Rampino, T.; et al. Myostatin in the Arterial Wall of Patients with End-Stage Renal Disease. J. Atheroscler. Thromb. 2020, 27, 1039–1052. [Google Scholar] [CrossRef] [Green Version]
- Lee, S.M.; Kim, S.E.; Lee, J.Y.; Jeong, H.J.; Son, Y.K.; An, W.S. Serum myostatin levels are associated with abdominal aortic calcification in dialysis patients. Kidney Res. Clin. Pract. 2019, 38, 481–489. [Google Scholar] [CrossRef] [Green Version]
- Wirtz, T.H.; Loosen, S.H.; Buendgens, L.; Kurt, B.; Abu Jhaisha, S.; Hohlstein, P.; Brozat, J.F.; Weiskirchen, R.; Luedde, T.; Tacke, F.; et al. Low Myostatin Serum Levels Are Associated with Poor Outcome in Critically Ill Patients. Diagnostics 2020, 10, 574. [Google Scholar] [CrossRef] [PubMed]
- Han, D.S.; Chu-Su, Y.; Chiang, C.K.; Tseng, F.Y.; Tseng, P.H.; Chen, C.L.; Wu, K.D.; Yang, W.S. Serum myostatin is reduced in individuals with metabolic syndrome. PLoS ONE 2014, 9, e108230. [Google Scholar] [CrossRef] [PubMed]
- Middleton, A.; Fritz, S.L.; Lusardi, M. Walking speed: The functional vital sign. J. Aging Phys. Act. 2015, 23, 314–322. [Google Scholar] [CrossRef] [PubMed]
- Perez-Sousa, M.A.; Venegas-Sanabria, L.C.; Chavarro-Carvajal, D.A.; Cano-Gutierrez, C.A.; Izquierdo, M.; Correa-Bautista, J.E.; Ramírez-Vélez, R. Gait speed as a mediator of the effect of sarcopenia on dependency in activities of daily living. J. Cachexia Sarcopenia Muscle 2019, 10, 1009–1015. [Google Scholar] [CrossRef] [Green Version]
- Studenski, S.; Perera, S.; Patel, K.; Rosano, C.; Faulkner, K.; Inzitari, M.; Brach, J.; Chandler, J.; Cawthon, P.; Connor, E.B.; et al. Gait speed and survival in older adults. JAMA 2011, 305, 50–58. [Google Scholar] [CrossRef] [Green Version]
- Lee, Y.H.; Kim, J.S.; Jung, S.W.; Hwang, H.S.; Moon, J.Y.; Jeong, K.H.; Lee, S.H.; Lee, S.Y.; Ko, G.J.; Lee, D.Y.; et al. Gait speed and handgrip strength as predictors of all-cause mortality and cardiovascular events in hemodialysis patients. BMC Nephrol. 2020, 21, 166. [Google Scholar] [CrossRef]
- Veronese, N.; Stubbs, B.; Volpato, S.; Zuliani, G.; Maggi, S.; Cesari, M.; Lipnicki, D.M.; Smith, L.; Schofield, P.; Firth, J.; et al. Association Between Gait Speed With Mortality, Cardiovascular Disease and Cancer: A Systematic Review and Meta-analysis of Prospective Cohort Studies. J. Am. Med. Dir. Assoc. 2018, 19, 981–988.e7. [Google Scholar] [CrossRef] [PubMed]
- Zemp, D.D.; Giannini, O.; Quadri, P.; de Bruin, E.D. Gait characteristics of CKD patients: A systematic review. BMC Nephrol. 2019, 20, 83. [Google Scholar] [CrossRef] [PubMed]
- Koito, Y.; Yanishi, M.; Kimura, Y.; Tsukaguchi, H.; Kinoshita, H.; Matsuda, T. Serum Brain-Derived Neurotrophic Factor and Myostatin Levels Are Associated With Skeletal Muscle Mass in Kidney Transplant Recipients. Transplant. Proc. 2021, 53, 1939–1944. [Google Scholar] [CrossRef] [PubMed]
- Elkina, Y.; von Haehling, S.; Anker, S.D.; Springer, J. The role of myostatin in muscle wasting: An overview. J. Cachexia Sarcopenia Muscle 2011, 2, 143–151. [Google Scholar] [CrossRef] [PubMed] [Green Version]
- Forbes, D.; Jackman, M.; Bishop, A.; Thomas, M.; Kambadur, R.; Sharma, M. Myostatin auto-regulates its expression by feedback loop through Smad7 dependent mechanism. J. Cell. Physiol. 2006, 206, 264–272. [Google Scholar] [CrossRef] [PubMed]
- Zhu, X.; Topouzis, S.; Liang, L.F.; Stotish, R.L. Myostatin signaling through Smad2, Smad3 and Smad4 is regulated by the inhibitory Smad7 by a negative feedback mechanism. Cytokine 2004, 26, 262–272. [Google Scholar] [CrossRef] [PubMed]
- Han, D.S.; Chang, K.V.; Li, C.M.; Lin, Y.H.; Kao, T.W.; Tsai, K.S.; Wang, T.G.; Yang, W.S. Skeletal muscle mass adjusted by height correlated better with muscular functions than that adjusted by body weight in defining sarcopenia. Sci. Rep. 2016, 6, 19457. [Google Scholar] [CrossRef]
- Baek, S.J.; Nam, G.E.; Han, K.D.; Choi, S.W.; Jung, S.W.; Bok, A.R.; Kim, Y.H.; Lee, K.S.; Han, B.D.; Kim, D.H. Sarcopenia and sarcopenic obesity and their association with dyslipidemia in Korean elderly men: The 2008-2010 Korea National Health and Nutrition Examination Survey. J. Endocrinol. Investig. 2014, 37, 247–260. [Google Scholar] [CrossRef]
- Okoro, C.A.; Zhong, Y.; Ford, E.S.; Balluz, L.S.; Strine, T.W.; Mokdad, A.H. Association between the metabolic syndrome and its components and gait speed among U.S. adults aged 50 years and older: A cross-sectional analysis. BMC Public Health 2006, 6, 282. [Google Scholar] [CrossRef] [Green Version]
- Amthor, H.; Macharia, R.; Navarrete, R.; Schuelke, M.; Brown, S.C.; Otto, A.; Voit, T.; Muntoni, F.; Vrbóva, G.; Partridge, T.; et al. Lack of myostatin results in excessive muscle growth but impaired force generation. Proc. Natl. Acad. Sci. USA 2007, 104, 1835–1840. [Google Scholar] [CrossRef] [Green Version]
- Hennebry, A.; Berry, C.; Siriett, V.; O’Callaghan, P.; Chau, L.; Watson, T.; Sharma, M.; Kambadur, R. Myostatin regulates fiber-type composition of skeletal muscle by regulating MEF2 and MyoD gene expression. Am. J. Physiol. Cell Physiol. 2009, 296, C525–C534. [Google Scholar] [CrossRef]
- Walowski, C.O.; Braun, W.; Maisch, M.J.; Jensen, B.; Peine, S.; Norman, K.; Müller, M.J.; Bosy-Westphal, A. Reference Values for Skeletal Muscle Mass—Current Concepts and Methodological Considerations. Nutrients 2020, 12, 755. [Google Scholar] [CrossRef] [Green Version]
- Wu, H.; Ballantyne, C.M. Skeletal muscle inflammation and insulin resistance in obesity. J. Clin. Investig. 2017, 127, 43–54. [Google Scholar] [CrossRef]
- Sakuma, K.; Yamaguchi, A. Sarcopenic obesity and endocrinal adaptation with age. Int. J. Endocrinol. 2013, 2013, 204164. [Google Scholar] [CrossRef] [Green Version]
- Busch Tde, A.; Duarte, Y.A.; Pires Nunes, D.; Lebrão, M.L.; Satya Naslavsky, M.; dos Santos Rodrigues, A.; Amaro, E., Jr. Factors associated with lower gait speed among the elderly living in a developing country: A cross-sectional population-based study. BMC Geriatr. 2015, 15, 35. [Google Scholar] [CrossRef]
- Sartori, R.; Milan, G.; Patron, M.; Mammucari, C.; Blaauw, B.; Abraham, R.; Sandri, M. Smad2 and 3 transcription factors control muscle mass in adulthood. Am. J. Physiol. Cell Physiol. 2009, 296, C1248–C1257. [Google Scholar] [CrossRef] [Green Version]
- Yoon, M.S. mTOR as a Key Regulator in Maintaining Skeletal Muscle Mass. Front. Physiol. 2017, 8, 788. [Google Scholar] [CrossRef] [Green Version]


| Characteristics | All Patients (n = 84) | Normal Gait Speed Group (n = 53) | Low Gait Speed Group (n = 31) | p Value |
|---|---|---|---|---|
| Age (years) | 45.45 ± 10.84 | 43.11 ± 10.26 | 49.45 ± 10.79 | 0.009 * |
| KT duration (months) | 77.00 ± 50.00 | 80.00 ± 48.00 | 72.00 ± 54.00 | 0.515 |
| Height (cm) | 161.20 ± 7.60 | 161.46 ± 7.60 | 160.74 ± 7.72 | 0.678 |
| Body weight (kg) | 63.38 ± 12.73 | 61.25 ± 10.01 | 67.02 ± 15.90 | 0.044 * |
| Body mass index (kg/m2) | 24.36 ± 4.47 | 23.48 ± 3.46 | 25.87 ± 5.56 | 0.017 * |
| Skeletal muscle index (kg/m2) | 15.99 ± 2.19 | 15.59 ± 1.79 | 16.68 ± 2.63 | 0.027 * |
| Left handgrip strength (kg) | 25.03 ± 8.54 | 25.88 ± 8.37 | 23.57 ± 8.78 | 0.233 |
| Right handgrip strength (kg) | 26.44 ± 9.33 | 27.59 ± 8.11 | 24.47 ± 10.97 | 0.140 |
| Gait speed (m/s) | 1.08 ± 0.21 | 1.21 ± 0.15 | 0.86 ± 0.10 | <0.001 * |
| Systolic blood pressure (mmHg) | 144.14 ± 18.66 | 146.02 ± 18.40 | 140.94 ± 18.98 | 0.231 |
| Diastolic blood pressure (mmHg) | 82.27 ± 10.30 | 83.79 ± 10.21 | 79.68 ± 10.09 | 0.077 |
| Hemoglobin (g/dL) | 11.91 ± 2.12 | 12.06 ± 1.97 | 11.66 ± 2.37 | 0.417 |
| Total cholesterol (mg/dL) | 189.09 ± 45.07 | 191.64 ± 38.14 | 184.74 ± 55.39 | 0.502 |
| Triglyceride (mg/dL) | 121.00 (89.25–166.75) | 112.00 (86.50–154.00) | 148.00 (97.00–206.00) | 0.029 * |
| Fasting glucose (mg/dL) | 96.00 (89.25–108.75) | 94.00 (88.00–106.00) | 100.00 (94.00–136.00) | 0.007 * |
| Blood urea nitrogen (mg/dL) | 24.00 (16.00–33.50) | 23.00 (15.00–28.00) | 26.00 (19.00–48.00) | 0.041 * |
| Creatinine (mg/dL) | 1.30 (1.00–1.80) | 1.30 (0.95–1.60) | 1.40 (1.10–2.10) | 0.109 |
| eGFRcre (mL/min/1.73 m2) | 58.63 ± 26.17 | 62.96 ± 25.23 | 51.22 ± 26.49 | 0.047 * |
| Cystatin C (mg/L) | 1.40 (1.07–1.87) | 1.26 (1.04–1.77) | 1.61 (1.22–2.20) | 0.015 * |
| eGFRcys (mL/min/1.73 m2) | 54.00 ± 25.99 | 59.87 ± 26.02 | 43.97 ± 23.03 | 0.006 * |
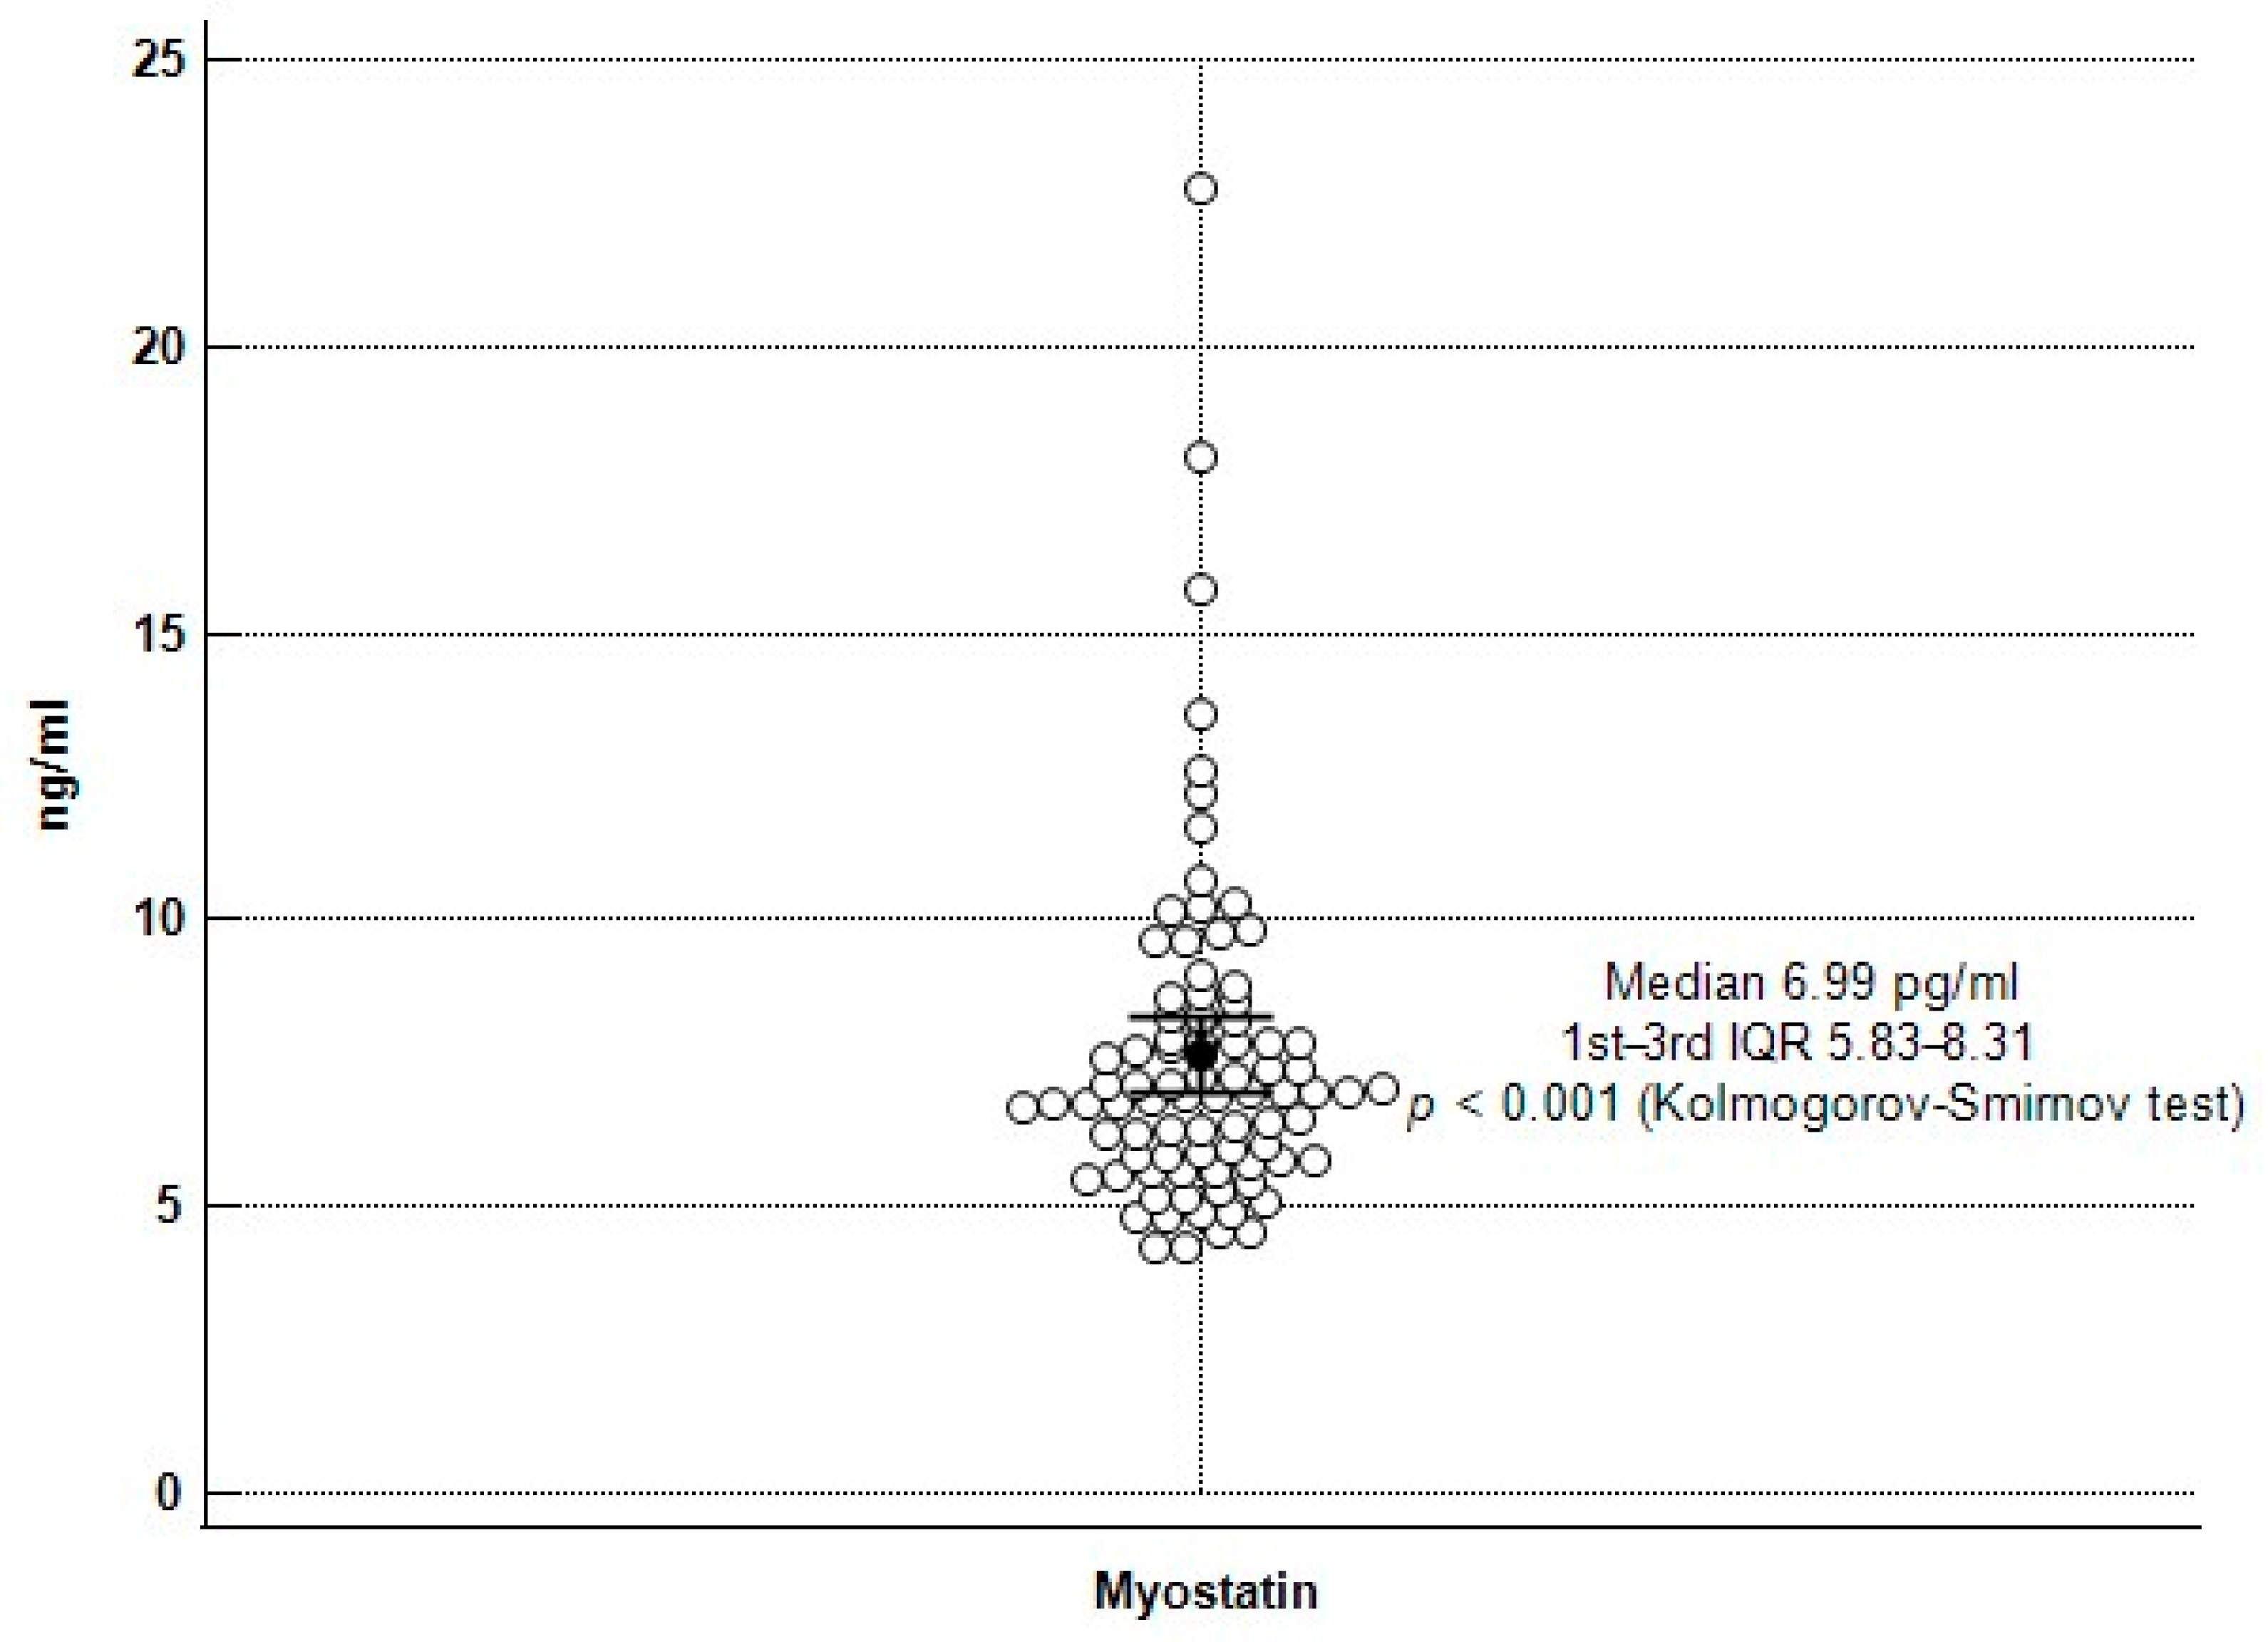
| Myostatin (ng/mL) | 6.99 (5.82–8.32) | 7.61 (6.39–9.73) | 6.26 (4.87–7.00) | <0.001 * |
| Albumin (g/dL) | 4.35 ± 0.18 | 4.37 ± 0.19 | 4.31 ± 0.18 | 0.222 |
| iPTH (pg/mL) | 91.15 (52.95–146.35) | 96.60 (56.08–132.63) | 83.60 (48.93–173.65) | 0.952 |
| Female, n (%) | 45 (53.6) | 30 (56.6) | 15 (48.4) | 0.466 |
| Diabetes mellitus, n (%) | 40 (47.6) | 26 (49.1) | 14 (45.2) | 0.730 |
| Hypertension, n (%) | 46 (54.8) | 28 (52.8) | 18 (58.1) | 0.642 |
| Living donor, n (%) | 18 (21.4) | 13 (24.5) | 5 (16.1) | 0.365 |
| Tacrolimus use, n (%) | 59 (70.2) | 34 (64.2) | 25 (80.6) | 0.111 |
| Mycophenolate mofetil use, n (%) | 54 (64.3) | 41 (77.4) | 13 (41.9) | 0.001 * |
| Steroid use, n (%) | 69 (82.1) | 40 (75.5) | 29 (93.5) | 0.037 * |
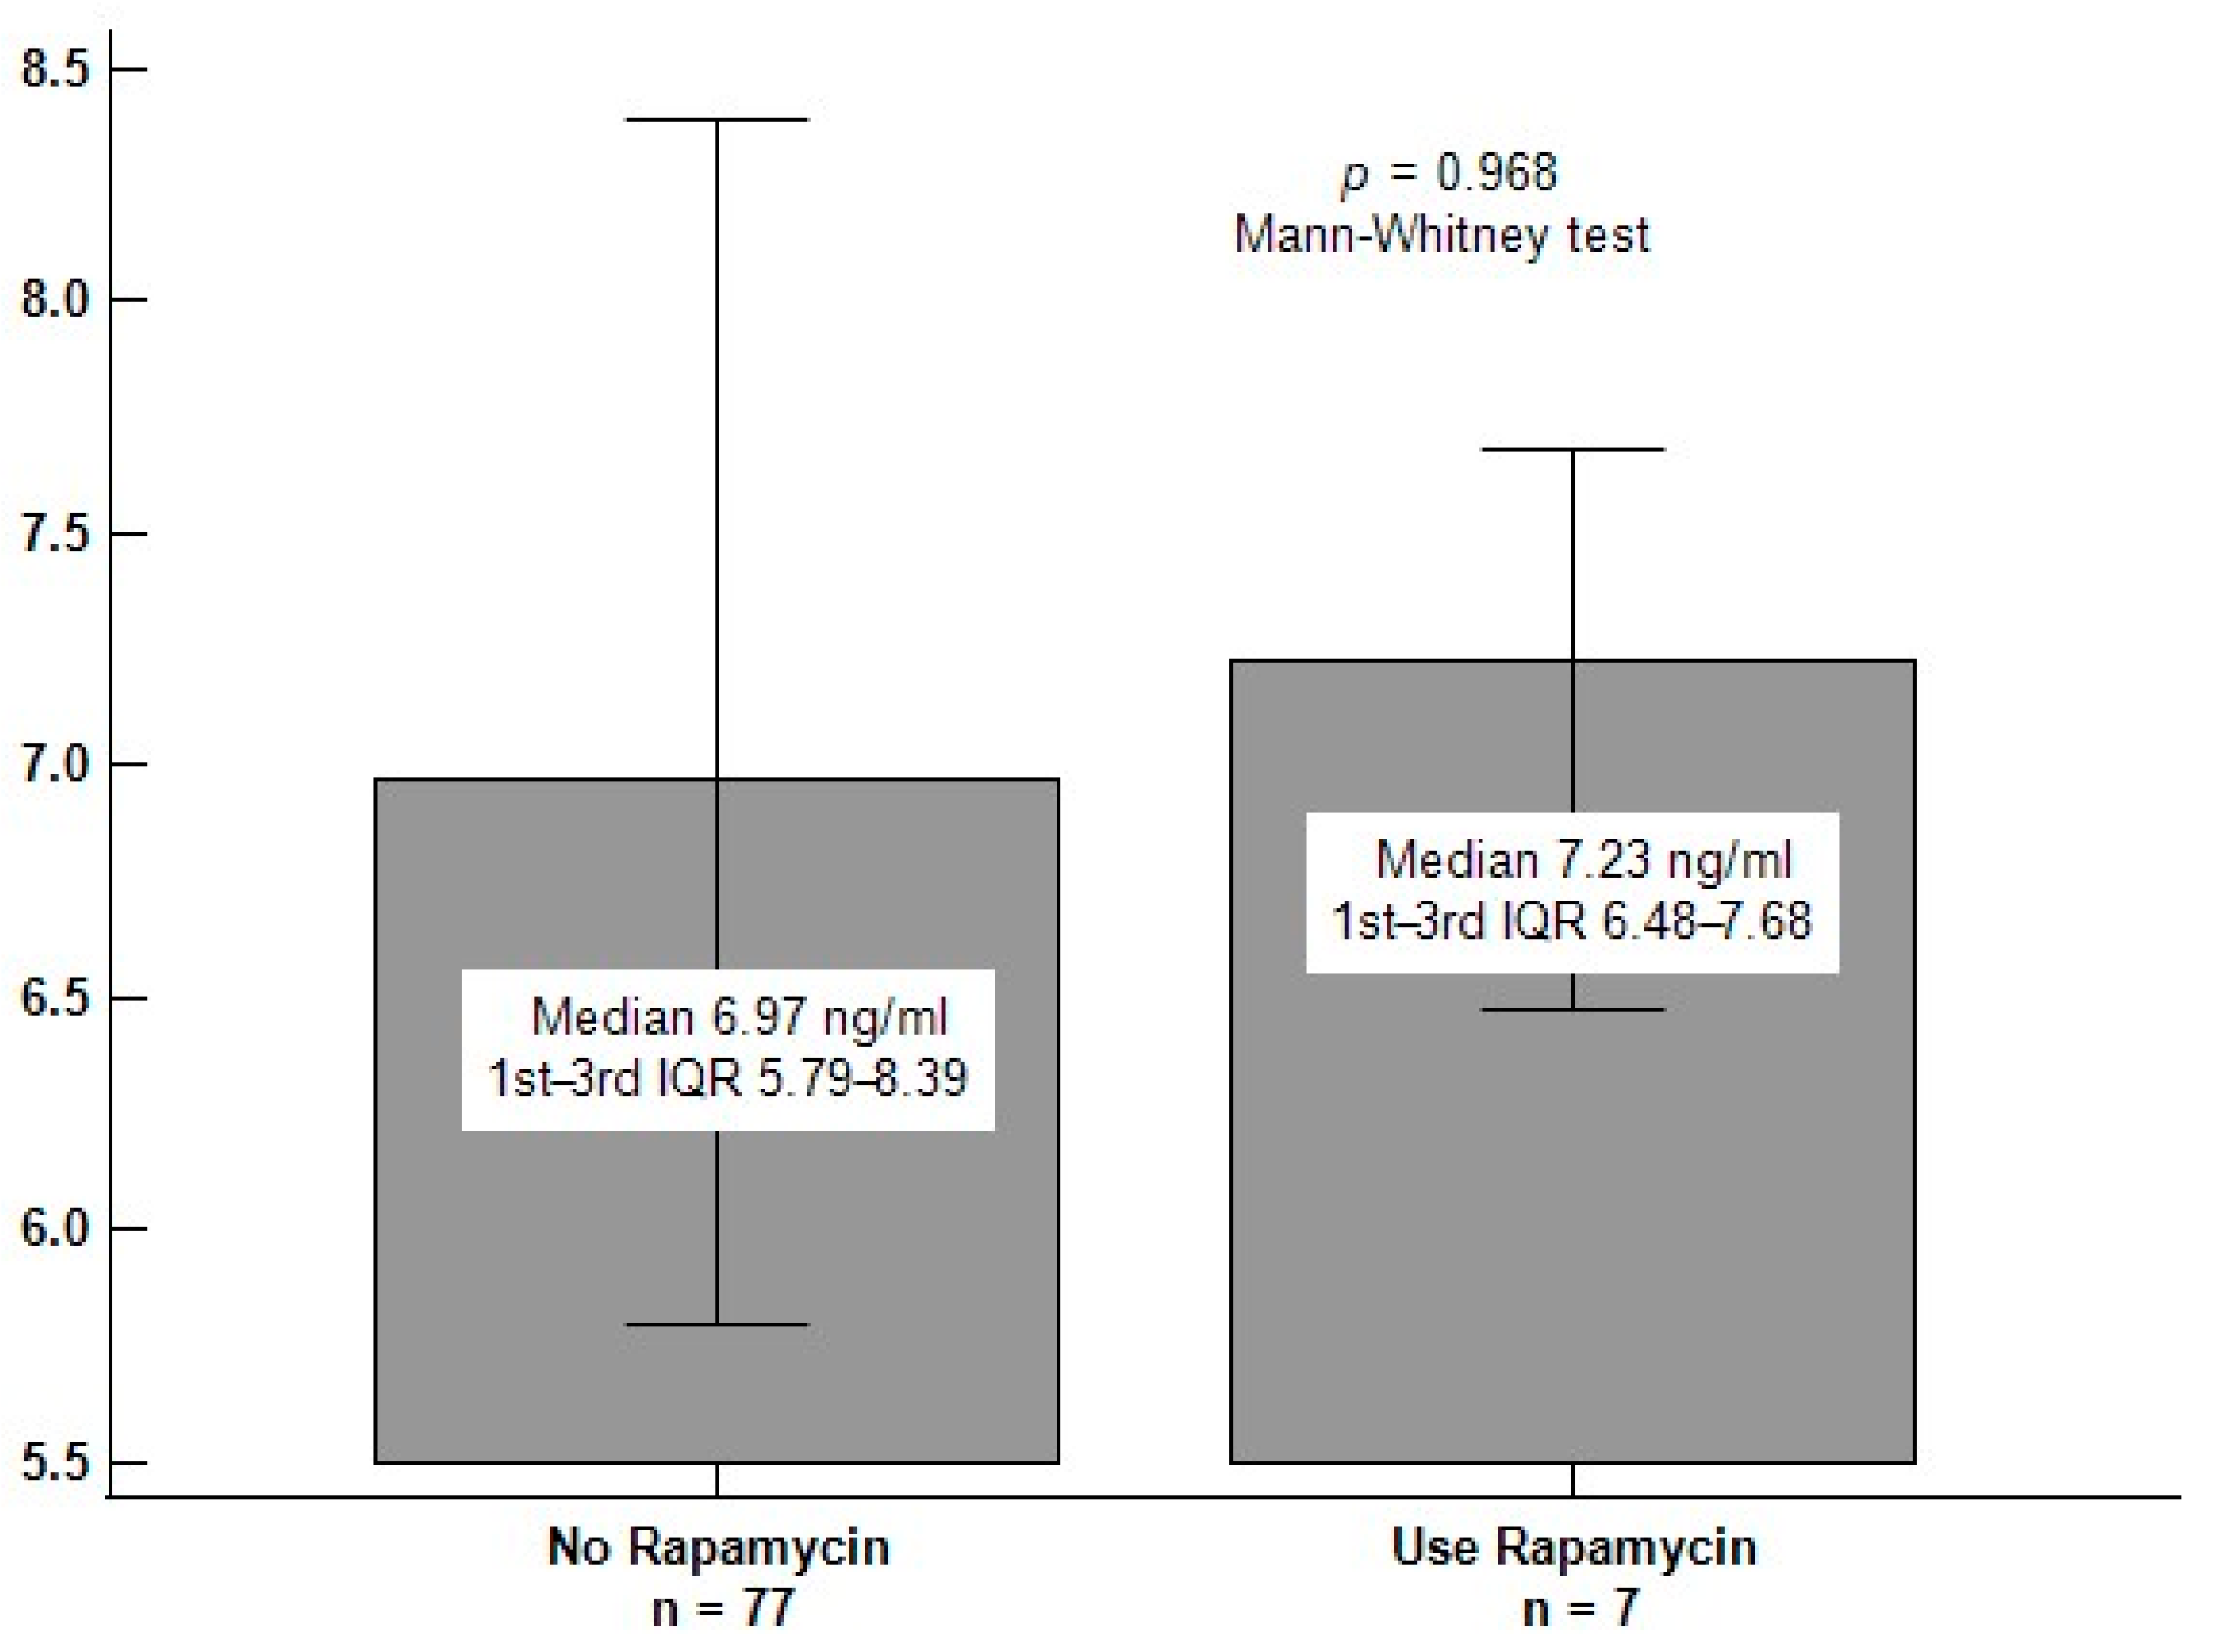
| Rapamycin use, n (%) | 7 (8.3) | 5 (9.4) | 2 (6.5) | 0.633 |
| Cyclosporine use, n (%) | 13 (15.5) | 9 (17.0) | 4 (12.9) | 0.618 |
| Statin use, n (%) | 32 (38.1) | 18 (34.0) | 14 (45.2) | 0.308 |
| Fibrate use, n (%) | 9 (10.7) | 5 (9.4) | 4 (12.9) | 0.620 |
| Variables | Odds Ratio | 95% Confidence Interval | p Value |
|---|---|---|---|
| Myostatin, 1 ng/mL | 0.538 | 0.327–0.883 | 0.014 * |
| Mycophenolate mofetil, used | 0.165 | 0.038–0.720 | 0.017 * |
| Age, 1 year | 1.043 | 0.973–1.118 | 0.234 |
| Body weight, 1 kg | 0.966 | 0.858–1.087 | 0.563 |
| Body mass index, 1 kg/m2 | 1.068 | 0.803–1.421 | 0.650 |
| Skeletal muscle index, 1 kg/m2 | 1.112 | 0.701–1.764 | 0.652 |
| Triglyceride, 1 mg/dL | 1.006 | 0.999–1.014 | 0.091 |
| Fasting glucose, 1 mg/dL | 1.009 | 0.987–1.031 | 0.439 |
| Blood urea nitrogen, 1 mg/dL | 0.993 | 0.911–1.083 | 0.879 |
| eGFRcre, 1 mL/min/1.73 m2 | 1.036 | 0.970–1.107 | 0.289 |
| Cystatin C, 1 mg/L | 1.631 | 0.256–10.400 | 0.605 |
| eGFRcys, 1 mL/min/1.73 m2 | 0.977 | 0.905–1.055 | 0.553 |
| Albumin | 0.180 | 0.003–9.829 | 0.401 |
| iPTH | 1.008 | 0.996–1.019 | 0.181 |
| Steroid, used | 0.716 | 0.081–6.314 | 0.763 |
| Variables | Gait Speed (m/s) | ||||
|---|---|---|---|---|---|
| Simple Regression | Multivariate Regression | ||||
| r | p Value | Beta | Adjusted R2 Change | p Value | |
| Age (years) | −0.348 | 0.001 * | −0.239 | 0.033 | 0.016 * |
| KT duration (months) | 0.030 | 0.785 | — | — | — |
| Height (cm) | 0.035 | 0.753 | — | — | — |
| Body weight (kg) | −0.298 | 0.006 * | — | — | — |
| Body mass index (kg/m2) | −0.338 | 0.002 * | −0.211 | 0.031 | 0.035 * |
| Skeletal muscle index (kg/m2) | −0.362 | 0.001* | — | — | — |
| Left handgrip strength (kg) | 0.025 | 0.821 | — | — | — |
| Right handgrip strength (kg) | 0.132 | 0.230 | — | — | — |
| Systolic blood pressure (mmHg) | 0.170 | 0.122 | — | — | — |
| Diastolic blood pressure (mmHg) | 0.208 | 0.058 | — | — | — |
| Hemoglobin (g/dL) | 0.103 | 0.353 | — | — | — |
| Total cholesterol (mg/dL) | 0.115 | 0.298 | — | — | — |
| Log-Triglyceride (mg/dL) | −0.218 | 0.047 * | — | — | — |
| Log-Glucose (mg/dL) | −0.232 | 0.032 * | — | — | — |
| Log-BUN (mg/dL) | −0.213 | 0.052 | — | — | — |
| Log-Creatinine (mg/dL) | −0.186 | 0.090 | — | — | — |
| eGFRcre (mL/min/1.73 m2) | 0.193 | 0.079 | — | — | — |
| Log-Cystatin C (mg/L) | −0.303 | 0.005 * | — | — | — |
| eGFRcys (mL/min/1.73 m2) | 0.296 | 0.006 * | — | — | — |
| Log-Myostatin (ng/mL) | 0.504 | <0.001 * | 0.355 | 0.245 | 0.001 * |
| Albumin (g/dL) | −0.007 | 0.949 | — | — | — |
| Log-iPTH (pg/mL) | 0.065 | 0.555 | — | — | — |
| Mycophenolate mofetil use | 0.246 | 0.024 * | — | — | — |
| Steroid use | −0.217 | 0.047 * | — | — | — |
| Rapamycin use | −0.023 | 0.834 | — | — | — |
| Cyclosporine use | 0.073 | 0.507 | — | — | — |
| Statin use | −0.149 | 0.177 | — | — | — |
| Fibrate use | −0.086 | 0.439 | — | — | — |
Publisher’s Note: MDPI stays neutral with regard to jurisdictional claims in published maps and institutional affiliations. |
© 2022 by the authors. Licensee MDPI, Basel, Switzerland. This article is an open access article distributed under the terms and conditions of the Creative Commons Attribution (CC BY) license (https://creativecommons.org/licenses/by/4.0/).
Share and Cite
Huang, P.-Y.; Tsai, J.-P.; Chen, Y.-C.; Lee, M.-C.; Hsu, B.-G. The Correlation of Serum Myostatin Levels with Gait Speed in Kidney Transplantation Recipients. Int. J. Environ. Res. Public Health 2022, 19, 465. https://doi.org/10.3390/ijerph19010465
Huang P-Y, Tsai J-P, Chen Y-C, Lee M-C, Hsu B-G. The Correlation of Serum Myostatin Levels with Gait Speed in Kidney Transplantation Recipients. International Journal of Environmental Research and Public Health. 2022; 19(1):465. https://doi.org/10.3390/ijerph19010465
Chicago/Turabian StyleHuang, Po-Yu, Jen-Pi Tsai, Yen-Cheng Chen, Ming-Che Lee, and Bang-Gee Hsu. 2022. "The Correlation of Serum Myostatin Levels with Gait Speed in Kidney Transplantation Recipients" International Journal of Environmental Research and Public Health 19, no. 1: 465. https://doi.org/10.3390/ijerph19010465
APA StyleHuang, P.-Y., Tsai, J.-P., Chen, Y.-C., Lee, M.-C., & Hsu, B.-G. (2022). The Correlation of Serum Myostatin Levels with Gait Speed in Kidney Transplantation Recipients. International Journal of Environmental Research and Public Health, 19(1), 465. https://doi.org/10.3390/ijerph19010465