Abstract
The aquaculture sector has experienced fast growth as a result of livelihood diversification initiatives among small-scale farmers in Tanzania. Regrettably, the dynamics of harmful algal blooms (HABs) have been overlooked despite the noticeable forcing of climate variability, the interaction between social-economic activities, and domestic water supply reservoirs. This study aimed at surveying the occurrence, experiences, and perceptions of HABs in aquaculture systems from stakeholders in the Ngerengere catchment, Morogoro, Tanzania. A cross-sectional survey focus group discussion (FDG), key informant interviews, and anecdotal observation were adopted. A convenient and purposive sample population was drawn from pond owners, registered water users, and government officials in the catchment. For data analysis, descriptive statistics and constant comparison were performed. Most respondents (95%) were able to recognize the image of blooms displayed. Approximately 70% of the respondents agreed that water quality has deteriorated over time, and blooms occur during the dry season. Further, 60% of the respondents agreed that water pollution is a serious problem attributed to sources other than industrial discharge. There was no consensus regarding the health impacts associated with HABs. Raising awareness on HABs is of paramount importance as it will provide the basis for the development of HABs management framework and health risk assessment.
1. Introduction
Harmful algae are photosynthetic and microscopic bacteria that are naturally occurring in marine and freshwater ecosystems [1]. Cyanobacteria produce secondary metabolites (toxins), for example, microcystins, cylindrospermopsin, anatoxins, and saxitoxins, which are harmful to fish, domestic animals, and humans [2]. In most cases, harmful algal blooms (HABs) and cyanobacterial harmful algal blooms (CyanoHABs) have been used interchangeably to describe cyanobacteria species that tend to produce toxins, alter the food web, or produce hypoxia. A current global discussion is on the dynamics of cyanobacterial HABs in freshwaters with a changing environment and climate change [3]. Brooks et al. [4] suggest that the magnitude, frequency, and duration of HABs are poorly understood and also HABs have received inadequate attention [5] and that this is a global problem [6].
Small-scale fish farmers (traditional fisheries) have been and will continue to be the most vulnerable to HABs besides challenges on startup capital, operating resources, and poor farming practices [7]. East Africa is an economical water scarcity area [8], and apart from that, there has been resistance in financing aquaculture projects [9]. Environmental factors such as land degradation, pollution (point and non-point sources), climate and hydrological variability, habitat loss (conversion of wetlands into fishponds) also add pressure on small-scale fisheries and the whole ecosystem. HABs in the Ngerengere catchment situated in Morogoro, The United Republic of Tanzania, are not well documented. A survey in the Wami Ruvu basin found water pollution to be a significant problem and recommended increasing awareness and ecotoxicological studies [10]. The implication can be evidenced in a social economic profile of the Morogoro region which itemized 10 most common causes of morbidity, including diarrhea and skin diseases, which are also symptoms of some cyanotoxins exposure [11]. A comparative study of microbial community in three clusters (pristine, urban, and agriculture) identified Cylindrospermopsis which is among the harmful algal-forming Cyanobacteria species [12].
In Tanzania, fish production statistics stands at 1% for aquaculture, 14% for marine, and 85% for inland (lakes, rivers, etc.) waters [13]. According to the Ministry of Livestock and Fisheries Development [13], Tanzania mainland aquaculture fish farmers increased from 3347 to 17,511 between the years 2000 and 2013 with a corresponding increase in number ponds from 4000 to 19930 and landed production from 200 to 2989.5 tons [14]. Thus, social-economic factors are critical for the intensification of fish farming in the region, which is mainly due to emphasis on extension education of farming practices to the practicing farmers [15] and technological improvements [9]. In a survey of the Morogoro region, despite efforts, aquaculture is still in a nascent stage and intensively operated by small-scale farmers [16].
The harmful impacts of environmental changes, such as climate change and weather variability on HABs dynamics and attendant effect on food security has received less attention, especially in the pursuit of sustainable development goals and the 2030 Agenda [4]. To our knowledge, no study has yielded findings on the awareness of HABs from water users in the catchment. Only a few cases have shown their concern about water quality standards for fishing and environment that are yet to be established [17,18]. Unfortunately, farmers cannot access water quality parameters to inform their decisions; rather, they rely on qualitative measures such as water source, color changes, effects on fish, and inability to locate markets [19]. For example, health effects are also perceived to be connected to low water quality by farmers [20]. With algal blooms, there are already reported cases [21]. A study in Ukerewe, an island in Lake Victoria, evidenced the health impacts of cyanobacteria-contaminated drinking water in the area [22]. One way to overcome the problem is to assess the occurrence, timing, and awareness of HABs and their health effects in the catchment through an interdisciplinary collaboration [23]. For this study, it was of interest to investigate how HABs are perceived (occurrence, extent, and timing) by water users, government workers (water sector), and small-scale fish farmers in Ngerengere catchment. Therefore, the objective of the current study is to survey the occurrence and perception of harmful algae in aquaculture systems in the Ngerengere catchment, a sub-catchment of the main Wami Ruvu basin located in the Morogoro region, the United Republic of Tanzania.
2. Materials and Methods
2.1. Study Area Description
The Ngerengere catchment is the sub-catchment of the main Wami Ruvu basin, located in the Morogoro region, Tanzania, within longitudes and latitudes of 37°32′ E 6°51′ S, 38°09′ E 6°69′ S, 37°38′ E 7°09′ S, and 38°38′ E 7°05′ S, respectively (Figure 1). It covers approximately an area of 2780 km2 and is characterized by a tropical climate [24]. Mindu Dam is the primary source of water and freshwater fishery supplies in the urban and peri-urban of Morogoro [25]. However, erosion and sedimentations due to human activities are more prominent challenges [26] and these have continuously reduced the depth of the Dam and Ngerengere River [27]. Water quality status and trends in the catchment have also been studied with an indication that there is significant pollution contributed by agriculture, domestic, and industrial activities [12,28,29,30,31]. Furthermore, recent work on chlorophyll-a and variations in climate and hydrology has highlighted some possible causes of HABs in the catchment [32].
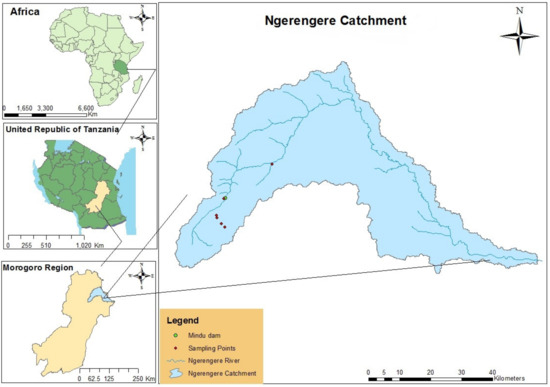
Figure 1.
Study area map (adapted with permission from Kimambo et al. [33]).
2.2. Study Design
The current study consisted of mixed methods (observation, focus group discussion, questionnaires, and key informant interviews). The approach has been found to be helpful, especially in research that lacks a body of research [20,34], the present study being the case. A pre-tested questionnaire coded both in English & Kiswahili languages was uploaded into SurveyCTO an open data kit (ODK)-based (available at https://www.surveycto.com/index.html, accessed on 5 October 2017), and android-assisted application to gather the required information. The questionnaire had three sections designed to collect social-demographic information and knowledge (which consists of how HABs appear, causes, threats, experiences of the respondents in the study area on pollution and water quality, HABs, and their management or control measures). Before embarking on field surveys, the questionnaire was pretested and validated in an area close to the study area. This was an expert-driven pretesting, that tested the flow, order, timing and language navigation (English to Kiswahili). It was done by comparing answers from one pretest and another. The aim was to identify problems with questions or response options in the survey.
The sample size conveniently and purposively consisted of 31 respondents from small-scale fish farms, officials of the Morogoro Urban Water Supply Authority (MORUWASA), Wami Ruvu Basin Office (WRBO), and the registered water users (the list of water users was obtained from WRBO). Since the study consulted experienced personnel in the catchment, the sample size was theoretical as in Gholami et al. [35] (i.e., “10–30 expert opinion for a decision making group would be an effective”), who assessed environmental risk assessment of harmful algal blooms. Additionally, five key informants were from Morogoro districts and the deputy director of Tanzania Fishery Institute was contacted. Along with that, two focus group discussions with five participants each and one meeting with MORUWASSA officials were held. During field campaigns (October 2017, February 2018, May 2018, and August 2018, which aimed to conduct water sampling and in situ findings), several reservoirs were visited for the visual identification/observation of blooms. Since pond size has a significant impact on production and management but also the quality and size of the fish [9], we focused on fish farmers whose pond sizes measure at least 100 m2 on the basis of the previous studies [15]. Some livelihood activities (agriculture and fishing) in upstream settlements and erosion have been observed in the catchment [36]. Mindu Dam (a reservoir for domestic water supply) was included in an attempt to capture such interactions and their possible causes.
2.3. Socio-Economic Status
The Ngerengere catchment has an estimated population of over one million people [36]. A recent survey [37] on the Wami Ruvu basin noted industries, agriculture, mining, and settlement as the critical socio-economic and livelihood activities. The survey further elucidated that pollution (point and non-point sources), increased demand for water uses in agriculture, and increased urban population triggers water-scarce conditions at times in the catchment. A project jointly led by Global Water for Sustainability, Florida International University (GLOWSFIU) and Wami Ruvu basin office on water quality [29] noted conflicts between downstream and upstream water users on water quality in the basin. In history, the Morogoro region was considered an ordinary town in Tanzania and possibly in a more considerable part of Africa [38], due to the location along the major transport routes (roads and train to other mainland towns), the status of being one of the selected towns for concentrated urban development, the closeness to the business city Dar es Salaam, and the area of potential for agricultural development. In Morogoro, the number of fish farms have recently increased mainly due to diversification of livelihoods and local markets [39,40,41].
2.4. Data Analysis
Data were downloaded from the computer server provided by the SurveyCTO in Microsoft Excel format and transferred for further analysis. Since the study adopted digital data collection, the service provider (SurveyCTO) offers features of quality control from forms/questionnaire design, data collection, monitoring and transferring from server to an intended statistical analysis package. Images of blooms, mat, and foam-like from field observations were presented as captured. The study adopted a content analysis [34] approach for analyzing the qualitative information. Jeffreys’s Amazing Statistics Program (JASP) computer software (version 0.9.0 of 2018) was used to produce descriptive plots and Chi-Square tests statistics for drawing inferential statements. The description of the significance and interpretation of the results in all the tables (VS-MPR) was adopted from [42]. The choice of JASP considered it is potentials over other tools, for example, it is a simple, attractive graphical user interface, freely available and open-source computer program but also as demonstrated in the previous studies [43,44,45].
2.5. Ethical Consideration
An ethical clearance certificate with reference number SES/17/ERM/09/2006 was issued by the Research Ethics Committee (REC) in the Directorate of Research & Innovation of the University of Venda, Limpopo, South Africa.
3. Results
3.1. Respondents General and Experiences
This subsection presents information about gender, marital status, education, and number of years the respondents stayed in the study area.
In the current study, significantly (respectively, p = 0.007; p= 0.002, Table 1), most respondents were male and married (see the proportion in Figure 2A,B).

Table 1.
Gender and marital status multinomial test.
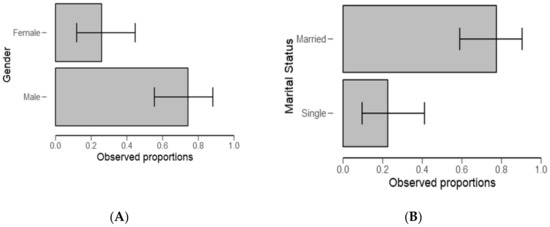
Figure 2.
Gender (A) and marital status (B) descriptive plots for all the respondents.
From Table 2, significantly (p < 0.01) of the examined categories, respondents (59%) stayed in the study area for about 5 to 10 years (Figure 3A) and 37% had high levels (p < 0.05) of education (Figure 3B and Table 2). Furthermore, a higher number of respondents (59%) were employed (Figure 4A and Table 3) (p < 0.05) and they were “very well” informed about water problems in the study area (Figure 4B) (p = 0.002, Table 3).
Table 2.
Years stayed in the region and education level multinomial test.
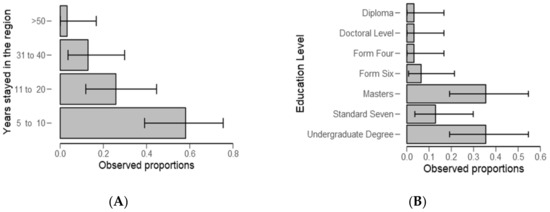
Figure 3.
Descriptive plots for number of years respondents stayed in the study area (A) and education level (B).
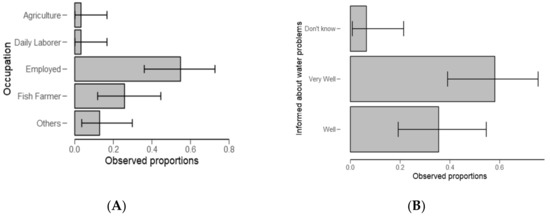
Figure 4.
Descriptive plots for occupation (A) and how informed the respondents are about water problems in the Ngerengere catchment (B).
Table 3.
Occupation and how the subject is informed about the water problem multinomial test.
3.2. Water Quality and Algal Bloom Formation
Asked about whether water problems in the region are serious or not serious, respondents (70%) collectively agreed that water problems in the catchment are “serious” (Figure 5A). The findings also suggest that 49% of the respondents noted no change in water quality, with 40% who affirmed that water quality has deteriorated over time (p < 0.05) (Figure 5B and Table 4).

Figure 5.
Descriptive plots of water problems (A) and quality over time (B).
Table 4.
Water problem and quality over time multinomial test.
In Figure 6 we describe the results from multiple response options on “what could be the reasons for poor water quality”. Here overuse of water for agriculture ranked higher (60%) than other responses.

Figure 6.
Ranks (response in %) for the reasons of poor water quality in the study area.
When asked about the major threats, pollution ranked high (60%) followed by water shortage and climate change, which altogether accounts for 50% of the respondents (Figure 7).

Figure 7.
Ranks for the major threats as perceived by the respondents.
The test statistics revealed that respondents were highly aware (>95%) of algal blooms feature (Figure 8A). Herein, the algal bloom image was displayed to the respondent for recognition during the survey (Table 5). It was further observed that respondents collectively agreed that blooms usually occur once in a season and during the dry season (Figure 8B).
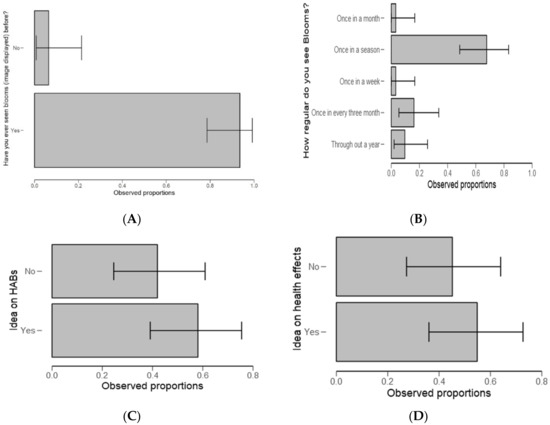
Figure 8.
Descriptive plots for harmful algal blooms (HABs) recognition (A), how regular do blooms occur (B), idea/aware on HABs (C) and the idea/aware of HABs health effects (D).
Table 5.
Respondents understanding of HABs multinomial test.
When asked about any idea on HABs in the ponds/dam or river (Figure 8C) and any idea about health effects associated with algal blooms (Figure 8D), there was no significant difference between the groups (p = 0.369 and p = 0.590, respectively).
From Figure 9A, respondents collectively agreed that sometimes there is a noticeable discharge from the industries, and sometimes they see crystal-clear water (Figure 9B). It was further found that collectively, respondents agreed sometimes they see algal blooms limited with clarity odor apparently (Figure 9C). Otherwise, there was no significant difference between the groups (Figure 9D) when asked about documenting discharge history (Table 6). Moreover, most respondents (52%) agreed to have seen the severity of algal blooms (Figure 10) and dead fish (Table 6).

Figure 9.
Aspects tested in recognition of HABs formation and their course in water. (A): Sometimes I see a noticeable discharge from industries; (B): Sometimes I see clear crystal water(C): Sometimes I see algal blooms with limited clarity and odour apparent (D): Sometimes we document history of discharge.
Table 6.
Multinomial test for several aspects tested for recognition of blooms.

Figure 10.
Ranks on whether sometimes an object sees the severity of algal blooms and dead fish.
When the respondents were asked about measures in place to control measures of HABS, 35% noted that no treatment method is applied (Figure 11), followed by filtering and a chemical treatment (both scored same proportion of 32%).
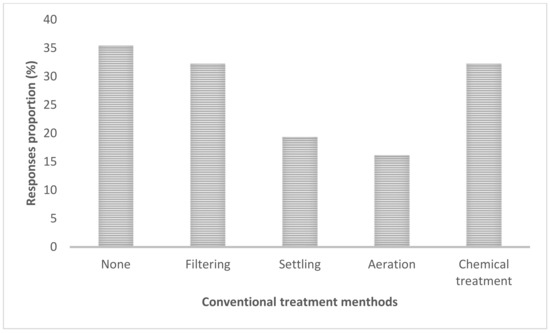
Figure 11.
The conventional methods for HABs control.
3.3. Field Observation
In the present study, several images/plates of blooms were taken from different reservoirs during field excursion, and that is presented as captured.
4. Discussion
4.1. Demographic Features
Most ponds activities, including monitoring and fishing, are performed by men (Table 1 and Figure 2). The results provide evidence to the prevailing point of view that gender inequalities are common in the fishery sector and consistent with the previous studies [46,47]. Regarding experience, most respondents have stayed in the study area for a period ranging from 5 to 10 years (Table 2). This may not have affected study findings because the current study design targeted people who regularly intermingle with water users, authorities, small-scale fish farmers, and experts. The findings are in line with the previous study wherein the same were also observed in Kilombero by Kangalawe [48], which is a district neighboring the study area, and in the same fish farming livelihood activity. These findings raise a concern about gender participation in fish farming, and in the context of our study, men might be more exposed to a risks associated with the presence of harmful algal blooms.
4.2. Perceived Water Quality Over Time
In the present study, respondent were very well informed about water problems (Table 3) but also out of the tested groups (serious or not serious) respondents (70%) collectively agreed that water problems in the catchment are “serious” (Figure 5A), and this dovetails nicely with the previous surveys (e.g., [37]). Regarding water quality and algal bloom formation, the National Water Sector Development Strategy of 2006–2015 stresses the links between water quality and fisheries but also the impact of pollution on fisheries [49]. In this report, water-use conflicts between downstream and upstream communities were evident. A similar pattern of results was obtained, for example, during the experts’ interview, water quality was eyed as an issue of concern (Moshi, M, personal communication, 7 August 2018). Furthermore, 49% of the respondents noted that there was no change in water quality over the years (Figure 5B), with 40% who affirmed that water quality has deteriorated over time (p < 0.05) (Table 4). These results demonstrate the high degree of uncertainty over water quality changes. This triangulation implies a need for interventions in the catchment and to refine study by getting more audience.
Figure 6 shows that overuse of water for agriculture (mostly paddy and maize as per observation and the national survey [50]) scored high, followed by nutrients loads and industrial effluents. This was confirmed during the key informant interviews, which revealed that controlling agricultural activities upstream of Mindu dam is lacking (Angumbwike, N. personal communication, 29 August 2018). Regarding the possible threats in the study area, from Figure 7, for example, increase in pollution ranked the highest (60%) followed by water shortage and climate change, which altogether accounted for 50% of the respondents, and these were broadly in line with the observation of World Bank [51]. Others also cited algal growth as a problem, although the rating was lower than other options, but this could be attributed to low and lack of awareness on HABs dynamics.
In testing on knowledge on algal blooms, the results demonstrate two things. Firstly, respondents were highly aware (Figure 8A and Table 5) of how algal blooms appear (when a photo of algal bloom were displayed for recognition). Secondly, respondents collectively agreed that blooms usually occur once in a season with most of them referring to the dry season (Figure 8B); likewise for the focus group discussions (FGD), and the interviews. The results indicates the best timing for studying HABs occurrence and mobility, however, HABs can form any time of the year as in [52]. The results corroborate the findings of [53] on tropical cyanobacteria blooms and the verbatim comments from the respondents in clarifying the season as a factor in algae blooming: “green algae blooms in Mindu Dam proliferate mostly during the dry season”. Therefore, the responses inform the best timing for the planning of pre- and post-management/control of HABs.
4.3. Perceptions of HABs on Health Effects
It is widely accepted that some species of harmful algal blooms can cause skin irritations [54,55]. During a focus group discussion with the fish farmers, it was revealed sometimes that they (the farmers) had experienced the same. For example, one interviewee pointed out that they must have soap with them and change clothes because they normally feel skin irritation just after fishing (Raphael, I., personal communication, 10 August 2018).
From the interviews, we speculate that the irritation of skin might be associated with algal bloom effects or it could be other factors. This implies that there is a need for further investigation and implementation of public health awareness rising on the effects of HABs apparently. It is with regret that guidelines are yet to be developed in Tanzania. To verify the concern in the previous studies [17,18], in a key informant interview, there was a claim that current guidelines and standards for the management of algal blooms are yet to be in place (Maly, R., personal communication, 7 August 2018). These primary findings are consistent with the previous study, which shows that the issue of HABs is not well addressed in policies and guidelines [18]. Similarly, a recent review noted that there are still questions that need to be answered, especially on policies and ecosystem change with climate change and population increase [46].
During the key informant interviews, some noted the policy gap and agreed that conservation training and awareness-raising are considered as an immediate solution for managing harmful algal blooms. Verbatim comments commended the current study in the catchment; for example, “this project will help us identify problems of water quality in the catchment” (Angumbwike, N., personal communication, 29 August 2018). These observations are in line with the study by van der Heijde et al. [56].
This also agreed with most respondents’ verbatim comments that there is a need to raise awareness but also proposing an intervention strategy. These findings pose concerns about policy and practices on the fishery and the environment. When respondents asked about any idea on HABs in the ponds/dam or river (Figure 8C) and any idea about health effects associated with algal blooms (Figure 8D), there was no significant difference among groups (Yes/No). The results also highlight that little is known about HABs and as well as health effects associated with algal blooms. Furthermore, during the interviews and the FGD, the same uncertainty featured; for example, a statement made by one of the interviewees that “some species of algae could be toxic, but not sure.” (Dunia Mlanzi, Personal Communication 6 August 2018).
These findings are similar to observations that have been reported in the previous surveys and most important in a developed world whereby 60% of fishermen in Southern Louisiana did not know what HABs mean [57]. Extension services seem to be a key constraint for Tanzania farmers as the issue features in many reports [56,58]. These findings stress concerns about programs to increase awareness that need to be addressed either through training and more from extensions services.
In order to verify the respondent’s concerns on the link between water quality problem and any observed ecological responses, using Likert scale questions (Figure 9A, Table 6), respondents collectively agreed that sometimes there is a noticeable discharge from the industries. Respondents agreed that they sometimes see crystal-clear water (Figure 9B). They also agreed sometimes they see algal blooms limited with clarity odor apparently (Figure 9C). On the other hand, there was no significant difference among groups (Figure 9D) when asked about documenting discharge history (Table 6). Moreover, most respondents (52%) agreed to have seen the severity of algal blooms (Figure 10) and dead fish (Table 6). When comparing our results to those of earlier studies, similar observations were made; for example, fishes dying because of polluted water as in Niang [37]. This may alter or improve aspects of the monitoring of HABs in the catchment.
4.4. Harmful Algal Blooms Management and Control
Regarding the conventional control measures of HABs, 35% of respondents said no treatment method is applied (Figure 11), followed by filtering and chemical treatment (both scoring 30%). Herein the design (i.e., asking multiple-choice questions) utilized was meant to probe more reactions from the respondents. As a part of management, it was interesting to note during the focus group discussion and interviews that farmers use hand palm mimicking Secchi disk (for Secchi disk depth) technique for monitoring the turbidity in their fishponds. Water is added into the pond if they cannot see the palm of their hand, baseline being the Elbow. During FDG farmers brought to the table an issue of reduced yield, specifically fish sizes being small as compared to large lakes fishes. As an intervention, farmers at times make use of chalk lime before introducing fingerlings or just after fishing: “Chalked lime is applied (Chokaa in Kiswahili) to the fishpond before introducing Fingerlets and just after harvesting” (Mlegu, D., personal communication, 10 August 2018).
This dovetail well with the principle understanding that some other fishponds management techniques, for example, the use of lime have been tested for sterilization, nutrient enrichment, and for regulating pH changes [59].
In the present study, field images/observations agree with respondents’ comments and key informant interviews. For example, the key informant interview pointed that blooming occur mostly during the dry season (July, August, September, October, and November) (Angumbwike, N, personal communication, 29 August 2018). The difference in blooming (i.e., mat, bloom and foam-like) and the difference in colors in (Figure 12A–D) requires more studies in the catchment.
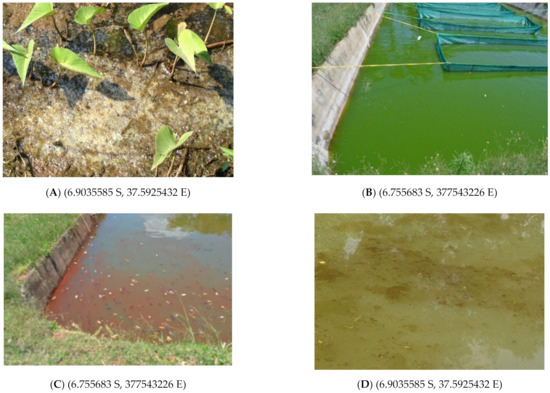
Figure 12.
Visible foam-like algae as observed at Konga, Kidangawa (A), Greenish colorations as observed at Kingolwira fishponds (B); next to it is red algae (C), and finally mat-like algae as observed at Konga, Kidangawa (D). Specific location, i.e., latitude and longitudes, in the brackets (photos by the author during the survey).
5. Conclusions
This study aimed to investigate the occurrence and perception of harmful algal blooms in the Ngerengere catchment in Morogoro, Tanzania. The findings confirm that respondents are very well informed about the problems of water quality and the reasons for the cause, such as overuse of water for agriculture, and nutrients. Respondents were able to identify algal blooms when an image of bloom displayed to them and they collectively agreed that algal bloom proliferates more during the dry seasons (June to September and sometimes in January to February). That tallied with the anecdotal observations which showed the occurrences of algal blooms of all forms (bloom, mat, and foam-like) and that some had a red hue. On the other hand, there was no consensus regarding the health effects associated with HABs. In addition, respondents collectively agreed that they sometimes see the severity of algal blooms and dead fish. The findings challenge policymakers, technical specialists (e.g., medical practitioners), and researchers together to address problems associated with algal blooms, specifically HABs. The findings provide a basis for the development of HABs management framework (i.e., education and extension programs, identification, monitoring, and control). While the present study provides useful insight about HABs in Ngerengere catchment, the implication may be specific to the study area. Since the sample size was small and specific to stakeholders around the Upper catchment of Ngerengere, the results may reflect only the people of urban Morogoro. Future researches should consider monitoring environmental conditions, toxic strains identification, and their mobility. There is a need to obtain wider scale results that are representative of the whole country.
Author Contributions
For research articles with several authors, the following statements should be used “Conceptualization, O.N.K.; methodology, O.N.K.; software, O.N.K.; validation, O.N.K.; formal analysis & investigation, O.N.K.; resources, O.N.K.; data curation, O.N.K.; writing—original draft preparation, O.N.K.; writing—review and editing, T.A.M.M. and H.C.; visualization, O.N.K.; supervision, J.R.G., H.C. and T.A.M.M.; project administration, J.R.G.; funding acquisition, J.R.G. All authors have read and agreed to the published version of the manuscript.
Funding
The study received funding from the University of Venda, Limpopo, South Africa (Project Number SES/17/ERM/14).
Institutional Review Board Statement
The study protocol was approved by the University of Venda, Research Ethics Committee on the 26 June 2017 (Reference SES/17/ERM/09/2006).
Informed Consent Statement
Informed consent was obtained from all the objects involved in the study.
Data Availability Statement
Data used (as guided by the ethical clearance) to support the findings of this study are available from the corresponding author upon request.
Acknowledgments
We acknowledge the Tanzania Government through the Ministry of Water and Irrigation, Sokoine University of Agriculture (SUA), MORUWASA, WRBO, Morogoro Regional, Districts, and Wards administrations area for their administrative procedures and the fish farmers for availing themselves during the research period. Thanks to Abdulkarim Mhandeni for his English-Kiswahili translation of the questionnaire. We also acknowledge an open-data kit-based by SurveyCTO group for utilizing their tool.
Conflicts of Interest
The authors declare that they have no conflict of interest.
References
- Glibert, P.M.; Berdalet, E.; Burford, M.A.; Pitcher, G.C.; Zhou, M. Harmful Algal Blooms and the Importance of Understanding Their Ecology and Oceanography. In Global Ecology and Oceanography of Harmful Algal Blooms; Springer International Publishing AG: Berlin/Heidelberg, Germany, 2018; pp. 9–25. [Google Scholar]
- Testai, E.; Buratti, F.M.; Funari, E.; Manganelli, M.; Vichi, S. Review and analysis of occurrence, exposure and toxicity of cyanobacteria toxins in food. EFSA Support. Publ. 2016, 13. [Google Scholar] [CrossRef]
- Anderson, D. HABs in a changing world: A perspective on harmful algal blooms, their impacts, and research and management in a dynamic era of climactic and environmental change. In Proceedings of the 15th International Conference on Harmful Algae, Changwon, Korea, 29 October–2 November 2012; pp. 3–17. [Google Scholar]
- Brooks, B.W.; Lazorchak, J.M.; Howard, M.D.; Johnson, M.-V.V.; Morton, S.L.; Perkins, D.A.; Reavie, E.D.; Scott, G.I.; Smith, S.A.; Steevens, J.A. Are harmful algal blooms becoming the greatest inland water quality threat to public health and aquatic ecosystems? Environ. Toxicol. Chem. 2016, 35, 6–13. [Google Scholar] [CrossRef] [PubMed]
- Food and Agriculture Organization of the United Nation. National Fishery Sector Overview; Food and Agriculture Organization of the United Nation: Geneva, Switzerland, 2007. [Google Scholar]
- Paerl, H.W.; Otten, T.G. Duelling ‘CyanoHABs’: Unravelling the environmental drivers controlling dominance and succession among diazotrophic and non-Nitrogen -fixing harmful cyanobacteria. Environ. Microbiol. 2016, 18, 316–324. [Google Scholar] [CrossRef] [PubMed]
- Pomeroy, R. A research framework for traditional fisheries: Revisited. Mar. Policy 2016, 70, 153–163. [Google Scholar] [CrossRef]
- WorldFish. The Threat to Fisheries and Aquaculture from Climate Change; WorldFish Center: Penang, Malaysia, 2007; Available online: http://pubs.iclarm.net/resource_centre/ClimateChange2.pdf (accessed on 28 July 2018).
- Kaliba, A.R.; Osewe, K.O.; Senkondo, E.M.; Mnembuka, B.V.; Quagrainie, K.K. Economic Analysis of Nile Tilapia (Oreochromis niloticus) Production in Tanzania. J. World Aquac. Soc. 2006, 37, 464–473. [Google Scholar] [CrossRef]
- Global Water for Sustainable Program Florida International University (GLOWSFIU). Environmental Flow Recommendations for the Ruvu River Basin; GLOWSFIU: Miami, FL, USA, 2014. [Google Scholar]
- Sanseverino, I.; Conduto, D.; Pozzoli, L.; Dobricic, S.; Lettieri, T. Algal Bloom and Its Economic Impact; European Commission: Ispra, Italy, 2016. [Google Scholar] [CrossRef]
- Mushi, D. Bacterial Community Structure and Composition of Tropical River and Drinking Water—Insights from deep Sequencing and Correlation to Environmental Drivers; Technical University Braunschweig (TUB): Braunschweig, Germany, 2015. [Google Scholar]
- The United Republic of Tanzania. The Tanzania Fisheries Sector Challenges and Opportunities; Dar es Salaam, Tanzania. 2016. Available online: https://tanzania.um.dk/~/media/tanzania/documents/businesssector/thetanzanianfisheriessector-challengesandopportunities.pdf?la=en (accessed on 31 March 2021).
- The United Republic of Tanzania. Basic Data for Livestock and Fisheries Sectors; Dar es Salaam, The United Republic of Tanzania, 2013a. Available online: https://africaopendata.org/dataset/944c8373-f0b0-4c5e-ba80-ece7e8c8874e/resource/b0f1f3e4-efdb-44ff-be51-757349c838a7/download/livestock-and-fisheries-basic-data-1.pdf (accessed on 31 March 2021).
- Wetengere, K. Socio-economic factors critical for intensification of fish farming technology. A case of selected villages in Morogoro and Dar es Salaam regions, Tanzania. Aquac. Int. 2011, 19, 33–49. [Google Scholar] [CrossRef]
- Breuil, C.; Grima, D. Baseline Report Tanzania. SmartFish Programme of the Indian Ocean Commission; Fisheries Management FAO component: Ebene, Mauritius, 2014. [Google Scholar]
- Hawkins, P. National Water Quality Management and Pollution Control Strategy; Dar es Salaam, Tanzania. 2010. Available online: http://extwprlegs1.fao.org/docs/pdf/tan169533.pdf (accessed on 29 October 2018).
- Miraji, H.; Othman, O.; Ngassapa, N.; Mureithi, W. Research Trends in Emerging Contaminants on the Aquatic Environments of Tanzania. Sci. Hindawi Publ. Corp. 2016, 2016, 1–6. [Google Scholar] [CrossRef]
- Withanachchi, S.S.; Kunchulia, I.; Ghambashidze, G.; al Sidawi, R.; Urushadze, T.; Ploeger, A. Farmers’ perception of water quality and risks in the Mashavera River Basin, Georgia: Analyzing the vulnerability of the social-ecological system through community perceptions. Sustainability 2018, 10, 3062. [Google Scholar] [CrossRef]
- Mayilla, W.; Keraita, B.; Ngowi, H.; Konradsen, F.; Magayane, F. Perceptions of using low-quality irrigation water in vegetable production in Morogoro, Tanzania. Environ. Dev. Sustain. 2017, 19, 165–183. [Google Scholar] [CrossRef]
- Aziza, H.S.; Flower, E.M.; Margareth, S.K.; Aviti, J.M.; Evalyn, W.M.; Eystein, S.; Helena, A.N.; Jan, L.L. Health problems related to algal bloom among seaweed farmers in coastal areas of Tanzania. J. Public Health Epidemiol. 2018, 10, 303–312. [Google Scholar] [CrossRef]
- Mchau, G.J.; Makule, E.; Machunda, R.; Gong, Y.Y.; Kimanya, M. Harmful algal bloom and associated health risks among users of Lake Victoria freshwater: Ukerewe Island, Tanzania. J. Water Health 2019, 17, 826–836. [Google Scholar] [CrossRef] [PubMed]
- Van Dolah, E.R.; Paolisso, M.; Sellner, K.; Place, A. Employing a socio-ecological systems approach to engage harmful algal bloom stakeholders. Aquat. Ecol. 2016, 50, 577–594. [Google Scholar] [CrossRef] [PubMed]
- Gomani, M.; Dietrich, O.; Lischeid, G.; Mahoo, H.; Mahay, F.; Mbilinyi, B.; Sarmett, J. Establishment of a hydrological monitoring network in a tropical African catchment: An integrated participatory approach. Phys. Chem. Earth Parts 2010, 35, 648–656. [Google Scholar] [CrossRef]
- Mdegela, R.H.; Braathen, M.; Pereka, A.E.; Mosha, R.D.; Sandvik, M.; Skaare, J.U. Heavy Metals and Organochlorine Residues in Water, Sediments, and Fish in Aquatic Ecosystems in Urban and Peri-Urban Areas in Tanzania. Water. Air. Soil Pollut. 2009, 203, 369–379. [Google Scholar] [CrossRef]
- Natkhin, M.; Dietrich, O.; Schäfer, M.P.; Lischeid, G. The effects of climate and changing land use on the discharge regime of a small catchment in Tanzania. Reg. Environ. Chang. 2015, 15, 1269–1280. [Google Scholar] [CrossRef]
- Yanda, P.Z.; Munishi, P.K.T. Hydrologic and Landuse/Cover Change Analysis for the Ruvu River (Uluguru) and Sigi River (East Usambara) Watersheds; WWF/CARE: Dar es Salaam, Tanzania, 2007. [Google Scholar]
- Ngonyani, C.J.; Nkotagu, H.H. Study of nutrient pollutants and their impacts on the water quality of the Mindu reservoir at Morogoro Municipality. Tanzan. J. Eng. Technol. 2007, 1, 138–148. [Google Scholar]
- GLOWSFIU. Water Quality Survey, Ruvu River Basin, Tanzania; Global Water for Sustainability Program, Florida International University: Miami, FL, USA, 2014. [Google Scholar]
- Ngoye, E.; Machiwa, J.F. The Influence of Land-Use Patterns in the Ruvu River Watershed on Water Quality in the River System. Phys. Chem. Earth 2004, 1161–1166. [Google Scholar] [CrossRef]
- Mero, R. Assessment of Water Quality and Spartial Distribution of the Major Pollutants in the Ngerengere River Catchment, Tanzania; University of Zimbabwe: Harare, Zimbabwe, 2011. [Google Scholar]
- Kimambo, O.N.; Chikoore, H.; Gumbo, J.R.; Msagati, T.A.M. Retrospective analysis of Chlorophyll-a and its correlation with climate and hydrological variations in Mindu Dam, Morogoro, Tanzania. Heliyon 2019, 5, e02834. [Google Scholar] [CrossRef]
- Kimambo, O.N.; Chikoore, H.; Gumbo, J.R. Understanding the Effects of Changing Weather: A Case of Flash Flood in Morogoro on 11 January 2018. Adv. Meteorol. 2019, 2019, 8505903. [Google Scholar] [CrossRef]
- Gill, D.; Rowe, M.; Joshi, S.J. Fishing in greener waters: Understanding the impact of harmful algal blooms on Lake Erie anglers and the potential for adoption of a forecast model. J. Environ. Manag. 2018, 227, 248–255. [Google Scholar] [CrossRef]
- Gholami, Z.; Mortazavi, M.S.; Karbassi, A. Environmental risk assessment of harmful algal blooms case study: Persian Gulf and Oman Sea located at Hormozgan Province, Iran. Hum. Ecol. Risk Assess. 2019, 25, 271–296. [Google Scholar] [CrossRef]
- The United Republic of Tanzania, Population Distribution by Age and Sex; Dar Es Salaam, Tanzania. 2013. Available online: https://ihi.eprints.org/2169/1/Age_Sex_Distribution.pdf (accessed on 31 March 2021).
- Ngana, J.; Mahay, F.; Cross, K. Ruvu Basin: A Situation Analysis; IUCN Nairobi, Kenya, xvii. 2010. Available online: https://portals.iucn.org/library/sites/library/files/documents/2010-034.pdf (accessed on 31 March 2021).
- Lundqvist, J. The economic Structure of Morogoro Town: Some Sectoral and Regional Characteristics of a Medium African Town; Uppsala Offset Center AB: Upsala, Sweden, 1973; Volume 17. [Google Scholar]
- Mwega, E.; Colquhoun, D.J.; Tuntufye, H.; Mdegela, R.; Mutoloki, S.; Evensen, Ø.; Wasteson, Y. Isolation and Characterization of Flavobacteriaceae from Farmed and Wild Nile Tilapia in Tanzania. J. Aquat. Anim. Health 2019, 31, 23–30. [Google Scholar] [CrossRef]
- Chenyambuga, S.W.; Mwandya, A.; Lamtane, H.A.; Madalla, N.A. Productivity and marketing of Nile tilapia (Oreochromis niloticus) cultured in ponds of small-scale farmers in Mvomero and Mbarali districts, Tanzania. Livest. Res. Rural Dev. 2014, 26, 3–12. [Google Scholar]
- Wetengere, K. The Actual valuation of fish ponds: The case of Selected Villages in Morogoro and Dar es Salaam Regions, Tanzania. Afr. J. Food Agric. Nutr. Dev. 2010, 10, 4139–4155. [Google Scholar] [CrossRef]
- Sellke, T.; Bayarri, M.J.; Berger, J.O. Calibration of p values for testing precise null hypotheses. Am. Stat. 2001, 55, 62–71. [Google Scholar] [CrossRef]
- Quintana, D.S.; Williams, D.R. Bayesian alternatives for common null-hypothesis significance tests in psychiatry: A non-technical guide using JASP. BMC Psychiatry 2018, 18, 178. [Google Scholar] [CrossRef] [PubMed]
- Nuzzo, R.L. An Introduction to Bayesian Data Analysis for Correlations. PM&R 2017, 9, 1278–1282. [Google Scholar] [CrossRef]
- Marsman, M.; Wagenmakers, E.-J. Bayesian benefits with JASP. Eur. J. Dev. Psychol. 2017, 14, 545–555. [Google Scholar] [CrossRef]
- Bradford, K.; Katikiro, R.E. Fighting the tides: A review of gender and fisheries in Tanzania. Fish. Res. 2019, 216, 79–88. [Google Scholar] [CrossRef]
- Fröcklin, S.; De La Torre-Castro, M.; Lindström, L.; Jiddawi, N.S. Fish Traders as Key Actors in Fisheries: Gender and Adaptive Management. Ambio 2013, 42, 951–962. [Google Scholar] [CrossRef]
- Kangalawe, R.Y.; Liwenga, E.T. Livelihoods in the wetlands of Kilombero Valley in Tanzania: Opportunities and challenges to integrated water resource management. Phys. Chem. Earth Parts 2005, 30, 968–975. [Google Scholar] [CrossRef]
- The United Republic of Tanzania, National Water Sector Development Strategy; Dar es Salaam, Tanzania. 2006. Available online: http://extwprlegs1.fao.org/docs/pdf/tan169532.pdf (accessed on 31 March 2021).
- The United Republic of Tanzania, National Sample Census of Agriculture 2007/2008; Morogoro, Tanzania. 2012. Available online: http://harvestchoice.org/sites/default/files/downloads/publications/Tanzania_2007-8_Vol_5e.pdf (accessed on 31 March 2021).
- World Bank-Tanzania. Water Resources in Tanzania; World Bank-Tanzania: Dar es Salaam, Tanzania, 2006. [Google Scholar]
- Van der Merwe, D. Freshwater cyanotoxins. In Biomarkers in Toxicology; Academic Press: Cambridge, MA, USA, 2014; pp. 539–548. [Google Scholar]
- Mowe, M.A.D.; Mitrovic, S.M.; Lim, R.P.; Furey, A.; Yeo, D.C.J. Tropical cyanobacterial blooms: A review of prevalence, problem taxa, toxins and influencing environmental factors. J. Limnol. 2014, 73. [Google Scholar] [CrossRef]
- Rastogi, R.P.; Madamwar, D.; Incharoensakdi, A. Bloom Dynamics of Cyanobacteria and Their Toxins: Environmental Health Impacts and Mitigation Strategies. Front. Microbiol. 2015, 6, 1254. [Google Scholar] [CrossRef] [PubMed]
- Bellém, F.; Nunes, S.; Morais, M. Cyanobacteria toxicity: Potential public health impact in South Portugal populations. J. Toxicol. Environ. Health Part A 2013, 76, 263–271. [Google Scholar] [CrossRef]
- Van der Heijden, P.G.M.; van der Shoko, A.P.; van Duijn, A.P.; Rurangwa, E.; Bolman, B. Review and Analysis of Small-Scale Aquaculture Production in East Africa; WCDI 18-020; Wageningen Centre for Development and Innovation: Wageningen, The Netherlands, 2018. [Google Scholar]
- Jewett, E.B.; Lopez, C.B.; Dortch, Q.; Etheridge, S.M.; Backer, L.C. Harmful Algal Bloom Management and Response: Assessment and Plan; Interagency Working Group on Harmful Algal Blooms, Hypoxia, and Human Health of the Joint Subcommittee on Ocean Science and Technology: Washington, DC, USA, 2008. [Google Scholar]
- Rothuis, A.J.; Turenhout, M.N.J.; van Duijn, A.P.; Roem, A.; Rurangwa, E.; Katunzi, E.F.B.; Shoko, A.; Kabagambe, J.B. Aquaculture in East Africa; A regional Approach; Wageningen, The Netherlands. 2014. Available online: https://library.wur.nl/WebQuery/wurpubs/fulltext/324139 (accessed on 31 March 2021).
- Lazur, A.M.; Cichra, C.E.; Watson, C. The Use of Lime in Fish Ponds; Florida, USA. 2013. Available online: http://edis.ifas.ufl.edu/pdffiles/FA/FA02800.pdf (accessed on 31 March 2021).
Publisher’s Note: MDPI stays neutral with regard to jurisdictional claims in published maps and institutional affiliations. |
© 2021 by the authors. Licensee MDPI, Basel, Switzerland. This article is an open access article distributed under the terms and conditions of the Creative Commons Attribution (CC BY) license (https://creativecommons.org/licenses/by/4.0/).