
Effects of the Head Start Program on Socioecological Obesogenic Factors in American Children


Abstract
1. Introduction
2. Materials and Methods
2.1. Data Source
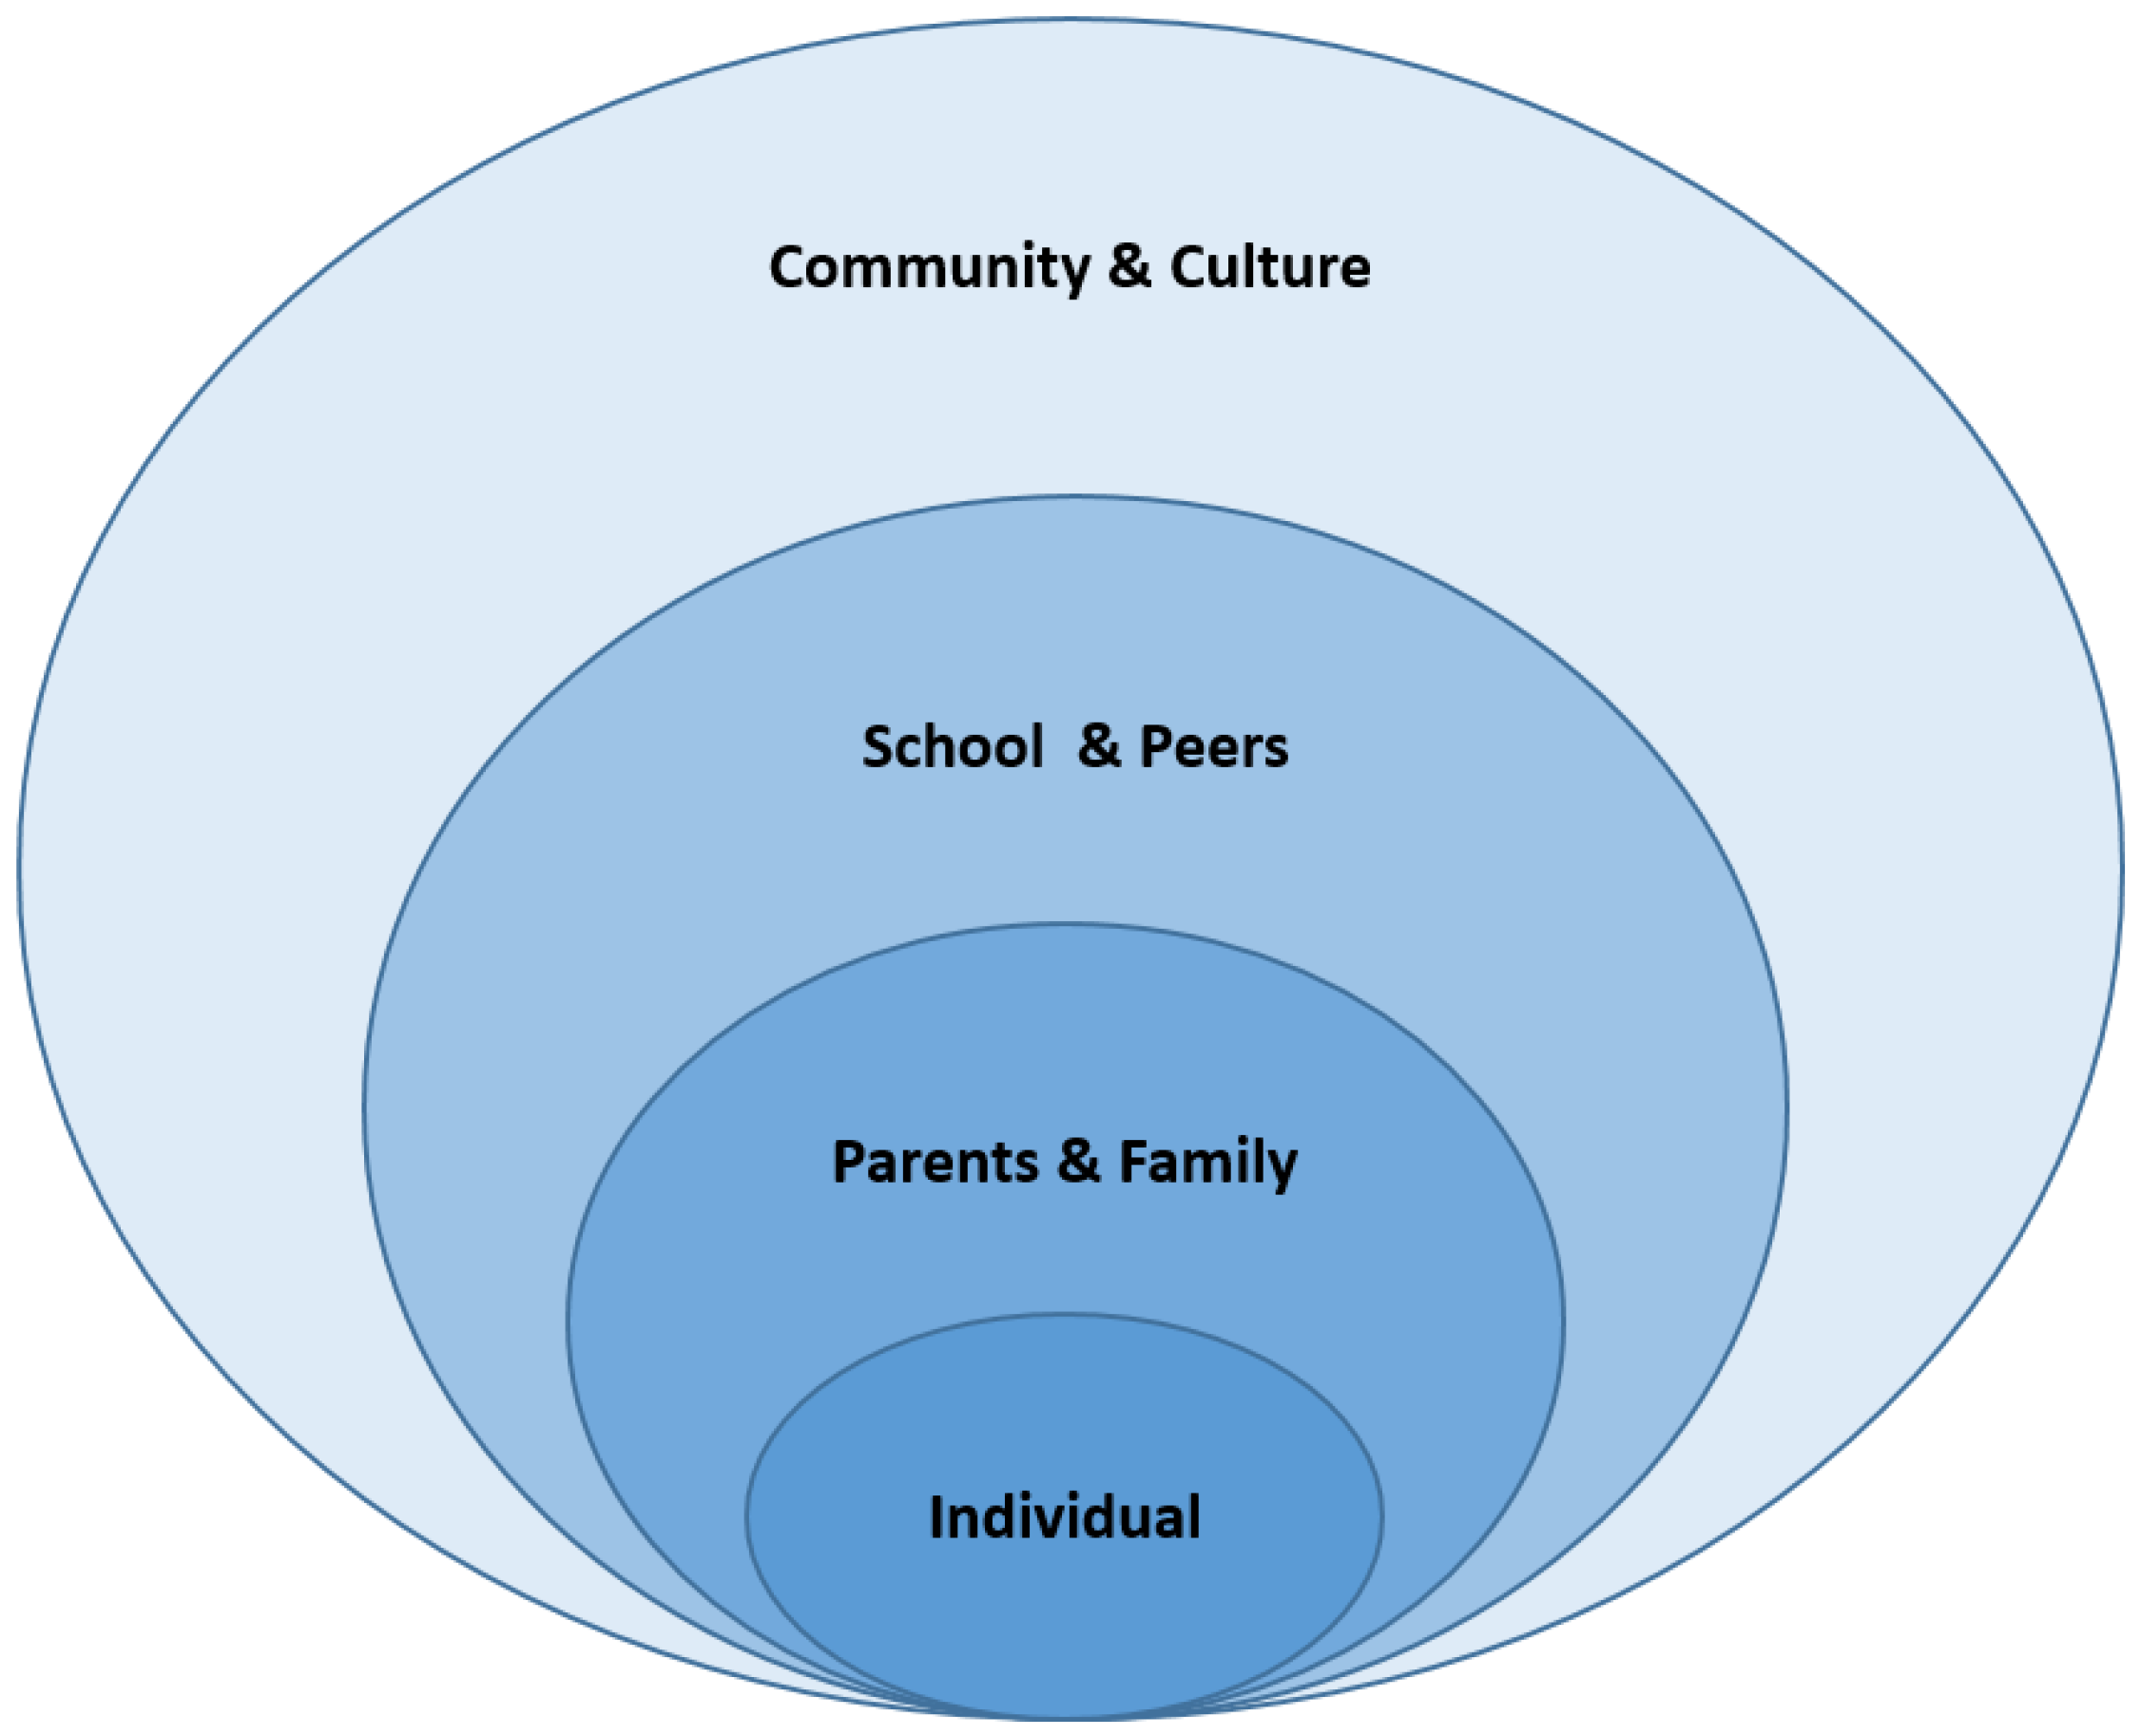
2.2. Conceptual Frameworks
2.3. Dependent Variable
2.4. Independent Variables
2.5. Satistical Analyses
3. Results
3.1. Imbalance Test of PSM for the Pair-Matching Procedure
3.2. Imbalance Test of PSM with a Comparison between Matched and Unmatched Covariates
4. Discussion
5. Conclusions
Author Contributions
Funding
Institutional Review Board Statement
Informed Consent Statement
Conflicts of Interest
References
- Boonpleng, W.; Park, C.G.; Gallo, A.M.; Corte, C.; McCreary, L.; Bergren, M.D. Ecological influences of early childhood obesity: A multilevel analysis. West J. Nurs. Res. 2013, 35, 742–759. [Google Scholar] [CrossRef]
- Ickes, M.J.; Sharma, M. A Systematic Review of Community-Based Childhood Obesity Prevention Programs. J. Obes. Weight Loss Ther. 2013, S3, e193–e200. [Google Scholar] [CrossRef]
- Williams, A.J.; Henley, W.E.; Williams, C.A.; Hurst, A.J.; Logan, S.; Wyatt, K.M. Systematic review and meta-analysis of the association between childhood overweight and obesity and primary school diet and physical activity policies. Int. J. Behav. Nutr. Phys. Act. 2013, 10, 101. [Google Scholar] [CrossRef] [PubMed]
- Chung, E.K.; Romney, M.C. Social Determinants of Childhood Obesity: Beyond Individual Choices. Curr. Pediatr. Rev. 2012, 8, 237–252. [Google Scholar] [CrossRef]
- Ogden, C.L.; Fryar, C.D.; Martin, C.B.; Freedman, D.S.; Carroll, M.D.; Gu, Q.; Hales, C.M. Trends in obesity prevalence by race and hispanic origin—1999–2000 to 2017–2018. JAMA 2020, 324, 1208–1210. [Google Scholar] [CrossRef] [PubMed]
- Ogden, C.L.; Carroll, M.D.; Lawman, H.G.; Fryar, C.D.; Kruszon-Moran, D.; Kit, B.K.; Flegal, K.M. Trends in Obesity Prevalence Among Children and Adolescents in the United States, 1988–1994 Through 2013–2014. JAMA 2016, 315, 2292. [Google Scholar] [CrossRef] [PubMed]
- Russell-Mayhew, S.; McVey, G.; Bardick, A.; Ireland, A. Mental health, wellness, and childhood overweight/obesity. J. Obes. 2012, 2012, 281801. [Google Scholar] [CrossRef]
- Reilly, J.J.; Kelly, J. Long-term impact of overweight and obesity in childhood and adolescence on morbidity and premature mortality in adulthood: Systematic review. Pediatr. Rev. 2011, 35, 891–898. [Google Scholar] [CrossRef] [PubMed]
- Freedman, D.S.; Mei, Z.; Srinivasan, S.R.; Berenson, G.S.; Dietz, W.H. Cardiovascular Risk Factors and Excess Adiposity Among Overweight Children and Adolescents: The Bogalusa Heart Study. J. Pediatr. 2007, 150, 12–17. [Google Scholar] [CrossRef]
- Ogden, C.L.; Carroll, M.D.; Kit, B.K.; Flegal, K.M. Prevalence of Obesity and Trends in Body Mass Index Among US Children and Adolescents, 1999–2010. JAMA 2012, 307, 483. [Google Scholar] [CrossRef]
- Gordon-Larsen, P.; Adair, L.S.; Popkin, B.M. Ethnic differences in physical activity and inactivity patterns and overweight status. Obes. Res. 2002, 10, 141–149. [Google Scholar] [CrossRef] [PubMed]
- McMurray, R.G.; Harrell, J.S.; Deng, S.; Bradley, C.B.; Cox, L.M.; Bangdiwala, S.I. The influence of physical activity, socioeconomic status, and ethnicity on the weight status of adolescents. Obes. Res. 2000, 8, 130–139. [Google Scholar] [CrossRef] [PubMed]
- Casazza, K.; Ciccazzo, M. Improving the dietary patterns of adolescents using a computer-based approach. J. Sch. Health 2006, 76, 43–46. [Google Scholar] [CrossRef]
- Andersen, R.E.; Crespo, C.J.; Bartlett, S.J.; Cheskin, L.J.; Pratt, M. Relationship of physical activity and television watching with body weight and level of fatness among children: Results from the Third National Health and Nutrition Examination Survey. JAMA 1998, 279, 938–942. [Google Scholar] [CrossRef] [PubMed]
- Davison, K.K.; Birch, L.L. Childhood overweight: A contextual model and recommendations for future research. Obes. Rev. 2001, 2, 159–171. [Google Scholar] [CrossRef]
- Gibson, L.Y.; Byrne, S.M.; Davis, E.A.; Blair, E.; Jacoby, P.; Zubrick, S.R. The role of family and maternal factors in childhood obesity. Med. J. Aust. 2007, 186, 591–595. [Google Scholar] [CrossRef] [PubMed]
- Zhao, J.; Settles, B.H. Environmental correlates of children’s physical activity and obesity. Am. J. Health Behav. 2014, 38, 124–133. [Google Scholar] [CrossRef] [PubMed]
- Clarke, J.; Fletcher, B.; Lancashire, E.; Pallan, M.; Adab, P. The views of stakeholders on the role of the primary school in preventing childhood obesity: A qualitative. Obes. Rev. 2013, 14, 975–988. [Google Scholar] [CrossRef] [PubMed]
- USDHH (U.S. Department of Health and Human Services). Final rule. In Head Start Performance Standards; 45 CFR Part 1304; US Government Printing Office: Washington, DC, USA, 1996; pp. 57186–57227. [Google Scholar]
- Ludwig, J.; Phillips, D.A. Long-term effects of head start on low-income children. Ann. N. Y. Acad. Sci. 2008, 1136, 257–268. [Google Scholar] [CrossRef] [PubMed]
- Frisvold, D. Head Start Participation and Childhood Obesity. Am. Econ. Assoc. 2006. [Google Scholar] [CrossRef]
- Gable, S.; Lutz, S. Household, parent, and child contributions to child obesity. Fam. Relat. 2000, 49, 293–300. [Google Scholar] [CrossRef]
- Hinckson, E.A.; Dickinson, A.; Water, T.; Sands, M.; Penman, L. Physical activity, dietary habits and overall health in overweight and obese children and youth with intellectual disability or autism. Res. Dev. Disabil. 2013, 34, 1170–1178. [Google Scholar] [CrossRef]
- Van Cleave, J.; Gortmaker, S.L.; Perrin, J.M. Dynamics of Obesity and Chronic Health Conditions Among Children and Youth. JAMA 2010, 303, 623–630. [Google Scholar] [CrossRef] [PubMed]
- Alberga, A.S.; Medd, E.R.; Adamo, K.B.; Goldfield, G.S.; Prud’Homme, D.; Kenny, G.P.; Sigal, R.J. Top 10 practical lessons learned from physical activity interventions in overweight and obese children and adolescents. Appl. Physiol. Nutr. Metab. 2013, 38, 249–258. [Google Scholar] [CrossRef] [PubMed]
- Lee, L.C.; Harrington, R.A.; Louie, B.B.; Newschaffer, C.J. Children with autism: Quality of life and parental concerns. J. Autism. Dev. Disord. 2008, 38, 1147–1160. [Google Scholar] [CrossRef] [PubMed]
- Bergman, A.B. Project Head Start: A Legacy of the War on Poverty. Arch. Pediatr. Adolesc. Med. 1980, 134, 1007. [Google Scholar] [CrossRef]
- Start, E.; Assistance, E. The 2009 Health & Human Services (HHS) Poverty Guidelines. Fed. Regist. 2009, 74, 4199–4201. [Google Scholar]
- Bronfenbrenner, U. Ecological Models of Human Development. Int. Encycl. Educ. 1994, 3, 1643–1647. [Google Scholar]
- Krebs, N.F.; Himes, J.H.; Jacobson, D.; Nicklas, T.A.; Guilday, P.; Styne, D. Assessment of Child and Adolescent Overweight and Obesity. Pediatrics 2007, 120 (Suppl. 4), 193–228. [Google Scholar] [CrossRef]
- CDC. Childhood Obesity Facts|Overweight & Obesity|CDC. Available online: https://www.cdc.gov/obesity/data/childhood.html%0Ahttp://www.cdc.gov/obesity/data/childhood.html (accessed on 24 October 2018).
- Kelly, A.; Barlow, S.; Rao, G.; Inge, T.; Hayman, L. Severe obesity in children and adolescents: Identification, associated health risks, and treatment approaches a scientific statement from the American Heart. Circulation 2013, 128, 1689–1712. [Google Scholar] [CrossRef]
- Chen, A.Y.; Escarce, J.J. Family Structure and Childhood Obesity: An Analysis Through 8th Grade. Matern. Child Health J. 2013, 7, 1–6. [Google Scholar] [CrossRef]
- Kaphingst, K.M.; French, S.; Story, M. The role of child care settings in obesity prevention. Future Child. 2006, 16, 143–168. [Google Scholar]
- Anderson, P.M. Parental employment, family routines and childhood obesity. Econ. Hum. Biol. 2012, 10, 340–351. [Google Scholar] [CrossRef] [PubMed]
- Anderson, P.M.; Butcher, K.F. Childhood obesity: Trends and potential causes. Future Child. 2006, 16, 19–45. [Google Scholar] [CrossRef] [PubMed]
- Lissau, I.; Sorensen, T.I. Parental neglect during childhood and increased risk of obesity in young adulthood. Lancet 1994, 343, 324–327. [Google Scholar] [CrossRef]
- Garn, S.; Cole, P.; Bailey, S. Effect of parental fatness levels on the fatness of biological and adoptive children. Ecol. Food Nutr. 1977, 6, 91–93. [Google Scholar] [CrossRef]
- Lake, J.K.; Power, C.; Cole, T.J. Child to adult body mass index in the 1958 British birth cohort: Associations with parental obesity. Arch. Dis. Child. 1997, 77, 376–381. [Google Scholar] [CrossRef]
- Elder, J.P.; Arredondo, E.M.; Campbell, N.; Baquero, B.; Duerksen, S.; Ayala, G.; Crespo, N.C.; Crespo, N.C.; Slymen, D.; McKenzie, T. Individual, family, and community environmental correlates of obesity in latino elementary school children. J. Sch. Health 2010, 80, 20–30. [Google Scholar] [CrossRef]
- Dehejia, R.H.; Wahba, S. Propensity score-matching methods for nonexperimental causal studies. Rev. Econ. Stat. 2002, 84, 151–161. [Google Scholar] [CrossRef]
- Katz, M.H. Multivariable Analysis: A Practical Guide for Clinicians and Public Health Researchers; Cambridge University Press: Cambridge, UK, 2011. [Google Scholar]
- Hughes, C.C.; Gooze, R.A.; Finkelstein, D.M.; Whitaker, R.C. Barriers to obesity prevention in Head Start. Health Aff. 2010, 29, 454–462. [Google Scholar] [CrossRef]
- Jurkowski, J.M.; Green Mills, L.L.; Lawson, H.A.; Bovenzi, M.C.; Quartimon, R.; Davison, K.K. Engaging Low-Income Parents in Childhood Obesity Prevention from Start to Finish: A Case Study. J. Community Health 2013, 38, 1–11. [Google Scholar] [CrossRef]
- Whitaker, R.C.; Gooze, R.A.; Hughes, C.C.; Finkelstein, D.M. A national survey of obesity prevention practices in head start. Arch. Pediatrics Adolescent Med. 2009, 163, 1144–1150. [Google Scholar] [CrossRef] [PubMed]
- Gable, S.; Lutz, S. Nutrition socialization experiences of children in the Head Start program. J. Am. Dietetic Assoc. 2001, 101, 572–577. [Google Scholar] [CrossRef]
- Frisvold, D.E.; Lumeng, J.C. Expanding Exposure: Can Increasing the Daily Duration of Head Start Reduce Childhood Obesity? J. Hum. Resour. 2011, 46, 373–402. [Google Scholar] [CrossRef]
- Hu, W.T.; Foley, T.A.; Wilcox, R.A.; Kozera, R.M.; Morgenstern, B.Z.; Juhn, Y.J. Childhood obesity among Head Start enrollees in Souteaster Minnesota: Prevalence and Risk Factors. Ethn. Dis. 2007, 17, 23–28. [Google Scholar]
- Lumeng, J.C.; Kaciroti, N.; Frisvold, D.E. Changes in Body Mass Index Z Score Over the Course of the Academic Year Among Children Attending Head Start. Acad. Pediatr. 2010, 10, 179–186. [Google Scholar] [CrossRef]
- Lumeng, J.C.; Kaciroti, N.; Sturza, J.; Krusky, A.M.; Miller, A.L.; Peterson, K.E.; Lipton, R.; Reischl, T.M. Changes in Body Mass Index Associated With Head Start Participation. Pediatrics 2015, 135, e449–e456. [Google Scholar] [CrossRef]
- Ludwig, J.; Phillips, D.A. The Benefits and Costs of Head Start. Public Policy 2007. [Google Scholar] [CrossRef]
- GreenMills, L.L.; Davison, K.K.; Gordon, K.E.; Li, K.; Jurkowski, J.M. Evaluation of a childhood obesity awareness campaign targeting head start families: Designed by parents for parents. J. Health Care Poor Underserved 2013, 24 (Suppl. 2), 25–33. [Google Scholar] [CrossRef]
- Fitzgibbon, M.L.; Stolley, M.R.; Dyer, A.R.; VanHorn, L.; KauferChristoffel, K. A community-based obesity prevention program for minority children: Rationale and study design for Hip-Hop to Health Jr. Prev. Med. 2002, 34, 289–297. [Google Scholar] [CrossRef]
- Davison, K.K.; Jurkowski, J.M.; Li, K.; Kranz, S.; Lawson, H.A. A childhood obesity intervention developed by families for families: Results from a pilot study. Int. J. Behav. Nutr. Phys. Act. 2013, 10, 3. [Google Scholar] [CrossRef] [PubMed]


| Data Collection | Date of Collection | Sample |
|---|---|---|
| Fall—kindergarten | Fall 1998 | Full sample |
| Spring—kindergarten | Spring 1999 | Full sample |
| Fall—first grade | Fall 1999 | 30% subsample 1 |
| Spring—first grade | Spring 2000 | Full sample plus freshening |
| Spring—third grade | Spring 2002 | Full sample |
| Spring—fifth grade | Spring 2004 | Full sample |
| Spring—eighth grade | Spring 2007 | Full sample |
| % (n), Mean (SD) | ||||||
|---|---|---|---|---|---|---|
| Variables | Overweight | Normal Weight | Overall | p-Value | ||
| Dependent variables | Overweight | Binary variable (1 = overweight, 0 = normal) | 33.20% (1252) | 66.80% (2501) | 100% (3753) | |
| Treatment | Head Start | Binary variable (1 = yes, 0 = no) | 17.80% (191) | 13.75% (257) | 15.11% (448) | 0.05 |
| Covariates | 1. Individual | |||||
| Age | 13.67 (0.54) | 13.70 (0.51) | 13.69 (0.52) | 0.40 | ||
| Female | 50.57% (623) | 48.86% (1269) | 49.42% (1892) | 0.51 | ||
| Race/Ethnicity | <0.01 | |||||
| Non-Hispanic white | 52.49% (739) | 63.79% (1701) | 60.04% (2440) | |||
| Non-Hispanic Black | 18.80% (155) | 12.23% (194) | 14.41% (349) | |||
| Hispanic | 22.53% (250) | 16.87% (341) | 18.75% (591) | |||
| Other | 6.18% (108) | 7.03% (264) | 6.75% (372) | |||
| Sports activity | 52.54% (698) | 63.28% (1567) | 59.71% (2265) | <0.01 | ||
| Hours spent in school-sponsored activities | 4.69 (4.70) | 4.95 (4.69) | 4.86 (4.70) | 0.06 | ||
| Sedentary lifestyles | 17.05 (12.66) | 16.07 (13.72) | 16.40 (13.37) | 0.67 | ||
| Perceived weight | 3.71 (0.75) | 2.82 (0.63) | 3.12 (0.79) | <0.01 | ||
| Intention to change weight | <0.01 | |||||
| Lose weight | 69.73% (868) | 20.26% (510) | 36.68% (1378) | |||
| Gain weight | 2.11% (26) | 16.29% (407) | 11.59% (433) | |||
| Stay the same weight | 12.77% (171) | 32.38% (760) | 25.87% (931) | |||
| Not trying to do anything about their weight | 12.95% (158) | 29.41% (784) | 23.96% (942) | |||
| 2. Parenting capacity | ||||||
| Parents’ education | <0.01 | |||||
| Lower than high school | 10.40% (122) | 5.98% (131) | 7.44% (253) | |||
| High school | 24.62% (291) | 17.34% (426) | 19.76% (717) | |||
| Greater than high school | 64.98% (839) | 76.69% (1944) | 72.80% (2783) | |||
| Parents’ employment | 5.94 (2.23) | 6.09 (2.14) | 6.04 (2.17) | 0.12 | ||
| Parents’ health | 3.60 (0.98) | 3.84 (0.96) | 3.76 (0.97) | <0.01 | ||
| Parents’ income | 8.27 (3.06) | 9.10 (3.07) | 8.83 (3.09) | <0.01 | ||
| Parent-child relationship | 4.92 (1.00) | 5.05 (1.01) | 5.00 (1.01) | <0.05 | ||
| Parental characteristics | 58.42% (762) | 59.81% (1665) | 59.35% (2427) | 0.59 | ||
| 3. Family Function | ||||||
| Family structure | 72.80% (933) | 76.23% (1978) | 75.09% (2911) | 0.13 | ||
| Family size with members less than 18 years old | 2.27 (1.10) | 2.31 (1.09) | 2.30 (1.09) | 0.29 | ||
| Family TV restriction | 84.16% (1055) | 85.99% (2108) | 85.38% (3163) | <0.05 | ||
| Food security | 0.77 (2.44) | 0.54 (1.88) | 0.62 (2.09) | <0.01 | ||
| SES quintile | 2.77 (1.35) | 3.27 (1.39) | 3.10 (1.39) | <0.01 | ||
| 4. School | ||||||
| School’s ratio of minorities (degrees) | 2.82 (1.53) | 2.64 (1.45) | 2.70 (1.48) | <0.01 | ||
| School reduced-price lunch program | 3.18 (.90) | 3.08 (.91) | 3.11 (.91) | <0.01 | ||
| School free lunch program | 35.71 (25.00) | 30.55 (24.18) | 32.27 (24.68) | <0.01 | ||
| 5. Environment | ||||||
| Urbanity | <0.01 | |||||
| Large city | 33.75% (387) | 29.33% (704) | 30.80% (1091) | |||
| Mid-size city | 36.78% (456) | 46.81% (1102) | 43.48% (1558) | |||
| Small town and rural | 29.48% (409) | 23.86% (695) | 25.72% (1104) | |||
| Variables | |||||||
|---|---|---|---|---|---|---|---|
| Dependent Variables | Overweight | Binary Variable (1 = Overweight, 0 = Normal) | Unmatched (n = 2993) Matched (n = 351) | Mean | t-Test | ||
| Treated | Control | t | p > |t| | ||||
| Covariates | 1. Individual | ||||||
| Age | U | 13.70 | 13.69 | 0.47 | 0.64 | ||
| M | 13.71 | 13.66 | 1.11 | 0.27 | |||
| Female | U | 0.53 | 0.51 | 0.90 | 0.37 | ||
| M | 0.54 | 0.53 | 0.30 | 0.076 | |||
| Race/Ethnicity | |||||||
| Non-Hispanic white | U | - | - | - | - | ||
| M | - | - | - | - | |||
| Non-Hispanic Black | U | 0.27 | 0.06 | 13.53 | <0.01 | ||
| M | 0.24 | 0.23 | 0.44 | 0.66 | |||
| Hispanic | U | 0.24 | 0.14 | 4.90 | <0.01 | ||
| M | 0.25 | 0.26 | −0.17 | 0.86 | |||
| Other | U | 0.12 | 0.08 | 2.39 | <0.05 | ||
| M | 0.12 | 0.11 | 0.36 | 0.72 | |||
| School-sponsored activities | U | 4.02 | 4.99 | −3.73 | <0.01 | ||
| M | 4.08 | 3.79 | 0.86 | 0.39 | |||
| Sports activity | U | 0.60 | 0.62 | −1.00 | 0.32 | ||
| M | 0.59 | 0.54 | 1.37 | 0.17 | |||
| Sedentary lifestyles | U | 20.27 | 15.88 | 6.48 | <0.01 | ||
| M | 19.70 | 20.11 | −0.34 | 0.73 | |||
| Perceived weight degrees | U | 3.17 | 3.11 | 1.42 | 0.16 | ||
| M | 3.19 | 3.11 | 0.21 | 0.23 | |||
| Intention to change weight | |||||||
| 1 = lose weight | U | - | - | - | - | ||
| M | - | - | - | - | |||
| 2 = gain weight | U | 0.14 | 0.11 | 1.50 | 0.13 | ||
| M | 0.13 | 0.14 | −0.44 | 0.66 | |||
| 3 = stay the same weight | U | 0.24 | 0.25 | −0.49 | 0.62 | ||
| M | 0.24 | 0.23 | 0.27 | 0.79 | |||
| 4 = not trying to do anything about | U | 0.21 | 0.26 | 2.27 | <0.05 | ||
| their weight | M | 0.21 | 0.26 | −1.51 | 0.13 | ||
| 2. Parenting capacity | |||||||
| Parents’ education | |||||||
| Lower than high school | U | - | - | - | - | ||
| M | - | - | - | - | |||
| High school | U | 0.36 | 0.17 | 8.89 | <0.01 | ||
| M | 0.35 | 0.34 | 0.16 | 0.87 | |||
| Greater than high school | U | 0.39 | 0.73 | −13.69 | <0.01 | ||
| M | 0.40 | 0.38 | 0.70 | 0.49 | |||
| Parents’ employment | U | 5.34 | 6.33 | −9.37 | <0.01 | ||
| M | 5.38 | 5.29 | 0.53 | 0.60 | |||
| Parents’ health | U | 3.38 | 3.82 | −8.39 | <0.01 | ||
| M | 3.38 | 3.40 | −0.22 | 0.83 | |||
| Parents’ income | U | 6.12 | 9.34 | −21.13 | <0.01 | ||
| M | 6.27 | 6.20 | 0.34 | 0.73 | |||
| Parent-child relationship | U | 4.73 | 5.13 | −7.83 | <0.01 | ||
| M | 4.74 | 4.62 | 1.61 | 0.11 | |||
| Parental characteristics | U | 0.41 | 0.69 | −10.62 | <0.01 | ||
| M | 0.42 | 0.44 | −0.30 | 0.76 | |||
| 3. Family Function | |||||||
| Family structure | U | 0.60 | 0.81 | −9.53 | <0.01 | ||
| M | 0.60 | 0.60 | 0.15 | 0.88 | |||
| Family size with members less than 18 | U | 2.50 | 2.25 | 4.38 | <0.01 | ||
| years old | M | 2.49 | 2.52 | −0.31 | 0.76 | ||
| Family TV restriction | U | 0.82 | 0.86 | −2.03 | <0.05 | ||
| M | 0.82 | 0.84 | −0.81 | 0.42 | |||
| Food security | U | 1.41 | 0.50 | 8.55 | <0.01 | ||
| M | 1.36 | 1.29 | 0.30 | 0.77 | |||
| SES | U | 2.00 | 3.31 | 18.09 | <0.01 | ||
| M | 2.05 | 2.01 | 0.41 | 0.69 | |||
| 4. School | |||||||
| School’s ratio of minorities | U | 3.26 | 2.56 | 9.13 | <0.01 | ||
| M | 3.21 | 3.10 | 0.87 | 0.39 | |||
| School reduced-price lunch program | U | 3.24 | 3.08 | 3.27 | <0.01 | ||
| M | 3.27 | 3.33 | −0.96 | 0.34 | |||
| School free lunch program | U | 45.65 | 29.09 | 14.10 | <0.01 | ||
| M | 45.48 | 44.45 | 0.54 | 0.59 | |||
| 5. Environment | |||||||
| Urbanity | |||||||
| Large city | U | - | - | - | - | ||
| M | - | - | - | - | |||
| Mid-size city | U | 0.25 | 0.44 | −7.25 | <0.01 | ||
| M | 0.26 | 0.24 | 0.61 | 0.54 | |||
| Small town and rural | U | 0.46 | 0.28 | 7.01 | <0.01 | ||
| M | 0.43 | 0.44 | −0.30 | 0.76 |
| Variables | ||||
|---|---|---|---|---|
| Dependent Variables | Overweight | Binary variable (1 = overweight, 0 = normal) | OR | CI |
| Treatment | Head Start | Binary variable | 1.28 | 0.73–2.27 |
| Covariates | 1. Individual | |||
| Age | 0.91 | 0.55–1.49 | ||
| Female | 0.86 | 0.50–1.48 | ||
| Race/Ethnicity | ||||
| Non-Hispanic white | - | - | ||
| Non-Hispanic Black | 5.23 ** | 2.04–13.37 | ||
| Hispanic | 1.32 | 0.51–3.42 | ||
| Other | 1.28 | 0.29–5.61 | ||
| School-sponsored activities | 1.07 * | 1.01–1.15 | ||
| Sports activities | 0.32 ** | 0.17–0.61 | ||
| Sedentary lifestyles | 1.00 | 0.99–1.01 | ||
| Perceived weight degrees | 6.86 ** | 4.22–11.16 | ||
| Intention to change weight | ||||
| 1 = lose weight | - | - | ||
| 2 = gain weight | 0.04 ** | 0.01–0.15 | ||
| 3 = stay the same weight | 0.08 ** | 0.04–0.16 | ||
| 4 = not trying to do anything about their weight | 0.15 ** | 0.08–0.30 | ||
| 2. Parenting capacity | ||||
| Parents’ education | ||||
| Lower than high school | - | - | ||
| High School | 1.76 | 0.87–3.54 | ||
| Greater than high school | 1.19 | 0.56–2.50 | ||
| Parent’s employment | 0.99 | 0.81–1.21 | ||
| Parents’ health | 1.07 | 0.79–1.45 | ||
| Parents’ income | 1.05 | 0.91–1.22 | ||
| Parent-child relationship | 1.02 | 0.78–1.34 | ||
| Parental characteristics | 0.87 | 0.39–1.92 | ||
| 3. Family Function | ||||
| Family structure | 1.46 | 0.52–4.08 | ||
| Family size with members less than 18 years old | 0.78 * | 0.63–0.97 | ||
| Family TV restriction | 0.40 * | 0.20–0.80 | ||
| Food security | 0.97 | 0.85–1.10 | ||
| SES | 0.87 | 0.59–1.29 | ||
| 4. School | ||||
| School’s ratio of minorities | 1.15 | 0.84–1.56 | ||
| School free lunch program | 1.01 | 1.01–1.02 | ||
| School reduced-price lunch program | 1.13 | 0.82–1.57 | ||
| 5. Environment | ||||
| Urbanity | ||||
| Large city | - | - | ||
| Mid-size city | 1.76 | 0.82–3.78 | ||
| Small town and rural | 1.54 | 0.71–3.33 | ||
| Total | n | 702 | ||
| Weighted n | 274,253 | |||
Publisher’s Note: MDPI stays neutral with regard to jurisdictional claims in published maps and institutional affiliations. |
© 2021 by the authors. Licensee MDPI, Basel, Switzerland. This article is an open access article distributed under the terms and conditions of the Creative Commons Attribution (CC BY) license (https://creativecommons.org/licenses/by/4.0/).
Share and Cite
Kim, T.; Kim, M.; Jang, C.-Y.; Gim, N.-G. Effects of the Head Start Program on Socioecological Obesogenic Factors in American Children. Int. J. Environ. Res. Public Health 2021, 18, 4779. https://doi.org/10.3390/ijerph18094779
Kim T, Kim M, Jang C-Y, Gim N-G. Effects of the Head Start Program on Socioecological Obesogenic Factors in American Children. International Journal of Environmental Research and Public Health. 2021; 18(9):4779. https://doi.org/10.3390/ijerph18094779
Chicago/Turabian StyleKim, Taeeung, Minju Kim, Chang-Yong Jang, and Nam-Gyeong Gim. 2021. "Effects of the Head Start Program on Socioecological Obesogenic Factors in American Children" International Journal of Environmental Research and Public Health 18, no. 9: 4779. https://doi.org/10.3390/ijerph18094779
APA StyleKim, T., Kim, M., Jang, C.-Y., & Gim, N.-G. (2021). Effects of the Head Start Program on Socioecological Obesogenic Factors in American Children. International Journal of Environmental Research and Public Health, 18(9), 4779. https://doi.org/10.3390/ijerph18094779