
Indoor Air Quality in Buildings: A Comprehensive Review on the Factors Influencing Air Pollution in Residential and Commercial Structure


Abstract
1. Introduction
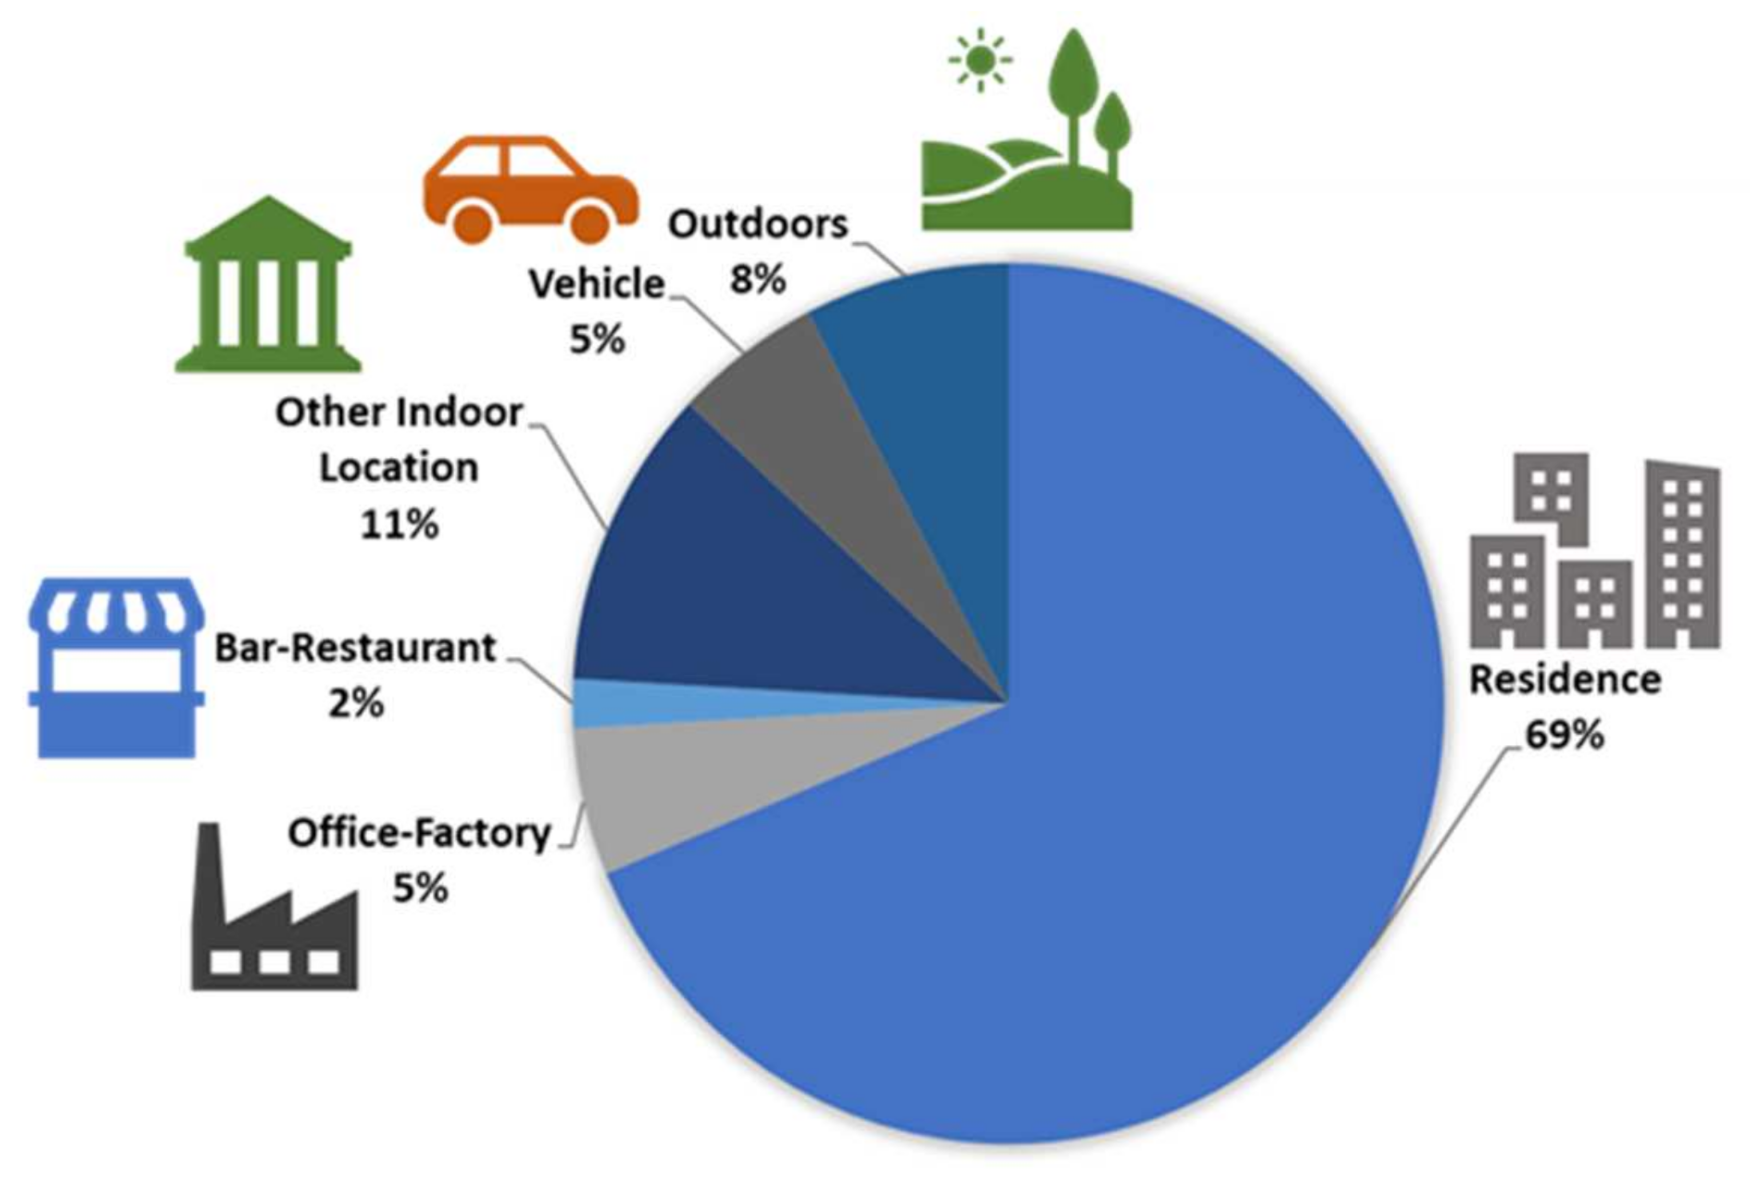
1.1. Patterns of Time Spent Indoors
1.2. Indoor Pollution Sources and Health Impacts
1.3. Purpose of Study
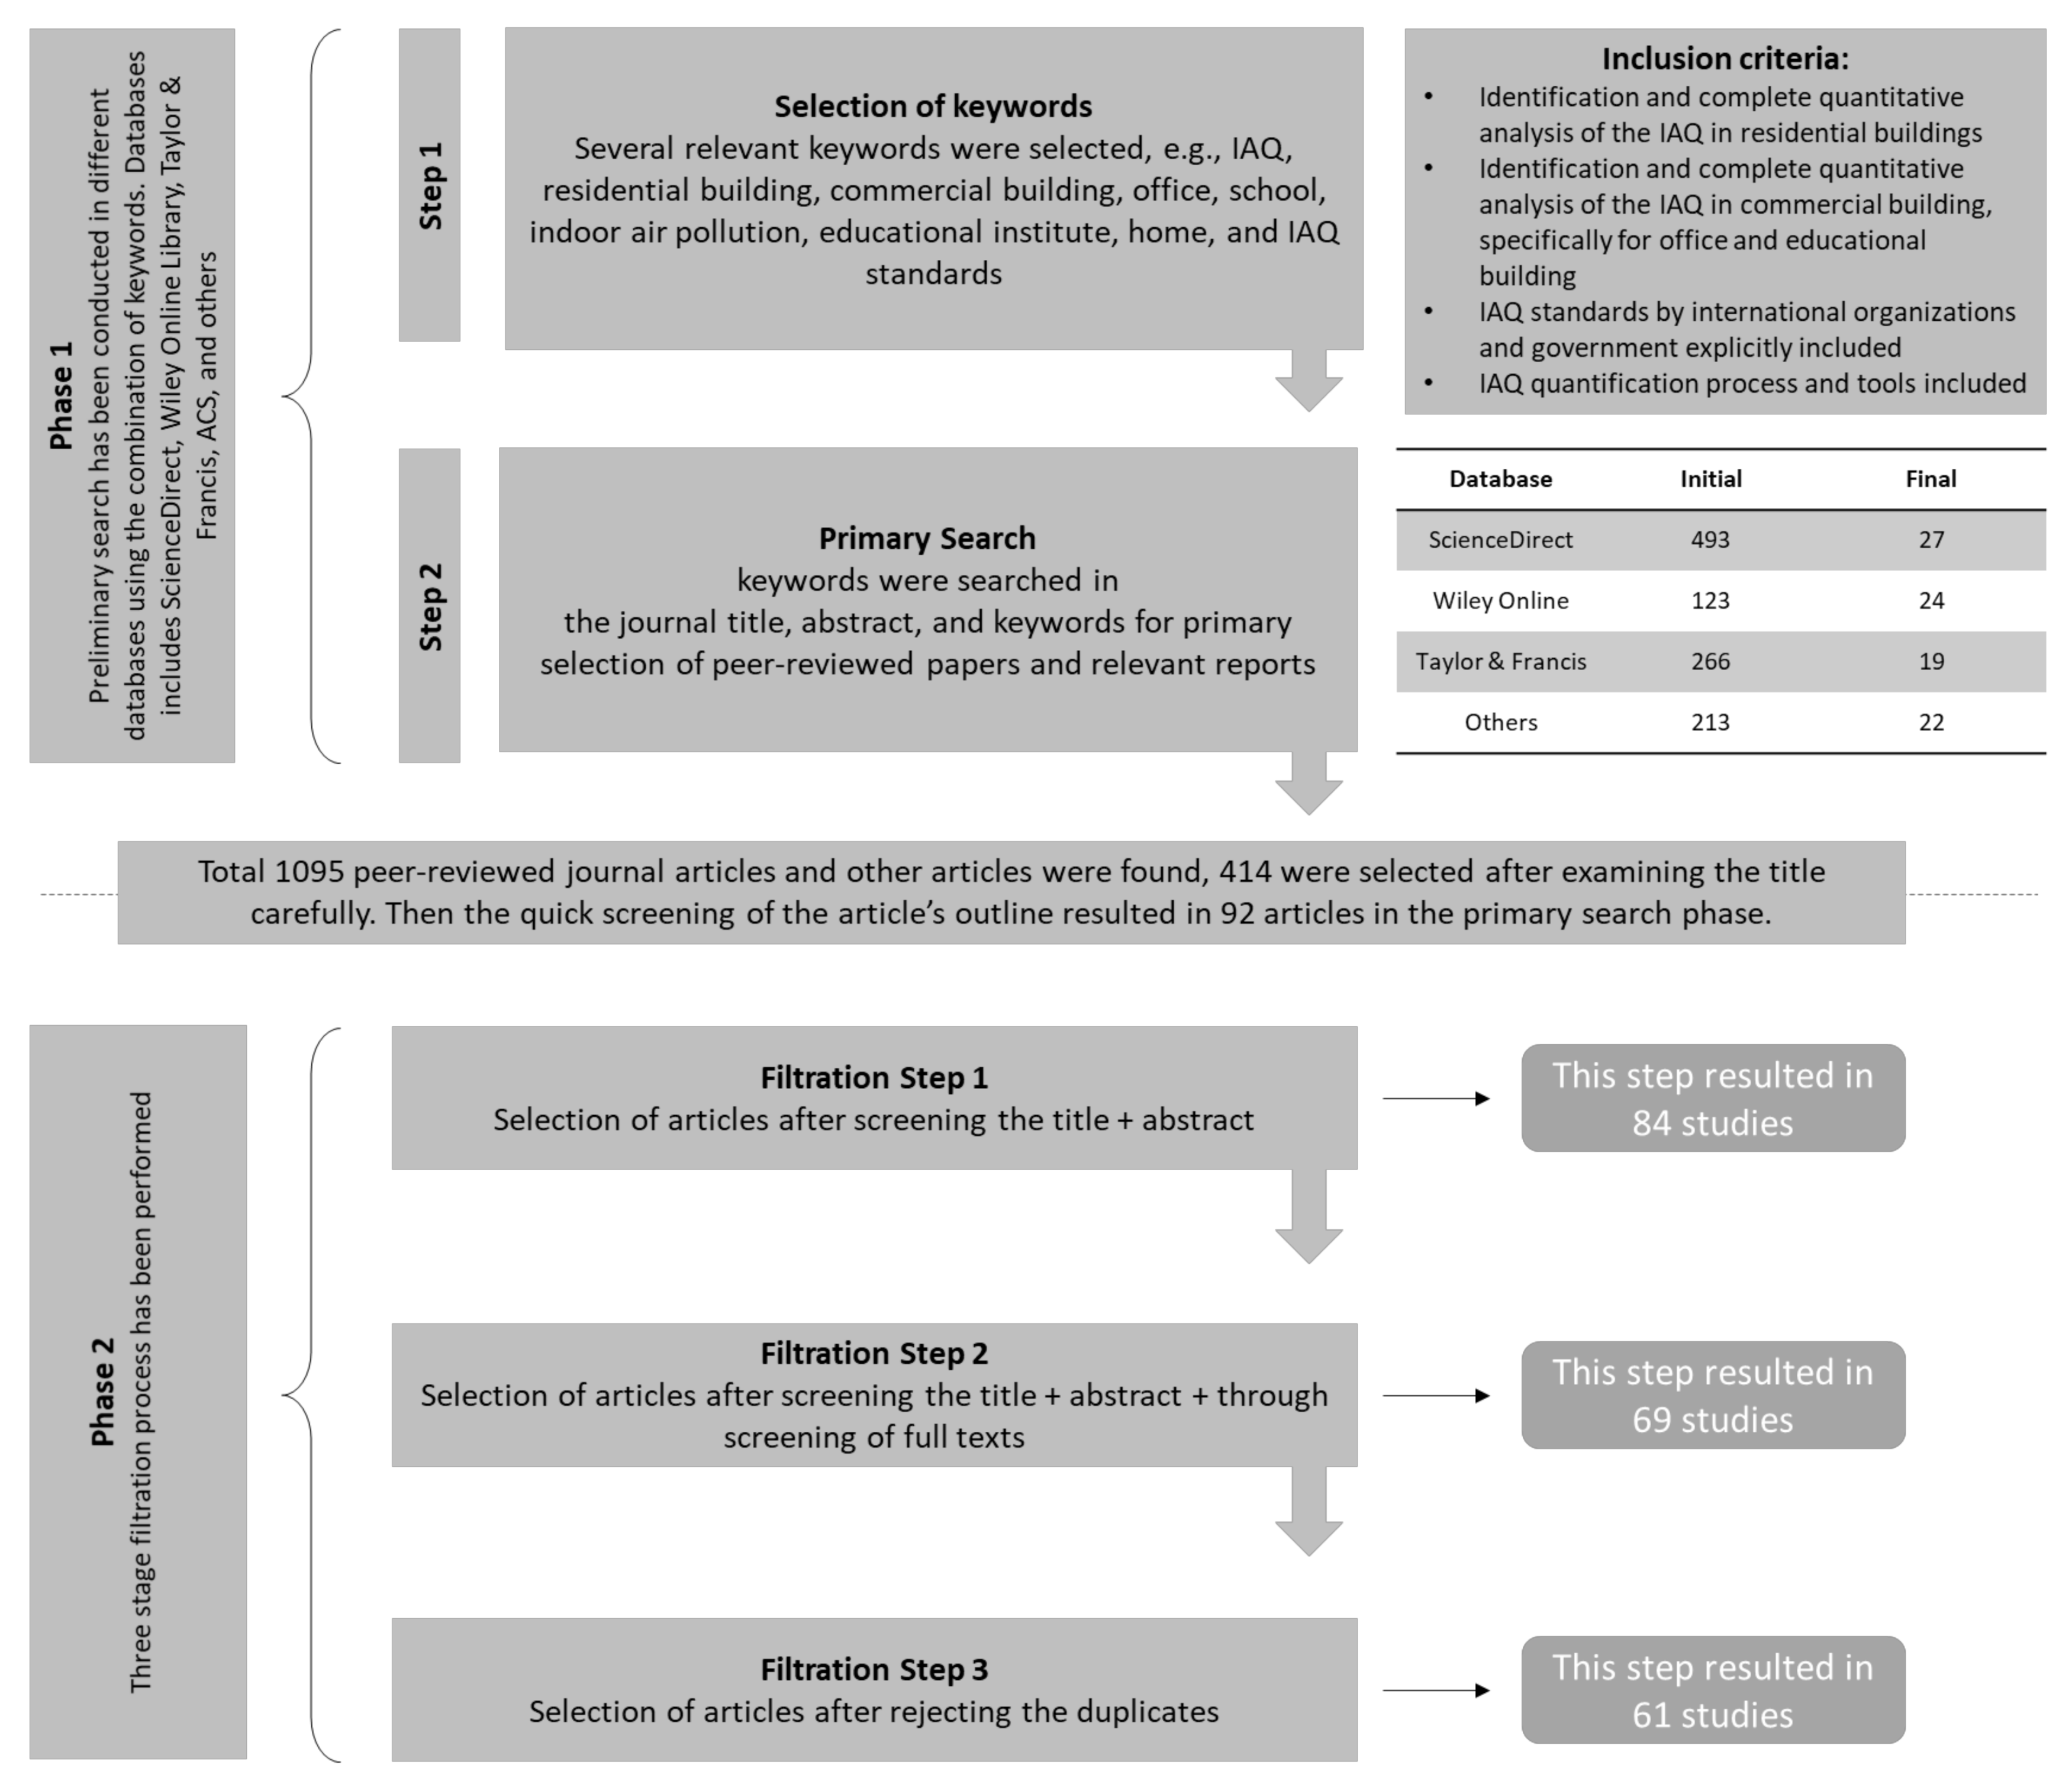
2. Methodology
3. IAQ Standards & Assessment Methods
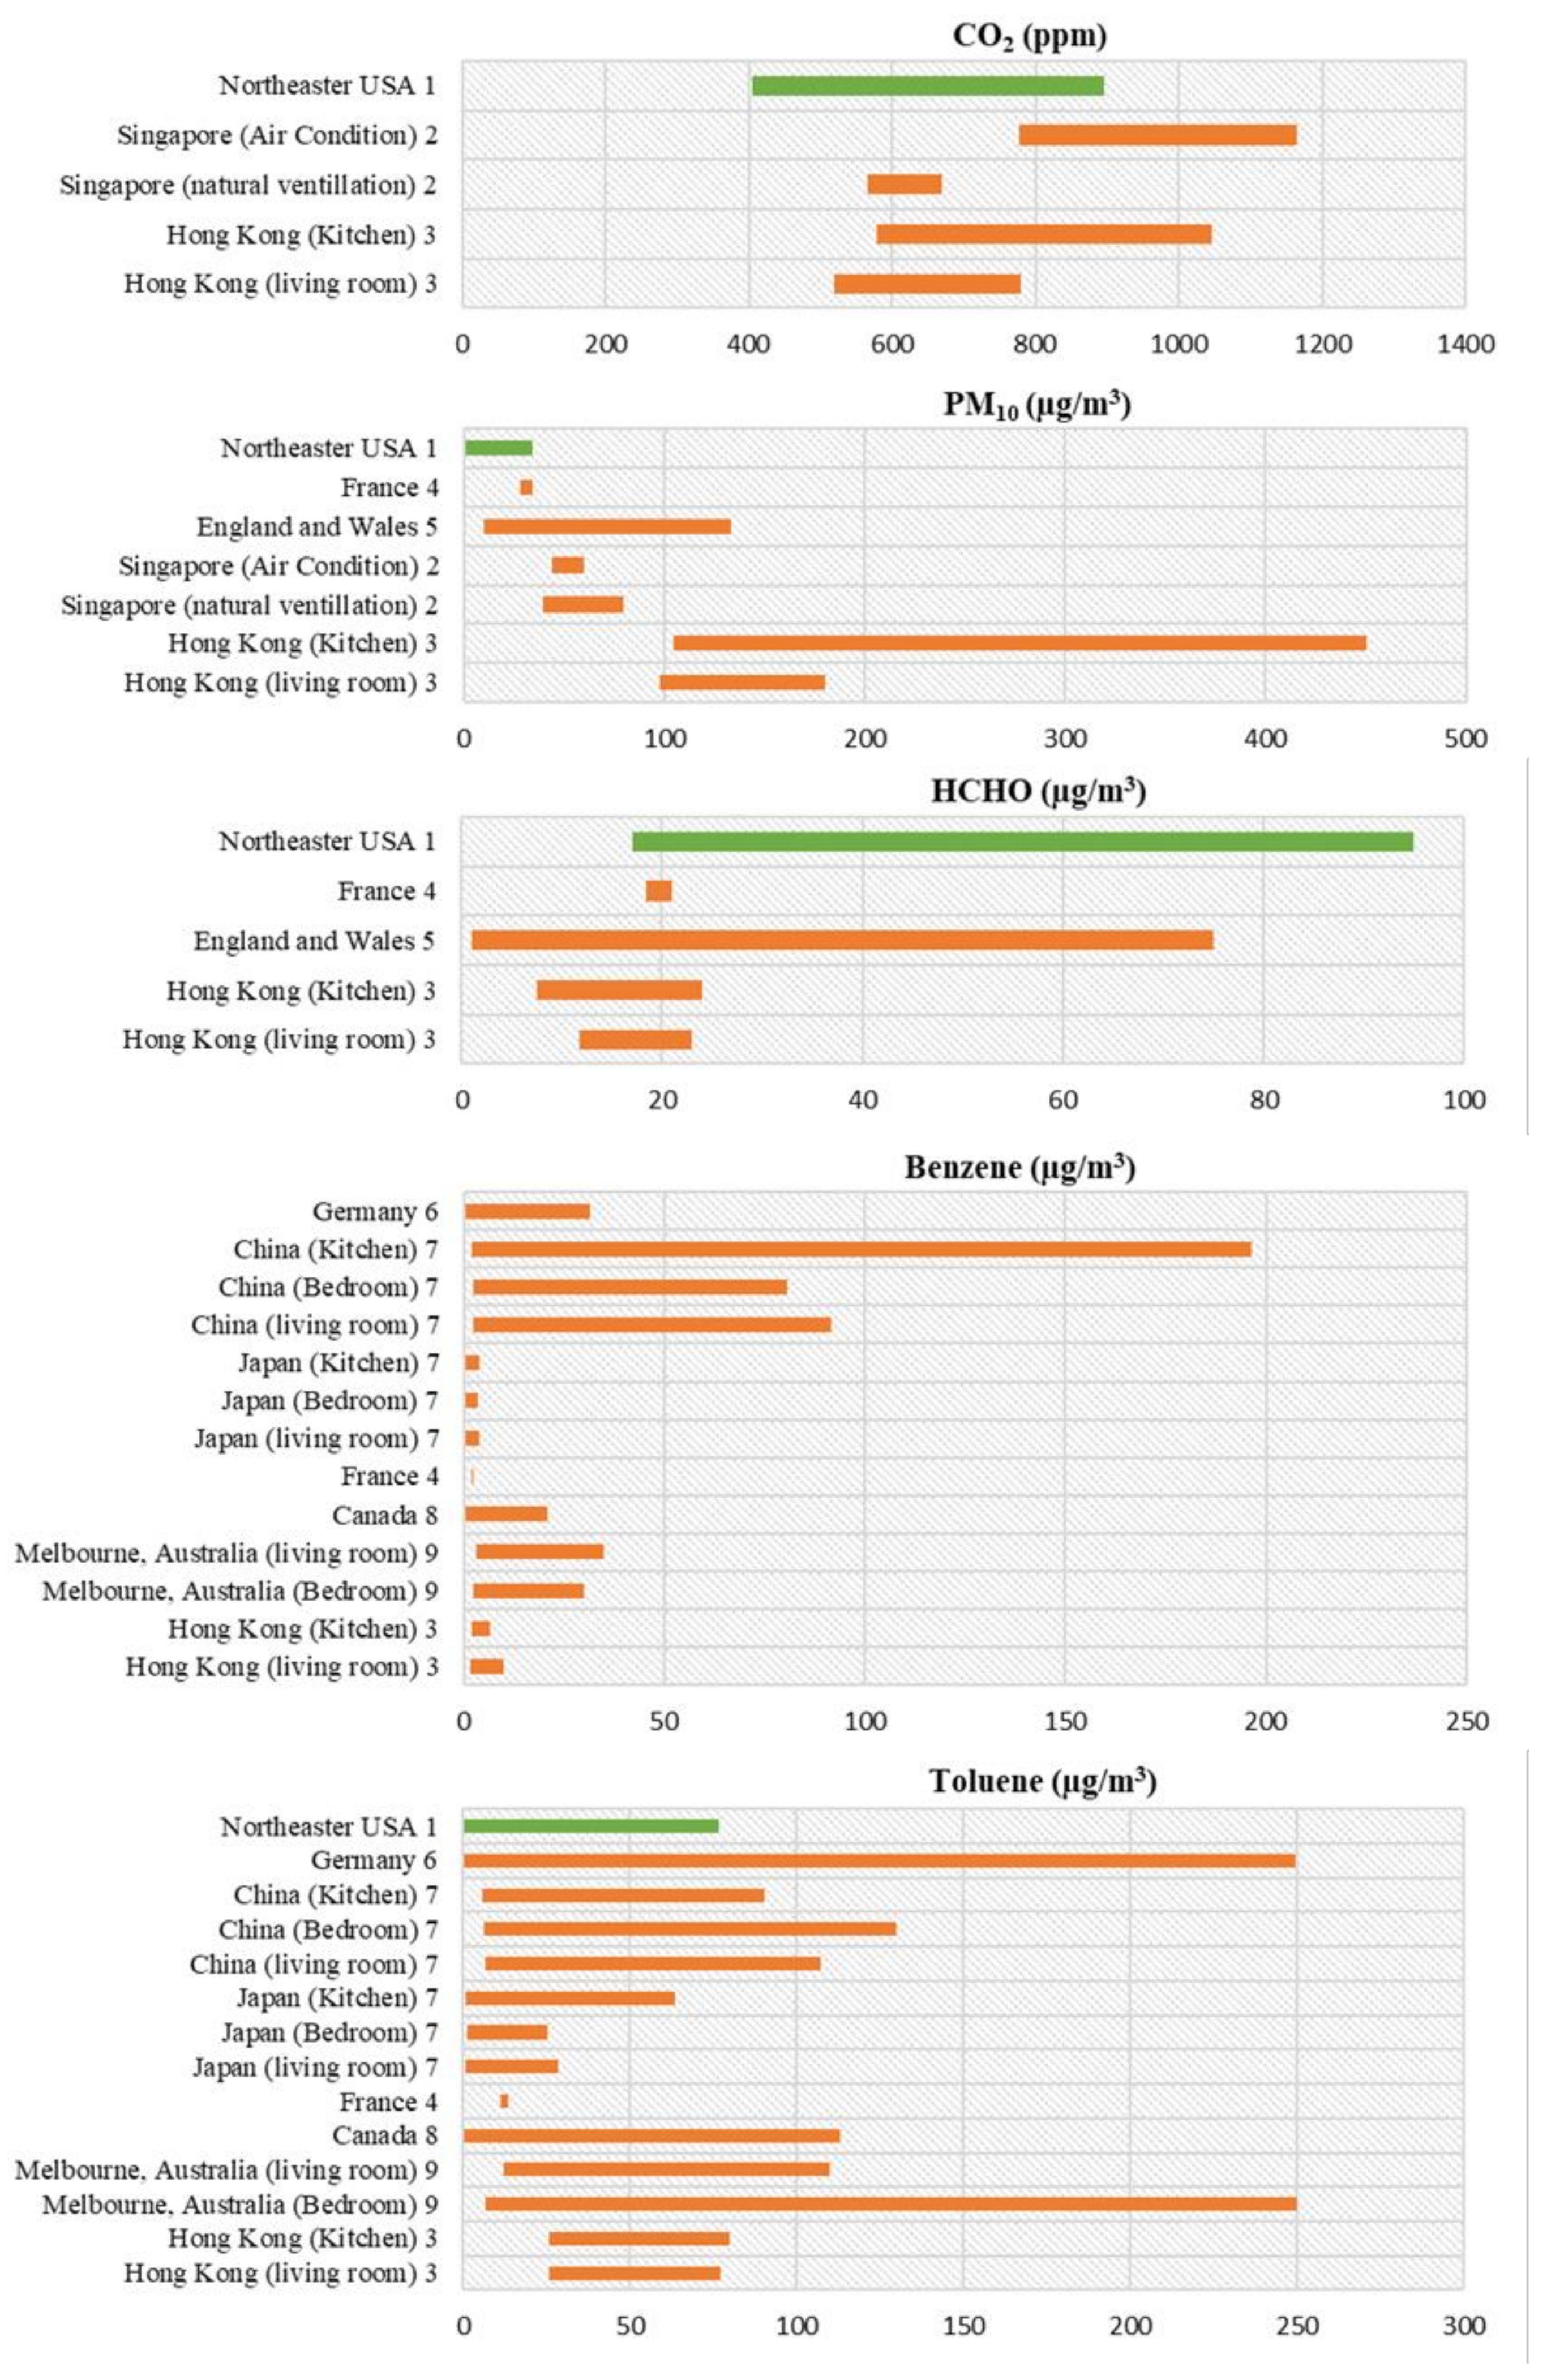
4. Residential Buildings and IAQ Assessment
5. Commercial Buildings and IAQ Assessment
6. Conclusions and Future Scope
Author Contributions
Funding
Institutional Review Board Statement
Informed Consent Statement
Data Availability Statement
Acknowledgments
Conflicts of Interest
References
- Klepeis, N.E.; Nelson, W.C.; Ott, W.R.; Robinson, J.P.; Tsang, A.M.; Switzer, P.; Behar, J.V.; Hern, S.C.; Engelmann, W.H. The National Human Activity Pattern Survey (NHAPS): A resource for assessing exposure to environmental pollutants. J. Expo. Anal. Environ. Epidemiol. 2001, 11, 231–252. [Google Scholar] [CrossRef]
- Sundell, J. On the history of indoor air quality and health. Indoor Air Suppl. 2004, 14, 51–58. [Google Scholar] [CrossRef] [PubMed]
- EPA. Indoor Air Pollution and Health. Report Series No. 104. 2013. Available online: https://www.epa.ie/pubs/reports/research/health/IndoorAirPollutionandHealth.pdf (accessed on 23 March 2020).
- Sisask, M.; Värnik, P.; Värnik, A.; Apter, A.; Balazs, J.; Balint, M.; Bobes, J.; Brunner, R.; Corcoran, P.; Cosman, D.; et al. Teacher satisfaction with school and psychological well-being affects their readiness to help children with mental health problems. Health Educ. J. 2014, 73, 382–393. [Google Scholar] [CrossRef]
- Jones, A.P. Indoor air quality and health. Atmos. Environ. 1999, 33, 4535–4564. [Google Scholar] [CrossRef]
- Vilčeková, S.; Apostoloski, I.Z.; Mečiarová, Ľ.; Burdová, E.K.; Kiseľák, J. Investigation of indoor air quality in houses of Macedonia. Int. J. Environ. Res. Public Health 2017, 14, 37. [Google Scholar] [CrossRef]
- Prajakta, P. Shrimandilkar, Indoor Air Quality Monitoring for Human Health. Ijmer 2013, 3, 891–897. Available online: http://www.ijmer.com/papers/Vol3_Issue2/BV32891897.pdf (accessed on 18 January 2020).
- World Health Organization. Indoor Air Pollution: National Burden of Disease Estimates; WHO: Geneva, Switzerland, 2007; Available online: https://www.who.int/airpollution/publications/indoor_air_national_burden_estimate_revised.pdf?ua=1 (accessed on 5 June 2019).
- Apte, K.; Salvi, S. Household air pollution and its effects on health. F1000Research 2016, 5, 2593. [Google Scholar] [CrossRef]
- Swanson, M.C. Clearing the Air: Asthma and Indoor Air Exposures. Ann. Allergy Asthma Immunol. 2001, 87, 80. [Google Scholar] [CrossRef]
- Dales, R.; Liu, L.; Wheeler, A.J.; Gilbert, N.L. Quality of indoor residential air and health. Can. Med. Assoc. J. 2008, 179, 147–152. [Google Scholar] [CrossRef]
- Park, J.H.; Spiegelman, D.L.; Burge, H.A.; Gold, D.R.; Chew, G.L.; Milton, D.K. Longitudinal study of dust and airbone endotoxin in the home. Environ. Health Perspect. 2000, 108, 1023–1028. [Google Scholar] [CrossRef]
- Park, J.H.; Gold, D.R.; Spiegelman, D.L.; Burge, H.A.; Milton, D.K. House dust endotoxin and wheeze in the first year of life. Am. J. Respir. Crit. Care Med. 2001, 163, 322–328. [Google Scholar] [CrossRef] [PubMed]
- Lawton, M.D. The influence of house characteristics in a canadian community on microbiological contamination. Indoor Air 1998, 8, 2–11. [Google Scholar] [CrossRef]
- Fisk, W.J.; Lei-Gomez, Q.; Mendell, M.J. Meta-analyses of the associations of respiratory health effects with dampness and mold in homes. Indoor Air 2007, 17, 284–296. [Google Scholar] [CrossRef]
- U.S. Department of Health and Human Services. The Health Consequences of Involuntary Exposure to Tobacco Smoke: A Report of the Surgeon General; Department of Health and Human Services; Centers for Disease Control and Prevention; Coordinating Center for Health Promotion; National Center for Chronic Disease Prevention and Health Promotion; Office on Smoking and Health: Atlanta, GA, USA, 2006.
- Department of Health and Human Services. The Health Consequences of Smoking—50 Years of Progress A Report of the Surgeon General. Rep. Surg. Gen. 2014. [Google Scholar] [CrossRef]
- Mehta, S. Characterizing Exposures to Indoor Air Pollution from Household Solid Fuel Use; University of California: Berkeley, CA, USA, 2002. [Google Scholar]
- Zhang, J.; Smith, K.R. Household air pollution from coal and biomass fuels in China: Measurements, health impacts, and interventions. Environ. Health Perspect. 2007, 115, 848–855. [Google Scholar] [CrossRef]
- Shimer, P.L.J.D.; Thomas, J. Phillips, Indoor Air Pollution in California; Report to the California Legislature; 2005. Available online: https://ww2.arb.ca.gov/sites/default/files/classic//research/apr/reports/l3041.pdf (accessed on 27 July 2020).
- Liu, K.S.; Paz, M.K.; Flessel, P.; Waldman, J.; Girman, J.; Paz, M.K.; Girman, J. Unintentional carbon monoxide deaths in california from residential and other nonvehicular sources. Arch. Environ. Health 2000, 55, 375–381. [Google Scholar] [CrossRef] [PubMed]
- Spengler, J.D.; McCarthy, J.F.; Samet, J.M. Indoor Air Quality Handbook; McGRAW-HILL: New York, NY, USA, 2001; ISBN 9780074455494. [Google Scholar]
- Weichenthal, S.; Dufresne, A.; Infante-Rivard, C. Review: Indoor nitrogen dioxide and VOC exposures: Summary of evidence for an association with childhood asthma and a case for the inclusion of indoor ultrafine particle measures in future studies. Indoor Built Environ. 2007, 16, 387–399. [Google Scholar] [CrossRef]
- Dobbs, A.J.; Williams, N. Indoor air pollution from pesticides used in wood remedial treatments. Environ. Pollut. Ser. B Chem. Phys. 1983, 6, 271–296. [Google Scholar] [CrossRef]
- Rudel, R.A.; Camann, D.E.; Spengler, J.D.; Korn, L.R.; Brody, J.G. Phthalates, alkylphenols, pesticides, polybrominated diphenyl ethers, and other endocrine-disrupting compounds in indoor air and dust. Environ. Sci. Technol. 2003, 37, 4543–4553. [Google Scholar] [CrossRef]
- WHO. WHO Guidelines for Indoor Air Quality: Selected Pollutants; WHO: Geneva, Switzerland, 2010. [Google Scholar] [CrossRef]
- US EPA. Formaldehyde’s Impact on Indoor Air Quality. 2016. Available online: https://www.epa.gov/indoor-air-quality-iaq/formaldehydes-impact-indoor-air-quality (accessed on 25 May 2020).
- Hodgson, A.T.; Rudd, A.F.; Beal, D.; Chandra, S. Volatile Organic Compound Concentrations and Emission Rates in New Manufactured and Site-Built Houses. Indoor Air 2000, 10, 178–192. [Google Scholar] [CrossRef]
- Sparks, L.E. Volatile organic compound emissions from latex paint -Part 2. Test house studies and indoor air quality (IAQ) modeling. Indoor Air 1999, 9, 18–25. [Google Scholar] [CrossRef]
- Franklin, P.J. Indoor air quality and respiratory health of children. Paediatr. Respir. Rev. 2007, 8, 281–286. [Google Scholar] [CrossRef] [PubMed]
- Jaakkola, J.J.K.; Verkasalo, P.K.; Jaakkola, N. Plastic wall materials in the home and respiratory health in young children. Am. J. Public Health 2000, 90, 797–799. [Google Scholar] [CrossRef]
- US-EPA. EPA Assessment of Risks from Radon in Homes; Office of Air and Radiation; U.S. Environmental Protection Agency: Washington, DC, USA, 2003.
- Abdul–Wahab, S.A.A.; En, S.C.F.; Elkamel, A.; Ahmadi, L.; Yetilmezsoy, K. A review of standards and guidelines set by international bodies for the parameters of indoor air quality. Atmos. Pollut. Res. 2015, 6, 751–767. [Google Scholar] [CrossRef]
- WHO. New Guidelines for Selected Indoor Chemicals Establish Targets at Which Health Risks are Significantly Reduced. 2010. Available online: https://www.euro.who.int/__data/assets/pdf_file/0004/128605/Factsheet_indoor_chem_15_Dec_10.pdf (accessed on 29 April 2020).
- Singapore Public Health Ministry of the Environment. Guidelines for Good Indoor Air Quality in Office Premises; Institute of Environmental Epidemiology; Ministry of the Environment: Singapore, 1996; pp. 1–47.
- NIOSH. NIOSH Pocket Guide to Chemical Hazards (NPG). 2004. Available online: http://www.cdc.gov/niosh/npg/npgd0620.html%5Cnhttp://www.cdc.gov/niosh/npg/npgd0293.html (accessed on 30 May 2020).
- Health Canada. Exposure Guidelines for Residential Indoor Air Quality; Environmental Health Directorate: Ottawa, ON, Canada, 1989. Available online: http://www.hc-sc.gc.ca/ewh-semt/pubs/air/exposure-exposition/index-eng.php (accessed on 19 February 2020).
- Bai, Z.; Jia, C.; Zhu, T.; Zhang, J. Indoor Air Quality Related Standards in China. Proc. Indoor Air 2002, 1012–1017. Available online: https://www.irbnet.de/daten/iconda/CIB7659.pdf (accessed on 7 August 2019). [CrossRef]
- Health and Safety Executive. EH40/2005 Workplace Exposure Limits. 2011. Available online: http://www.hse.gov.uk/pubns/priced/eh40.pdf (accessed on 30 December 2019).
- NHMRC (The National Health and Medical Research Council). Goals for Maximum Permissible Levels of Pollutants in Indoor Air. In Interim National Indoor Air Quality Goals; The National Health and Medical Research Council: Melbourne, Australia, 1996. [Google Scholar]
- Environmental Protection Agency. Typical Indoor Air Pollutants. 2009. Available online: https://www.epa.gov/sites/production/files/2014-08/documents/refguide_appendix_e.pdf (accessed on 15 August 2020).
- Lindgren, T. A case of indoor air pollution of ammonia emitted from concrete in a newly built office in Beijing. Build. Environ. 2010, 45, 596–600. [Google Scholar] [CrossRef]
- Stabile, L.; Dell’Isola, M.; Frattolillo, A.; Massimo, A.; Russi, A. Effect of natural ventilation and manual airing on indoor air quality in naturally ventilated Italian classrooms. Build. Environ. 2016, 98, 180–189. [Google Scholar] [CrossRef]
- Godwin, C.; Batterman, S. Indoor air quality in Michigan schools. Indoor Air 2007, 17, 109–121. [Google Scholar] [CrossRef]
- Chithra, V.S.; Nagendra, S.M.S. Indoor air quality investigations in a naturally ventilated school building located close to an urban roadway in Chennai, India. Build. Environ. 2012, 54, 159–167. [Google Scholar] [CrossRef]
- Ramalho, O.; Derbez, M.; Gregoire, A.; Garrigue, J.; Kirchner, S. French Permanent Survey on Indoor Air Quality-Part. 1: Measurement Protocols and Quality Control, HB 2006. Heal. Build. Creat. A Heal. Indoor Environ. People Proc. 2006, 3, 321–326. [Google Scholar]
- Derbez, M.; Wyart, G.; le Ponner, E.; Ramalho, O.; Ribéron, J.; Mandin, C. Indoor air quality in energy-efficient dwellings: Levels and sources of pollutants. Indoor Air 2018, 28, 318–338. [Google Scholar] [CrossRef]
- Persson, J.; Wang, T.; Hagberg, J. Indoor air quality of newly built low-energy preschools—Are chemical emissions reduced in houses with eco-labelled building materials? Indoor Built Environ. 2019, 28, 506–519. [Google Scholar] [CrossRef]
- Lee, S.C.; Li, W.M.; Ao, C.H. Investigation of indoor air quality at residential homes in Hong Kong - Case study. Atmos. Environ. 2002, 36, 225–237. [Google Scholar] [CrossRef]
- Ministry of Housing, Communities and Local Government. Ventilation and Indoor Air Quality in New Homes. 2019. Available online: https://assets.publishing.service.gov.uk/government/uploads/system/uploads/attachment_data/file/835208/Research_-_ventilation_and_indoor_air_quality.pdf (accessed on 7 June 2020).
- Yang, W.; Sohn, J.; Kim, J.; Son, B.; Park, J. Indoor air quality investigation according to age of the school buildings in Ko-rea. J. Environ. Manag. 2009, 90, 348–354. [Google Scholar] [CrossRef]
- Datta, A.; Suresh, R.; Gupta, A.; Singh, D. Kulshrestha, Indoor air quality of non-residential urban buildings in Delhi, India. Int. J. Sustain. Built Environ. 2017, 6, 412–420. [Google Scholar] [CrossRef]
- Mandin, C.; Trantallidi, M.; Cattaneo, A.; Canha, N.; Mihucz, V.G.; Szigeti, T.; Mabilia, R.; Perreca, E.; Spinazzè, A.; Fossati, S.; et al. Assessment of indoor air quality in office buildings across Europ—The OFFICAIR study. Sci. Total Environ. 2017, 579, 169–178. [Google Scholar] [CrossRef] [PubMed]
- Jo, W.J.; Sohn, J.Y. The effect of environmental and structural factors on indoor air quality of apartments in Korea. Build. Environ. 2009, 44, 1794–1802. [Google Scholar] [CrossRef]
- Yoon, C.; Lee, K.; Park, D. Indoor air quality differences between urban and rural preschools in Korea. Environ. Sci. Pollut. Res. 2011, 18, 333–345. [Google Scholar] [CrossRef] [PubMed]
- Rösch, C.; Kohajda, T.; Röder, S.; von Bergen, M.; Schlink, U. Relationship between sources and patterns of VOCs in Indoor Air. Atmos. Pollut. Res. 2014, 5, 129–137. [Google Scholar] [CrossRef]
- Liu, S.; Li, R.; Wild, R.J.; Warneke, C.; de Gouw, J.A.; Brown, S.S.; Miller, S.L.; Luongo, J.C.; Jimenez, J.L.; Ziemann, P.J. Contribution of human-related sources to indoor volatile organic compounds in a university classroom. Indoor Air 2016, 26, 925–938. [Google Scholar] [CrossRef] [PubMed]
- Zhu, J.; Newhook, R.; Marro, L.; Chan, C.C. Selected volatile organic compounds in residential air in the city of Ottawa, Canada. Environ. Sci. Technol. 2005, 39, 3964–3971. [Google Scholar] [CrossRef] [PubMed]
- McCarron, B.; Meng, X.; Colclough, S. A pilot study of radon levels in certified passive house buildings. Build. Serv. Eng. Res. Technol. 2019, 40, 296–304. [Google Scholar] [CrossRef]
- Brown, S.K. Volatile organic pollutants in new and established buildings in Melbourne, Australia. Indoor Air 2002, 12, 55–63. [Google Scholar] [CrossRef]
- Wong, N.H.; Huang, B. Comparative study of the indoor air quality of naturally ventilated and air-conditioned bedrooms of residential buildings in Singapore. Build. Environ. 2004, 39, 1115–1123. [Google Scholar] [CrossRef]
- Shao, L.; Li, J.; Zhao, H.; Yang, S.; Li, H.; Li, W.; Jones, T.; Sexton, K.; BéruBé, K. Associations between particle physicochemical characteristics and oxidative capacity: An indoor PM10 study in Beijing, China. Atmos. Environ. 2007, 41, 5316–5326. [Google Scholar] [CrossRef]
- Kirchner, S.; Derbez, M.; Duboudin, C.; Elias, P.; Lucas, J.; Pasquier, N.; Ramalho, O.; Gregoire, A. Indoor air quality in French dwellings. Proc. Indoor Air 2008, 30, 574. [Google Scholar]
- Langer, S.; Ramalho, O.; le Ponner, E.; Derbez, M.; Kirchner, S.; Mandin, C. Perceived indoor air quality and its relationship to air pollutants in French dwellings. Indoor Air 2017, 27, 1168–1176. [Google Scholar] [CrossRef]
- Kulshreshtha, P.; Khare, M.; Seetharaman, P. Indoor air quality assessment in and around urban slums of Delhi city, India. Indoor Air 2008, 18, 488–498. [Google Scholar] [CrossRef]
- Ohura, T.; Amagai, T.; Shen, X.; Li, S.; Zhang, P.; Zhu, L. Comparative study on indoor air quality in Japan and China: Characteristics of residential indoor and outdoor VOCs. Atmos. Environ. 2009, 43, 6352–6359. [Google Scholar] [CrossRef]
- Cattaneo, A.; Peruzzo, C.; Garramone, G.; Urso, P.; Ruggeri, R.; Carrer, P.; Cavallo, D.M. Airborne particulate matter and gaseous air pollutants in residential structures in lodi province, Italy. Indoor Air 2011, 21, 489–500. [Google Scholar] [CrossRef]
- Semple, S.; Garden, C.; Coggins, M.; Galea, K.S.; Whelan, P.; Cowie, H.; Sánchez-Jiménez, A.; Thorne, P.S.; Hurley, J.F.; Ayres, J.G. Contribution of solid fuel, gas combustion, or tobacco smoke to indoor air pollutant concentrations in Irish and Scottish homes. Indoor Air 2011, 22, 212–223. [Google Scholar] [CrossRef]
- Funk, W.E.; Pleil, J.D.; Pedit, J.A.; Boundy, M.G.; Yeatts, K.B.; Nash, D.G.; Trent, C.B.; el Sadig, M.; Davidson, C.A.; Leith, D. Indoor Air Quality in the United Arab Emirates. J. Environ. Prot. 2014, 5, 709–722. [Google Scholar] [CrossRef]
- Xiong, Y.; Krogmann, U.; Mainelis, G.; Rodenburg, L.A.; Andrews, C.J. Indoor air quality in green buildings: A case-study in a residential high-rise building in the northeastern United States. J. Environ. Sci. Health Part A Toxic/Hazardous Subst. Environ. Eng. 2015, 50, 225–242. [Google Scholar] [CrossRef] [PubMed]
- Frey, S.E.; Destaillats, H.; Cohn, S.; Ahrentzen, S.; Fraser, M.P. The effects of an energy efficiency retrofit on indoor air quality. Indoor Air 2015, 25, 210–219. [Google Scholar] [CrossRef] [PubMed]
- Tagle, M.; Pillarisetti, A.; Hernandez, M.T.; Troncoso, K.; Soares, A.; Torres, R.; Galeano, A.; Oyola, P.; Balmes, J.; Smith, K.R. Monitoring and modeling of household air quality related to use of different Cookfuels in Paraguay. Indoor Air 2019, 29, 252–262. [Google Scholar] [CrossRef] [PubMed]
- Du, L.; Leivo, V.; Prasauskas, T.; Täubel, M.; Martuzevicius, D.; Haverinen-Shaughnessy, U. Effects of energy retrofits on Indoor Air Quality in multifamily buildings. Indoor Air 2019, 29, 686–697. [Google Scholar] [CrossRef]
- Zhao, H.; Chan, W.R.; Cohn, S.; Delp, W.W.; Walker, I.S.; Singer, B.C. Indoor air quality in new and renovated low-income apartments with mechanical ventilation and natural gas cooking in California. Indoor Air 2020. [Google Scholar] [CrossRef] [PubMed]
- Singer, B.C.; Chan, W.R.; Kim, Y.S.; Offermann, F.J.; Walker, I.S. Indoor air quality in California homes with code-required mechanical ventilation. Indoor Air 2020, 30, 885–899. [Google Scholar] [CrossRef]
- Cheng, M.; Brown, S.K. VOCs identified in Australian indoor air and product emission environments. Proc. Indoor Air 2005, 2, 2200–2205. [Google Scholar]
- Loupa, G.; Kioutsioukis, I.; Rapsomanikis, S. Indoor-outdoor atmospheric particulate matter relationships in naturally ventilated offices. Indoor Built Environ. 2007, 16, 63–69. [Google Scholar] [CrossRef]
- Triantafyllou, A.G.; Zoras, S.; Evagelopoulos, V.; Garas, S. PM10, O3, CO concentrations and elemental analysis of airborne particles in a school building. Water Air Soil Pollut. Focus 2008, 8, 77–87. [Google Scholar] [CrossRef]
- Stranger, M.; Potgieter-Vermaak, S.S.; van Grieken, R. Characterization of indoor air quality in primary schools in Antwerp, Belgium. Indoor Air 2008, 18, 454–463. [Google Scholar] [CrossRef]
- Wong, L.T.; Mui, K.W.; Hui, P.S.; Chan, W.Y. Indoor air quality of air-conditioned offices of Hong Kong: An IAQ policy influence. Indoor Air 2008, 2003, 17–22. [Google Scholar]
- Wu, X.; Apte, M.G.; Bennett, D.H. Indoor particle levels in small- and medium-sized commercial buildings in california. Environ. Sci. Technol. 2012, 46, 12355–12363. [Google Scholar] [CrossRef]
- Ben-David, T.; Waring, M.S. Impact of natural versus mechanical ventilation on simulated indoor air quality and energy consumption in offices in fourteen U.S. cities. Build. Environ. 2016, 104, 320–336. [Google Scholar] [CrossRef]
- Fadeyi, M.O.; Alkhaja, K.; Sulayem, M.B.; Abu-Hijleh, B. Evaluation of indoor environmental quality conditions in elementary schools’ classrooms in the United Arab Emirates. Front. Archit. Res. 2014, 3, 166–177. [Google Scholar] [CrossRef]
- Mainka, A.; Brągoszewska, E.; Kozielska, B.; Pastuszka, J.S.; Zajusz-Zubek, E. Indoor air quality in urban nursery schools in Gliwice, Poland: Analysis of the case study. Atmos. Pollut. Res. 2015, 6, 1098–1104. [Google Scholar] [CrossRef]
- Rosbach, J.; Krop, E.; Vonk, M.; van Ginkel, J.; Meliefste, C.; de Wind, S.; Gehring, U.; Brunekreef, B. Classroom ventilation and indoor air quality—results from the FRESH intervention study. Indoor Air 2016, 26, 538–545. [Google Scholar] [CrossRef]
- Saraga, D.; Maggos, T.; Sadoun, E.; Fthenou, E.; Hassan, H.; Tsiouri, V.; Karavoltsos, S.; Sakellari, A.; Vasilakos, C.; Kakosimos, K. Chemical characterization of indoor and outdoor particulate matter (PM2.5, PM10) in Doha, Qatar. Aerosol Air Qual. Res. 2017, 17, 1156–1168. [Google Scholar] [CrossRef]
- Abdel-Salam, M.M.M. Investigation of indoor air quality at urban schools in Qatar. Indoor Built Environ. 2019, 28, 278–288. [Google Scholar] [CrossRef]
- Argunhan, Z.; Avci, A.S. Statistical Evaluation of Indoor Air Quality Parameters in Classrooms of a University. Adv. Meteorol. 2018, 2018, 1–10. [Google Scholar] [CrossRef]
- Spinazzè, A.; Campagnolo, D.; Cattaneo, A.; Urso, P.; Sakellaris, I.A.; Saraga, D.E.; Mandin, C.; Canha, N.; Mabilia, R.; Perreca, E.; et al. Indoor gaseous air pollutants determinants in office buildings—The OFFICAIR project. Indoor Air 2020, 30, 76–87. [Google Scholar] [CrossRef] [PubMed]
- Simanic, B.; Nordquist, B.; Bagge, H.; Johansson, D. Indoor air temperatures, CO2 concentrations and ventilation rates: Long-term measurements in newly built low-energy schools in Sweden. J. Build. Eng. 2019, 25, 100827. [Google Scholar] [CrossRef]
- Ruggieri, S.; Longo, V.; Perrino, C.; Canepari, S.; Drago, G.; L’Abbate, L.; Balzan, M.; Cuttitta, G.; Scaccianoce, G.; Minardi, R.; et al. Indoor air quality in schools of a highly polluted south Mediterranean area. Indoor Air 2019, 29, 276–290. [Google Scholar] [CrossRef] [PubMed]
- Gall, E.T.; Carter, E.M.; Earnest, C.M.; Stephens, B. Indoor air pollution in developing countries: Research and implementation needs for improvements in global public health. Am. J. Public Health 2013, 103, 67–72. [Google Scholar] [CrossRef] [PubMed]


| Contaminants | Sources | Possible Consequences | Ref. |
|---|---|---|---|
| Biological Contaminants | |||
| Allergens | Furry pets, dust mites | Asthma | [10,11] |
| Endotoxins | Presence of cats and dogs, contaminated humidifiers, storage of food waste, lower ventilation rate, increased amount of settled dust | Asthma, reduced lung function | [12,13] |
| Dampness and mold | Unattended plumbing leaks, leaks in building fabric, hidden food spills, standing water | Upper respiratory symptoms, cough, wheeze, and asthma | [14,15] |
| Chemical Contaminants | |||
| Smoke | Tobacco smoke | Premature mortality, lung cancer, coronary artery disease, childhood cough and wheeze, respiratory illness, infant death syndrome | [16,17] |
| Coal & biomass fuels combustion product | Cooking and heating | Combustion of solid fuels releases CO, N2O, particulates, poly-cyclic hydrocarbons, which increases risk of lung cancer, childhood asthma | [18,19] |
| Carbon Monoxide (CO) | Vehicle exhaust from attached garages, gas stoves, furnaces, woodstoves, fireplaces & cigarettes | Headache, nausea, fatigue | [20,21] |
| Nitrogen dioxide (N2O) | Combustion of fossil fuels e.g., gas or oil furnaces and stoves | Increased risk of respiratory symptoms | [22,23] |
| Pesticides | Contaminated soil, stored pesticide containers | Irritation to eye, nose, and throat, damage to central nervous system | [24,25] |
| Off Gassing Emissions (Gases released from indoor materials) | |||
| Formaldehyde (HCHO) | Wood-based products assembled using urea-formaldehyde resins, cigarette smoke, paints, varnishes, floor finishes | Eye, nose, throat irritation, asthma, bronchitis, and possible carcinogen | [26,27] |
| Volatile Organic Compounds (VOC) | Cigarette smoke, recently dry-cleaned cloths, room deodorizers, paints, carpets | Asthma, bronchial hyper-reactivity | [28,29,30] |
| Plastic Compounds | Polyvinyl chloride for flooring, plastic wall material | Bronchial obstruction, asthma, wheeze, cough, and phlegm | [31] |
| Carcinogens | |||
| Radon | Natural decay of uranium | Lung cancer, leukemia | [26,32] |
| Particulate Matter | |||
| Ultra-fine particles | Cooking, combustion activities | Serious impact on heart and lungs | [7,26] |
| Parameters | CAS | WHO [34] | Singapore [35] | NIOSH [36] | Canada [37] | China [38] | UK [39] | Australia [40] | US EPA [41] |
|---|---|---|---|---|---|---|---|---|---|
| Benzene (C6H6) | 71-43-2 | No safe level of exposure can be recommended | - | - | - | 90 ug/m3 [1 h avg.] | - | - | - |
| Carbon Di-oxide (CO2) | 124-38-9 | 100 mg/m3 (15 min) 35 mg/m3 (1 h) 10 mg/m3 (8 h) 7 mg/m3 (24 h) | 1000 ppm (8 h avg.) | 5000 ppm (8 h avg) 30,000 ppm (15 min) | ≤6300 mg/m3 (≤3500 ppm) | 1000 ppm (daily avg.) | 15,000 ppm (15 min avg.) 5000 ppm (5 min avg.) | 30,000 ppm (15 min avg.) | 800 ppm |
| Carbon mono-oxide (CO) | 630-08-0 | 86 ppm (15 min avg.) 51 ppm (30 min avg.) 25 ppm (1-h avg.) 8.6 ppm (8-h avg.) | 10 mg/m3 (9 ppm) (8 h avg.) | 35 ppm (8 h avg.) | ≤11 ppm (8 h avg) ≤25 ppm (1 h avg.) | 5.0 mg/m3 (daily avg.) | 11.6 mg/m3 (8 h avg.) | 9 ppm (10,000 μg/m3) (8 h avg.) | 35 ppm (1 h) 9 ppm (8 h) |
| Formaldehyde | 50-00-0 | mg/m3 (30 min) 0.2 mg/m3 (long term) | 0.1 ppm (120 μg/m3) (8 h avg.) | 0.016 ppm 0.1 ppm (15 min) | 120 µg/m3 | 0.12 mg/m3 (1 h avg.) | 2 ppm (15 min avg.) (2500 μg/m3) | 2500 μg/m3 (15 min avg.) | 920 μg/m3 (8 h) |
| Naphthalene | 91-20-3 | 0.01 mg/m3 (annual avg.) | - | - | - | - | - | - | - |
| Nitrogen dioxide | 10102-44-0 | 200 μg/m3 (1 h) 40 μg/m3 (annual avg.) | - | 1 ppm (15 min) | ≤100 µg/m3 ≤480 µg/m3 (1 h) | 0.10 mg/m3 (daily avg.) | 200 μg/m3 (1 h) 40 μg/m3 (1 year) | - | 0.053 ppm |
| Polycyclic aromatic hydrocarbons | 83-32-9 | No threshold can be determined | - | - | - | - | - | - | - |
| Trichloroethylene | 79-01-6 | 4.3 × 10⁻⁷ μg/m3 (unit risk) | - | - | - | - | - | - | - |
| Tetrachloroethylene | 127-18-4 | 0.25 mg/m3 (annual avg.) | - | - | - | - | - | - | - |
| Ozone | 10028-15-6 | - | 0.05 ppm (8 h avg.) (0.100 mg/m3) | 0.1 ppm | ≤240 µg/m3 (1 h) | 0.1 mg/m3 (1 h avg.) | 100 μg/m3 (8 h) | 0.1 ppm (1 h) 0.08 ppm (4 h) | 0.12 ppm (1 h) 0.08 ppm (8 h) |
| Sulfur dioxide (SO2) | 7446-09-5 | - | - | 2 ppm (8 h avg.) 5 ppm (15 min) | ≤50 µg/m3 ≤1000 µg/m3 (5 min) | 0.15 mg/m3 (daily avg.) | - | 0.25 ppm (10 min) 0.2 ppm (1 h) | 0.5 ppm (3 h) 0.14 ppm (24 h) 0.03 ppm (1 year) |
| Relative Humidity (RH) | - | - | <70% | - | 30–80%—summer; 30–55%—winter | - | - | - | - |
| Radon (Rn) | 10043-92-2 | - | - | - | 800 Bq/m3 (1 yr avg.) | - | - | - | - |
| PM2.5 | - | 25 μg/m3 (24 h avg.) 10 μg/m3 (annual avg.) | - | - | ≤40 µg/m3 ≤100 µg/m (1 h) | - | - | - | 65 μg/m3 (24 h) |
| PM10 | - | 50 μg/m3 (24 h) 20 μg/m3 (1 year) | 150 μg/m3 (in office) | - | - | 0.15 mg/m3 (24 h) | - | 90 μg/m3 (1 h avg.) | 150 μg/m3 (24 h) 50 μg/m3 (1 year) |
| Sampling Item | Sampling Methods/Tools | Sampling Duration/Cautions | Ref. |
|---|---|---|---|
| CO2, RH, temperature | Q-Trak monitor (TSI Inc.): Nondispersive infrared analyzer | Sampling duration: 7 days, 10 min (min) average | [30,35,37,42,43] |
| Integrated data loggers (Hobo HO-8) | Sampling in every 5 min | [44] | |
| Indoor air quality meter (IAQ-CALC model 7545) | NA | [45] | |
| CO | Electrochemical sensor (Draeger Pac III) FIM CO- Tester Tx for exhaled air | Sampling duration: 7 days, 5 min average | [46] |
| NO2 | Passive samplers (Palmes tubes) containing triethanolamine absorbent and analyzed by a spectrophotometer | NA | [47,48] |
| PM10 | Dust-Trak air monitor (Model 8520, TSI Inc.), Light scattering | Sampling rate: 1.7 L/min, 1-min interval | [49] |
| Pumped gravimetric method | Sampling duration: 24 h | [50] | |
| Model 2100 Mini- Partisol air sampler (Ruprecht & Patashnick Co.) coupled to a ChemPass model 3400 | 37 mm diameter membrane (2 µm porosity) was used to collect particulate matters | [46] | |
| GRIMM environmental dust monitor, light scattering technology | Sampling rate: 1.2 L/min, for 2 weeks (suitable for PM2.5 and PM1 also) | [45] | |
| Minivol portable air sampler (Airmetrics, PAS 201) with pall flex membrane filter (47 mm) | Filter conditioned in dry air for 48 h, sampling duration 5–7 h | [51] | |
| PM2.5 | PTFE filters (37-mm diameter, 2-μm porosity) | Sampling rate: 1.8 L/min using a personal impactor, duration: 5 p.m. to 8 a.m. on weekdays and 24 h on weekends. Passive samplers and PM filters were stored in a freezer to keep them cool and avoid sunlight exposure | [47] |
| Low volume sampling pump (model 224-PCXR8) with PEM impactor | Every 5 min intervals | [52,53] | |
| Airborne bacteria | Burkard single stage impactor (Burkard Manufacturing Co. Ltd.) with an agar plate, followed by colony counting | Sampling rate: 10 mL/min for 9 min, incubated at 35 °C in an oven for 2 days | [49] |
| HCHO | SKC formaldehyde monitoring kit: Colorimetric method | Sample should be refrigerated and protected from sunlight and immediately sent to the air laboratory for analysis within 1 h | [49] |
| Sample collection: Portable pump (Flec-FL. 1001 or Sibata) with 2,4-DNPH cartridge connected with ozone scrubber. Analysis: two stage thermo desorption followed by gas chromatography/mass spectroscopy | 30 min ventilation of housing unit followed by 5 h of sealing. Samples were taken after that, 30 min each. | [54] | |
| Radial diffusive samplers filled with 2,4-dinitrophenylhydrazine (2,4-DNPH)-coated Florisil (Radiello® code 165), analyzed by liquid chromatography with detection by UV absorption | Sampling duration: 2 weeks | [47,48] | |
| Diffusion sampler SKC UMEx100 based on chemosorbtion on 2,4-dintrophenyl htydrazine, analyzed by liquid chromatography | Sampling duration: 1 week | [42] | |
| Air pull through 2,4-dinitrohydrazine (DNPH) coated silica gel cartridge (Supeleo LPDNPH S10) | Sampling rate: 0.2 L/min for 40 min | [51,55] | |
| VOC | Mass flow controllers (Model No. FC4104CV-G, Autoflow lnc.) trapped by Nutech Cryogenic Concentrator (Model 3550A), analyzed by Hewlett Packard Gas Chromatography (GC) (Model HP6890) using TO-14 method | Sampling rate: 0.011 L/min for 8-h | [49] |
| Diffusive samplers | Exposure period of three days to two weeks | [50] | |
| Radial diffusive sampling onto carbograph 4 adsorbents (Radiello® code 145), analyzed by gas chromatography-mass spectrometry | Sampling duration: 7 days | [46,47] | |
| Passive sampling (diffusion principle) with organic vapor monitors | Middle of the room, height: 1.5 to 2 m | [56] | |
| Thermal desorption tube, analyzed by gas chromatograph/mass selective detector (GC/MSD) | Sampling rate: 0.07∼0.1 L/min | [44,55] | |
| Proton transfer reaction mass spectrometer (PTR-MS) | Sampling duration: Less than 5 min | [57] | |
| Tenax-TA tubes, analyzed by gas-chromatography with flame ionization detection (Varian, model 3700) & modified thermal desorption | Sampling rate: 20 mL/min for 40 min | [48,51] | |
| Air pumped through a charcoal filter (Anasorb 747) | Sampling rate: 250 mL/min for 4 h | [42] | |
| Air collected on adsorbent tubes and analyzed by gas chromatography-mass spectrometry | Sampling rate: 100 mL/min for 100 min | [58] | |
| Organic vapor sampler, adsorbed on activated charcoal column, analyzed by gas chromatography-mass spectrometry | Sampling duration: 8 h | [45] | |
| TBC | RCS sampler (Biotest air samplers) following centrifugal impaction principle | Sampling rate: 40 L/min for 4 min | [51] |
| Rn | CR-393 alpha track diffusion radon gas detectors | Sampling duration: 3 months | [59] |
| Alpha Guard Professional Radon Monitor | Sampling duration: 1 week | [43] | |
| Passive measurements of Radon volumic activity by accumulating alpha radiation on 12 m cellulose nitrate film (Kodalpha dosimeter) | Sampling duration: 2 months | [46] | |
| Passive dosimeters (Kodalpha LR 115 detectors) | Sampling duration: 2 months, only in heating season | [47] | |
| Gamma | Gamma radiometer of the Geiger-Muller type (Saphymo 6150 AD6) | Sampling duration: 3–4 h | [46] |
| Total Suspended Particulates & respirable suspended particulates (TSPs & RSPs) | PVC filters (pore size 0.45 μm, diameter 37 mm, SKC, USA) | Sampling rate: 2.5 L/min | [55] |
| Lead (Pb) | Airborne lead: mixed cellulose ester filter (pore size 0.8 μm, diameter 37 mm), analyzed with a Varian GTA100 model graphite furnace mounted on a Varian SpectrAA-880 model atomic absorption spectrophotometer based on NIOSH method 7105 Surface lead: collected with wet tissues based on NIOSH method 9100 | Sampling rate: 4 L/min | [55] |
| Ammonia (NH3) | Kitagawa precision gas detector tubes | NA | [42] |
| Airborne asbestos | Open-faced mixed cellulose ester filter (37 mm diameter and 0.8 μm pore size) | Sampling rate: 2.5 L/min | [55] |
| Airborne micro-organism | 25 mm nucleopore filter | Pore size 0.4 nm, sampling rate 2 L/min for 4 h | [42] |
| Mold & bacteria | CAMNEA method | Sampling rate: 4 h outside the window | [42] |
| Bacterial aerosols | Swirling liquid impingers | Sampling rate: 12.5 L/min | [45] |
| Investigation Location | Sample Number | Study Area | Indoor Material | Ventilation | Parameters Examined |
|---|---|---|---|---|---|
| Hong Kong (2002), [49] | 6 | Living room, Kitchen | Plastering wall, wallpaper, tile/wood/vinyl floor | Natural ventilation with air conditioning | CO2, HCHO, PM10, Bacteria, C6H6, C6H5CH3, C6H5CH2CH3, C6H5(CH3)3, CHCl3, CH2Cl2 |
| Australia (2002), [60] | 27 (ED) * & 4 (NB) * | Living room, bedroom | NA | NA | VOC, HCHO |
| Singapore (2004), [61] | 3 | Bedroom | NA | Natural ventilation with air conditioning | CO2, RH, particulate profile, bacteria, fungi, temperature |
| England & Wales (2005), [50] | 37 | Living room, kitchen, other rooms | timber framed construction, traditional brick/block frame, cavity wall insulation | mechanical extract ventilation and passive stack ventilators | NO2, CO, HCHO, VOC, RH particulates, temperature |
| Ottawa, Canada (2005), [58] | 75 | Living room and family room | NA | NA | 37 VOCs |
| China (2007), [62] | 6 | Living room, Kitchen | NA | NA | PM10 |
| France (2008), [46,63] | 567 | Rooms, attached or integrated garages and outside the dwellings | NA | NA | CO, VOC, particles, Rn, dog, cat and dust mite allergens, radon and gamma radiation |
| India (2008), [65] | 5 | Kitchen, bedroom | NA | Natural Ventilation | particulate matter (RSPM), CO2, CO, SO2, and NO2 |
| Korea (2009), [54] | 158 | Living room, kitchen, master room, other room | Wall & ceiling: Silk/Balpo, floor: PVC/wood, furniture: MDF | NA | HCHO, VOC, C6H6, C6H5CH3, C6H5CH2CH3, (CH3)2C6H4, C6H4Cl2, C6H5CH=CH2 |
| China & Japan (2009), [66] | 57 (Jp) & 14 (Ch) | Living room, kitchen, bedroom | Wallpaper (Japan); paint (China) | NA | VOC (C6H6, C6H5CH3, C6H5CH2CH3, (CH3)2C6H4, C6H5(CH3)3 |
| Italy (2011), [67] | 60 | Living room | NA | NA | PM, NO2, CO, O3 |
| Ireland & Scotland (2011), [68] | 100 | Living room | NA | NA | PM2.5, CO, CO2, NO2 |
| Germany (2013), [56] | 2246 | Living or child’s room | NA | NA | 60 VOC’s |
| UAE (2014), [69] | 628 | Family room | NA | Sealed AC | CO, HCHO, H2S, NO2, SO2, PM2.5, PM10 |
| United States (2015), [70] | 17 | NA | Hardwood floors, carpets | Natural ventilation with air conditioning | CO2, CO, RH, temperature, particulate matter, VOC, HCHO |
| United States (2015), [71] | 86 | Living room and kitchen | Low VOC carpet, flooring, carpet pad, zero VOC paint | HVAC system | PM, HCHO, VOC |
| France (2017), [64] | 567 | Bedroom and living room | NA | Mechanical ventilation | CO2, RH, VOCs, HCHO, PM2.5, PM10 |
| France (2018), [47] | 72 | Living room, master bedroom | Lightweight/masonry facades, timber frame, thermal insulation | Mechanical or hybrid ventilation | CO2, CO, RH, NO2, VOCs, HCHO, Rn, airborne particles, temperature |
| Macedonia (2017), [6] | 25 | Living room | NA | NA | Temperature, RH, TVOC, PM |
| Northern Ireland (2019), [59] | 5 | Main living area, bedroom | Timber & Masonry | Balanced mechanical heat recovery ventilation or demand-controlled ventilation systems | Rn |
| Paraguay (2019), [72] | 80 | Kitchen | NA | NA | PM2.5, CO |
| Finland & Lithuania (2019), [73] | 45 | Living room | NA | Natural and mechanical ventilation | CO, NO2, VOCs, Rn, microbial content |
| California, USA (2020), [74] | 23 | Bedroom, living room, kitchen, dinning area | NA | Mechanical ventilation | CO2, NO2, HCHO, PM2.5 |
| California, USA (2020), [75] | 70 | Bedroom, living room | NA | Mechanical ventilation | CO2, NO2, HCHO, PM2.5, NOx, RH, temperature |
| Investigation Location | Sample Number | Seasonal Variation | Indoor Material | Ventilation | Parameters Examined |
|---|---|---|---|---|---|
| Australia (2003), [76] | 20 office, 4 schools, 1 hospital & 1 old home | NA | NA | NA | VOC |
| Korea (2007), [51] | 55 schools, 30 std/class | Summer, autumn, winter | Pressed wood desks, chairs, furnishings | Mainly naturally ventilated | CO, CO2, PM10, TBC, TVOCs, HCHO |
| Korea (2011), [55] | 17 pre-schools (71 classrooms) | Late spring and summer | Concrete, floor covered with linoleum/wood, no carpet | Naturally ventilated | TSPs, RSPs, lead, asbestos, TVOCs, HCHO, and CO2 |
| Greece (2007), [77] | 3 (office) | Spring | glazed windows. Painted gypsum board wall, plastic tiles, no carpet | Natural ventilation | PM |
| Greece (2008), [78] | 1 (school) | Summer, fall, and winter | NA | Natural ventilation | PM10, O3, CO |
| Antwerp, Belgium (2008), [79] | 27 (primary school) | Winter and early summer | NA | Natural ventilation | PM2.5, K, Ca, Ti, V, Cr, Mn, Fe, Ni, Cu, Zn, Br, Pb, Al, Si, S, Cl, NO2, SO2, O3, and C6H6, C6H5CH3, C6H5CH2CH3, and (CH3)2C6H4 |
| Hong Kong (2008), [80] | 82 (office) | NA | NA | mechanically ventilated and air-conditioned | Airborne fungi count |
| Beijing (2009), [42] | 2 (office) | Spring and early summer | NA | Mechanical ventilation | RH, HCHO, VOCs, NH3, CO2, mold and bacteria |
| Michigan, USA (2007), [44] | 64 (school) | Spring and early summer | Carpet | Mechanical ventilation | Ventilation rates, VOCs and bioaerosols, CO2, RH, and temperature |
| California, USA (2012), [81] | 37 (office & others) | NA | NA | Rooftop heating, ventilation, and air conditioning units | Black carbon, PM2.5, PM2.5-10, PM10 |
| Colorado Boulder, USA (2016), [57] | 1 (university) | Spring | Latex paint in wall | Dedicated air handling unit | VOC |
| USA (2016), [82] | 14 | All seasons | NA | 2 Mechanical ventilation & 2 natural ventilation | CO, CO2, HCHO, NO2, O3, PM2.5 |
| Chennai, India (2012), [45] | 1 (school) | Winter & summer | NA | Natural ventilation | PM10, PM2.5, PM1, CO, HCHO, bioaerosols |
| Delhi, India (2017), [52] | 3 (2 office & 1 EB*) | June-July | Concrete flooring | Air condition | CO2, PM2.5, VOC |
| Dubai & Fujairah, UAE (2014), [83] | 16 (elementary school) | Summer & winter | NA | NA | TVOC, CO2, O3, CO, particle concentration |
| Gliwice, Poland (2015), [84] | 2 (Nursery school) | Winter | NA | Stack ventilation and airing | VOC, PM, bacterial and fungal bioaerosol, CO2 |
| Netherland, (2015), [85] | 17 (Primary school) | Winter | NA | Naturally ventilated | Endotoxin, b(1,3)-glucans, PM10, PM2.5, NO2 |
| Italy (2016), [43] | 7 school (16 Classrooms) | Winter & spring | Single/double glazed Al/Fe window | Manual airing | CO2, particulate concentration, Rn |
| Qatar (2017), [86] | 1 (Office Building) | Summer | NA | HVAC | PM10, PM2.5 |
| Qatar (2017), [87] | 16 (urban schools) | Winter | Floor: vinyl or ceramic tile | Mechanically ventilated | temperature, RH, CO, CO2 and particulate matters (PM10 and PM2.5) |
| Turkey (2018), [88] | 4 (university classrooms) | Winter & summer | Desk & table: MDF veneered compressed chipboards, Door: woodwork | Natural ventilation | Temperature, RH, CO2, Rn, PM0.5, PM1.0, PM2.5, PM5.0, and PM10 |
| Europe (2016), [53] | 37 (office) | Winter & summer | NA | Mostly mechanical ventilation | VOC, HCHO, O3, NO2, PM2.5 |
| Europe, (2019), [89] | 37 office (140 office room) | Winter & summer | Synthetic floor covering, dispersion or emulsion wall paint, furniture: wood and derivatives (45%) or metal (31%), ceiling: synthetic | Mostly mechanical ventilation | HCHO, VOC, PM2.5, O3, NO2, temperature, RH |
| Sweden (2019), [48] | 4 (preschool) | All seasons | Low emitting materials | Heat recovery ventilation & heat recovery with DCV | Temperature, RH, particle-size distribution, CO2, NO2, HCHO and TVOC |
| Sweden (2019), [90] | 7 school (145 classrooms) | Summer & winter | NA | Mechanical ventilation with DCV and centralized air handling units | Temperature, CO2 |
| Southern Italy (2019), [91] | 12 (lower secondary schools) | Summer & winter | NA | Natural ventilation | Temperature, RH, CO2, NO2, PM2.5, biological pollutants in indoor dust (endotoxins and Der p 1) |
Publisher’s Note: MDPI stays neutral with regard to jurisdictional claims in published maps and institutional affiliations. |
© 2021 by the authors. Licensee MDPI, Basel, Switzerland. This article is an open access article distributed under the terms and conditions of the Creative Commons Attribution (CC BY) license (http://creativecommons.org/licenses/by/4.0/).
Share and Cite
Mannan, M.; Al-Ghamdi, S.G. Indoor Air Quality in Buildings: A Comprehensive Review on the Factors Influencing Air Pollution in Residential and Commercial Structure. Int. J. Environ. Res. Public Health 2021, 18, 3276. https://doi.org/10.3390/ijerph18063276
Mannan M, Al-Ghamdi SG. Indoor Air Quality in Buildings: A Comprehensive Review on the Factors Influencing Air Pollution in Residential and Commercial Structure. International Journal of Environmental Research and Public Health. 2021; 18(6):3276. https://doi.org/10.3390/ijerph18063276
Chicago/Turabian StyleMannan, Mehzabeen, and Sami G. Al-Ghamdi. 2021. "Indoor Air Quality in Buildings: A Comprehensive Review on the Factors Influencing Air Pollution in Residential and Commercial Structure" International Journal of Environmental Research and Public Health 18, no. 6: 3276. https://doi.org/10.3390/ijerph18063276
APA StyleMannan, M., & Al-Ghamdi, S. G. (2021). Indoor Air Quality in Buildings: A Comprehensive Review on the Factors Influencing Air Pollution in Residential and Commercial Structure. International Journal of Environmental Research and Public Health, 18(6), 3276. https://doi.org/10.3390/ijerph18063276