
Different Curve Shapes of Fasting Glucose and Various Obesity-Related Indices by Diabetes and Sex

 , and
, and
Abstract
1. Introduction
2. Materials and Methods
2.1. The Taiwan Biobank
2.2. Collection of Demographic, Medical and Laboratory Data
2.3. Definitions of Diabetes and Non-Diabetes
2.4. Obesity-Related Indices
2.5. Ethics Statement
2.6. Statistical Analysis
3. Results
3.1. Comparison of Clinical Characteristics of the Study Population between Males and Females with and without DM
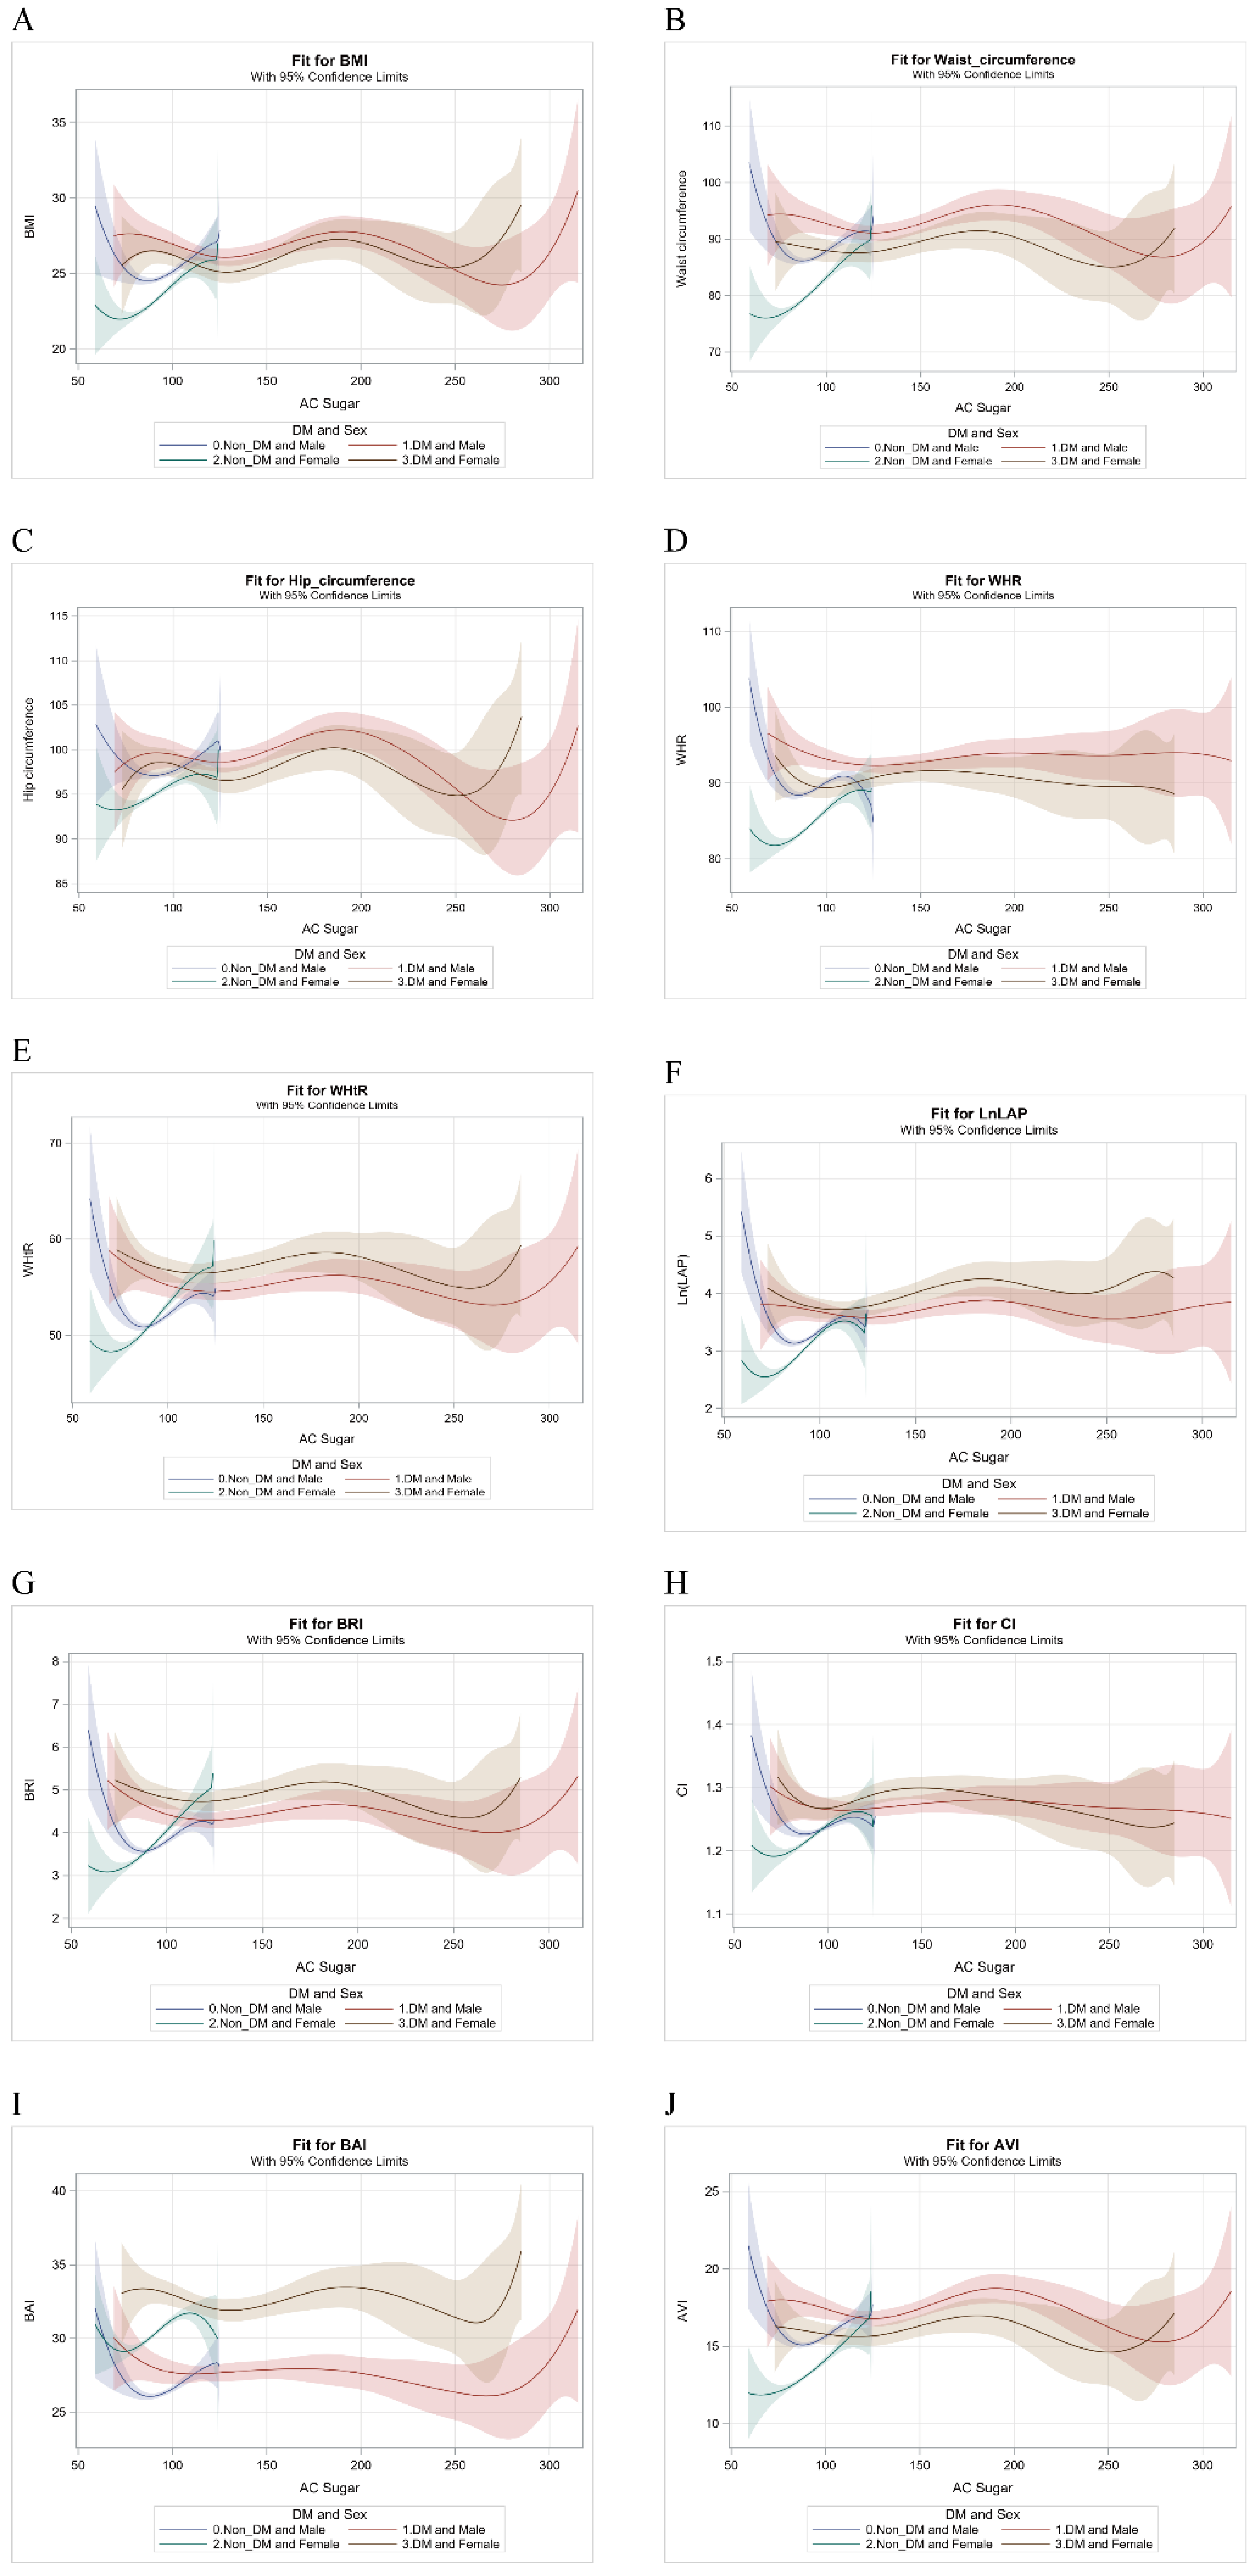
3.2. B-Spline Comparisons for Fasting Glucose with Obesity-Related Indices
3.3. The Relationship between Fasting Glucose and Various Obesity-Related Indices by DM and Sex
3.4. Separate Trends between Obesity-Related Indices and Fasting Glucose between Males and Females with and without DM
4. Discussion
5. Conclusions
Author Contributions
Funding
Institutional Review Board Statement
Informed Consent Statement
Data Availability Statement
Conflicts of Interest
References
- Ross, R.; Neeland, I.J.; Yamashita, S.; Shai, I.; Seidell, J.; Magni, P.; Santos, R.D.; Arsenault, B.; Cuevas, A.; Hu, F.B.; et al. Waist circumference as a vital sign in clinical practice: A Consensus Statement from the IAS and ICCR Working Group on Visceral Obesity. Nat. Rev. Endocrinol. 2020, 16, 177–189. [Google Scholar] [CrossRef]
- Gregg, E.W.; Sattar, N.; Ali, M.K. The changing face of diabetes complications. Lancet Diabetes Endocrinol. 2016, 4, 537–547. [Google Scholar] [CrossRef]
- Harding, J.L.; Pavkov, M.E.; Magliano, D.J.; Shaw, J.E.; Gregg, E.W. Global trends in diabetes complications: A review of current evidence. Diabetologia 2019, 62, 3–16. [Google Scholar] [CrossRef]
- Shah, M.S.; Brownlee, M. Molecular and Cellular Mechanisms of Cardiovascular Disorders in Diabetes. Circ. Res. 2016, 118, 1808–1829. [Google Scholar] [CrossRef] [PubMed]
- King, G.L.; Park, K.; Li, Q. Selective Insulin Resistance and the Development of Cardiovascular Diseases in Diabetes: The 2015 Edwin Bierman Award Lecture. Diabetes 2016, 65, 1462–1471. [Google Scholar] [CrossRef] [PubMed]
- Forbes, J.M.; Cooper, M.E. Mechanisms of Diabetic Complications. Physiol. Rev. 2013, 93, 137–188. [Google Scholar] [CrossRef] [PubMed]
- American Diabetes Association. 6. Glycemic Targets: Standards of Medical Care in Diabetes-2020. Diabetes Care 2020, 43 (Suppl. 1), S66–S76. [Google Scholar] [CrossRef] [PubMed]
- Emerging Risk Factors Collaboration. Diabetes mellitus, fasting blood glucose concentration, and risk of vascular disease: A collaborative meta-analysis of 102 prospective studies. Lancet 2010, 375, 2215–2222. [Google Scholar] [CrossRef]
- Kowall, B.; Rathmann, W.; Heier, M.; Giani, G.; Peters, A.; Thorand, B.; Huth, C.; Icks, A.; Meisinger, C. Categories of glucose tolerance and continuous glycemic measures and mortality. Eur. J. Epidemiol. 2011, 26, 637–645. [Google Scholar] [CrossRef]
- Wong, T.Y.; Liew, G.; Tapp, R.J.; Schmidt, M.I.; Wang, J.J.; Mitchell, P.; Klein, R.; Klein, B.E.K.; Zimmet, P.; Shaw, J. Relation between fasting glucose and retinopathy for diagnosis of diabetes: Three population-based cross-sectional studies. Lancet 2008, 371, 736–743. [Google Scholar] [CrossRef]
- Palladino, R.; Tabak, A.G.; Khunti, K.; Valabhji, J.; Majeed, A.; Millett, C.; Vamos, E.P. Association between pre-diabetes and microvascular and macrovascular disease in newly diagnosed type 2 diabetes. BMJ Open Diabetes Res. Care 2020, 8, e001061. [Google Scholar] [CrossRef] [PubMed]
- Ziegler, D.; Papanas, N.; Vinik, A.I.; Shaw, J.E. Epidemiology of polyneuropathy in diabetes and prediabetes. Diabetes Nerv. Syst. 2014, 126, 3–22. [Google Scholar] [CrossRef]
- Bansal, N. Prediabetes diagnosis and treatment: A review. World J. Diabetes 2015, 6, 296–303. [Google Scholar] [CrossRef] [PubMed]
- Nichols, G.A.; Hillier, T.A.; Brown, J.B. Normal Fasting Plasma Glucose and Risk of Type 2 Diabetes Diagnosis. Am. J. Med. 2008, 121, 519–524. [Google Scholar] [CrossRef]
- Brambilla, P.; La Valle, E.; Falbo, R.; Limonta, G.; Signorini, S.; Cappellini, F.; Mocarelli, P. Normal Fasting Plasma Glucose and Risk of Type 2 Diabetes. Diabetes Care 2011, 34, 1372–1374. [Google Scholar] [CrossRef][Green Version]
- Hayashino, Y.; Fukuhara, S.; Suzukamo, Y.; Okamura, T.; Tanaka, T.; Ueshima, H. Normal fasting plasma glucose levels and type 2 diabetes: The high-risk and population strategy for occupational health promotion (HIPOP-OHP) [corrected] study. Acta Diabetol. 2007, 44, 164–166. [Google Scholar] [CrossRef] [PubMed]
- Tirosh, A.; Shai, I.; Tekes-Manova, D.; Pereg, D.; Shochat, T.; Kochba, I.; Rudich, A.; Eran Israeli Diabetes Research Group. Normal Fasting Plasma Glucose Levels and Type 2 Diabetes in Young Men. N. Engl. J. Med. 2005, 353, 1454–1462. [Google Scholar] [CrossRef]
- Astrup, A.; Finer, N. Redefining Type 2 diabetes: ‘Diabesity’ or ‘Obesity Dependent Diabetes Mellitus’? Obes. Rev. 2000, 1, 57–59. [Google Scholar] [CrossRef] [PubMed]
- Alberti, K.G.M.M.; Zimmet, P.; Shaw, J. Metabolic syndrome—A new world-wide definition. A Consensus Statement from the International Diabetes Federation. Diabet. Med. 2006, 23, 469–480. [Google Scholar] [CrossRef]
- Ortega, F.B.; Lavie, C.J.; Blair, S.N. Obesity and Cardiovascular Disease. Circ. Res. 2016, 118, 1752–1770. [Google Scholar] [CrossRef]
- De Pergola, G.; Silvestris, F. Obesity as a Major Risk Factor for Cancer. J. Obes. 2013, 2013, 1–11. [Google Scholar] [CrossRef] [PubMed]
- Fabbrini, E.; Sullivan, S.; Klein, S. Obesity and nonalcoholic fatty liver disease: Biochemical, metabolic, and clinical implications. Hepatology 2010, 51, 679–689. [Google Scholar] [CrossRef] [PubMed]
- Anandacoomarasamy, A.; Caterson, I.; Sambrook, P.; Fransen, M.; March, L. The impact of obesity on the musculoskeletal system. Int. J. Obes. 2007, 32, 211–222. [Google Scholar] [CrossRef]
- Tremmel, M.; Gerdtham, U.-G.; Nilsson, P.M.; Saha, S. Economic Burden of Obesity: A Systematic Literature Review. Int. J. Environ. Res. Public Health 2017, 14, 435. [Google Scholar] [CrossRef] [PubMed]
- Pan, W.-H.; Flegal, K.M.; Chang, H.-Y.; Yeh, W.-T.; Yeh, C.-J.; Lee, W.-C. Body mass index and obesity-related metabolic disorders in Taiwanese and US whites and blacks: Implications for definitions of overweight and obesity for Asians. Am. J. Clin. Nutr. 2004, 79, 31–39. [Google Scholar] [CrossRef]
- Chang, Y.; Guo, X.; Chen, Y.; Guo, L.; Li, Z.; Yu, S.; Yang, H.; Sun, Y. A body shape index and body roundness index: Two new body indices to identify diabetes mellitus among rural populations in northeast China. BMC Public Health 2015, 15, 1–8. [Google Scholar] [CrossRef]
- Hajian-Tilaki, K.; Heidari, B. Is Waist Circumference A Better Predictor of Diabetes Than Body Mass Index or Waist-To-Height Ratio in Iranian Adults? Int. J. Prev. Med. 2015, 6, 5. [Google Scholar] [CrossRef] [PubMed]
- Lee, B.J.; Ku, B.; Nam, J.; Pham, D.D.; Kim, J.Y. Prediction of Fasting Plasma Glucose Status Using Anthropometric Measures for Diagnosing Type 2 Diabetes. IEEE J. Biomed. Health Inform. 2013, 18, 555–561. [Google Scholar] [CrossRef]
- Snijder, M.B.; Dekker, J.M.; Visser, M.; Bouter, L.M.; Stehouwer, C.D.; Kostense, P.J.; Yudkin, J.S.; Heine, R.J.; Nijpels, G.; Seidell, J.C. Associations of hip and thigh circumferences independent of waist circumference with the incidence of type 2 diabetes: The Hoorn Study. Am. J. Clin. Nutr. 2003, 77, 1192–1197. [Google Scholar] [CrossRef] [PubMed]
- Vazquez, G.; Duval, S.; Jacobs, J.D.R.; Silventoinen, K. Comparison of Body Mass Index, Waist Circumference, and Waist/Hip Ratio in Predicting Incident Diabetes: A Meta-Analysis. Epidemiol. Rev. 2007, 29, 115–128. [Google Scholar] [CrossRef]
- Zhao, X.; Zhu, X.; Zhang, H.; Zhao, W.; Li, J.; Shu, Y.; Li, S.; Yang, M.; Cai, L.; Zhou, J.; et al. Prevalence of diabetes and predictions of its risks using anthropometric measures in southwest rural areas of China. BMC Public Health 2012, 12, 821. [Google Scholar] [CrossRef] [PubMed]
- Tian, Z.; Li, Y.; Li, L.; Liu, X.; Zhang, H.; Zhang, X.; Qian, X.; Zhou, W.; Jiang, J.; Zhao, J.; et al. Gender-specific associations of body mass index and waist circumference with type 2 diabetes mellitus in Chinese rural adults: The Henan Rural Cohort Study. J. Diabetes Its Complicat. 2018, 32, 824–829. [Google Scholar] [CrossRef] [PubMed]
- Lasky, D.; Becerra, E.; Boto, W.; Otim, M.; Ntambi, J. Obesity and gender differences in the risk of type 2 diabetes mellitus in Uganda. Nutrition 2002, 18, 417–421. [Google Scholar] [CrossRef]
- Chen, C.-H.; Yang, J.-H.; Chiang, C.W.; Hsiung, C.-N.; Wu, P.-E.; Chang, L.-C.; Chu, H.-W.; Chang, J.; Yuan-Tsong, C.; Yang, S.-L.; et al. Population structure of Han Chinese in the modern Taiwanese population based on 10,000 participants in the Taiwan Biobank project. Hum. Mol. Genet. 2016, 25, 5321–5331. [Google Scholar] [CrossRef] [PubMed]
- Fan, C.-T.; Hung, T.-H.; Yeh, C.-K. Taiwan Regulation of Biobanks. J. Law Med. Ethic 2015, 43, 816–826. [Google Scholar] [CrossRef]
- Levey, A.S.; Bosch, J.P.; Lewis, J.B.; Greene, T.; Rogers, N.; Roth, D.R. A More Accurate Method to Estimate Glomerular Filtration Rate from Serum Creatinine: A New Prediction Equation. Ann. Intern. Med. 1999, 130, 461–470. [Google Scholar] [CrossRef]
- American Diabetes Association. 2. Classification and Diagnosis of Diabetes: Standards of Medical Care in Diabetes—2021. Diabetes Care 2021, 44 (Suppl. 1), S15. [Google Scholar]
- Kahn, H.S. The “lipid accumulation product” performs better than the body mass index for recognizing cardiovascular risk: A population-based comparison. BMC Cardiovasc. Disord. 2005, 5, 26. [Google Scholar] [CrossRef]
- Thomas, D.M.; Bredlau, C.; Bosy-Westphal, A.; Mueller, M.; Shen, W.; Gallagher, D.; Maeda, Y.; McDougall, A.; Peterson, C.M.; Ravussin, E.; et al. Relationships between body roundness with body fat and visceral adipose tissue emerging from a new geometrical model. Obesity 2013, 21, 2264–2271. [Google Scholar] [CrossRef] [PubMed]
- Valdez, R. A simple model-based index of abdominal adiposity. J. Clin. Epidemiol. 1991, 44, 955–956. [Google Scholar] [CrossRef]
- Bergman, R.N.; Stefanovski, D.; Buchanan, T.A.; Sumner, A.E.; Reynolds, J.C.; Sebring, N.G.; Xiang, A.H.; Watanabe, R.M. A Better Index of Body Adiposity. Obesity 2011, 19, 1083–1089. [Google Scholar] [CrossRef] [PubMed]
- Guerrero-Romero, F.; Rodríguez-Morán, M. Abdominal volume index. an anthropometry-based index for estimation of obesity is strongly related to impaired glucose tolerance and type 2 diabetes mellitus. Arch. Med. Res. 2003, 34, 428–432. [Google Scholar] [CrossRef]
- Kautzky-Willer, A.; Harreiter, J.; Pacini, G. Sex and Gender Differences in Risk, Pathophysiology and Complications of Type 2 Diabetes Mellitus. Endocr. Rev. 2016, 37, 278–316. [Google Scholar] [CrossRef]
- Power, M.L.; Schulkin, J. Sex differences in fat storage, fat metabolism, and the health risks from obesity: Possible evolutionary origins. Br. J. Nutr. 2008, 99, 931–940. [Google Scholar] [CrossRef]
- Stevens, J.; Katz, E.G.; Huxley, R.R. Associations between gender, age and waist circumference. Eur. J. Clin. Nutr. 2010, 64, 6–15. [Google Scholar] [CrossRef]
- Karastergiou, K.; Smith, S.R.; Greenberg, A.S.; Fried, S.K. Sex differences in human adipose tissues—The biology of pear shape. Biol. Sex Differ. 2012, 3, 13. [Google Scholar] [CrossRef] [PubMed]
- Nordström, A.; Hadrévi, J.; Olsson, T.; Franks, P.W.; Nordström, P. Higher Prevalence of Type 2 Diabetes in Men Than in Women Is Associated With Differences in Visceral Fat Mass. J. Clin. Endocrinol. Metab. 2016, 101, 3740–3746. [Google Scholar] [CrossRef] [PubMed]
- Forouhi, N.G.; Wareham, N.J. Epidemiology of diabetes. Medicine (Baltimore) 2019, 47, 22–27. [Google Scholar] [CrossRef]
- Færch, K.; Borch-Johnsen, K.; Vaag, A.; Jørgensen, T.; Witte, D.R. Sex differences in glucose levels: A consequence of physiology or methodological convenience? The Inter99 study. Diabetologia 2010, 53, 858–865. [Google Scholar] [CrossRef] [PubMed]
- Siddiqui, S.; Zainal, H.; Harun, S.N.; Ghadzi, S.M.S.; Ghafoor, S. Gender differences in the modifiable risk factors associated with the presence of prediabetes: A systematic review. Diabetes Metab. Syndr. Clin. Res. Rev. 2020, 14, 1243–1252. [Google Scholar] [CrossRef] [PubMed]
- Faerch, K.; Vaag, A.; Witte, D.R.; Jørgensen, T.; Pedersen, O.; Borch-Johnsen, K. Predictors of future fasting and 2-h post-OGTT plasma glucose levels in middle-aged men and women-the Inter99 study. Diabet. Med. 2009, 26, 377–383. [Google Scholar] [CrossRef] [PubMed]
- Wannamethee, S.G.; Papacosta, O.; Whincup, P.H.; Carson, C.; Thomas, M.C.; Lawlor, D.A.; Ebrahim, S.; Sattar, N. Assessing prediction of diabetes in older adults using different adiposity measures: A 7 year prospective study in 6,923 older men and women. Diabetol. 2010, 53, 890–898. [Google Scholar] [CrossRef] [PubMed]
- Satman, I.; Omer, B.; Tutuncu, Y.; Kalaca, S.; Gedik, S.; Dinccag, N.; Karsidag, K.; Genc, S.; Telci, A.; Canbaz, B.; et al. Twelve-year trends in the prevalence and risk factors of diabetes and prediabetes in Turkish adults. Eur. J. Epidemiol. 2013, 28, 169–180. [Google Scholar] [CrossRef]
- Blüher, M. Metabolically Healthy Obesity. Endocr. Rev. 2020, 41, 405–420. [Google Scholar] [CrossRef]
- Liu, C.; Wang, C.; Guan, S.; Liu, H.; Wu, X.; Zhang, Z.; Gu, X.; Zhang, Y.; Zhao, Y.; Tse, L.A.; et al. The Prevalence of Metabolically Healthy and Unhealthy Obesity according to Different Criteria. Obes. Facts 2019, 12, 78–90. [Google Scholar] [CrossRef] [PubMed]
- American Diabetes Association. 8. Obesity Management for the Treatment of Type 2 Diabetes: Standards of Medical Care in Diabetes-2020. Diabetes Care 2020, 43 (Suppl. 1), S89–S97. [Google Scholar] [CrossRef] [PubMed]
- Grams, J.; Garvey, W.T. Weight Loss and the Prevention and Treatment of Type 2 Diabetes Using Lifestyle Therapy, Pharmacotherapy, and Bariatric Surgery: Mechanisms of Action. Curr. Obes. Rep. 2015, 4, 287–302. [Google Scholar] [CrossRef]
- Alzaheb, R.; Altemani, A.H. The prevalence and determinants of poor glycemic control among adults with type 2 diabetes mellitus in Saudi Arabia. Diabetes Metab. Syndr. Obes. Targets Ther. 2018, 11, 15–21. [Google Scholar] [CrossRef] [PubMed]
- Bae, J.; Lage, M.; Mo, D.; Nelson, D.; Hoogwerf, B. Obesity and glycemic control in patients with diabetes mellitus: Analysis of physician electronic health records in the US from 2009–2011. J. Diabetes its Complicat. 2016, 30, 212–220. [Google Scholar] [CrossRef]
- Zhu, H.-T.; Yu, M.; Hu, H.; He, Q.-F.; Pan, J.; Hu, R.-Y. Factors associated with glycemic control in community-dwelling elderly individuals with type 2 diabetes mellitus in Zhejiang, China: A cross-sectional study. BMC Endocr. Disord. 2019, 19, 57. [Google Scholar] [CrossRef] [PubMed]
- Hameed, E.K.; AbdulQahar, Z.H. Visceral adiposity index in female with type 2 diabetic mellitus and its association with the glycemic control. Diabetes Metab. Syndr. Clin. Res. Rev. 2019, 13, 1241–1244. [Google Scholar] [CrossRef] [PubMed]
- Consultation, W.E. Appropriate body-mass index for Asian populations and its implications for policy and intervention strategies. Lancet 2004, 363, 157–163. [Google Scholar]
- Chiu, M.; Austin, P.C.; Manuel, D.G.; Shah, B.R.; Tu, J.V. Deriving Ethnic-Specific BMI Cutoff Points for Assessing Diabetes Risk. Diabetes Care 2011, 34, 1741–1748. [Google Scholar] [CrossRef] [PubMed]
- Hsu, W.C.; Araneta, M.R.G.; Kanaya, A.M.; Chiang, J.L.; Fujimoto, W. BMI Cut Points to Identify At-Risk Asian Americans for Type 2 Diabetes Screening: Table 1. Diabetes Care 2015, 38, 150–158. [Google Scholar] [CrossRef] [PubMed]


| Males | Females | |||||
|---|---|---|---|---|---|---|
| DM | Non-DM | p | DM | Non-DM | p | |
| N | 295 | 2040 | 220 | 2445 | ||
| Age (year) | 55.80 (8.76) | 48.74 (11.00) | <0.0001 | 56.38 (8.73) | 48.91 (10.29) | <0.0001 |
| Smoking status, N (%) | ||||||
| Never + Occasional | 127 (43.1) | 985 (48.3) | 206 (93.6) | 2303 (94.2) | ||
| Quit drinking | 100 (33.9) | 674 (33.0) | 9 (4.1) | 111 (4.5) | ||
| Regular | 68 (23.1) | 381 (18.7) | 0.1285 | 5 (2.3) | 31 (1.3) | 0.4481 |
| Drinking status, N (%) | ||||||
| Never + Occasional | 226 (76.6) | 1625 (79.7) | 215 (97.7) | 2395 (98.0) | ||
| Quit drinking | 24 (8.1) | 97 (4.8) | 3 (1.4) | 13 (0.5) | ||
| Regular | 45 (15.3) | 318 (15.6) | 0.0497 | 2 (0.9) | 37 (1.5) | 0.2428 |
| Weight (kg) | 75.21 (12.91) | 71.26 (10.62) | <0.0001 | 62.56 (10.20) | 57.37 (8.55) | <0.0001 |
| Height (cm) | 167.84 (6.24) | 169.08 (6.28) | 0.0015 | 155.35 (5.50) | 157.22 (5.50) | <0.0001 |
| BMI (kg/m2) | 26.61 (3.80) | 24.89 (3.15) | <0.0001 | 25.92 (4.00) | 23.22 (3.30) | <0.0001 |
| WC (cm) | 92.41 (9.24) | 87.14 (8.33) | <0.0001 | 88.48 (9.82) | 80.26 (8.85) | <0.0001 |
| HC (cm) | 99.35 (7.16) | 97.47 (6.22) | <0.0001 | 97.79 (7.57) | 95.08 (6.39) | <0.0001 |
| WHR | 0.93 (0.05) | 0.89 (0.05) | <0.0001 | 0.90 (0.07) | 0.84 (0.06) | <0.0001 |
| WHtR | 0.55 (0.05) | 0.52 (0.05) | <0.0001 | 0.57 (0.07) | 0.51 (0.06) | <0.0001 |
| SBP (mm Hg) | 126.19 (16.34) | 118.32 (15.48) | <0.0001 | 124.9 (17.29) | 110.9 (17.03) | <0.0001 |
| DBP (mm Hg) | 76.59 (10.67) | 75.22 (10.65) | 0.0400 | 72.68 (10.06) | 67.47 (10.20) | <0.0001 |
| Laboratory parameters | ||||||
| AC sugar (mg/dL) | 137.85 (41.67) | 94.43 (7.55) | <0.0001 | 129.89 (39.53) | 90.5 (7.44) | <0.0001 |
| HbA1c (%) | 7.55 (1.46) | 5.61 (0.32) | <0.0001 | 7.48 (1.43) | 5.57 (0.34) | <0.0001 |
| Triglyceride (mg/dL) | 161.08 (112.15) | 132.21 (99.77) | <0.0001 | 175.45 (145.61) | 97.31 (60.89) | <0.0001 |
| Total cholesterol (mg/dL) | 185.23 (37.65) | 194.13 (34.56) | <0.0001 | 204.20 (40.33) | 196.07 (36.25) | 0.0016 |
| HDL-cholesterol (mg/dL) | 44.79 (9.93) | 49.66 (11.41) | <0.0001 | 51.18 (10.57) | 59.47 (13.43) | <0.0001 |
| LDL-cholesterol (mg/dL) | 115.78 (32.88) | 124.5 (31.95) | <0.0001 | 125.95 (36.85) | 120.49 (32.06) | 0.0170 |
| eGFR (mL/min/1.73 m2) | 70.43 (18.49) | 68.13 (13.78) | 0.0107 | 111.92 (30.15) | 110.88 (24.51) | 0.5543 |
| Uric acid (mg/dL) | 6.23 (1.55) | 6.51 (1.38) | 0.0015 | 5.50 (1.35) | 4.83 (1.09) | <0.0001 |
| Obesity-related indices | ||||||
| LAP | 53.26 (48.59) | 35.38 (36.01) | <0.0001 | 61.39 (60.2) | 26.16 (22.48) | <0.0001 |
| BRI | 4.41 (1.10) | 3.71 (0.97) | <0.0001 | 4.85 (1.47) | 3.64 (1.20) | <0.0001 |
| CI | 1.27 (0.06) | 1.23 (0.06) | <0.0001 | 1.28 (0.08) | 1.22 (0.08) | <0.0001 |
| BAI | 27.73 (3.29) | 26.39 (3.0) | <0.0001 | 32.59 (4.37) | 30.31 (3.68) | <0.0001 |
| AVI | 17.3 (3.48) | 15.42 (2.92) | <0.0001 | 15.94 (3.58) | 13.22 (2.87) | <0.0001 |
| Non-DM | DM | Males | Female | DM by Sex by AC Sugar * | ||||||
|---|---|---|---|---|---|---|---|---|---|---|
| Males vs. Females | Males vs. Females | Non-DM vs. DM | Non-DM vs. DM | |||||||
| β (SE) | p | β (SE) | p | β (SE) | p | β (SE) | p | β (SE) | p for Interaction | |
| BMI (kg/m2) † | 9.22 (27.92) | 0.7412 | −35.92 (238.92) | 0.8805 | 7.23 (16.55) | 0.6624 | −16.75 (22.58) | 0.4583 | −0.03 (0.01) | 0.0123 |
| WC (cm) † | −38.53 (73.39) | 0.5996 | −77.14 (628.05) | 0.9023 | 57.38 (43.51) | 0.1874 | −14.46 (59.36) | 0.8076 | −0.11 (0.03) | 0.0012 |
| HC (cm) † | 45.46 (54.75) | 0.4064 | −147.34 (468.58) | 0.7532 | −8.67 (32.46) | 0.7894 | −36.14 (44.29) | 0.4145 | −0.05 (0.03) | 0.0473 |
| WHR *100 † | −74.23 (50.24) | 0.1396 | 51.93 (429.97) | 0.9039 | 120.49 (29.79) | <0.0001 | −42.91 (40.64) | 0.2911 | −0.07 (0.02) | 0.0028 |
| WHtR *100 † | −28.70 (46.50) | 0.5372 | −136.49 (397.92) | 0.7316 | 48.17 (27.57) | 0.0806 | −22.49 (37.61) | 0.5500 | −0.08 (0.02) | 0.0005 |
| LnLAP § | −1.13 (6.45) | 0.8612 | 22.51 (55.14) | 0.6831 | 11.37 (3.83) | 0.0030 | −10.70 (5.21) | 0.0402 | −0.01 (0.00) | 0.0380 |
| BRI † | −9.11 (9.38) | 0.3317 | −25.14 (80.28) | 0.7542 | 9.58 (5.56) | 0.0851 | −1.18 (7.59) | 0.8761 | −0.02 (0.00) | 0.0004 |
| CI † | −0.23 (0.64) | 0.7189 | −0.95 (5.44) | 0.8619 | 0.76 (0.38) | 0.0443 | −0.53 (0.51) | 0.3054 | 0.00 (0.00) | 0.0059 |
| BAI † | 36.5 (29.07) | 0.2093 | −204.4 (248.80) | 0.4114 | 8.27 (17.24) | 0.6316 | −51.35 (23.52) | 0.0290 | −0.03 (0.01) | 0.0498 |
| AVI † | −20.58 (25.01) | 0.4107 | −22.70 (214.04) | 0.9155 | 18.73 (14.83) | 0.2067 | 3.62 (20.23) | 0.8581 | −0.03 (0.01) | 0.0042 |
| Males | Females | Males vs. Females | Male | Female | Males vs. Females | ||||
|---|---|---|---|---|---|---|---|---|---|
| Non-DM | Lsmean (SE) | Lsmean (SE) | β (SE) /Difference of Lsmean (95% CI) | p | DM | Lsmean (SE) | Lsmean (SE) | β (SE) /Difference of Lsmean (95% CI) | p |
| BMI | |||||||||
| At AC_Sugar = 70 | 26.13 (0.83) | 22.00 (0.5) | 4.13 (2.24, 6.03) | 0.0001 | At AC_Sugar = 120 | 26.17 (0.26) | 25.25 (0.33) | 0.92 (0.10, 1.74) | 0.1713 |
| At AC_Sugar = 80 | 24.75 (0.24) | 22.23 (0.13) | 2.53 (1.99, 3.06) | <0.0001 | At AC_Sugar = 130 | 26.08 (0.30) | 25.10 (0.38) | 0.98 (0.03, 1.93) | 0.0428 |
| At AC_Sugar = 90 | 24.56 (0.09) | 23.10 (0.08) | 1.46 (1.22, 1.69) | <0.0001 | At AC_Sugar = 140 | 26.24 (0.31) | 25.31 (0.38) | 0.94 (−0.03, 1.90) | 0.0571 |
| At AC_Sugar = 100 | 25.13 (0.11) | 24.24 (0.12) | 0.88 (0.56, 1.20) | <0.0001 | At AC_Sugar = 150 | 26.57 (0.31) | 25.74 (0.40) | 0.83 (−0.16, 1.82) | 0.1005 |
| At AC_Sugar = 110 | 26.05 (0.19) | 25.30 (0.29) | 0.75 (0.07, 1.43) | 0.1843 | At AC_Sugar = 160 | 26.97 (0.36) | 26.27 (0.46) | 0.69 (−0.45, 1.84) | 0.2359 |
| WC | |||||||||
| At AC_Sugar = 70 | 91.68 (2.17) | 76.05 (1.33) | 15.63 (10.64, 20.62) | <0.0001 | At AC_Sugar = 120 | 91.16 (0.69) | 87.59 (0.86) | 3.56 (1.41, 5.72) | 0.0072 |
| At AC_Sugar = 80 | 86.94 (0.63) | 77.35 (0.35) | 9.59 (8.18, 11.00) | <0.0001 | At AC_Sugar = 130 | 91.15 (0.79) | 87.99 (0.99) | 3.16 (0.67, 5.65) | 0.0128 |
| At AC_Sugar = 90 | 86.23 (0.24) | 79.95 (0.20) | 6.28 (5.66, 6.90) | <0.0001 | At AC_Sugar = 140 | 91.74 (0.81) | 88.72 (1.01) | 3.02 (0.48, 5.56) | 0.0197 |
| At AC_Sugar = 100 | 87.86 (0.28) | 83.2 (0.32) | 4.65 (3.81, 5.50) | <0.0001 | At AC_Sugar = 150 | 92.71 (0.82) | 89.61 (1.04) | 3.10 (0.50, 5.70) | 0.0196 |
| At AC_Sugar = 110 | 90.15 (0.51) | 86.49 (0.76) | 3.66 (1.87, 5.45) | 0.0004 | At AC_Sugar = 160 | 93.85 (0.94) | 90.48 (1.22) | 3.36 (0.34, 6.38) | 0.0290 |
| HC | |||||||||
| At AC_Sugar = 70 | 99.31 (1.62) | 93.26 (0.99) | 6.05 (2.32, 9.77) | 0.0088 | At AC_Sugar = 120 | 98.64 (0.52) | 96.82 (0.64) | 1.82 (0.21, 3.43) | 0.1595 |
| At AC_Sugar = 80 | 97.61 (0.47) | 93.82 (0.26) | 3.79 (2.74, 4.84) | <0.0001 | At AC_Sugar = 130 | 98.67 (0.59) | 96.57 (0.74) | 2.10 (0.24, 3.96) | 0.0268 |
| At AC_Sugar = 90 | 97.13 (0.18) | 94.99 (0.15) | 2.13 (1.67, 2.59) | <0.0001 | At AC_Sugar = 140 | 99.15 (0.60) | 96.96 (0.75) | 2.18 (0.29, 4.08) | 0.0239 |
| At AC_Sugar = 100 | 97.60 (0.21) | 96.27 (0.24) | 1.33 (0.69, 1.96) | 0.0002 | At AC_Sugar = 150 | 99.89 (0.61) | 97.75 (0.78) | 2.14 (0.20, 4.08) | 0.0308 |
| At AC_Sugar = 110 | 98.77 (0.38) | 97.15 (0.57) | 1.62 (0.29, 2.96) | 0.1036 | At AC_Sugar = 160 | 100.73 (0.70) | 98.69 (0.91) | 2.04 (−0.21, 4.29) | 0.0760 |
| WHR*100 | |||||||||
| At AC_Sugar = 70 | 92.68 (1.49) | 81.87 (0.91) | 10.82 (7.40, 14.23) | <0.0001 | At AC_Sugar = 120 | 92.38 (0.47) | 90.40 (0.59) | 1.98 (0.51, 3.46) | 0.0508 |
| At AC_Sugar = 80 | 88.82 (0.43) | 82.30 (0.24) | 6.52 (5.55, 7.48) | <0.0001 | At AC_Sugar = 130 | 92.35 (0.54) | 91.01 (0.68) | 1.34 (−0.36, 3.05) | 0.1225 |
| At AC_Sugar = 90 | 88.68 (0.16) | 84.13 (0.14) | 4.54 (4.12, 4.97) | <0.0001 | At AC_Sugar = 140 | 92.49 (0.55) | 91.39 (0.69) | 1.10 (−0.64, 2.84) | 0.2148 |
| At AC_Sugar = 100 | 90.10 (0.19) | 86.47 (0.22) | 3.63 (3.05, 4.21) | <0.0001 | At AC_Sugar = 150 | 92.76 (0.56) | 91.60 (0.71) | 1.17 (−0.61, 2.95) | 0.1984 |
| At AC_Sugar = 110 | 90.91 (0.35) | 88.41 (0.52) | 2.49 (1.27, 3.72) | 0.0004 | At AC_Sugar = 160 | 93.10 (0.64) | 91.64 (0.84) | 1.46 (−0.60, 3.53) | 0.1651 |
| WHtR*100 | |||||||||
| At AC_Sugar = 70 | 55.06 (1.38) | 48.27 (0.84) | 6.79 (3.63, 9.95) | 0.0002 | At AC_Sugar = 120 | 54.51 (0.44) | 56.43 (0.54) | −1.92 (−3.29, −0.56) | 0.0351 |
| At AC_Sugar = 80 | 51.44 (0.40) | 49.03 (0.22) | 2.41 (1.51, 3.30) | <0.0001 | At AC_Sugar = 130 | 54.56 (0.50) | 56.65 (0.63) | −2.08 (−3.66, −0.50) | 0.0098 |
| At AC_Sugar = 90 | 50.91 (0.15) | 50.90 (0.13) | 0.01 (−0.38, 0.40) | 1.0000 | At AC_Sugar = 140 | 54.80 (0.51) | 57.03 (0.64) | −2.23 (−3.84, −0.62) | 0.0066 |
| At AC_Sugar = 100 | 52.12 (0.18) | 53.24 (0.21) | −1.12 (−1.66, −0.59) | 0.0002 | At AC_Sugar = 150 | 55.16 (0.52) | 57.51 (0.66) | −2.35 (−4.00, −0.71) | 0.0051 |
| At AC_Sugar = 110 | 53.70 (0.32) | 55.45 (0.48) | −1.74 (−2.87, −0.61) | 0.0157 | At AC_Sugar = 160 | 55.55 (0.59) | 57.99 (0.77) | −2.44 (−4.35, −0.53) | 0.0124 |
| LnLAP | |||||||||
| At AC_Sugar = 70 | 3.83 (0.19) | 2.56 (0.12) | 1.28 (0.83, 1.72) | <0.0001 | At AC_Sugar = 120 | 3.58 (0.06) | 3.75 (0.08) | −0.16 (−0.35, 0.03) | 0.5616 |
| At AC_Sugar = 80 | 3.23 (0.06) | 2.67 (0.03) | 0.56 (0.44, 0.69) | <0.0001 | At AC_Sugar = 130 | 3.59 (0.07) | 3.81 (0.09) | −0.23 (−0.44, −0.01) | 0.0433 |
| At AC_Sugar = 90 | 3.16 (0.02) | 2.97 (0.02) | 0.19 (0.13, 0.24) | <0.0001 | At AC_Sugar = 140 | 3.63 (0.07) | 3.91 (0.09) | −0.28 (−0.50, −0.06) | 0.0144 |
| At AC_Sugar = 100 | 3.36 (0.03) | 3.30 (0.03) | 0.06 (−0.02, 0.13) | 0.8373 | At AC_Sugar = 150 | 3.69 (0.07) | 4.01 (0.09) | −0.32 (−0.55, −0.09) | 0.0061 |
| At AC_Sugar = 110 | 3.57 (0.04) | 3.51 (0.07) | 0.06 (−0.09, 0.22) | 1.0000 | At AC_Sugar = 160 | 3.76 (0.08) | 4.11 (0.11) | −0.35 (−0.61, −0.08) | 0.0098 |
| BRI | |||||||||
| At AC_Sugar = 70 | 4.48 (0.28) | 3.08 (0.17) | 1.40 (0.76, 2.03) | 0.0001 | At AC_Sugar = 120 | 4.29 (0.09) | 4.73 (0.11) | −0.44 (−0.71, −0.16) | 0.0116 |
| At AC_Sugar = 80 | 3.71 (0.08) | 3.24 (0.04) | 0.47 (0.28, 0.65) | <0.0001 | At AC_Sugar = 130 | 4.30 (0.10) | 4.77 (0.13) | −0.46 (−0.78, −0.14) | 0.0045 |
| At AC_Sugar = 90 | 3.58 (0.03) | 3.59 (0.03) | −0.02 (−0.10, 0.06) | 1.0000 | At AC_Sugar = 140 | 4.36 (0.10) | 4.85 (0.13) | −0.49 (−0.82, −0.17) | 0.0030 |
| At AC_Sugar = 100 | 3.81 (0.04) | 4.05 (0.04) | −0.24 (−0.35, −0.13) | <0.0001 | At AC_Sugar = 150 | 4.43 (0.10) | 4.95 (0.13) | −0.52 (−0.85, −0.19) | 0.0022 |
| At AC_Sugar = 110 | 4.13 (0.06) | 4.52 (0.10) | −0.40 (−0.63, −0.17) | 0.0039 | At AC_Sugar = 160 | 4.51 (0.12) | 5.06 (0.16) | −0.54 (−0.93, −0.16) | 0.0059 |
| CI | |||||||||
| At AC_Sugar = 70 | 1.28 (0.02) | 1.19 (0.01) | 0.08 (0.04, 0.13) | 0.0008 | At AC_Sugar = 120 | 1.27 (0.01) | 1.29 (0.01) | −0.02 (−0.04, 0.00) | 0.2744 |
| At AC_Sugar = 80 | 1.23 (0.01) | 1.20 (0.00) | 0.04 (0.02, 0.05) | <0.0001 | At AC_Sugar = 130 | 1.27 (0.01) | 1.29 (0.01) | −0.02 (−0.05, 0.00) | 0.0239 |
| At AC_Sugar = 90 | 1.23 (0.00) | 1.22 (0.00) | 0.01 (0.00, 0.01) | 0.0107 | At AC_Sugar = 140 | 1.27 (0.01) | 1.30 (0.01) | −0.03 (−0.05, 0.00) | 0.0182 |
| At AC_Sugar = 100 | 1.24 (0.00) | 1.24 (0.00) | 0.00(−0.01, 0.00) | 1.0000 | At AC_Sugar = 150 | 1.27 (0.01) | 1.30 (0.01) | −0.02 (−0.05, 0.00) | 0.0307 |
| At AC_Sugar = 110 | 1.25 (0.00) | 1.26 (0.01) | −0.01 (−0.02, 0.01) | 1.0000 | At AC_Sugar = 160 | 1.28 (0.01) | 1.30 (0.01) | −0.02 (−0.05, 0.01) | 0.1173 |
| BAI | |||||||||
| At AC_Sugar = 70 | 28.10 (0.86) | 29.24 (0.53) | −1.14 (−3.12, 0.84) | 1.0000 | At AC_Sugar = 120 | 27.63 (0.27) | 32.08 (0.34) | −4.45 (−5.30, −3.59) | <0.0001 |
| At AC_Sugar = 80 | 26.42 (0.25) | 29.32 (0.14) | −2.90 (−3.45, −2.34) | <0.0001 | At AC_Sugar = 130 | 27.72 (0.31) | 31.91 (0.39) | −4.19 (−5.18, −3.21) | <0.0001 |
| At AC_Sugar = 90 | 26.08 (0.10) | 30.24 (0.08) | −4.16 (−4.4, −3.91) | <0.0001 | At AC_Sugar = 140 | 27.81 (0.32) | 32.01 (0.40) | −4.20 (−5.21, −3.20) | <0.0001 |
| At AC_Sugar = 100 | 26.59 (0.11) | 31.28 (0.13) | −4.69 (−5.03, −4.36) | <0.0001 | At AC_Sugar = 150 | 27.89 (0.32) | 32.29 (0.41) | −4.40 (−5.43, −3.37) | <0.0001 |
| At AC_Sugar = 110 | 27.46 (0.20) | 31.72 (0.30) | −4.26 (−4.97, −3.55) | <0.0001 | At AC_Sugar = 160 | 27.94 (0.37) | 32.65 (0.48) | −4.72 (−5.91, −3.52) | <0.0001 |
| AVI | |||||||||
| At AC_Sugar = 70 | 17.20 (0.74) | 11.91 (0.45) | 5.29 (3.59,6.99) | <0.0001 | At AC_Sugar = 120 | 16.82 (0.24) | 15.62(0.29) | 1.20 (0.46,1.93) | 0.0084 |
| At AC_Sugar = 80 | 15.43 (0.21) | 12.33 (0.12) | 3.10 (2.62,3.58) | <0.0001 | At AC_Sugar = 130 | 16.82 (0.27) | 15.75(0.34) | 1.07 (0.23,1.92) | 0.0131 |
| At AC_Sugar = 90 | 15.11 (0.08) | 13.11 (0.07) | 2.00 (1.79,2.21) | <0.0001 | At AC_Sugar = 140 | 17.05 (0.28) | 16.00 (0.34) | 1.05 (0.19,1.92) | 0.0172 |
| At AC_Sugar = 100 | 15.64 (0.10) | 14.13 (0.11) | 1.52 (1.23,1.8) | <0.0001 | At AC_Sugar = 150 | 17.43 (0.28) | 16.32 (0.36) | 1.11 (0.23, 2.00) | 0.0139 |
| At AC_Sugar = 110 | 16.46 (0.17) | 15.28 (0.26) | 1.18 (0.57, 1.79) | 0.0009 | At AC_Sugar = 160 | 17.87 (0.32) | 16.63 (0.42) | 1.24 (0.21, 2.27) | 0.0181 |
Publisher’s Note: MDPI stays neutral with regard to jurisdictional claims in published maps and institutional affiliations. |
© 2021 by the authors. Licensee MDPI, Basel, Switzerland. This article is an open access article distributed under the terms and conditions of the Creative Commons Attribution (CC BY) license (http://creativecommons.org/licenses/by/4.0/).
Share and Cite
Wen, W.-L.; Wu, P.-Y.; Huang, J.-C.; Tu, H.-P.; Chen, S.-C. Different Curve Shapes of Fasting Glucose and Various Obesity-Related Indices by Diabetes and Sex. Int. J. Environ. Res. Public Health 2021, 18, 3096. https://doi.org/10.3390/ijerph18063096
Wen W-L, Wu P-Y, Huang J-C, Tu H-P, Chen S-C. Different Curve Shapes of Fasting Glucose and Various Obesity-Related Indices by Diabetes and Sex. International Journal of Environmental Research and Public Health. 2021; 18(6):3096. https://doi.org/10.3390/ijerph18063096
Chicago/Turabian StyleWen, Wei-Lun, Pei-Yu Wu, Jiun-Chi Huang, Hung-Pin Tu, and Szu-Chia Chen. 2021. "Different Curve Shapes of Fasting Glucose and Various Obesity-Related Indices by Diabetes and Sex" International Journal of Environmental Research and Public Health 18, no. 6: 3096. https://doi.org/10.3390/ijerph18063096
APA StyleWen, W.-L., Wu, P.-Y., Huang, J.-C., Tu, H.-P., & Chen, S.-C. (2021). Different Curve Shapes of Fasting Glucose and Various Obesity-Related Indices by Diabetes and Sex. International Journal of Environmental Research and Public Health, 18(6), 3096. https://doi.org/10.3390/ijerph18063096