Abstract
Although previous studies have discussed the association between trajectories of blood pressure (BP) and risk of cardiovascular diseases (CVDs), the association among the non-hypertensive general population of youth and middle age has not been elucidated. We used the growth mixture model to explore the trajectories of BP among the non-hypertensive Chinese population and applied Cox regression to evaluate the association between trajectories of BP and the risk of stroke or myocardial infarction (MI). Systolic blood pressure (SBP) and diastolic blood pressure (DBP) were categorized into three classes, respectively. Statistically significant associations were observed between SBP trajectories and stroke (range of adjusted hazard ratios (aHR): 1.369–3.837) or MI (rang of aHR = 6.047–13.017). Association between DBP trajectories and stroke (aHR: 3.685) or MI (range of aHR = 1.312–2.821) were also observed, although they did not reach statistical significance. Trajectories of SBP were more important risk factors than that of DBP in stroke and MI in our study population. BP management is important among pre-hypertensive adults to prevent stroke and MI when they age. Well-designed research with a larger sample size is required to confirm our findings and develop efficient methods to prevent CVDs.
1. Introduction
Stroke and myocardial infarction (MI) are common cardiovascular diseases (CVDs). Stroke is a group of diseases characterized by ischemia or hemorrhage of the cerebral and MI is a common situation of ischemic heart disease [1]. Both of the two diseases are medical emergencies and leading causes of death and disability, and the economic costs for treatment and rehabilitation are substantial [2]. During the past decades, the global burden of diseases showed an epidemiological shift. Morbidity and mortality due to non-communicable diseases such as cardiovascular and cerebrovascular diseases are increasing while morbidity and mortality because of communicable diseases such as tuberculosis are declining [3]. In 2019, ischemic heart disease (including MI) and stroke ranked in the top three leading causes in all ages globally and consist of 7.2% and 5.7% of disability-adjusted life-years (DALYs), respectively [4]. China experiences the same pattern. In 2017, ischemic heart disease and stroke ranked as the top causes of death and years of life lost (YLLs) [5]. From 1990 to 2017, the percentage change in mortality of ischemic heart disease and stroke increased 41% and 155.4%, respectively [5]. In sum, stroke and MI are major public health problems; approaches focused on modifiable risk factors to prevent stroke and MI are essential to control this serious situation.
Prehypertension, characterized by gently evaluated blood pressure (BP) in the range of 120–139/80–89 mmHg, is highly prevalent worldwide. Globally, the estimation of prehypertension ranged from 20% to 50% [6,7,8,9,10]. In China, the prevalence of prehypertension increased in recent years, with the estimation around 20% to 40% [6,11,12,13]. Prehypertension can progress to hypertension [14,15], and it associates with increased risks of various diseases and disorders, such as impairment of cognitive function, kidney disease, metabolic syndrome, coronary heart disease, stroke, and MI [13,15,16,17,18,19,20,21]. Although prehypertension is the risk factor of a wide range of diseases, it is reversible and the adverse outcomes are preventable. For example, epidemiological evidence showed that every 10 mmHg reduction in systolic blood pressure (SBP) would help to reduce the risk of stroke by 41% (33–48%) and coronary heart disease risk by 22% (17–27%) [22]. Thus, in the perspective of disease prevention, issues that relate to prehypertension management call for more attention.
In recent years, the studies on the association between the longitudinal change of BP (i.e., trajectories of BP) and stroke or MI have been gaining popularity. However, the vast majority of studies focused on the BP trajectories among CVDs patients; only a small proportion of studies discussed the BP trajectories in general populations [23,24,25,26,27]. Furthermore, it was rare that the studies reported the association between trajectories of BP and stroke or MI among the non-hypertensive Chinese population. By measurements of BP at the beginning and the end of observation, Fan, J. H. and colleagues studied the longitudinal change in BP in a Chinese county [28]. However, this practice may lead to a loss of substantial information during the observational period, resulting in the possibility of misclassification of BP trajectories [28]. Xu, Y. and colleagues conducted a study using latent class growth modeling (LCGM) to identify BP trajectories [29]. Nonetheless, they only assessed the association between trajectories of SBP and CVDs, the association between diastolic blood pressure (DBP) and CVDs was left out [29]. Thus, a comprehensive estimation of BP trajectories and the association with CVDs is lacking in the Chinese population.
Based on these backgrounds, we conducted this study aimed to (1) explore the trajectories of BP among the non-hypertensive Chinese population; and (2) evaluate the association between trajectories of BP and the risk of stroke or MI.
2. Materials and Methods
2.1. Study Design and Population
This study was based on the national data from the China Health and Nutrition Survey (CHNS), a population-based longitudinal project collaboratively conducted by the Carolina Population Center at the University of North Carolina at Chapel Hill and the National Institute for Nutrition and Health (NINH, former National Institute of Nutrition and Food Safety) at the Chinese Center for Disease Control and Prevention (CCDC). The details of the CHNS are described on the website of the project [30]. This ongoing cohort was initiated in 1989 and followed-up for every 2 to 4 years to examine the effects of the health, nutrition, and family planning policies and programs implemented by national and local governments and to see how the social and economic transformation of Chinese society is affecting the health and nutritional status of Chinese population. Until 2015, 42,829 individuals from 11,130 households participated by a multistage, random cluster sampling process from 15 provinces and autonomous cities/districts.
For our study, data of the CHNS from four waves (2000, 2004, 2006, and 2015) were retrieved to establish two individual datasets, one for stroke analysis and another for MI analysis. The datasets were divided into two periods, the exposure period (wave 2000, 2004, and 2006) and the outcome period (wave 2006 to 2015). The participants enrolled for the dataset of stroke were the ones who (1) had SBP and DBP records for each wave in the exposure period; (2) were not diagnosed with hypertension and stroke before 2006; and (3) had diagnostic records of stroke in 2015. The participants enrolled for the dataset of MI were the ones who (1) had SBP and DBP records for each wave in the exposure period; (2) were diagnosed without hypertension and MI before 2006; and (3) had diagnostic records of MI in 2015. Finally, a total of 2877 individuals were enrolled for stroke and 2879 individuals were enrolled for MI for classification. Figure 1 shows the flow chart of enrollment.
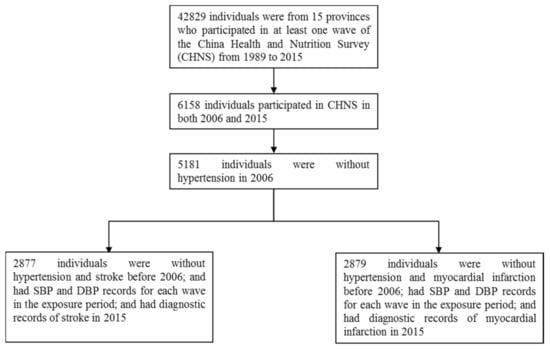
Figure 1.
The flowchart of enrollment.
2.2. Ethical Approval
The study protocol of the CHNS was approved by the institutional review board from the University of North Carolina at Chapel Hill and the National Institute for Nutrition and Food Safety, China Centre for Disease Control and Prevention. Written informed consent was collected from all participants.
2.3. Data Collection
2.3.1. Main Outcomes
BP was measured three times by a mercury sphygmomanometer on the right arm of each participant at each visit after a 10-min seated rest for the exposure period (2000, 2004, and 2006) [31]. We calculated the average of three measurements of SBP and DBP of each wave, respectively. Prehypertension was defined as BP of 120–139/80–89 mmHg among non-hypertensive individuals according to the 2018 Chinese guidelines for the management of hypertension [32].
Outcomes of interest were new-onset stroke and MI among non-hypertensive individuals, from 2006 to 2015. Participants gave self-reported information of hypertension, stroke, and MI status by answering the following questions: “Has the doctor ever given you the diagnosis of hypertension?”, “Has the doctor ever given you the diagnosis of stroke?” and “Has the doctor ever given you the diagnosis of myocardial infarction?” The positive answer was defined as the patient having the relevant diseases. We defined the onset time of stroke or MI by the answer of participants to the question “How old were you when you received the diagnosis of stroke?” and “How old were you when you received the diagnosis of myocardial infarction?” We calculated the survival time by the self-reported age of onset of stroke or MI, subtracting their age in 2006.
2.3.2. Covariates
Covariates were social-demographic variables, lifestyle factors, body mass index (BMI) at the first three waves, energy intake in 2006, and activity level in 2006.
Social-demographic variables (age, location, ethnicity, sex, and highest educational level) and lifestyle factors (smoking and drinking status in 2006) were retrieved from self-reported questionnaires. Age was divided into four levels, younger than 40, 51–50 years, 51–60 years, and older than 61 years. BMI was calculated using measurements of height and weight by trained medical practitioners, then categorized into four levels, i.e., underweight (<18.5 kg/m2), normal (18.5–23.9 kg/m2), overweight (24.0–27.9 kg/m2), and obese (≥28 kg/m2) [33].
Dietary information was collected by trained field interviewers using the 24-h individual recall method on three consecutive days which were randomly allocated from Monday to Sunday. During the daily interview, individuals were asked to recall the food consumption and to report the types, amounts, type of meal, and place of consumption of all food items during the previous day, with the aid of food models and pictures. The dietary data were linked with a nutrient data bank for the new version of Chinese food composition tables and the averages of energy intake values were calculated [34].
Information of activity level was collected by self-reported answers to questions addressing physical activity involved in work and questions related to energy-expenditure, such as “How much time did you spend on the light/middle/heavy physical activities?” Examples of different activity levels were given to interviewees in order to help them better quantify the daily physical activities. Then these data were categorized into four levels, light, middle, heavy, and no working ability.
2.4. Statistical Analyses
If distributed normally, continuous variables were presented as means and standard deviations; otherwise, medians and interquartile ranges were applied. Categorical variables were presented by numbers and proportions. Continuous variables were compared using one-way ANOVA if distributed normally or Kruskal–Wallis tests if not. Categorical variables were using chi-square tests or Fisher’s exact tests, respectively. Missing values of continuous variables were estimated by the EM algorithm based on the maximum likelihood while the ones of categorical variables were processed by the multiple imputation method [35,36,37]. The analyses of associations between BP trajectories and stroke or MI were performed by the Cox regression model [24,38]. Multivariables were selected by the method of stepwise forward (likelihood ratio) to avoid multicollinearity. The assumption of proportionality was confirmed by Kaplan–Meier curves for categorical variables and by a Schoenfeld residuals plot for continuous variables, respectively [39]. Hazard ratios (HR) and the 95% confidence interval (CI) were applied to describe the associations in Cox regression models [40].
Using Mplus (v7.4, developed by Muthén and Muthén, Los Angeles, CA, USA), the growth mixture model (GMM) approach was applied to model BP trajectories over the exposure period (2000, 2004, and 2006) and to identify distinct subgroups following similar patterns. GMM is one of the most flexible clustering developed analyses in recent years and was applied to group individuals into an optimal number of classes or subgroups [41,42]. The gender, age, and BMI of each wave were adjusted when the GMM was performed. We first compared two- to four- or five-class GMM models to identify the best-fitting one by sample size-adjusted Bayesian Information Criterion (BIC) (aBIC) and entropy. A smaller number of aBIC indicated a better-fitting model [43], while a larger value of entropy represented a smaller likelihood of misclassification [43,44]. The adjusted Lo–Mendell–Rubin likelihood ratio test (aLMR-test) and bootstrapped likelihood ratio test (BLRT) were used to compare the n-class model versus the n−1 class model [45,46]. The significant p-value (p < 0.05) suggested that the n-class model was well improved over the n-1-class model.
Other Statistical analyses were conducted by IBM SPSS (v25.0) (IBM, Armonk, NY, USA). The significance level was p < 0.05 unless otherwise specifically mentioned.
2.5. Sensitivity Analyses
Sensitivity analyses were conducted to explore the robustness of our results to missing data, modeling decisions, and age-stratified subgroups. We repeated the analyses with individuals without missing covariates to test the robustness of our observed association between the 3-class models for BP trajectories and stroke and MI, respectively. In addition, we inspected models based on 1 fewer and 1 more trajectory than the best-fitting models chosen for main analyses. Thirdly, because of the wide range of age in our study (range: 69), we wanted to understand whether our identified trajectories were similar in different age groups. Thus, we repeated analyses in the two subgroups divided by age in 2006 (≤50 years old versus >50 years old).
3. Results
3.1. Descriptive Analysis
A total of 2877 individuals were enrolled in the analysis for stroke and 2879 individuals were enrolled for MI, with the age of 50 (17) in 2006. Then they were followed up for the incidence of stroke or MI, with average person-years of 8.97 ± 0.44 and 8.98 ± 0.24, respectively. During the observation period, the incidence of stroke was 1.5% (44/2877), and the incidence of MI was 1.4% (41/2879).
The characteristics of the participants in 2006 are summarized in Table 1.

Table 1.
The characteristics of the participants.
3.2. GMM for Blood Pressure
Table S1 presents model fit indices for BP trajectories (SBP and DBP, respectively) in datasets of stroke or MI, respectively. To determine the best-fitting model, aBIC, entropy, aLMR and BLRT were assessed comprehensively. In GMM for stroke, both the value of aBIC for SBP and DBP trajectories first decreased and then increased; the three-class models presented the lowest value of aBIC (69078.724 for SBP, 62755.633 for DBP). When comparing the four-class models to the three-class models, no significant difference was observed by aLMR (p = 0.6711 for SPB, p = 0.4997 for DPB), which indicated that the four-class model was not improved compared to the three-class model. The p-value of aLMR-test showed a significant difference when three-class model was compared to the two-class model in DPB but not in SBP (p = 0.0032 for DPB, p = 0.00845 for SPB). This indicated that the three-class model for SBP was not improved compared to the two-class model, while the three-class model for DBP was improved compared to the two-class model. However, in the p-value of BLRT indicated that the three-class models were the best models. Taking the abovementioned into consideration, the three-class solutions were determined to be the best models. Notably, the entropy of three-class models was 0.641 for SBP and 0.666 for DBP, which indicated a potential problem of misclassification. So, we performed sensitivity analyses for other models; the results are shown in Table S3. The case of GMM for MI was similar (Table S1); the three-class models were determined to be the best models. The fit indices of best-fitting models are shown in Table S1 in bold.
Figure 2 and Figure 3 show three-class models determined by the analyses. To some degree, all participants showed an increasing pattern of BP during the observation period. As shown in Figure 2 and Figure 3, the classes with the most individuals were middle class in both SPB and DBP trajectories (Green lines). By contrast, the highest classes showed the fewest participants, with the means of BP starting in the intervals of prehypertension (120–139/80–89 mmHg) and gradually increasing. The classification probability and the class counts of each trajectory are presented in Table S1.
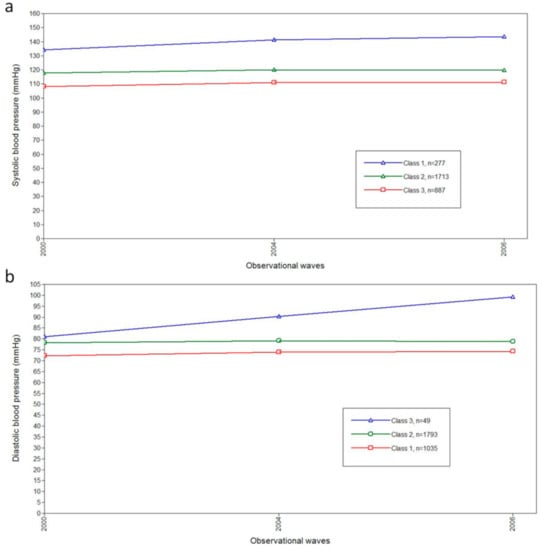
Figure 2.
The blood pressure trajectories in the three-class model by GMM for stroke. (a) The plots for classifications of systolic blood pressure trajectories by GMM for stroke. (b) The plots for classifications of diastolic blood pressure trajectories by GMM for stroke. Abbreviations: mmHg, millimeter of mercury; GMM, growth mixture model.
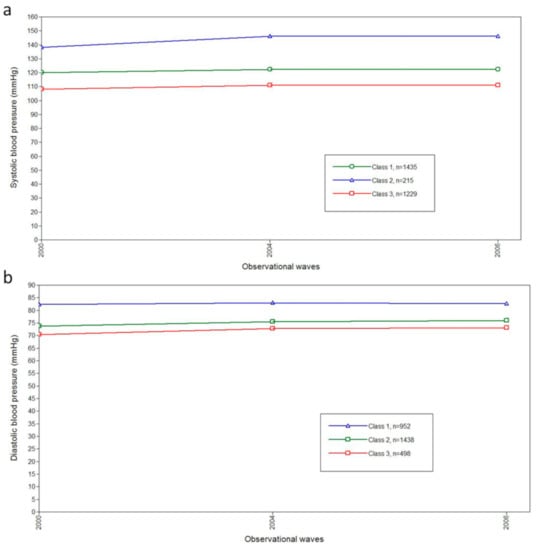
Figure 3.
The blood pressure trajectories in the three-class model by GMM for myocardial infarction. (a) The plots for classifications of systolic blood pressure trajectories by GMM for myocardial infarction. (b) The plots for classifications of diastolic blood pressure by GMM for myocardial infarction. Abbreviations: mmHg, millimeter of mercury; GMM, growth mixture model.
3.3. Characteristics across Trajectory Groups
Table 2 and Table 3 present the characteristics across BP trajectory groups (SBP and DBP) in the datasets of stroke and MI, respectively. For stroke, significant statistical differences were detected among SBP trajectory groups in age level, gender, education level, smoking in 2006, still smoking in 2006, drinking in 2006, BMI category in 2006, energy intake in 2006, and activity level in 2006 (all p < 0.05). Among DBP trajectory groups, statistically significant differences were observed among age levels, genders, education levels, smoking in 2006, still smoking in 2006, drinking in 2006, BMI category in 2006, and energy intake in 2006 (all p < 0.05). Notably, the number of individuals in Class 3 of DBP trajectory groups was limited (n = 49).
Table 2.
The characteristics across blood pressure trajectory groups (systolic pressure and diastolic pressure, respectively) in the dataset of stroke (N = 2877).
Table 3.
The characteristics across blood pressure trajectory groups (systolic pressure and diastolic pressure, respectively) in the dataset of myocardial infarction (N = 2879).
For the dataset of MI, it was similar to stroke, besides the distribution of two characters in DBP trajectory groups. Statistically significant differences were additionally observed in ethnicity and activity level in 2006 (all p < 0.05).
3.4. Cox Regression Analyses for Stroke and MI
Table 4 presents the associations between trajectories of SBP or DBP and stroke or MI, respectively. After adjustment for confounding variables presented in Table 2 and Table 3, significant differences in risks of stroke or MI were detected among BP trajectory groups (adjusted model 1 and adjusted model 2).
Table 4.
The associations between blood pressure trajectories and stroke or myocardial infarction (MI) by cox regressions.
For stroke, after selection of variables by the forward method (likelihood ratio), the variable of SBP trajectory entered the function. Compared to Class 3, the range of adjusted HR (aHR) was 1.369 to 3.837. By contrast, the variable of DBP trajectory contributed poorly and did not enter the function.
In the estimation of the risk between SBP trajectories and MI, the aHR (95% CI) was 6.047 (2.121–17.239) for Class 1 and 13.017 (4.009–42.470) for Class 2 when compared to Class 3 (adjusted model 1). The relationship was also observed between DBP trajectories and MI, with the range of aHR (95% CI) 1.312 to 2.821. Adjusted model 2 which included trajectories of SPB and DPB simultaneously and selected variables by the forward method (likelihood ratio) indicated that the association between stroke and SBP was stronger than with DBP.
3.5. Sensitivity Analyses
Assessments of the influence of missing values are presented in Table S2, which shows the associations between trajectories of SBP or DBP and stroke or MI among participants without missing covariates in three-class models. Patterns of risk between BP trajectories and stroke or MI were similar to the main analyses: the high BP trajectories related to a higher risk of stroke and MI.
When compared to the chosen three-class models, no additional insights were provided by the two-class and four-class models. The trajectories were presented by Figure S1 to Figure S4 and the fit indices for BP trajectories were shown in Table S1. The Cox regression analyses indicated the association between BP trajectories and risk of stroke or MI in the two-class and four-class model (Table S3).
Another sensitivity analysis in which the trajectories were modeled based on the stratification of the age of 2006 (≤50 years old versus >50 years old) was carried out. Although the means of BP trajectories of the young subgroups were lower than the senior subgroups, trajectories were similar to the main results as well as the risk of stroke or MI (Figure S5 to Figure S8, Table S4).
4. Discussion
Although previous studies have discussed the association between the trajectories of BP and risk of CVDs, the association among the non-hypertensive general population has not been elucidated. To the best of our knowledge, this is the first study based on a national cohort that explored the trajectories of BP among the non-hypertensive Chinese general population and evaluated the associations between trajectories of BP and risk of stroke or MI. Our study found that the trajectories of SBP and DBP were categorized into three classes by GMM. Significant positive associations were detected for trajectories of BP and risk of stroke and MI, respectively. In addition, it was the increased trajectory of SBP rather than DBP that was the major risk factor of developing stroke or MI. These findings could help provide new insight into the prevention and management of CVDs in the general population.
Our findings indicated that the trajectories of SBP increased in all classes, which was in line with previous studies [47,48,49]. The study conducted by Wolf-Maier, K. and colleagues showed an age-related increase in SBP, with an estimation of 7 mmHg per decade in Westerners over the age of 40 [48]. As regards trajectories of DBP, previous studies reported a bell-shaped curve: it increased from middle age and declined in later life; the turning point was around 50 to 60 [48,49]. However, we found the trajectories of DBP increased, although not dramatically, in all three classes. A possible explanation for the discrepancy was the difference in age of participants. Participants were aged 35 to 74 in the study conducted by Wolf-Maier, K. and colleagues while individuals were aged 30 to 84 in the study conducted by Franklin, S. S. and colleagues [48,49]. By contrast, in our study, the average participant was 43.79 ± 11.96 years old in 2000 and 49.79 ± 11.96 in 2006. Thus, they were probably too young to observe a decline change in the DBP trajectory. Future cohort studies enrolling senior participants and longer observational time are required to elucidate the DBP trajectory in the Chinese population.
By GMM, we identified three classes of trajectories for both SBP and DBP among the non-hypertensive Chinese population, with gender, age and BMI adjusted. Due to the limited epidemiologic evidence focusing on the BP trajectories among non-hypertension individuals, we found some studies reported PB trajectories among the general Chinese population. Fan, J. H. and colleagues studied the association between longitudinal change in BP and risk of mortality in a Chinese county [28]. Instead of using GMM, they defined the BP trajectory patterns by measurements of BP at two-time points (the beginning and the end of observation) [28]. Among the total six patterns, three patterns were similar to us: stable normotension BP, stable prehypertension BP, and prehypertension to hypertension [28]. We did not detect the other three patterns, the normotension to prehypertension, the normotension to hypertension, and prehypertension to normotension. A possible explanation was the difference in the method used to decide BP trajectory patterns. GMM enabled us to identify latent classes of BP trajectories and to estimate the average of BP values in certain BP trajectory (Figure 2 and Figure 3). This was superior to the method applied by Fan, J. H. and colleagues. BP information of every wave was comprehensively considered in our study; by contrast, only two measurements were used in the study conducted by Fan, J. H. and colleagues. In addition, the BP may fluctuate during the observational period, and decreased BP may represent a transient change under the threshold of 120/80 mm Hg that may not reflect the actual pattern of BP change. This was confirmed in our study (data not shown): some individuals had low BP in one certain wave which rebounded in the next wave.
Increased risks of stroke and MI among classes with increasing BP trajectories were observed, The range of aHR was 1.369 to 3.837 of increased SBP trajectories and stroke and aHR was 6.047 to 13.017 of increased SBP trajectories and MI. Li, W. and colleagues discussed the association between long-term SBP patterns in community-dwelling adults and the risk of intracerebral hemorrhage and cerebral infarction [40]. Two trajectories among five trajectories patterns of SBP were similar to our study: the normotensive-stable class and prehypertension-stable class. Statistically significant increased risk of stroke was observed, which was comparable to our study. Compared to the normotensive-stable class, the aHR (95% CI) in the prehypertension-stable class was 3.11 (1.72–5.64) for intracerebral hemorrhage and 1.99 (1.60–2.49) for cerebral infarction [40]. However, Xu, Y. and colleagues conducted a study using the dataset of the CHNS and reported a null association between CVDs and trajectories of SBP [29]. Using LCGM, Xu, Y. and colleagues identified five SPB trajectories, a including rapid increase group, slight increase group, stable group, increase group, and fluctuant group. Except for the fluctuant group, the other four groups were similar to our study: they started under 120 mmHg and later increased at different speeds. Compared to the slight increase group, no statistically significant association of risk of cardiovascular diseases were identified in neither the stable group (adjusted odds ratio, aOR (95% CI): 0.79 (0.40–1.59)) nor the increase group (aOR (95% CI): 1.36 (0.82–2.26)) [29]. We hypothesized that this difference was related to the character of individuals enrolled and statistical methods applied. Hypertension is a well-recognized risk factor for CVDs; however, Xu, Y. and colleagues did not exclude hypertensive individuals at the baseline [29]. The association between BP trajectories and the risk of CVDs may be distorted by the uneven distribution of hypertensive individuals among different classes, which was partly proven by the sensitivity analyses conducted by Xu, Y. and colleagues. When stratified by the use of antihypertensive drugs, compared to the slight increase group, the aOR (95% CI) among the stable group was inversed (aOR (95% CI): 1.37 (0.25–7.52) versus aOR (95% CI): 0.79 (0.40–1.59) without stratification), although the association was still statistically insignificant. In addition, although Xu, Y. and colleagues considered the age in modeling the trajectory of SBP, other covariates that influence the BP were left out [29]. For example, different gender followed a different pattern of BP change [47] and BMI was also related to BP change [50]. By contrast, we adjusted multiple covariates in modeling trajectories, including age, gender, and BMI, which enabled us to better explore the BP trajectories and revealed the relationship between BP trajectories and CVDs. Furthermore, although with a cohort design, Xu, Y. and colleagues used logistic regression to discuss the association of SBP trajectories and the risk of cardiovascular diseases [29]. This may blur the association between CVDs and different trajectories of SBP because the information of survival time was eliminated in the analyses. By contrast, our study divided the observation waves into two stages, the exposure period (wave 2000, 2004, and 2006) and the outcome period (wave 2006, 2009, 2011, and 2015), and applied the Cox regression which considered the combined information of trajectories of BP, survival time of onset of stroke or MI, which can comprehensively reveal the association between CVDs and trajectories of BP.
Previous studies reported that SBP is an independent risk predictor for CVDs among the hypertensive population [51]; our finding also showed a similar result that the trajectories of SBP were more important risk factors than the ones of DBP in stroke and MI among the non-hypertensive population. We used a forward stepwise method in Cox regression models, the association between trajectories of SPB and stroke and MI remained significant after being adjusted for trajectories of DBP while the variable of trajectories of DBP was left out by the models. This indicated that individuals should pay more attention to the management of SBP to prevent stroke and MI.
Our finding of trajectories of BP and the association between patterns of BP and risk of stroke and MI could bring a clue for preventive policy and treatment guidelines in the future. According to the China Hypertension Survey, a stratified multistage study involving 487,349 participants from 31 provinces of mainland China, the prevalence of prehypertension was 41.3% in 2015 [13]. This indicated that about 435.3 million Chinese were at risk of progression to hypertension and faced increased risk of various diseases, including vascular lesion, heart and kidney disorders, and cognitive impairment [13,15,16,17,18,19,20,21]. In the latest Chinese guidelines for the management of hypertension, pre-hypertensive individuals are recommended to receive lifestyle interventions and medical follow-up every 1 to 3 months, while antihypertensive drugs are not recommended due to the lack of clinical studies relating to prognosis [32]. However, several studies have shown the efficiency of antihypertension drugs to reduce the progress of hypertension among pre-hypertensive individuals [52,53,54]. A meta-analysis of 147 randomized trials summarized the use of antihypertensive drugs in the prevention of cardiovascular diseases, which found that a reduction of 10 mm Hg SBP and 5 mm Hg DBP in a population without vascular diseases would effectively decrease the risk of CHD events (relative risk, RR (95% CI): 0.79 (0.72–0.86)) and stroke (RR (95% CI): 0.54 (0.45–0.65)) [22]. In addition, according to the Seventh Report of the Joint National Committee on Prevention, Detection, Evaluation, and Treatment of High Blood Pressure, drugs are recommended when prehypertension individuals show compelling indications, such as chronic kidney disease or diabetes [51]. Further studies should focus on the issue which relates to designing effectiveness, safety, and economical CVD preventive programs and evaluating the feasibility of applying antihypertensive drugs to prevent hypertension and lower CVDs risk among the pre-hypertensive Chinese population.
With a large sample size and a national-level cohort follow-up for 15 years, the statistical power of this study was warranted. By applying GMM with multiple covariates adjusted for, we were able to accurately categorize subgroup trajectories of BP which followed similar growth patterns. However, the study has several limitations. Firstly, because of the study design of the CHNS, information about hypertension, stroke, MI, and some covariates was self-reported; we cannot rule out measurement errors from the interviewers and interviewees. For interviewers, they may mistakenly record the information; this information bias may cause misclassification of the status of diseases. For interviewees, they may have difficulties in recalling information, thus recalling bias exists. In addition, potential self-reporting bias needed to be taken into consideration. Interviewees may be reluctant to answer questions, or they may give the answer that catered to the expectations of others. This may occur in seemingly innocuous information such as age and ethnicity. In the collection process of sensitive information, such as the status of diseases and health-related behaviors, the self-reporting bias was also frequently observed. Secondly, although we tried our best to control confounders and adjusted various factors in our analysis, due to the lack of relevant data, we did not evaluate some other potential confounding factors such as genes, family history, noise exposure, and diet pattern. Previous studies point out that DBP is a more important risk factor in cerebral hemorrhage while SBP is more closely associated with cerebral infarction [55]. However, due to the limited information of the database, we did not differentiate the subtypes of stroke, so we failed to distinguish the association between the subtypes of stroke and SBP and DBP, respectively. Finally, missing values may bias the result. Nonetheless, the effect of missing values might be minimized because the rate was rather low (less than 5%) and the association between BP trajectories and stroke or MI remained unchanged without imputation of missing values (Table S2).
5. Conclusions
In summary, our study explored the trajectories of BP and observed a positive association between trajectories of BP and risk of stroke or MI among the non-hypertensive Chinese population. BP management is important among pre-hypertensive adults in order to prevent stroke and MI in their later lives. Well-designed research with a larger sample size is required to confirm our findings and find efficient methods to prevent stroke and MI.
Supplementary Materials
The following are available online at https://www.mdpi.com/1660-4601/18/6/2909/s1, Table S1: Fit indices for growth mixture models for blood pressure and stroke and MI among Chinese adults, Table S2: The associations between blood pressure trajectories and stroke or MI by cox regressions eliminating participants without missing values, Table S3: The associations between 2-class and 4-class blood pressure trajectories and stroke or MI by cox regressions, Table S4: The associations between the age-stratified blood pressure trajectories and stroke or MI by cox regressions, Figure S1: The blood pressure trajectories in the 2-class and 4-class models of systolic blood pressure by GMM for stroke, Figure S2: The blood pressure trajectories in the 2-class and 4-class models of diastolic blood pressure by GMM for stroke, Figure S3: The blood pressure trajectories in the 2-class and 4-class models of systolic blood pressure by GMM for myocardial infarction, Figure S4: The blood pressure trajectories in the 2-class and 4-class models of diastolic blood pressure by GMM for myocardial infarction, Figure S5: The blood pressure trajectories in the 3-class model of systolic blood pressure by GMM for stroke, age-stratified, Figure S6, The blood pressure trajectories in the 3-class model of diastolic blood pressure by GMM for stroke, age-stratified, Figure S7: The blood pressure trajectories in the 3-class model of systolic blood pressure by GMM for myocardial infarction, age-stratified, Figure S8: The blood pressure trajectories in the 3-class model of diastolic blood pressure by GMM for MI, age-stratified.
Author Contributions
Conceptualization, F.L., Q.L. and M.L.; methodology, F.L.; formal analysis, F.L.; writing—original draft preparation, F.L.; writing—review and editing, F.L. and Y.L.; supervision, L.C.; funding acquisition, L.C. and F.L. All authors have read and agreed to the published version of the manuscript.
Funding
This study was funded by the Project Funded by National Natural Science Foundation Program of China (81973137), Hunan Provincial Key Research and Development Program (2018SK2062), and Fundamental Research Funds for the Central Universities of Central South University (2020zzts238).
Institutional Review Board Statement
Ethical review and approval were waived for this study, due to this study uses data from the China Health and Nutrition Survey (CHNS). The study protocol of the CHNS was approved by the institutional review board from the University of North Carolina at Chapel Hill and the National Institute for Nutrition and Food Safety, China Centre for Disease Control and Prevention.
Informed Consent Statement
Patient consent was waived due to this study uses data from the China Health and Nutrition Survey (CHNS). Written informed consent was collected from all participants of CHNS.
Data Availability Statement
Restrictions apply to the availability of these data. Data was obtained from the China Health and Nutrition Survey (CHNS) and are available at https://www.cpc.unc.edu/projects/china/data/datasets (accessed on 21 October 2020) with the permission of CHNS.
Acknowledgments
This research uses data from China Health and Nutrition Survey (CHNS). We are grateful to research grant funding from the National Institute for Health (NIH), the Eunice Kennedy Shriver National Institute of Child Health and Human Development (NICHD) for R01 HD30880, National Institute of Diabetes and Digestive and Kidney Diseases (NIDDK) for R01DK104371 and R01HL108427, the NIH Fogarty grant D43 TW009077 for financial support for the CHNS data collection and analysis files since 1989, and the China–Japan Friendship Hospital, Ministry of Health for support for the CHNS 2009, Chinese National Human Genome Center at Shanghai since 2009, and Beijing Municipal Center for Disease Prevention and Control since 2011. We thank the National Institute for Nutrition and Health, China Center for Disease Control and Prevention, Beijing Municipal Center for Disease Control and Prevention, and the Chinese National Human Genome Center at Shanghai.
Conflicts of Interest
The authors declare no conflict of interest.
References
- Wendelboe, A.M.; Raskob, G.E. Global Burden of Thrombosis: Epidemiologic Aspects. Circ. Res. 2016, 118, 1340–1347. [Google Scholar] [CrossRef] [PubMed]
- Collaborators, G.S. Global, regional, and national burden of stroke, 1990–2016: A systematic analysis for the Global Burden of Disease Study 2016. Lancet Neurol. 2019, 18, 439–458. [Google Scholar]
- Noncommunicable Diseases. Available online: https://www.who.int/health-topics/noncommunicable-diseases#tab=tab_1 (accessed on 9 November 2020).
- Gippsland Disabiltiy Advocacy Inc. Global burden of 369 diseases and injuries in 204 countries and territories, 1990–2019: A systematic analysis for the Global Burden of Disease Study 2019. Lancet 2020, 396, 1204–1222. [Google Scholar] [CrossRef]
- Zhou, M.; Wang, H.; Zeng, X.; Yin, P.; Zhu, J.; Chen, W.; Li, X.; Wang, L.; Wang, L.; Liu, Y.; et al. Mortality, morbidity, and risk factors in China and its provinces, 1990–2017: A systematic analysis for the Global Burden of Disease Study 2017. Lancet 2019, 394, 1145–1158. [Google Scholar] [CrossRef]
- Yu, D.; Huang, J.; Hu, D.; Chen, J.; Cao, J.; Li, J.; Gu, D. Prevalence and risk factors of prehypertension among Chinese adults. J. Cardiovasc. Pharm. 2008, 52, 363–368. [Google Scholar] [CrossRef] [PubMed]
- Erbel, R.; Lehmann, N.; Möhlenkamp, S.; Churzidse, S.; Bauer, M.; Kälsch, H.; Schmermund, A.; Moebus, S.; Stang, A.; Roggenbuck, U.; et al. Subclinical coronary atherosclerosis predicts cardiovascular risk in different stages of hypertension: Result of the Heinz Nixdorf Recall Study. Hypertension 2012, 59, 44–53. [Google Scholar] [CrossRef] [PubMed]
- Fukuhara, M.; Arima, H.; Ninomiya, T.; Hata, J.; Yonemoto, K.; Doi, Y.; Hirakawa, Y.; Matsumura, K.; Kitazono, T.; Kiyohara, Y. Impact of lower range of prehypertension on cardiovascular events in a general population: The Hisayama Study. J. Hypertens. 2012, 30, 893–900. [Google Scholar] [CrossRef] [PubMed]
- Choi, K.M.; Park, H.S.; Han, J.H.; Lee, J.S.; Lee, J.; Ryu, O.H.; Lee, K.W.; Cho, K.H.; Yoon, D.; Baik, S.H.; et al. Prevalence of prehypertension and hypertension in a Korean population: Korean National Health and Nutrition Survey 2001. J. Hypertens. 2006, 24, 1515–1521. [Google Scholar] [CrossRef] [PubMed]
- Janghorbani, M.; Amini, M.; Gouya, M.M.; Delavari, A.; Alikhani, S.; Mahdavi, A. Nationwide survey of prevalence and risk factors of prehypertension and hypertension in Iranian adults. J. Hypertens. 2008, 26, 419–426. [Google Scholar] [CrossRef] [PubMed]
- Wu, G.; Wu, Z.; Liu, J.; Wang, W.; Zhao, D.; Ceng, Z.; Wang, W.; Liu, J.; Qin, L.; Liu, S. Impact of high-normal blood pressure on risk of cardiocerebrovascular disease in 11 provinces in China. Zhonghua Yi Xue Za Zhi 2002, 82, 1083–1085. [Google Scholar]
- Gu, D.; Chen, J.; Wu, X.; Duan, X.; Jones, D.W.; Huang, J.F.; Chen, C.S.; Chen, J.C.; Kelly, T.N.; Whelton, P.K.; et al. Prehypertension and risk of cardiovascular disease in Chinese adults. J. Hypertens. 2009, 27, 721–729. [Google Scholar] [CrossRef]
- Wang, Z.; Chen, Z.; Zhang, L.; Wang, X.; Hao, G.; Zhang, Z.; Shao, L.; Tian, Y.; Dong, Y.; Zheng, C.; et al. Status of Hypertension in China: Results From the China Hypertension Survey, 2012–2015. Circulation 2018, 137, 2344–2356. [Google Scholar] [CrossRef]
- Vasan, R.S.; Larson, M.G.; Leip, E.P.; Kannel, W.B.; Levy, D. Assessment of frequency of progression to hypertension in non-hypertensive participants in the Framingham Heart Study: A cohort study. Lancet 2001, 358, 1682–1686. [Google Scholar] [CrossRef]
- Egan, B.M.; Stevens-Fabry, S. Prehypertension--prevalence, health risks, and management strategies. Nat. Rev. Cardiol. 2015, 12, 289–300. [Google Scholar] [CrossRef] [PubMed]
- Vasan, R.S.; Larson, M.G.; Leip, E.P.; Evans, J.C.; O’Donnell, C.J.; Kannel, W.B.; Levy, D. Impact of high-normal blood pressure on the risk of cardiovascular disease. N. Engl. J. Med. 2001, 345, 1291–1297. [Google Scholar] [CrossRef]
- Han, M.; Li, Q.; Liu, L.; Zhang, D.; Ren, Y.; Zhao, Y.; Liu, D.; Liu, F.; Chen, X.; Cheng, C.; et al. Prehypertension and risk of cardiovascular diseases: A meta-analysis of 47 cohort studies. J. Hypertens. 2019, 37, 2325–2332. [Google Scholar] [CrossRef] [PubMed]
- Kalaitzidis, R.G.; Bakris, G.L. Prehypertension is it relevant for nephrologists? Kidney Int. 2010, 77, 194–200. [Google Scholar] [CrossRef] [PubMed][Green Version]
- Chen, K.H.; Henderson, V.W.; Stolwyk, R.J.; Dennerstein, L.; Szoeke, C. Prehypertension in midlife is associated with worse cognition a decade later in middle-aged and older women. Age Ageing 2015, 44, 439–445. [Google Scholar] [CrossRef] [PubMed]
- De Menezes, S.T.; Giatti, L.; Brant, L.; Griep, R.H.; Schmidt, M.I.; Duncan, B.B.; Suemoto, C.K.; Ribeiro, A.; Barreto, S.M. Hypertension, Prehypertension, and Hypertension Control: Association With Decline in Cognitive Performance in the ELSA-Brasil Cohort. Hypertension 2021, 77, 672–681. [Google Scholar] [CrossRef] [PubMed]
- Derakhshan, A.; Bagherzadeh-Khiabani, F.; Arshi, B.; Ramezankhani, A.; Azizi, F.; Hadaegh, F. Different Combinations of Glucose Tolerance and Blood Pressure Status and Incident Diabetes, Hypertension, and Chronic Kidney Disease. J. Am. Heart Assoc. 2016, 5, e003917. [Google Scholar] [CrossRef]
- Law, M.R.; Morris, J.K.; Wald, N.J. Use of blood pressure lowering drugs in the prevention of cardiovascular disease: Meta-analysis of 147 randomised trials in the context of expectations from prospective epidemiological studies. BMJ 2009, 338, b1665. [Google Scholar] [CrossRef] [PubMed]
- Das, S.; John, K.D.; Bokka, S.K.; Remmel, K.; Akça, O. Blood Pressure Management Following Large Vessel Occlusion Strokes: A Narrative Review. Balk. Med. J. 2020, 37, 253–259. [Google Scholar] [CrossRef]
- Li, C.; Zhang, Y.; Xu, T.; Peng, H.; Wang, D.; Xu, T.; Sun, Y.; Bu, X.; Chen, C.S.; Wang, A.; et al. Systolic Blood Pressure Trajectories in the Acute Phase and Clinical Outcomes in 2-Year Follow-up Among Patients With Ischemic Stroke. Am. J. Hypertens. 2019, 32, 317–325. [Google Scholar] [CrossRef] [PubMed]
- Smitson, C.C.; Scherzer, R.; Shlipak, M.G.; Psaty, B.M.; Newman, A.B.; Sarnak, M.J.; Odden, M.C.; Peralta, C.A. Association of Blood Pressure Trajectory With Mortality, Incident Cardiovascular Disease, and Heart Failure in the Cardiovascular Health Study. Am. J. Hypertens. 2017, 30, 587–593. [Google Scholar] [CrossRef]
- Portegies, M.L.; Mirza, S.S.; Verlinden, V.J.; Hofman, A.; Koudstaal, P.J.; Swanson, S.A.; Ikram, M.A. Mid- to Late-Life Trajectories of Blood Pressure and the Risk of Stroke: The Rotterdam Study. Hypertension 2016, 67, 1126–1132. [Google Scholar] [CrossRef]
- Maddox, T.M.; Ross, C.; Tavel, H.M.; Lyons, E.E.; Tillquist, M.; Ho, P.M.; Rumsfeld, J.S.; Margolis, K.L.; O’Connor, P.J.; Selby, J.V.; et al. Blood pressure trajectories and associations with treatment intensification, medication adherence, and outcomes among newly diagnosed coronary artery disease patients. Circ. Cardiovasc. Qual. Outcomes 2010, 3, 347–357. [Google Scholar] [CrossRef] [PubMed]
- Fan, J.H.; Wang, J.B.; Wang, S.M.; Abnet, C.C.; Qiao, Y.L.; Taylor, P.R. Longitudinal change in blood pressure is associated with cardiovascular disease mortality in a Chinese cohort. Heart 2018, 104, 1764–1771. [Google Scholar] [CrossRef]
- Xu, Y.; Möller, J.; Wang, R.; Liang, Y. Life-course blood pressure trajectories and cardiovascular diseases: A population-based cohort study in China. PLoS ONE 2020, 15, e0240804. [Google Scholar] [CrossRef] [PubMed]
- China Health and Nutrition Survey. Available online: https://www.cpc.unc.edu/projects/china (accessed on 21 October 2020).
- Du, S.; Batis, C.; Wang, H.; Zhang, B.; Zhang, J.; Popkin, B.M. Understanding the patterns and trends of sodium intake, potassium intake, and sodium to potassium ratio and their effect on hypertension in China. Am. J. Clin. Nutr. 2014, 99, 334–343. [Google Scholar] [CrossRef] [PubMed]
- Liu, L. 2018 Chinese guidelines for the management of hypertension. Chin. J. Cardiovasc. Med. 2019, 24, 24–56. [Google Scholar]
- Working Group on Obesity in China. Guidelines on prevention and Control of Overweight and Obesity in Chinese Adults (Excerpts). Acta Nutr. Sin. 2004, 24, 1–4. [Google Scholar]
- Zhao, J.; Su, C.; Wang, H.; Wang, Z.; Wang, Y.; Zhang, B. Secular Trends in Energy and Macronutrient Intakes and Distribution among Adult Females (1991–2015): Results from the China Health and Nutrition Survey. Nutrients 2018, 10, 115. [Google Scholar] [CrossRef] [PubMed]
- Lee, K.J.; Carlin, J.B. Multiple imputation for missing data: Fully conditional specification versus multivariate normal imputation. Am. J. Epidemiol. 2010, 171, 624–632. [Google Scholar] [CrossRef] [PubMed]
- Spratt, M.; Carpenter, J.; Sterne, J.A.; Carlin, J.B.; Heron, J.; Henderson, J.; Tilling, K. Strategies for multiple imputation in longitudinal studies. Am. J. Epidemiol. 2010, 172, 478–487. [Google Scholar] [CrossRef]
- Dempster, A.P.; Laird, N.M.; Rubin, D.B. Maximum Likelihood from Incomplete Data via the EM Algorithm. J. R. Stat. Soc. Ser. B Methodol. 1977, 39, 1–38. [Google Scholar]
- Wu, S.; An, S.; Li, W.; Lichtenstein, A.H.; Gao, J.; Kris-Etherton, P.M.; Wu, Y.; Jin, C.; Huang, S.; Hu, F.B.; et al. Association of Trajectory of Cardiovascular Health Score and Incident Cardiovascular Disease. JAMA Netw. Open 2019, 2, e194758. [Google Scholar] [CrossRef]
- Hess, K.R. Graphical methods for assessing violations of the proportional hazards assumption in Cox regression. Stat. Med. 1995, 14, 1707–1723. [Google Scholar] [CrossRef] [PubMed]
- Li, W.; Jin, C.; Vaidya, A.; Wu, Y.; Rexrode, K.; Zheng, X.; Gurol, M.E.; Ma, C.; Wu, S.; Gao, X. Blood Pressure Trajectories and the Risk of Intracerebral Hemorrhage and Cerebral Infarction: A Prospective Study. Hypertension 2017, 70, 508–514. [Google Scholar] [CrossRef]
- Mattsson, M.; Maher, G.M.; Boland, F.; Fitzgerald, A.P.; Murray, D.M.; Biesma, R. Group-based trajectory modelling for BMI trajectories in childhood: A systematic review. Obes. Rev. 2019, 20, 998–1015. [Google Scholar] [CrossRef]
- Ames, M.E.; Wintre, M.G. Growth Mixture Modeling of Adolescent Body Mass Index Development: Longitudinal Patterns of Internalizing Symptoms and Physical Activity. J. Res. Adolesc. 2016, 26, 889–901. [Google Scholar] [CrossRef]
- Xian, H.; Scherrer, J.F.; Madden, P.A.; Lyons, M.J.; Tsuang, M.; True, W.R.; Eisen, S.A. Latent class typology of nicotine withdrawal: Genetic contributions and association with failed smoking cessation and psychiatric disorders. Psychol. Med. 2005, 35, 409–419. [Google Scholar] [CrossRef] [PubMed][Green Version]
- Lubke, G.; Muthén, B.O. Performance of Factor Mixture Models as a Function of Model Size, Covariate Effects, and Class-Specific Parameters. Struct. Equ. Modeling A Multidiscip. J. 2007, 14, 26–47. [Google Scholar] [CrossRef]
- Lo, Y.; Mendell, N.R.; Rubin, D.B. Testing the number of components in a normal mixture. Biometrika 2001, 88, 767–778. [Google Scholar] [CrossRef]
- Van der Nest, G.; Passos, V.L.; Candel, M.J.J.M.; van Breukelen, G.J.P. An overview of mixture modelling for latent evolutions in longitudinal data: Modelling approaches, fit statistics and software. Adv. Life Course Res. 2020, 43, 100323. [Google Scholar] [CrossRef]
- Gurven, M.; Blackwell, A.D.; Rodríguez, D.E.; Stieglitz, J.; Kaplan, H. Does blood pressure inevitably rise with age?: Longitudinal evidence among forager-horticulturalists. Hypertension 2012, 60, 25–33. [Google Scholar] [CrossRef]
- Wolf-Maier, K.; Cooper, R.S.; Banegas, J.R.; Giampaoli, S.; Hense, H.W.; Joffres, M.; Kastarinen, M.; Poulter, N.; Primatesta, P.; Rodríguez-Artalejo, F.; et al. Hypertension prevalence and blood pressure levels in 6 European countries, Canada, and the United States. JAMA 2003, 289, 2363–2369. [Google Scholar] [CrossRef] [PubMed]
- Franklin, S.S.; Gustin, W.T.; Wong, N.D.; Larson, M.G.; Weber, M.A.; Kannel, W.B.; Levy, D. Hemodynamic patterns of age-related changes in blood pressure. The Framingham Heart Study. Circulation 1997, 96, 308–315. [Google Scholar] [CrossRef] [PubMed]
- Li, L.; Hardy, R.; Kuh, D.; Power, C. Life-course body mass index trajectories and blood pressure in mid life in two British birth cohorts: Stronger associations in the later-born generation. Int. J. Epidemiol. 2015, 44, 1018–1026. [Google Scholar] [CrossRef] [PubMed]
- Chobanian, A.V.; Bakris, G.L.; Black, H.R.; Cushman, W.C.; Green, L.A.; Izzo, J.J.; Jones, D.W.; Materson, B.J.; Oparil, S.; Wright, J.J.; et al. The Seventh Report of the Joint National Committee on Prevention, Detection, Evaluation, and Treatment of High Blood Pressure: The JNC 7 report. JAMA 2003, 289, 2560–2572. [Google Scholar] [CrossRef]
- Vidt, D.G. Angiotensin-receptor blockers for prehypertension. Curr. Hypertens. Rep. 2006, 8, 361–362. [Google Scholar] [CrossRef]
- Williams, S.A.; Michelson, E.L.; Cain, V.A.; Yang, M.; Nesbitt, S.D.; Egan, B.M.; Julius, S. An evaluation of the effects of an angiotensin receptor blocker on health-related quality of life in patients with high-normal blood pressure (prehypertension) in the Trial of Preventing Hypertension (TROPHY). J. Clin. Hypertens. Greenwich 2008, 10, 436–442. [Google Scholar] [CrossRef][Green Version]
- Julius, S.; Nesbitt, S.D.; Egan, B.M.; Weber, M.A.; Michelson, E.L.; Kaciroti, N.; Black, H.R.; Grimm, R.J.; Messerli, F.H.; Oparil, S.; et al. Feasibility of treating prehypertension with an angiotensin-receptor blocker. N. Engl. J. Med. 2006, 354, 1685–1697. [Google Scholar] [CrossRef]
- Shimizu, Y.; Kato, H.; Lin, C.H.; Kodama, K.; Peterson, A.V.; Prentice, R.L. Relationship between longitudinal changes in blood pressure and stroke incidence. Stroke 1984, 15, 839–846. [Google Scholar] [CrossRef]


Publisher’s Note: MDPI stays neutral with regard to jurisdictional claims in published maps and institutional affiliations. |
© 2021 by the authors. Licensee MDPI, Basel, Switzerland. This article is an open access article distributed under the terms and conditions of the Creative Commons Attribution (CC BY) license (http://creativecommons.org/licenses/by/4.0/).