
Study on the Relationship between Drivers’ Personal Characters and Non-Standard Traffic Signs Comprehensibility


Abstract
1. Introduction
- What might be the effectiveness of non-standard traffic signs in providing additional information warning about traffic safety hazards?
- What should be the form of non-standard traffic signs to make their level of comprehension and impact on the decisions of traffic participants as high as possible?
2. The Study of Traffic Signs Comprehension
- to check whether the level of comprehensibility is influenced by the functional group of signs, including whether symbolic signs are better comprehended than symbolic-text ones,
- to determine whether a higher frequency of encountering them is related to their level of comprehensibility,
- to confirm or exclude a relationship between the personality traits of drivers and the level of comprehension of non-standard signs. This involves an attempt to isolate personal characteristics or profiles of several personal characteristics that promote better comprehension of non-standard signs.
3. Research Methodology
4. Results
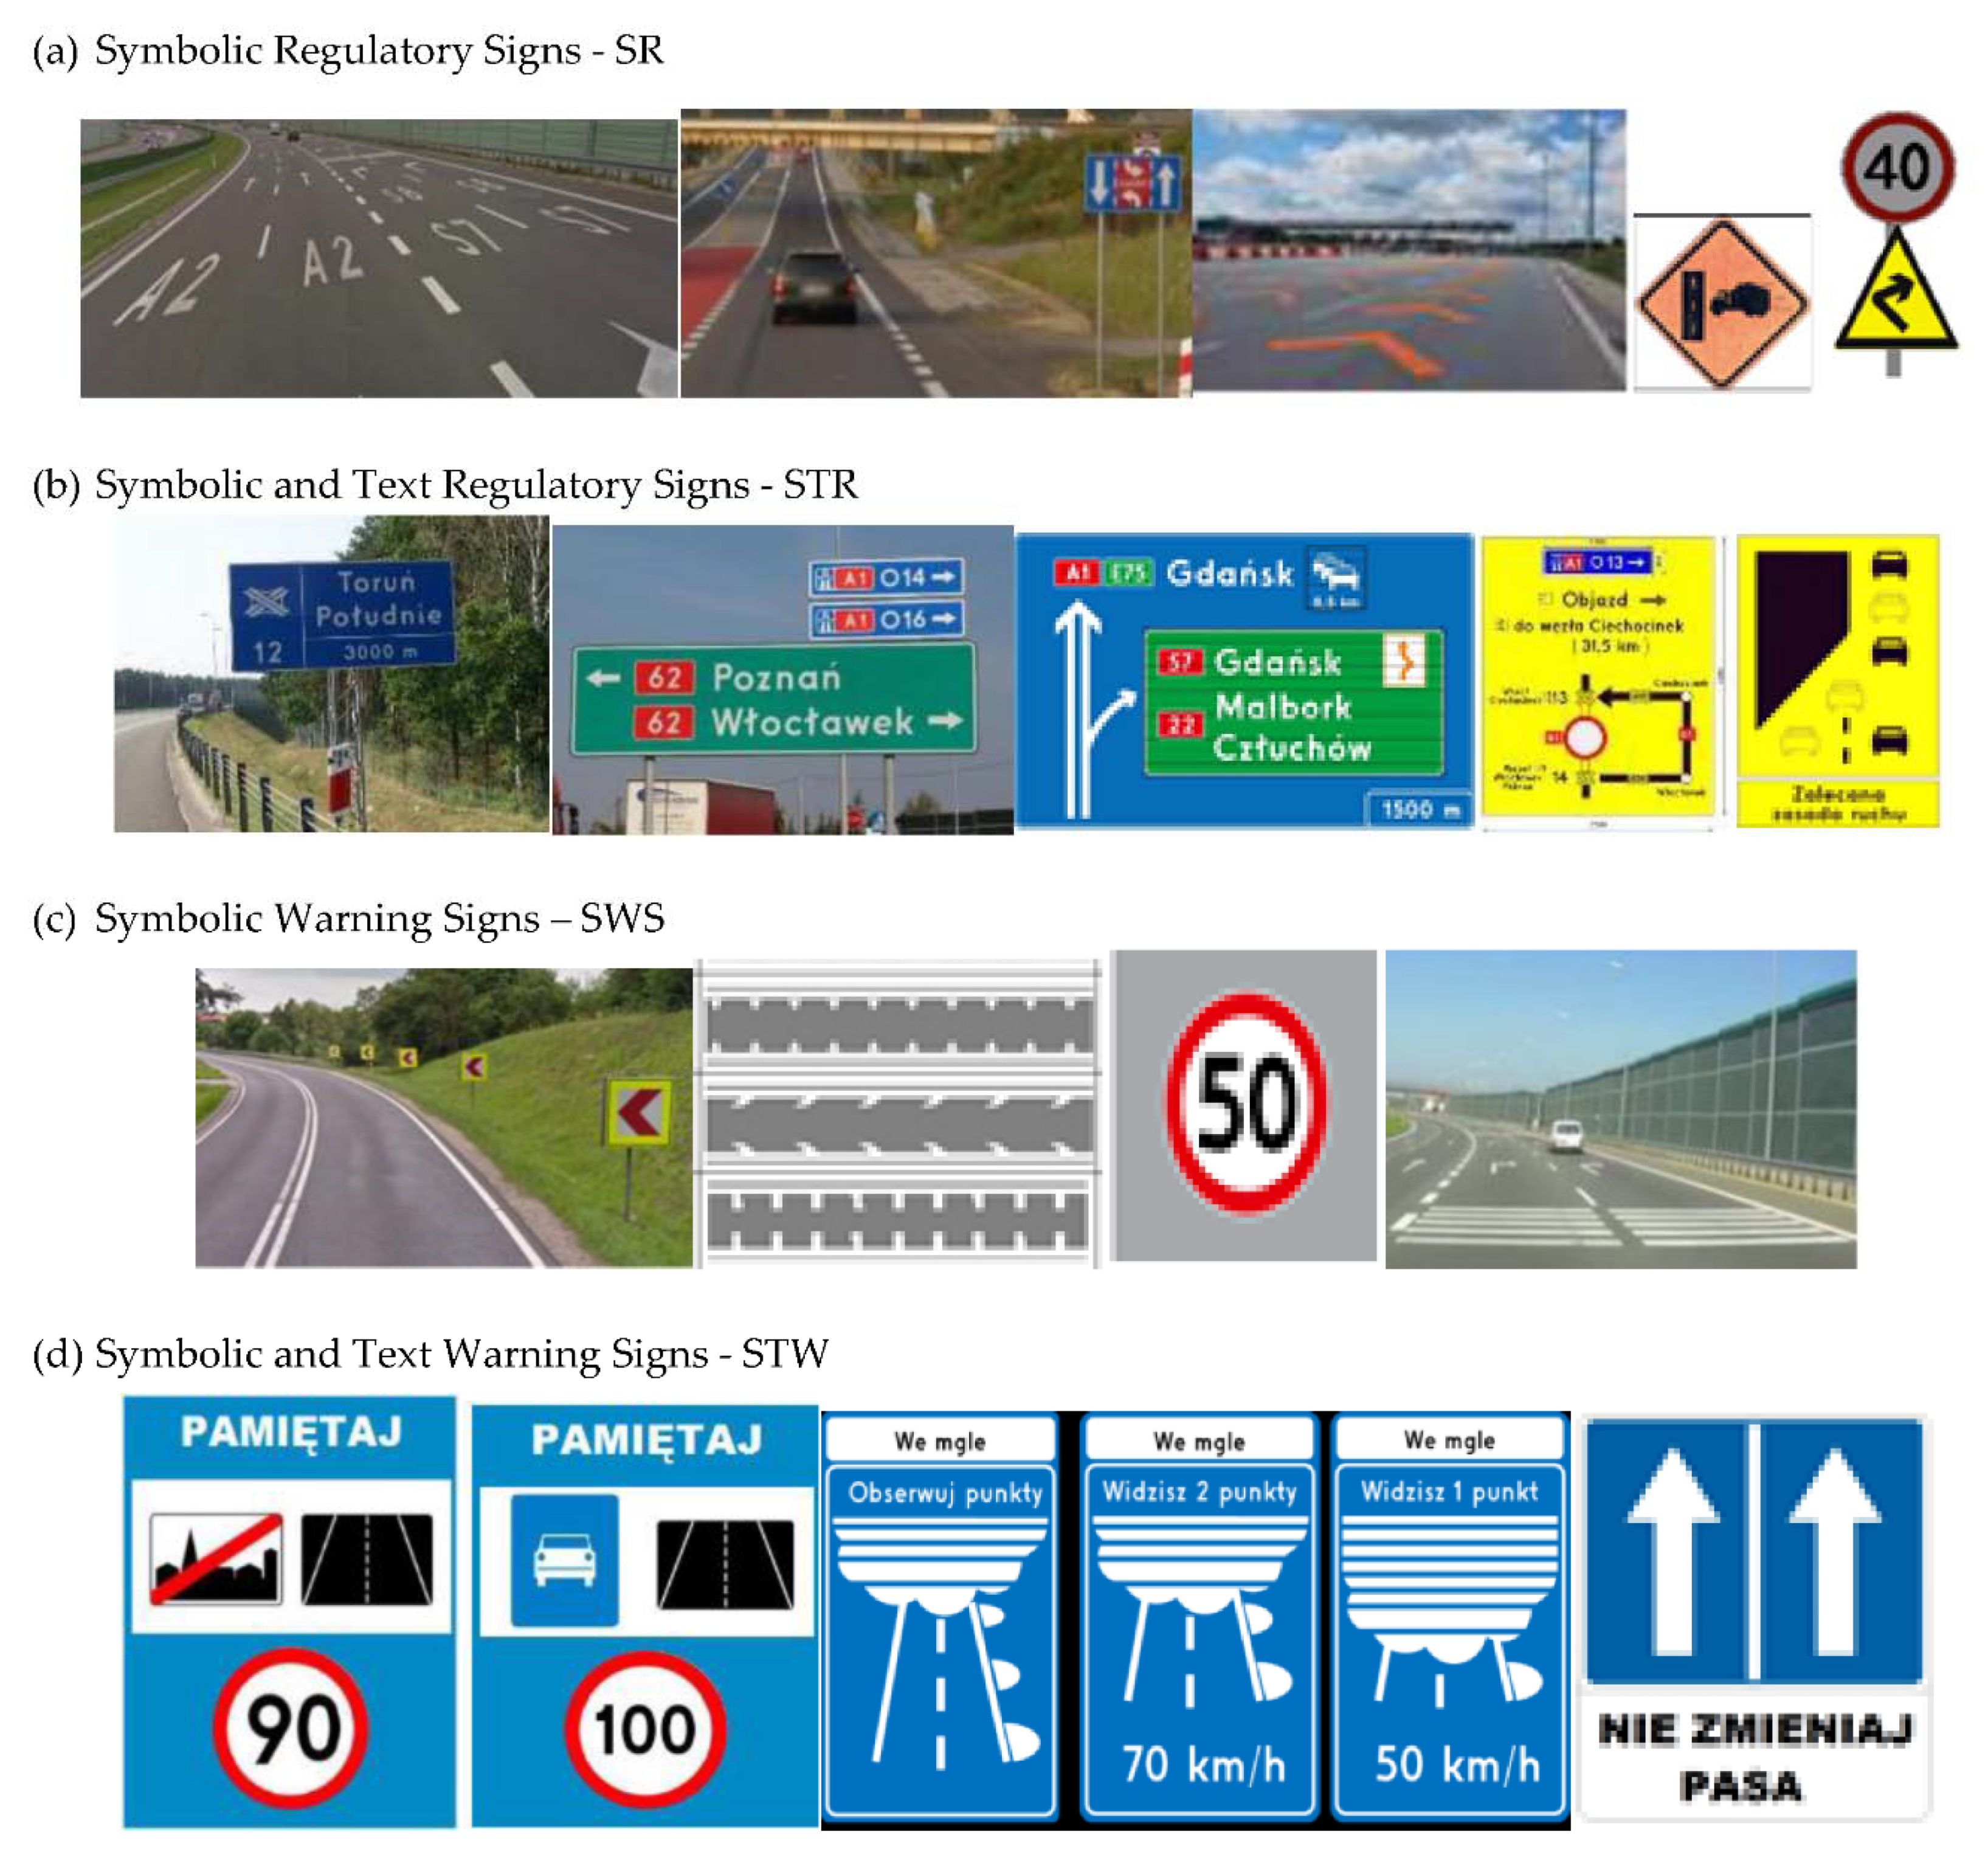
- (a)
- Symbolic Regulatory Signs (SR),
- (b)
- Symbolic and Text Regulatory Signs (STR),
- (c)
- Symbolic Warning Signs (SW),
- (d)
- Symbolic and Text Warning Signs (STW).
4.1. Traffic Signs Familiarity and Comprehensibility
4.2. Effect of Driver’s Gender on Traffic Signs Comprehensibility
4.3. Effect of Drivers’ Age, Driving Experience, Educational Level and License Category on Traffic Sign Familiarity and Comprehensibility
- (a)
- Symbolic Regulatory Signs (F (5.363) = 27.72 p < 0.000),
- (b)
- Symbolic and Text Regulatory Signs (F (5.363) = 2.511 p < 0.023),
- (c)
- Symbolic Warning Signs (F (5.363) = 7.378 p < 0.000).
- (a)
- Symbolic Regulatory Signs (F (5.363) = 7.462 p < 0.006)
- (b)
- Symbolic and Text Warning Signs (F (5.363) = 3.595 p < 0.007).
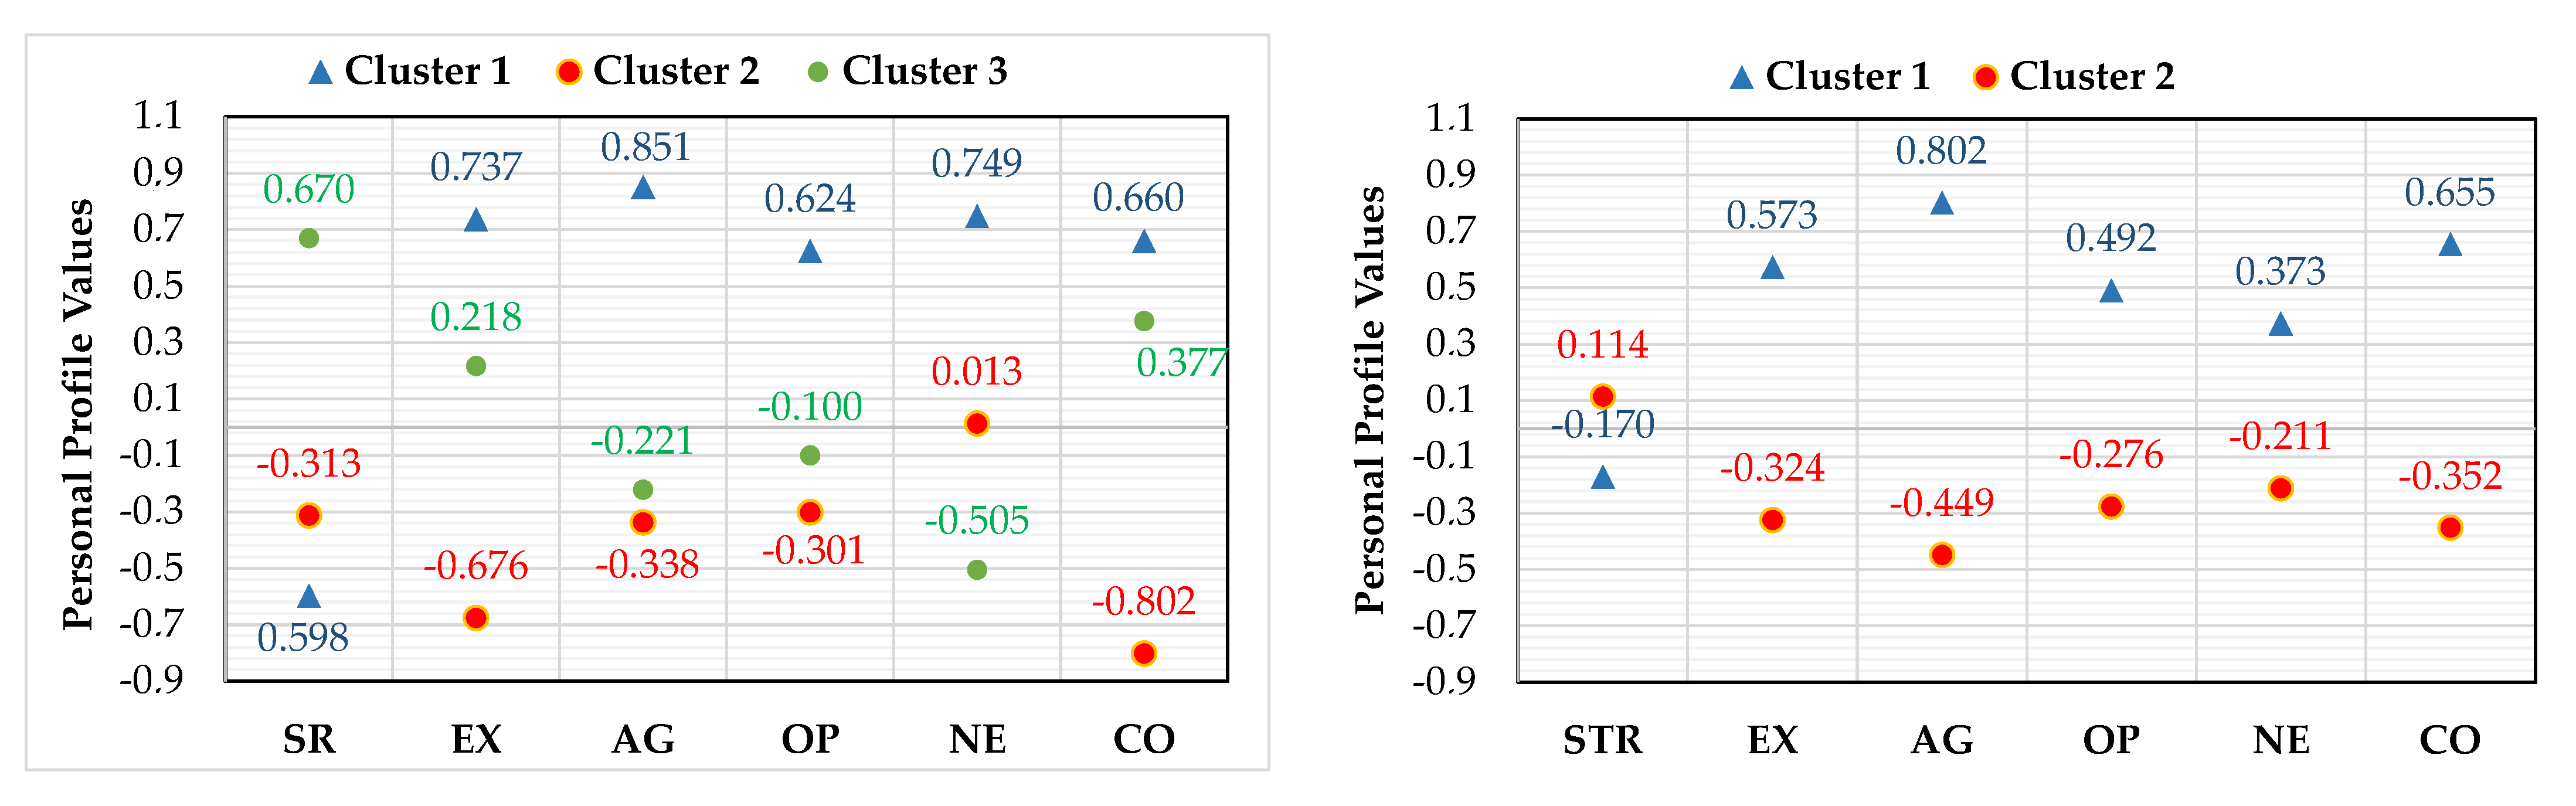
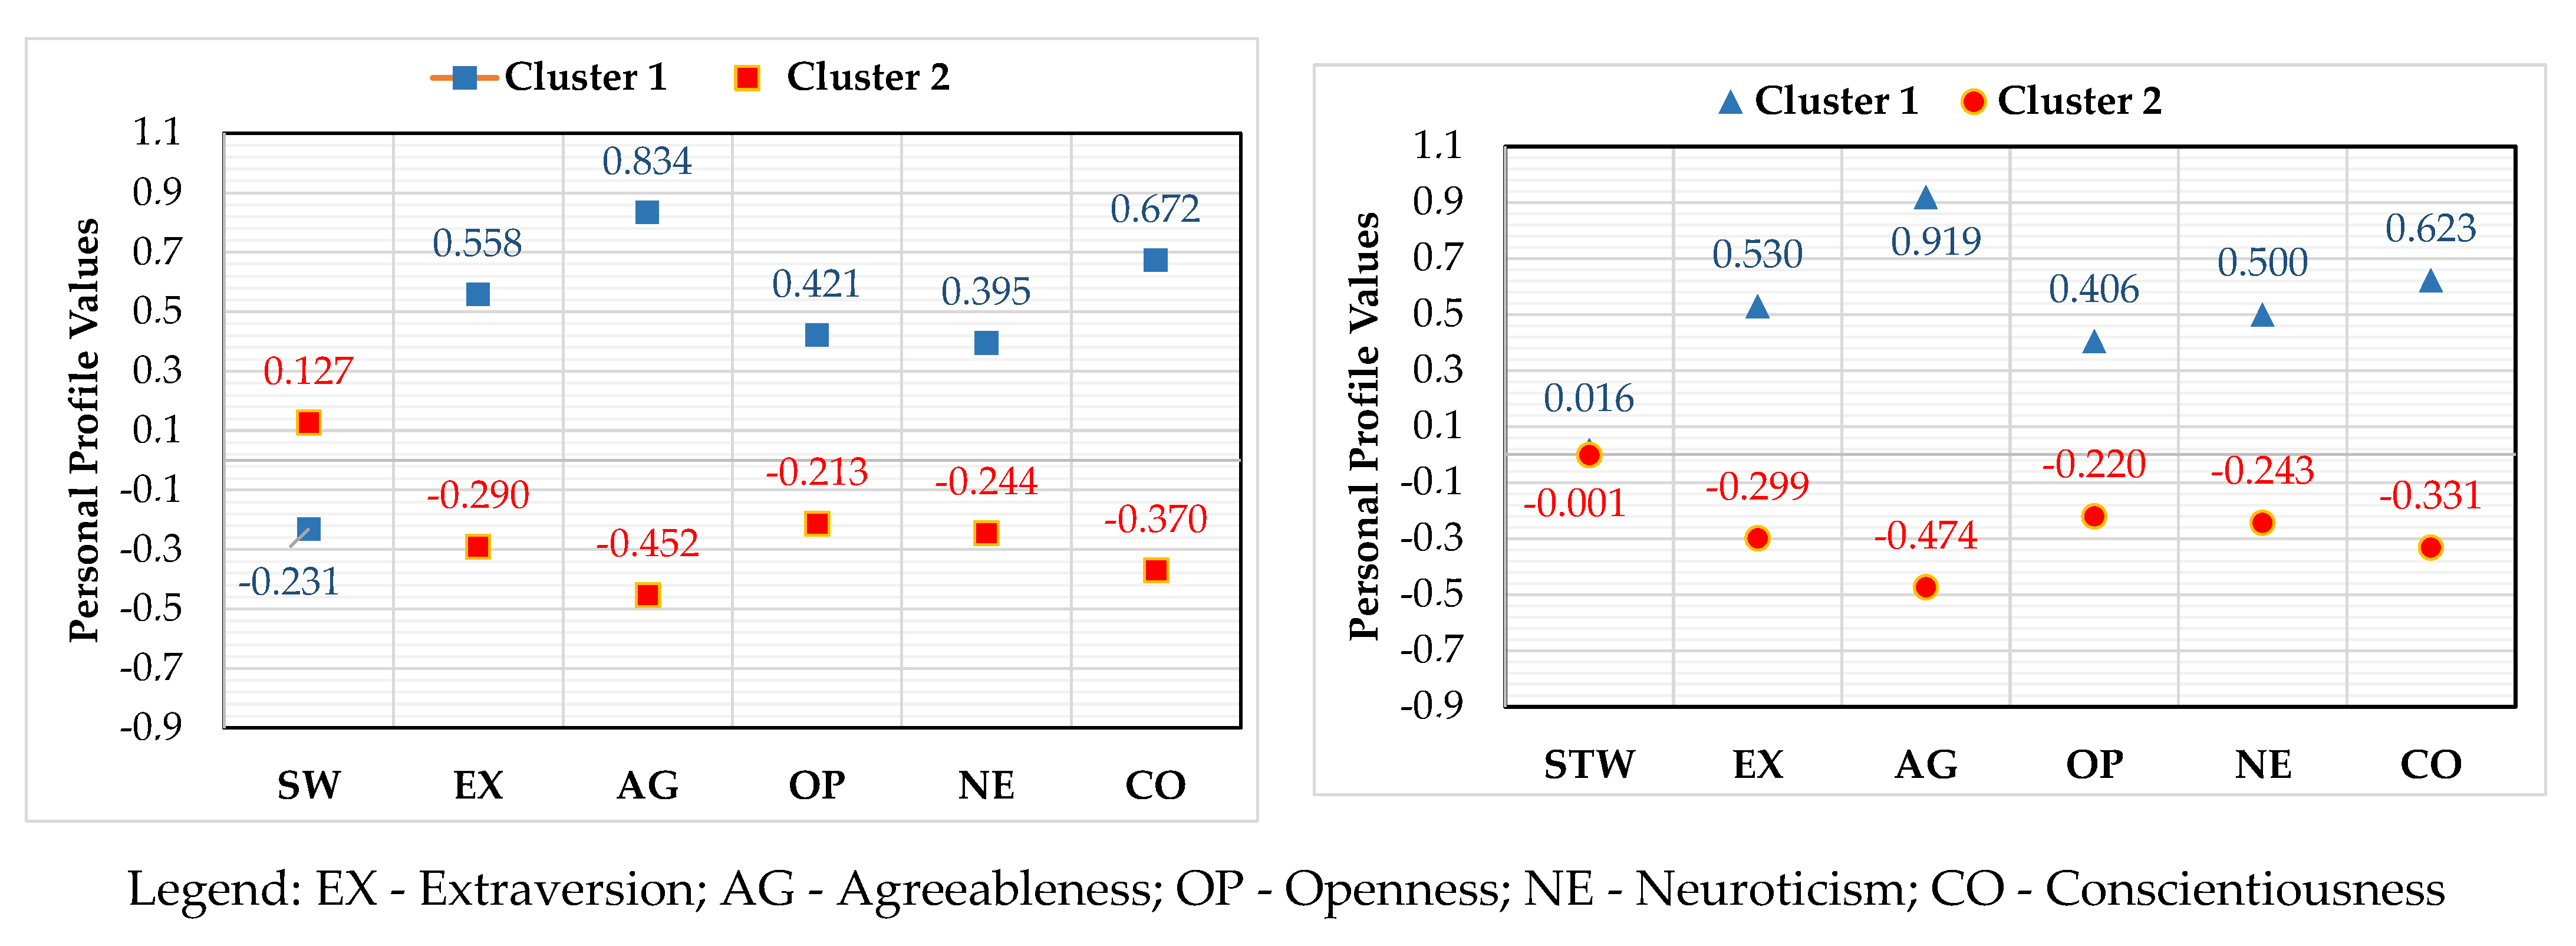
4.4. The Effect of Driving Personality Traits and Traffic Signs Comprehensibility
5. Discussion of Research Results
6. Conclusions—Practical Recommendations
- non-standard signs should be used only in cases where standard solutions prove to be insufficient or there are no standard signs addressing the need to influence the traffic in the presence of specific road situations;
- the form and content of non-standard signs should meet the basic ergonomic requirements applicable to standard signs. Excess content and its unfavorable distribution makes it difficult to properly receive information also in the case of non-standard signs. The unusual form of the sign may draw attention to it, but it is not a guarantee that one will comprehend its informational message;
- practical application of a non-standard sign in a specific place should be preceded by surveys of its comprehensibility. The result of such study may indicate the need for corrections of the form and content of the sign or its rejection;
- despite the generally higher level of comprehensibility of symbolic signs, the use of non-standard symbols on traffic signs should be preceded by an educational action. The study confirms the risk of a low level of comprehensibility of some symbols, despite their familiarity (i.e., encountering non-standard signs placed along roads);
- receipt of the information of some non-standard signs may be affected by local conditions of the place of use. Therefore, pilot applications of non-standard signs should be monitored to identify their actual impact on the behavior of road users.
Author Contributions
Funding
Institutional Review Board Statement
Informed Consent Statement
Data Availability Statement
Conflicts of Interest
References
- Ben-Bassat, T.; Shinar, D. Ergonomic Guidelines for Traffic Sign Design Increase Sign Comprehension. Hum. Factors 2006, 48, 182–195. [Google Scholar] [CrossRef] [PubMed]
- Ng, A.W.Y.; Chan, A.H.S. Visual and cognitive features on icon effectiveness. In Proceedings of the International Multi Conference of Engineers and Computer Scientists 2008 Vol II, IMECS 2008, Hong Kong, China, 19–21 March 2008. [Google Scholar]
- Shinar, D.; Vogelzang, M. Comprehension of traffic signs with symbolic versus text displays. Transp. Res. Part F Traffic Psychol. Behav. 2013, 18, 72–82. [Google Scholar] [CrossRef]
- Liu, B.; Wang, Z.; Song, G.; Wu, G. Cognitive processing of traffic signs in immersive virtual reality environment: An ERP study. Neurosci. Lett. 2010, 485, 43–48. [Google Scholar] [CrossRef] [PubMed]
- Liu, Y.C. A simulated study on the effects of information volume on traffic signs, viewing strategies and sign familiarity upon driver’s visual search performance. Int. J. Ind. Ergon. 2005, 35, 1147–1158. [Google Scholar] [CrossRef]
- Lai, C.J. Drivers’ comprehension of traffic information on graphical route information panels. Accid. Anal. Prev. 2005, 45, 565–571. [Google Scholar] [CrossRef]
- Shalloe, S.; Sharples, S.C.; Burnett, G.; Crundall, D.; Meekums, R.; Morris, D. Developing a graphical route information panel (GRIP) for use on the UK motorway network. The first steps. Transp. Res. Part F Traffic Psychol. Behav. 2014, 27, 133–149. [Google Scholar] [CrossRef][Green Version]
- Borowsky, A.; Shinar, D.; Parmet, Y. Sign location, sign recognition, and driver expectancies. Transp. Res. Part F Traffic Psychol. Behav. 2008, 11, 459–465. [Google Scholar] [CrossRef]
- Liu, X.; Lu, J. The technology of road guide signs setting in large interchanges. Procedia Soc. Behav. Sci. 2013, 96, 538–547. [Google Scholar] [CrossRef]
- Zhao, X.; Wu, Y.; Rong, J.; Ma, J. The effect of chevron alignment signs on driver performance on horizontal curves with different roadway geometries. Accid. Anal. Prev. 2015, 75, 226–235. [Google Scholar] [CrossRef]
- Castro, C.; Moreno-Ríos, S.; Tornay, F.; Vargas, C. Mental representations of obligatory and prohibitory traffic signs. Acta Psychol. 2008, 129, 8–17. [Google Scholar] [CrossRef]
- Ben-Bassat, T. The effect of context and ergonomic design of traffic signs, on drivers’ comprehension—A preliminary evaluation. In Proceedings of the Human Factors and Ergonomics Society 57th Annual Meeting 2013: ST7—Technology and Infrastructure for Safety and Mobility, San Diego, CA, USA, 30 September–4 October 2013; pp. 1943–1947. [Google Scholar]
- Ben-Bassat, T.; Shinar, D. The effect of context and drivers’ age on highway traffic signs comprehension. Transp. Res. Part F Traffic Psychol. Behav. 2015, 33, 117–127. [Google Scholar] [CrossRef]
- Guan, W.; Zhao, X.; Qin, Y.; Rong, J. An explanation of how the placement of traffic signs affects drivers’ deceleration on curves. Saf. Sci. 2014, 68, 243–249. [Google Scholar] [CrossRef]
- Shi, L.; Huseynova, N.; Yang, B.; Li, C.; Gao, L. A Cask Evaluation Model to Assess Safety in Chinese Rural Roads. Sustainability 2018, 10, 3864. [Google Scholar] [CrossRef]
- Al-Madani, H.; Al-Janahi, A.R. Assessment of drivers’ comprehension of traffic signs based on their traffic, personal and social characteristics. Transp. Res. Part F Traffic Psychol. Behav. 2002, 5, 63–76. [Google Scholar] [CrossRef]
- Al-Madani, H.; Al-Janahi, A.R. Role of drivers’ personal characteristics in understanding traffic sign symbols. Accid. Anal. Prev. 2002, 34, 185–196. [Google Scholar] [CrossRef]
- Ng, A.W.; Chan, A.H. The guessability of traffic signs: Effects of prospective-user factors and sign design features. Accid. Anal. Prev. 2007, 39, 1245–1257. [Google Scholar] [CrossRef]
- Jamson, S.; Mrozek, M. Is three the magic number? The role of ergonomic principles in cross country comprehension of road traffic signs. Ergonomics 2016, 60, 1024–1031. [Google Scholar] [CrossRef]
- Shinar, D.; Dewar, R.E.; Summala, H.; Zakowska, L. Traffic sign symbol comprehension: A cross-cultural study. Ergonomics 2003, 46, 1549–1565. [Google Scholar] [CrossRef]
- Dewar, R.; Kline, D.; Swanson, H. Age differences in comprehension of traffic symbols. Accid. Reconstr. J. 2001, 12, 37–41. [Google Scholar]
- Liu, Y.C.; Ho, C.H. The effects of age on symbol comprehension in central rail hubs in Taiwan. Appl. Ergon. 2012, 43, 1016–1025. [Google Scholar] [CrossRef]
- Taamneh, M.; Alkheder, S. Traffic sign perception among Jordanian drivers: An evaluation study. Transp. Policy 2018, 66, 17–29. [Google Scholar] [CrossRef]
- Bortei-Doku, S.; Kaplan, S.; Prato, C.G.; Nielsen, O.A. Road signage comprehension and overload: The role of driving style and need for closure. Transp. Res. Procedia 2017, 24, 442–449. [Google Scholar] [CrossRef][Green Version]
- Scialfa, C.; Spadafora, P.; Klein, M.; Lesnik, A.; Dial, L.; Heinrich, A. Iconic sign comprehension in older adults: The role of cognitive impairment and text enhancement. Can. J. Aging 2008, 27, 253–265. [Google Scholar] [CrossRef] [PubMed]
- Young, M.S.; Mahfoud, J.M.; Stanton, N.A.; Salmon, P.M.; Jenkins, D.P.; Walker, G.H. Conflicts of interest: The implications of roadside advertising for driver attention. Transp. Res. Part F Traffic Psychol. Behav. 2009, 12, 381–388. [Google Scholar] [CrossRef]
- Bendak, S.; Al-Saleh, K. The role of roadside advertising signs in distracting drivers. Int. J. Ind. Ergon. 2010, 40, 233–236. [Google Scholar] [CrossRef]
- Edquist, J.; Horberry, T.; Hosking, S.; Johnston, I. Effects of advertising billboards during simulated driving. Appl. Ergon. 2011, 42, 619–626. [Google Scholar] [CrossRef]
- Metz, B.; Krüger, H.P. Do supplementary signs distract the driver? Transp. Res. Part F Traffic Psychol. Behav. 2014, 23, 1–14. [Google Scholar] [CrossRef]
- Costa, M.; Simone, A.; Vignalli, V.; Lantieri, C.; Bucchi, A.; Dondi, G. Looking behavior for vertical road signs. Transp. Res. Part F Traffic Psychol. Behav. 2014, 23, 147–155. [Google Scholar] [CrossRef]
- Drake, C.A. Accident-proneness: A hypothesis. Character Personal. Q. Psychodiagn. Allied Stud. 1940, 8, 335–341. [Google Scholar] [CrossRef]
- Harris, F.J. Can personality tests identify accident-prone employees? Pers. Psychol. 1950, 3, 455–459. [Google Scholar] [CrossRef]
- Parker, J.W. Psychological and personal history data related to accident records of commercial truck drivers. J. Appl. Psychol. 1953, 37, 317–320. [Google Scholar] [CrossRef]
- Shaw, L. The practical use of projective personality tests as accident predictors. Traffic Saf. Res. Rev. 1965, 9, 34–72. [Google Scholar]
- Shaw, L.; Sichel, H.S. Accident Proneness; Pergamon Press: Oxford, UK, 1971. [Google Scholar]
- Andersson, A.L.; Nilsson, A.; Henriksson, N. Personality differences between accident-loaded and accident-free young car drivers. Br. J. Psychol. 1970, 61, 409–421. [Google Scholar] [CrossRef]
- Jamison, K.; Mc Glothlin, W.H. Drug usage, personality, attitudinal, and behavioral correlates of driving behavior. J. Psychol. 1973, 83, 123–130. [Google Scholar] [CrossRef] [PubMed]
- Quenault, S.W. Driver Behaviour—Safe and Unsafe Drivers; RRL Report LR 70; Road Research Laboratory: Crowthorne, UK, 1967. [Google Scholar]
- Begg, D.J.; Langley, J.D.; Williams, S.M. A longitudinal study of lifestyle factors as predictors of injuries and crashes among young adults. Accid. Anal. Prev. 1999, 31, 1–11. [Google Scholar] [CrossRef]
- Burns, P.C.; Wilde, G.J. Risk taking in male taxi drivers: Relationships among personality, observational data and driver records. Personal. Individ. Differ. 1995, 18, 267–278. [Google Scholar] [CrossRef]
- Clement, R.; Jonah, B.A. Field dependence, sensation seeking and driving behaviour. Personal. Individ. Differ. 1984, 5, 87–93. [Google Scholar] [CrossRef]
- Hartman, M.L.; Rawson, H.E. Differences in and correlates of sensation seeking in male and female athletes and non athletes. Personal. Individ. Differ. 1992, 13, 805–812. [Google Scholar] [CrossRef]
- Carty, M.; Stough, C.; Gillespie, N. The psychological predictors of work accidents and driving convictions in the transport industry. Saf. Sci. Monit. 1998, 3, 1–13. [Google Scholar]
- Arthur, W., Jr.; Barrett, G.V.; Alexander, R.A. Prediction of vehicular accident involvement: A meta-analysis. Hum. Perform. 1991, 4, 89–105. [Google Scholar] [CrossRef]
- Hansen, C.P. Personality characteristics of the accident involved employee. J. Bus. Psychol. 1988, 2, 346–365. [Google Scholar] [CrossRef]
- Jonah, B.A. Sensation seeking and risky driving: A review and synthesis of the literature. Accid. Anal. Prev. 1997, 29, 651–665. [Google Scholar] [CrossRef]
- Brandau, H.; Daghofer, F.; Hofmann, M.; Spitzer, P. Personality subtypes of young moped drivers, their relationship to risk-taking behavior and involvement in road crashes in an Austrian sample. Accid. Anal. Prev. 2011, 43, 1713–1719. [Google Scholar] [CrossRef]
- Arthur, W., Jr.; Tubre, T.C.; Day, E.; Sheehan, M.K.; Sanchez-Ku, M.L.; Paul, D.S.; Archuleta, K.D. Motor vehicle crash involvement and moving violations: Convergence of self-report and archival data. Hum. Factors 2001, 43, 1–11. [Google Scholar] [CrossRef]
- Arthur, W., Jr.; Doverspike, D. Predicting motor vehicle crash involvement from a personality measure and a driving knowledge test. J. Prev. Interv. Community 2001, 22, 35–42. [Google Scholar] [CrossRef]
- Arthur, W., Jr.; Day, E.A. Information processing, personality, and demographic variables as predictors of crashes and moving violations. In Traffic Accidents: Causes and Outcomes; Bartley, G.P., Ed.; Nova: Hauppauge, NY, USA, 2008. [Google Scholar]
- Clarke, S.; Robertson, I.T. A meta-analytic review of the Big Five personality factors and accident involvement in occupational and non-occupational settings. J. Occup. Organ. Psychol. 2005, 78, 355–376. [Google Scholar] [CrossRef]
- af Wåhlberg, A.E. Some methodological deficiencies in studies on traffic accident predictors. Accid. Anal. Prev. 2003, 35, 473–486. [Google Scholar] [CrossRef]
- af Wåhlberg, A.E.; Barraclough, P.; Freeman, J. The Driver Behaviour Questionnaire as accident predictor; A methodological re-meta-analysis. J. Saf. Res. 2015, 55, 185–212. [Google Scholar] [CrossRef]
- af Wåhlberg, A.E.; Dorn, L. Bus driver accident record; the return of accident proneness. Theor. Issues Ergon. Sci. 2009, 10, 77–91. [Google Scholar] [CrossRef]
- Barraclough, P.; af Wåhlberg, A.E.; Freeman, J.; Watson, B.; Watson, A. Predicting Crashes Using Traffic Offences. A Meta-Analysis that Examines Potential Bias between Self-Report and Archival Data. PLoS ONE 2016, 11, e0153390. [Google Scholar] [CrossRef] [PubMed]
- Af Wåhlberg, A.E.; Barraclough, P.; Freeman, J. Personality versus traffic accidents; meta-analysis of real and method effects. Transp. Res. Part F Traffic Psychol. Behav. 2017, 44, 90–104. [Google Scholar] [CrossRef]
- Costa, P.T., Jr.; McCrae, R.R. Four ways five factors are basic. Personal. Individ. Differ. 1992, 13, 653–665. [Google Scholar] [CrossRef]
- Wolff, J.S.; Wogalter, M.S. Comprehension of Pictorial Symbols: Effects of Context and Test Method. Hum. Factors J. Hum. Factors Ergon. Soc. 1998, 40, 173–186. [Google Scholar] [CrossRef]
- Zawadzki, B.; Strelau, J.; Szczepaniak, P.; Śliwinska, M. Inwentarz Osobowości NEO-FFI Costy i McCrae; Adaptacja polska. Podręcznik; Pracownia Testów Psychologicznych PTP: Warszawa, Poland, 1998. [Google Scholar]
- Stern, Y. What is cognitive reserve? Theory and research application of the reserve concept. J. Int. Neuropsychol. Soc. 2002, 8, 448–460. [Google Scholar] [CrossRef]
- Stern, Y. The Concept of Cognitive Reserve: A Catalyst for Research. J. Clin. Exp. Neuropsychol. 2003, 25, 589–593. [Google Scholar] [CrossRef] [PubMed]
- Opdebeeck, C.; Martyr, A.; Clare, L. Cognitive reserve and cognitive function in healthy older people: A meta-analysis. Agingneuropsychol. Cogn. 2016, 23, 40–60. [Google Scholar] [CrossRef] [PubMed]
- Frankenmolen, N.L.; Fasotti, L.; Kessels, R.P.; Oosterman, J.M. The influence of cognitive reserve and age on the use of memory strategies. Exp. Aging Res. 2018, 44, 117–134. [Google Scholar] [CrossRef]
- Lojo-Seoane, C.; Facal, D.; Guàrdia-Olmos, J.; Pereiro, A.X.; Juncos-Rabadán, O. Effects of Cognitive Reserve on Cognitive Performance in a Follow-Up Study in Older Adults with Subjective Cognitive Complaints. The Role of Working Memory. Front. Aging Neurosci. 2018, 10, 189. [Google Scholar] [CrossRef] [PubMed]
- Lojo-Seoane, C.; Facal, D.; Guàrdia-Olmos, J.; Juncos-Rabadán, O. Structural Model for Estimating the Influence of Cognitive Reserve on Cognitive Performance in Adults with Subjective Memory Complaints. Arch. Clin. Neuropsychol. 2014, 29, 245–255. [Google Scholar] [CrossRef]
- Dahlen, E.R.; Edwards, B.D.; Tubre, T.; Zyphur, M.J.; Warren, C.R. Taking a look behind the wheel: An investigation into the personality predictors of aggressive driving. Accid. Anal. Prev. 2012, 45, 1–9. [Google Scholar] [CrossRef] [PubMed]
- Fikri, I.R.; Halim, F.W. The model of personality and driver behaviour as mediator on road accident involvement among bus drivers in Riau Province Indonesia. Int. J. Psychol. Behav. Sci. 2015, 5, 148–153. [Google Scholar]
- Lajunen, T. Personality and accident liability: Are extraversion, neuroticism and psychoticism related to traffic and occupational fatalities? Pers. Individ. Differ. 2001, 31, 1365–1373. [Google Scholar] [CrossRef]
- Monteiro, R.P.; de Holanda Coelho, G.L.; Hanel, P.H.P.; Pimentel, C.E.; Gouveia, V.V. Personality, dangerous driving, and involvement in accidents: Testing a contextual mediated model. Transp. Res. Part F Traffic Psychol. Behav. 2018, 58, 106–114. [Google Scholar] [CrossRef]
- Jovanovic, D.; Lipovac, K.; Stanojevic, P.; Stanojevic, D. The effects of personality traits on driving-related anger and aggressive behaviour in traffic among Serbian drivers. Transp. Res. Part F Traffic Psychol. Behav. 2011, 14, 43–53. [Google Scholar] [CrossRef]
- Anitei, M.; Chraif, M.; Burtaverde, V.; Mihaila, T. The Big Five personality facts in the prediction of aggressive driving behaviour among Romanian youngsters. Int. J. Traffic Transp. Psychol. 2014, 2, 7–20. [Google Scholar]
- Benfield, J.A.; Szlemko, W.J.; Bell, P.A. Driver personality and anthropomorphic attributions of vehicle personality relate to reported aggressive driving tendencies. Pers. Individ. Differ. 2007, 42, 247–258. [Google Scholar] [CrossRef]
- Dahlen, E.R.; White, R.P. The Big Five factors, sensation seeking, and driving anger in the prediction of unsafe driving. Pers. Individ. Differ. 2006, 41, 903–915. [Google Scholar] [CrossRef]
- Ulleberg, P.; Rundmo, T. Personality, attitudes and risk perception as predictors of risky driving behaviour among young drivers. Saf. Sci. 2003, 41, 427–443. [Google Scholar] [CrossRef]
- Cellar, D.F.; Nelson, Z.C.; Yorke, C.M.; Bauer, C. The five-factor model and safety in the workplace: Investigating the relationships between personality and accident involvement. J. Prev. Interv. Community 2001, 22, 43–52. [Google Scholar] [CrossRef]
- Guo, M.; Wei, W.; Liao, G.; Chu, F. The impact of personality on driving safety among Chinese high-speed railway drivers. Accid. Anal. Prev. 2016, 92, 9–14. [Google Scholar] [CrossRef]
- Levy, J.; Pashler, H.; Boer, E. Central interference in driving: Is there any stopping the psychological refractory period? Psychol. Sci. 2006, 17, 228–235. [Google Scholar] [CrossRef]
- Maples, W.C.; DeRosier, W.; Hoenes, R.; Bendure, R.; Moore, S. The effects of cell phone use on peripheral vision. Optometry 2008, 79, 36–42. [Google Scholar] [CrossRef] [PubMed]
- Kass, S.J.; Cole, K.S.; Stanny, C.J. Effects of distraction and experience on situation awareness and simulated driving. Transp. Res. Part F Traffic Psychol. Behav. 2007, 10, 321–329. [Google Scholar] [CrossRef]
- Wilson, M.; Smith, N.C.; Chattington, M.; Ford, M.; Marple-Horvat, D.E. The role of effort in moderating the anxiety–performance relationship: Testing the prediction of processing efficiency theory in simulated rally driving. J. Sports Sci. 2006, 24, 1223–1233. [Google Scholar] [CrossRef]
- Grunt-Mejer, K. Wypalenie zawodowe—Czynnik obniżający poziom bezpieczeństwa w pracy. Bezp. Pr. 2012, 4, 12–14. [Google Scholar]
- Costa, P.T.; McCrae, R.R.; Dye, D.A. Facet Scales for Agreeableness and Conscientiousness: A Revision of the NEO Personality Inventory. Pers. Individ. Differ. 1991, 12, 887–898. [Google Scholar] [CrossRef]
- McCrae, R.R.; Costa, P.T.J. The five-factor theory of personality. In Handbook of Personality: Theory and Research; John, O.P., Robins, R.W., Pervin, L.A., Eds.; Guilford Press: New York, NY, USA, 2008; pp. 159–181. [Google Scholar]
- DeYoung, C.G. Cybernetic Big Five Theory. J. Res. Pers. 2015, 56, 33–58. [Google Scholar] [CrossRef]
- Van Kampen, D. The 5-Dimensional Personality Test (5DPT): Relationships with Two Lexically Based Instruments and the Validation of the Absorption Scale. J. Pers. Assess. 2012, 94, 92–101. [Google Scholar] [CrossRef] [PubMed]


| Driver’s Characteristics | Categories | Frequency | Percent |
|---|---|---|---|
| Gender | Male | 218 | 59 |
| Female | 151 | 41 | |
| Total | 369 | 100 | |
| Age group | 18–25 years | 86 | 23 |
| 26–35 years | 104 | 32 | |
| 36–45 years | 60 | 14 | |
| 46–55 years | 72 | 19 | |
| 56–65 years | 47 | 12 | |
| Total | 369 | 100 | |
| Driving Status | Amateur Driver | 272 | 74 |
| Lorry Driver | 47 | 12 | |
| Bus Driver | 26 | 8 | |
| Driving instructor | 8 | 2 | |
| Taxi Driver | 16 | 4 | |
| Total | 369 | 100 | |
| Driving Experience | 1–5000 km per year | 51 | 14 |
| 6–10,000 km per year | 64 | 16 | |
| 11–15,000 km per year | 51 | 14 | |
| 16–20,000 km per year | 40 | 11 | |
| 21–30,000 km per year | 34 | 9 | |
| 31–40,000 km per year | 20 | 6 | |
| >41,000 km per year | 109 | 30 | |
| Total | 369 | 100 | |
| Bachelor degree | 100 | 28 | |
| Educational level | High school | 115 | 31 |
| MS/Ph.D. | 154 | 41 |
| Symbolic Regulatory Signs—SR | Symbolic and Text Regulatory Signs—STR | ||||
| Signs | Comprehensibility | Familiarity | Signs | Comprehensibility | Familiarity |
 | SR1 54% | 5% |  | STR1 35% | 56% |
 | SR2 72% | 42% |  | STR2 27% | 29% |
 | SR3 58% | 4% |  | STR3 22% | 7% |
 | SR4 42% | 13% |  | STR4 16% | 32% |
 | SR5 7% | 26% |  | STR5 8% | 18% |
| 46.6% | 18% | 24.7% | 23.7 | ||
| Symbolic Warning Signs—SW | Symbolic and Text Warning Signs—STW | ||||
| Signs | Compehensibility | Familiarity | Signs | Comprehensibility | Familiarity |
 | SW1 74% | 66% |  (remember about the speed limit) | STW1 17% | 19% |
 | SW2 70% | 73% |  | STW2 16% | 19% |
 | SW3 54% | 8% |  (driving in the fog) | STW3 32% | 6% |
 | SW4. 41% | 2% |  (don’t change lane) | STW4 8% | 13% |
| 60% | 37.3% | 18.3% | 14.3% | ||
| Traffic Sings (Comprehensibility) | N | Min | Max | Mean | SD |
|---|---|---|---|---|---|
| SR | 369 | 0.00 | 5.00 | 2.37 | 1.0739 |
| STR | 369 | 0.00 | 5.00 | 1.57 | 1.1292 |
| SW | 369 | 0.00 | 4.00 | 2.45 | 0.9606 |
| STW | 369 | 0.00 | 3.00 | 0.74 | 0.7281 |
| R2 | R2—Corrected | Beta | df | N | F | p | |
|---|---|---|---|---|---|---|---|
| SR | 0.0001 | −0.002 | −0.02 | 1 | 367 | 0.196 | 0.658 |
| STR | 0.049 | 0.046 | 0.22 | 1 | 367 | 18.592 | 0.000 |
| SW | 0.034 | 0.032 | 0.12 | 1 | 367 | 8.349 | 0.046 |
| STW | 0.004 | 0.001 | 0.06 | 1 | 367 | 1.349 | 0.246 |
| All Sign Groups in Total | 0.013 | 0.012 | 0.02 | 1 | 367 | 4.423 | 0.054 |
| Comprehensibility of Traffic Signs | Gender | N | Mean | SD | t | p |
|---|---|---|---|---|---|---|
| SR | Male Female | 218 151 | 2.50 2.19 | 1.116 0.984 | 7.465 | 0.007 |
| STR | Male Female | 218 151 | 1.65 1.47 | 1.162 1.119 | 2.164 | 0.142 |
| SW | Male Female | 218 151 | 2.49 2.39 | 0.912 1.030 | 0.838 | 0.361 |
| STW | Male Female | 218 151 | 0.73 0.75 | 0.714 0.750 | 0.053 | 0.818 |
| Driver’s Age | Driving Experience | Driver’s Educational Level | Driving Licence Category | ||||||
|---|---|---|---|---|---|---|---|---|---|
| Comprehensibility and Familiarity of traffic signs | N | F | p | F | p | F | p | F | p |
| Comprehensibility of SR | 369 | 3.951 | 0.047 | 1.734 | 0.112 | 1.033 | 0.377 | 0.291 | 0.884 |
| Familiarity of SR | 369 | 1.532 | 0.091 | 27.723 | 0.000 | 0.384 | 0.534 | 7.462 | 0.006 |
| Comprehensibility of STR | 369 | 2.022 | 0.074 | 0.536 | 0.781 | 2.768 | 0.041 | 2.855 | 0.023 |
| Familiarity of STR | 369 | 2.354 | 0.041 | 2.511 | 0.023 | 1.034 | 0.378 | 1.923 | 0.091 |
| Comprehensibility of SW | 369 | 1.589 | 0.162 | 1.564 | 0.156 | 1.126 | 0.338 | 0.524 | 0.757 |
| Familiarity of SW | 369 | 2.534 | 0.021 | 7.378 | 0.000 | 0.484 | 0.694 | 1.357 | 0.248 |
| Comprehensibility of STW | 369 | 0.973 | 0.433 | 1.196 | 0.307 | 0.107 | 0.955 | 2.068 | 0.068 |
| Familiarity of STW | 369 | 1.611 | 0.153 | 0.798 | 0.571 | 0.737 | 0.531 | 3.595 | 0.007 |
| Mean | SD | Statistical Significance of Differences Between Means | |||||||
|---|---|---|---|---|---|---|---|---|---|
| Cluster I | Cluster II | Cluster III | Cluster I | Cluster II | Cluster III | F | p | ||
| Comprehensibility of | SR | −0.598 | −0.313 | 0.669 | 0.941 | 0.895 | 0.727 | 72.947 | 0.000 |
| STR | −0.169 | 0.113 | 0.902 | 1.044 | 6.495 | 0.000 | |||
| SW | −0.230 | 0.127 | 1.006 | 0.965 | 9.906 | 0.002 | |||
| STW | 0.015 | −0.001 | 1.016 | 0.997 | 0.024 | 0.876 | |||
| Extraversion (EX) | SR | 0.737 | −0.676 | 0.217 | 0.921 | 0.866 | 0.7433 | 82.188 | 0.000 |
| STR | 0.573 | −0.323 | 0.968 | 0.864 | 79.059 | 0.000 | |||
| SW | 0.557 | −0.289 | 0.915 | 0.905 | 64.479 | 0.000 | |||
| STW | 0.531 | −0.298 | 0.969 | 0.879 | 66.088 | 0.000 | |||
| Agreeableness (AG) | SR | 0.851 | −0.337 | −0.221 | 1.018 | 0.783 | 0.878 | 54.671 | 0.000 |
| STR | 0.802 | −0.448 | 0.901 | 0.731 | 198.003 | 0.000 | |||
| SW | 0.833 | −0.452 | 0.903 | 0.744 | 189.625 | 0.000 | |||
| STW | 0.919 | −0.474 | 0.845 | 0.708 | 269.729 | 0.000 | |||
| Openness (OP) | SR | 0.624 | −0.300 | −0.101 | 0.949 | 0.988 | 0.879 | 26.883 | 0.000 |
| STR | 0.491 | −0.276 | 0.979 | 0.903 | 54.494 | 0.000 | |||
| SW | 0.421 | −0.212 | 1.005 | 0.924 | 32.782 | 0.000 | |||
| STW | 0.405 | −0.221 | 1.021 | 0.916 | 34.456 | 0.000 | |||
| Neuroticism (NE) | SR | 0.748 | 0.013 | −0.504 | 0.959 | 0.831 | 0.897 | 52.642 | 0.000 |
| STR | 0.373 | −0.211 | 1.075 | 0.913 | 28.818 | 0.000 | |||
| SW | 0.394 | −0.244 | 1.066 | 0.931 | 31.454 | 0.000 | |||
| STW | 0.499 | −0.242 | 1.019 | 0.901 | 49.578 | 0.000 | |||
| Conscientiousness (CO) | SR | 0.660 | −0.801 | 0.376 | 0.927 | 0.719 | 0.724 | 118.666 | 0.000 |
| STR | 0.655 | −0.352 | 0.835 | 0.884 | 108.405 | 0.000 | |||
| SW | 0.672 | −0.371 | 0.860 | 0.863 | 108.388 | 0.000 | |||
| STW | 0.622 | −0.331 | 0.866 | 0.886 | 94.082 | 0.000 | |||
Publisher’s Note: MDPI stays neutral with regard to jurisdictional claims in published maps and institutional affiliations. |
© 2021 by the authors. Licensee MDPI, Basel, Switzerland. This article is an open access article distributed under the terms and conditions of the Creative Commons Attribution (CC BY) license (http://creativecommons.org/licenses/by/4.0/).
Share and Cite
Wontorczyk, A.; Gaca, S. Study on the Relationship between Drivers’ Personal Characters and Non-Standard Traffic Signs Comprehensibility. Int. J. Environ. Res. Public Health 2021, 18, 2678. https://doi.org/10.3390/ijerph18052678
Wontorczyk A, Gaca S. Study on the Relationship between Drivers’ Personal Characters and Non-Standard Traffic Signs Comprehensibility. International Journal of Environmental Research and Public Health. 2021; 18(5):2678. https://doi.org/10.3390/ijerph18052678
Chicago/Turabian StyleWontorczyk, Antoni, and Stanislaw Gaca. 2021. "Study on the Relationship between Drivers’ Personal Characters and Non-Standard Traffic Signs Comprehensibility" International Journal of Environmental Research and Public Health 18, no. 5: 2678. https://doi.org/10.3390/ijerph18052678
APA StyleWontorczyk, A., & Gaca, S. (2021). Study on the Relationship between Drivers’ Personal Characters and Non-Standard Traffic Signs Comprehensibility. International Journal of Environmental Research and Public Health, 18(5), 2678. https://doi.org/10.3390/ijerph18052678