
Altitude and SARS-CoV-2 Infection in the First Pandemic Wave in Spain

 , , and
Abstract
:1. Introduction
2. Materials and Methods
3. Results
4. Discussion
5. Conclusions
Author Contributions
Funding
Institutional Review Board Statement
Informed Consent Statement
Data Availability Statement
Acknowledgments
Conflicts of Interest
References
- European Centre for Disease Prevention and Control. Communicable Disease Threats Report. Week 20. 10–16 May 2020. Available online: https://www.ecdc.europa.eu/sites/default/files/documents/Communicable-disease-threats-report-16-may-2020.pdf (accessed on 20 January 2021).
- Tzampoglou, P.; Loukidis, D. Investigation of the importance of climatic factors in COVID-19 worldwide intensity. Int. J. Environ. Res. Public Health 2020, 17, 7730. [Google Scholar] [CrossRef]
- Sajadi, M.M.; Habibzadeh, P.; Vintzileos, A.; Shokouhi, S.; Miralles-Wilhelm, F.; Amoroso, A. Temperature, humidity, and latitude analysis to estimate potential spread and seasonality of coronavirus disease 2019 (COVID-19). JAMA Netw. Open 2020, 3, e2011834. [Google Scholar] [CrossRef] [PubMed]
- Muñoz Cacho, P.; Hernández, J.L.; López-Hoyos, M.; Martínez-Taboada, V.M. Can climatic factors explain the differences in COVID-19 incidence and severity across the Spanish regions?: An ecological study. Environ. Health 2020, 19, 106. [Google Scholar] [CrossRef] [PubMed]
- Merow, C.; Urban, M.C. Seasonality and uncertainty in global COVID-19 growth rates. Proc. Natl. Acad. Sci. USA 2020, 117, 27456–27464. [Google Scholar] [CrossRef]
- Han, E.; Tan, M.M.J.; Turk, E.; Sridhar, D.; Leung, G.M.; Shibuya, K.; Asgari, N.; Oh, J.; García-Basteiro, A.L.; Hanefeld, J.J.; et al. Lessons learnt from easing COVID-19 restrictions: An analysis of countries and regions in Asia Pacific and Europe. Lancet 2020, 396, 1525–1534. [Google Scholar] [CrossRef]
- Jüni, P.; Rothenbühler, M.; Bobos, P.; Thorpe, K.E.; da Costa, B.R.; Fisman, D.N.; Slutsky, A.S.; Gesink, D. Impact of climate and public health interventions on the COVID-19 pandemic: A prospective cohort study. CMAJ 2020, 192, E566–E573. [Google Scholar] [CrossRef]
- Millet, G.P.; Debevec, T.; Brocherie, F.; Burtscher, M.; Burtscher, J. Altitude and COVID-19: Friend or foe? A narrative review. Physiol. Rep. 2021, 8, e14615. [Google Scholar] [CrossRef] [PubMed]
- Arias-Reyes, C.; Zubieta-DeUrioste, N.; Poma-Machicao, L.; Aliaga-Raduan, F.; Carvajal-Rodriguez, F.; Dutschmann, M.; Schneider-Gasser, E.M.; Zubieta-Calleja, G.; Soliz, J. Does the pathogenesis of SARS-CoV-2 virus decrease at high-altitude? Respir. Physiol. Neurobiol. 2020, 277, 103443. [Google Scholar] [CrossRef]
- Pun, M.; Turner, R.; Strapazzon, G.; Brugger, H.; Swenson, E.R. Lower incidence of COVID-19 at high altitude: Facts and confounders. High Alt. Med. Biol. 2020, 21, 217–222. [Google Scholar] [CrossRef]
- Quevedo-Ramirez, A.; Al-Kassab-Córdova, A.; Mendez-Guerra, C.; Cornejo-Venegas, G.; Alva-Chavez, K.P. Altitude and excess mortality during COVID-19 pandemic in Peru. Respir. Physiol. Neurobiol. 2020, 281, 103512. [Google Scholar] [CrossRef]
- Woolcott, O.O.; Bergman, R.N. Mortality attributed to COVID-19 in high-altitude populations. High Alt. Med. Biol. 2020, 21, 409–416. [Google Scholar] [CrossRef] [PubMed]
- Cascetta, E.; Henke, I.; Di Francesco, L. The effects of air pollution, sea exposure and altitude on COVID-19 hospitalization rates in Italy. Int. J. Environ. Res. Public Health 2021, 18, 452. [Google Scholar] [CrossRef] [PubMed]
- Working Group for the Surveillance and Control of COVID-19 in Spain. The first wave of COVID-19 pandemic in Spain: Characterization of cases and risk factors for severe outcomes, as at 27 April 2020. Eurosurveillance 2020, 25, 2001431. [Google Scholar]
- Ministerio de Sanidad, Consumo y Bienestar Social. Plan para la Transición Hacia una Nueva Normalidad. 2020. Available online: https://www.mscbs.gob.es/profesionales/saludPublica/ccayes/alertasActual/nCov-China/planDesescalada.htm (accessed on 20 January 2021).
- Pollán, M.; Pérez-Gómez, B.; Pastor-Barriuso, R.; Oteo, J.; Hernán, M.A.; Pérez-Olmeda, M.; Sanmartín, J.L.; Fernández-García, A.; Cruz, I.; Fernández de Larrea, N.; et al. Prevalence of SARS-CoV-2 in Spain (ENE-COVID): A nationwide, population-based seroepidemiological study. Lancet 2020, 396, 535–544. [Google Scholar] [CrossRef]
- O’Reilly, K.M.; Auzenbergs Mm Jafari, Y.; Liu, Y.; Flasche, S.; Lowe, R. Effective transmission across the globe: The role of climate in COVID-19 mitigation strategies. Lancet Planet. Health 2020, 4, e172. [Google Scholar] [CrossRef]
- Segovia-Juarez, J.; Castagnetto, J.M.; Gonzales, G.F. High altitude reduces infection rate of COVID-19 but not case-fatality rate. Respir. Physiol. Neurobiol. 2020, 281, 103494. [Google Scholar] [CrossRef] [PubMed]
- Accinelli, R.A.; Leon-Abarca, J.A. At high altitude COVID-19 is less frequent: The experience of Peru. [En la altura la COVID-19 es menos frecuente: La experiencia del Perú]. Arch. Bronconeumol. 2020, 56, 760–761. [Google Scholar] [CrossRef]
- Hamidi, S.; Ewing, R.; Sabouri, S. Longitudinal analyses of the relationship between development density and the COVID-19 morbidity and mortality rates: Early evidence from 1,165 metropolitan counties in the United States. Health Place 2020, 64, 102378. [Google Scholar] [CrossRef]
- Islam, N.; Bukhari, Q.; Jameel, Y.; Shabnam, S.; Erzurumluoglu, A.M.; Siddique, M.A.; Massaro, J.M.; D’Agostino, R.B., Sr. COVID-19 and climatic factors: A global analysis. Environ. Res. 2021, 193, 110355. [Google Scholar] [CrossRef]
- Lolli, S.; Chen, Y.C.; Wang, S.H.; Vivone, G. Impact of meteorological conditions and air pollution on COVID-19 pandemic transmission in Italy. Sci. Rep. 2020, 10, 16213. [Google Scholar] [CrossRef] [PubMed]
- Sun, Z.; Zhang, H.; Yang, Y.; Wan, H.; Wang, Y. Impacts of geographic factors and population density on the COVID-19 spreading under the lockdown policies of China. Sci. Total Environ. 2020, 746, 141347. [Google Scholar] [CrossRef] [PubMed]
- Wong, D.W.S.; Li, Y. Spreading of COVID-19: Density matters. PLoS ONE 2020, 15, e0242398. [Google Scholar] [CrossRef] [PubMed]
- Coşkun, H.; Yıldırım, N.; Gündüz, S. The spread of COVID-19 virus through population density and wind in Turkey cities. Sci. Total Environ. 2021, 751, 141663. [Google Scholar] [CrossRef] [PubMed]
- Jahangiri, M.; Jahangiri, M.; Najafgholipour, M. The sensitivity and specificity analyses of ambient temperature and population size on the transmission rate of the novel coronavirus (COVID-19) in different provinces of Iran. Sci. Total Environ. 2020, 728, 138872. [Google Scholar] [CrossRef] [PubMed]
- Coccia, M. Factors determining the diffusion of COVID-19 and suggested strategy to prevent future accelerated viral infectivity similar to COVID. Sci. Total Environ. 2020, 729, 138474. [Google Scholar] [CrossRef] [PubMed]

| Variables Analyzed | Mean | SD | Range | Median |
|---|---|---|---|---|
| Seroprevalence of SARS-CoV-2 IgG, % * | 4.3 | 3.8 | 0.2–13.6 | 2.8 |
| Altitude above sea level, m ** | 370 | 362 | 5–1131 | 215 |
| Latitude in degrees ** | 39.9 | 3.2 | 28.1–43.3 | 40.5 |
| Average absolute humidity (g/m3) ** | 7.3 | 1.3 | 4.9–10.6 | 7.3 |
| Average of daily maximum temperatures ** | 17.0 | 2.5 | 12.7–22.3 | 16.5 |
| Average of daily minimum temperatures ** | 7.0 | 3.6 | 1.0–16.1 | 6.6 |
| Average of daily mean temperatures ** | 11.9 | 3.0 | 6.2–19.2 | 11.7 |
| Population (in thousands) | 943 | 1208 | 90–6747 | 643 |
| Extension (km2) | 9921 | 4805 | 1980–21,766 | 9992 |
| Density of population (inhabitants/km2) | 132 | 174 | 9–840 | 63 |
| Analyses and Variables | Beta | SE | p-Value | R2 |
|---|---|---|---|---|
| Bivariate analyses | ||||
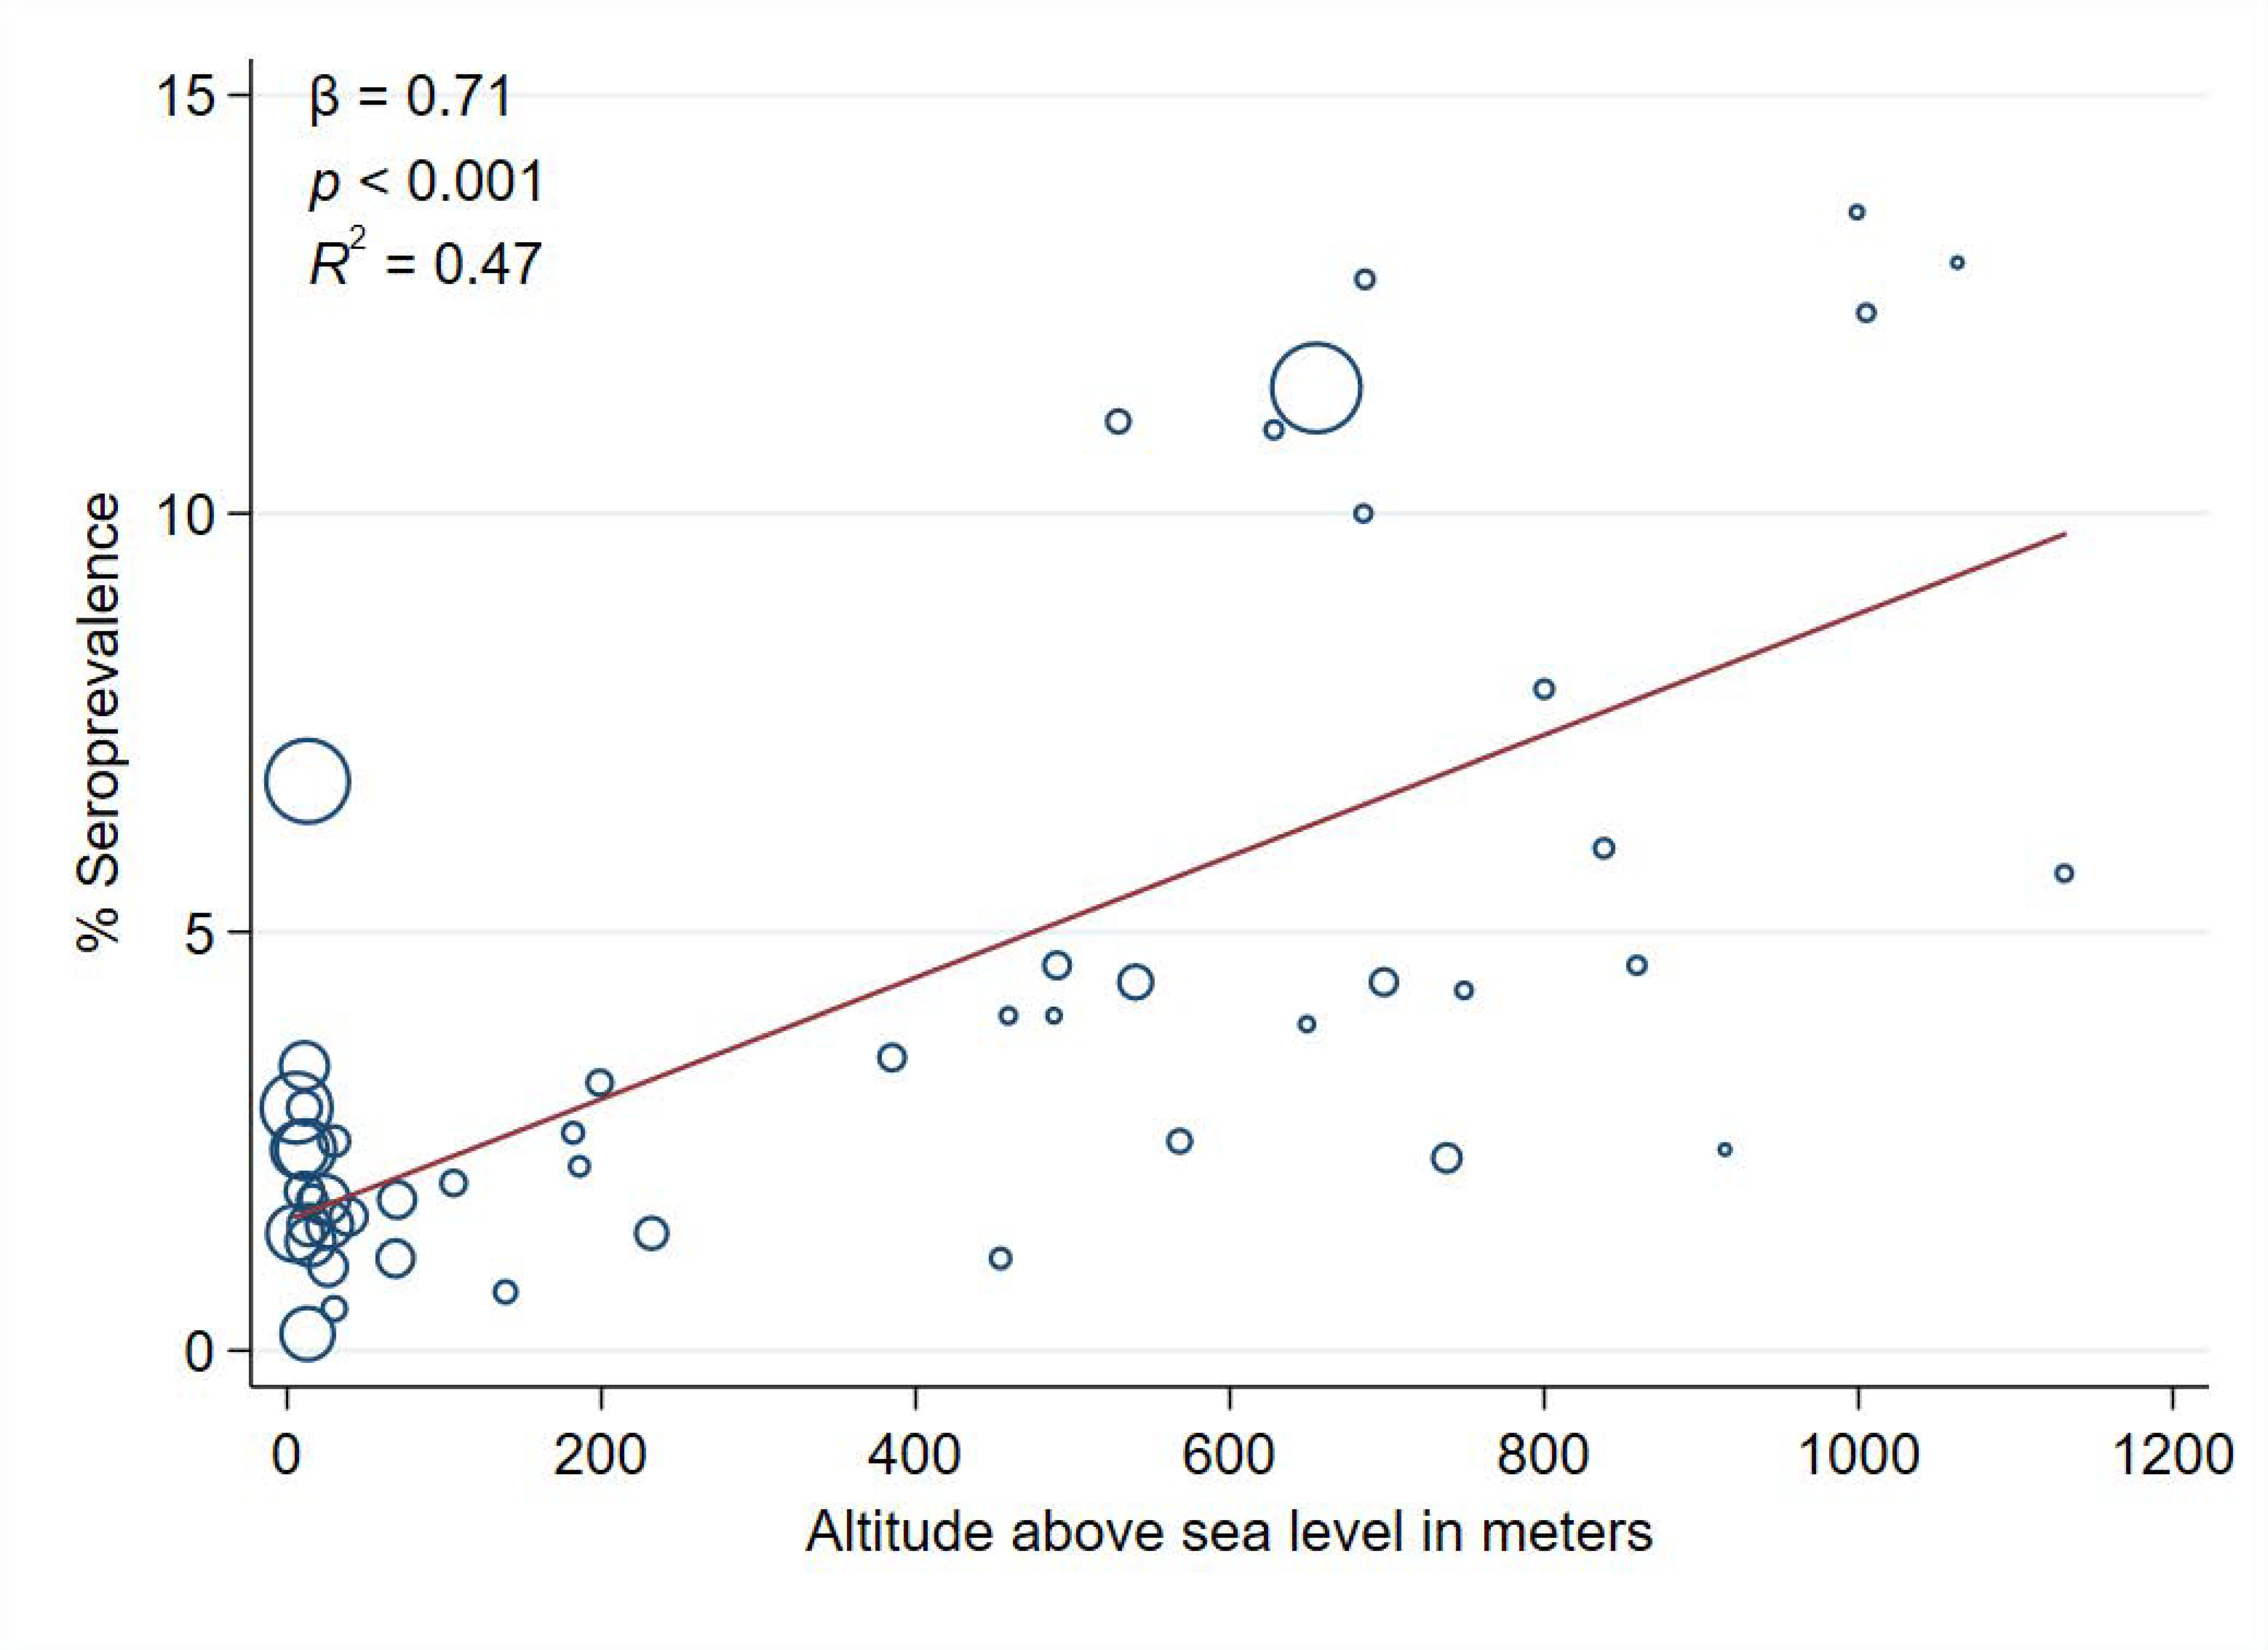
| Altitude above sea level (per 100 m) * | 0.71 | 0.11 | <0.001 | 0.47 |
| Latitude in degrees * | 0.19 | 0.17 | 0.261 | 0.03 |
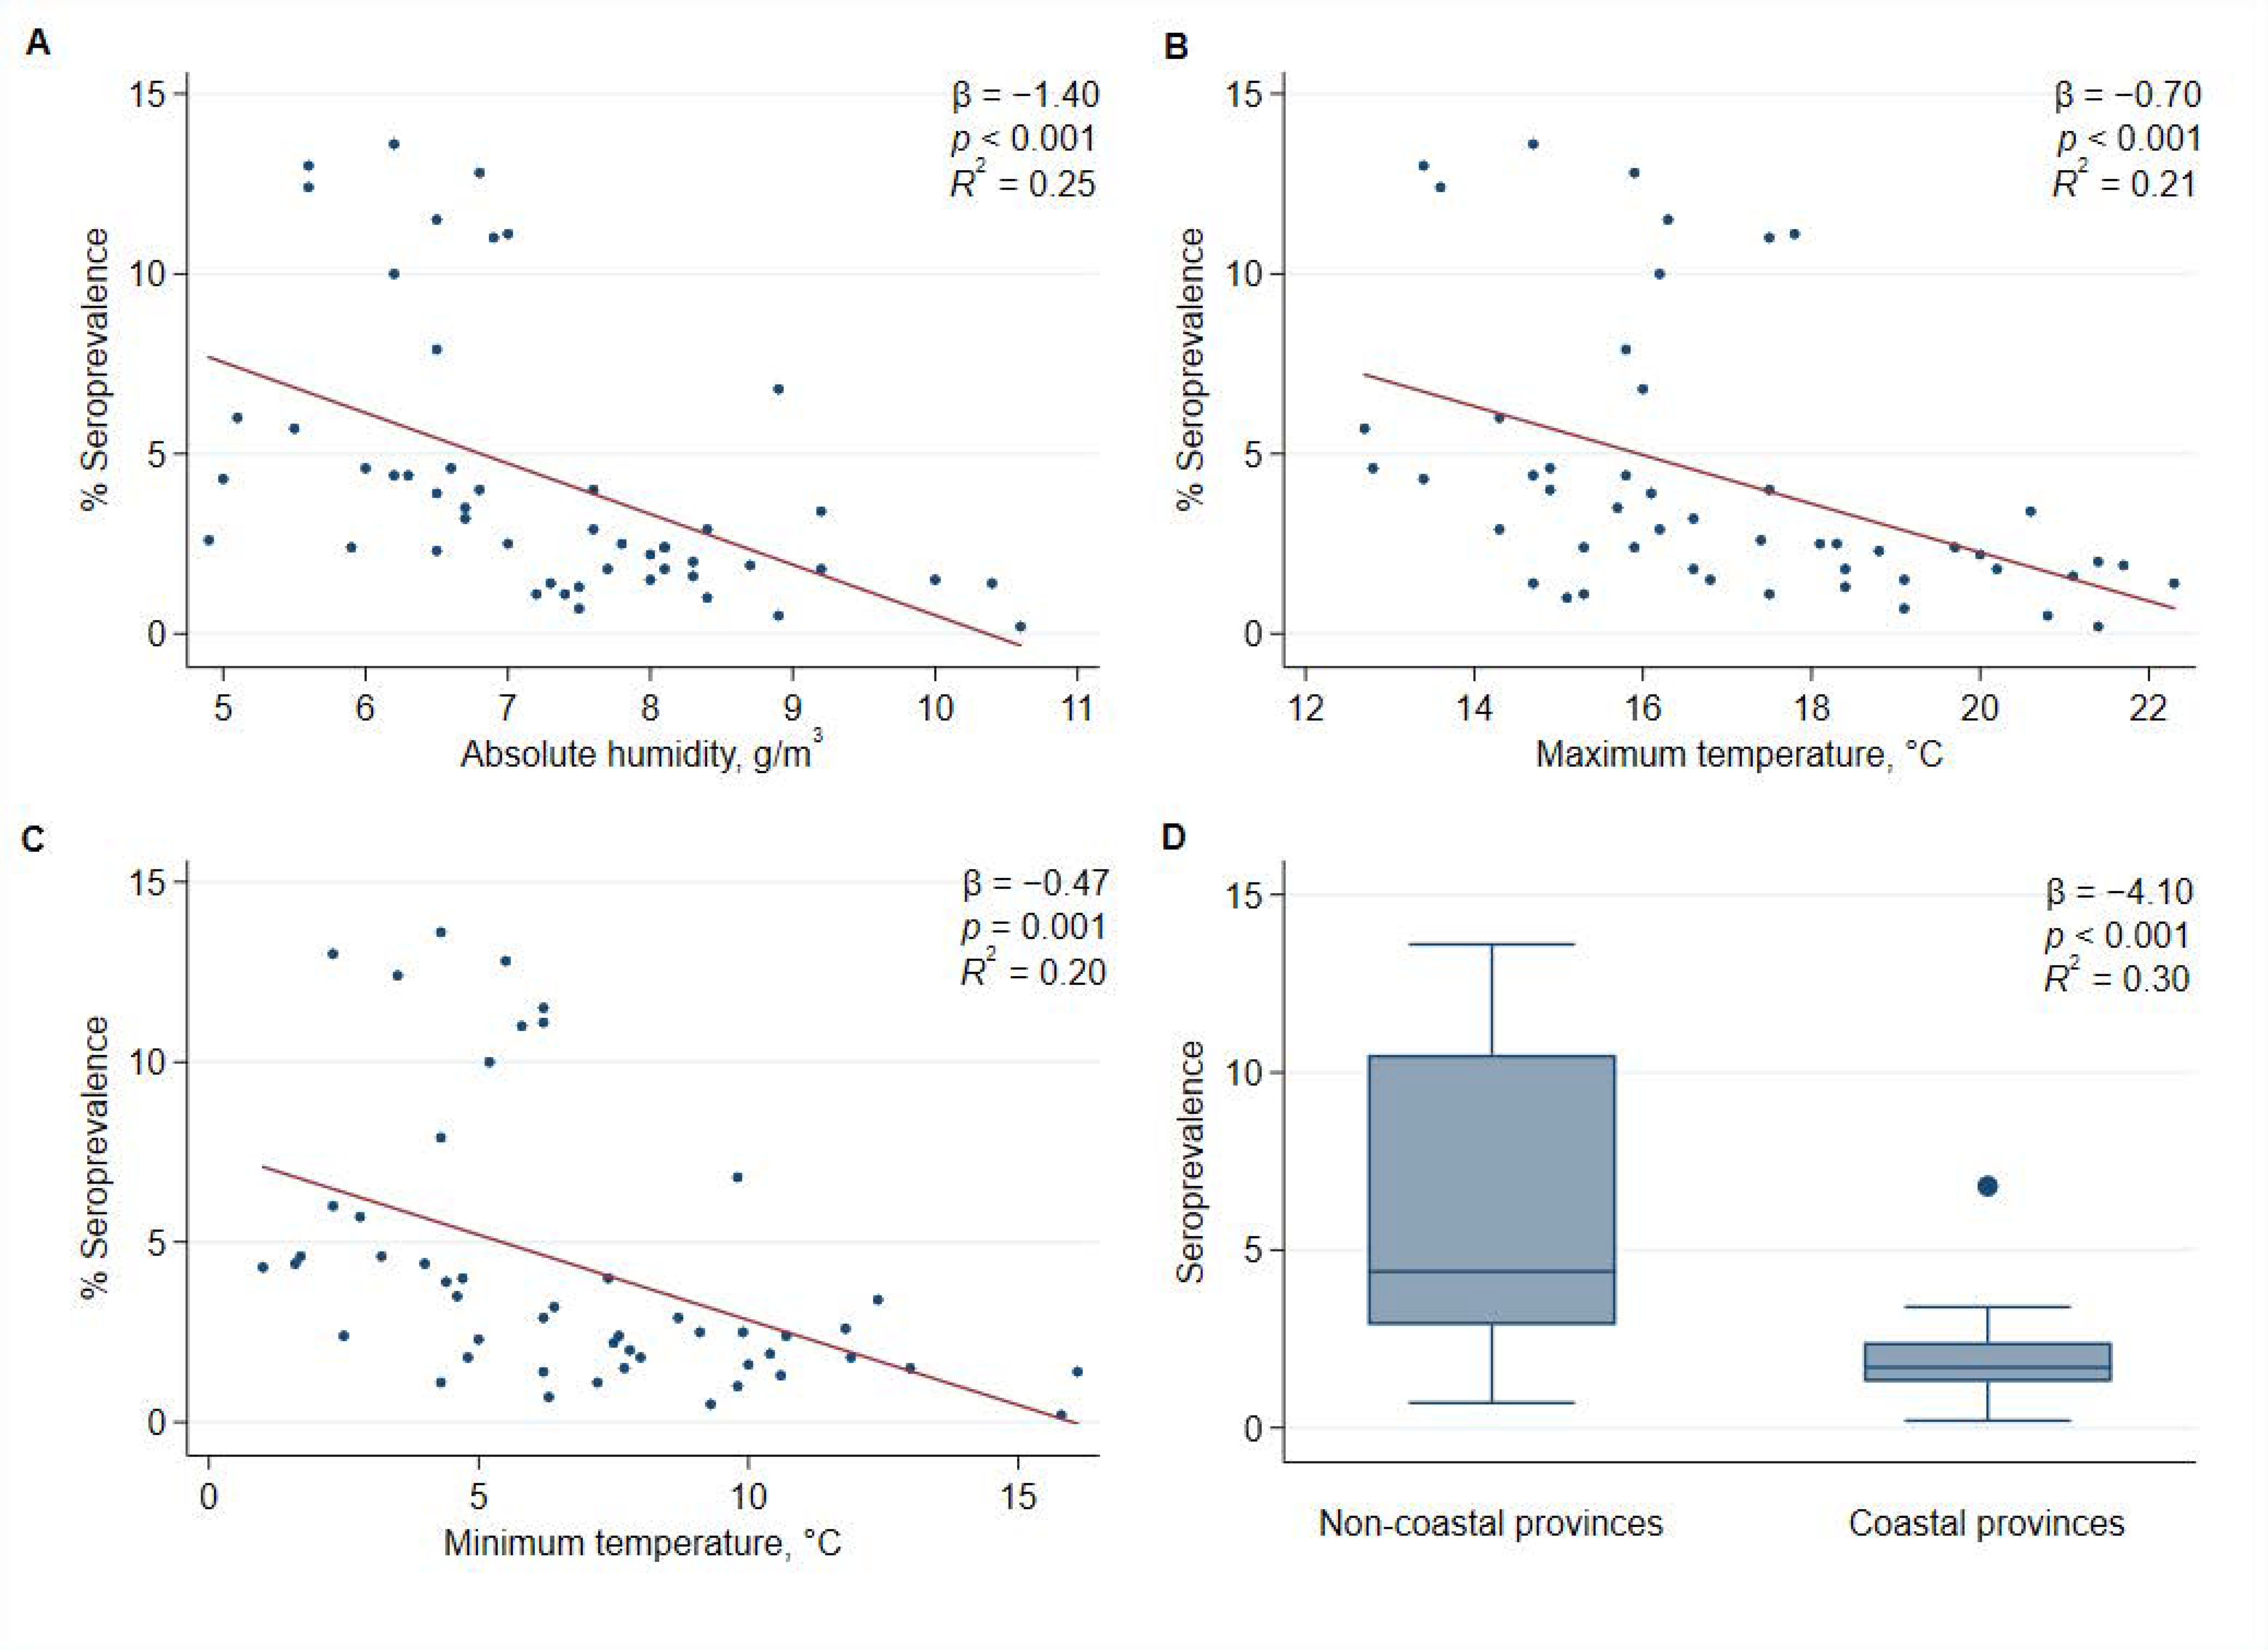
| Average absolute humidity (g/m3) * | −1.40 | 0.35 | <0.001 | 0.25 |
| Average of daily maximum temperatures, °C * | −0.70 | 0.19 | <0.001 | 0.21 |
| Average of daily minimum temperatures, °C * | −0.47 | 0.13 | 0.001 | 0.20 |
| Average of daily mean temperature, °C * | −0.55 | 0.16 | 0.001 | 0.19 |
| Province with coast | −4.10 | 0.90 | <0.001 | 0.30 |
| Density of population (inhabitants per km2) | −0.07 | 0.31 | 0.821 | 0.001 |
| Multivariable analyses | 0.55 | |||
| Intercept | 0.36 | 0.71 | 0.615 | |
| Altitude above sea level (per 100 m) * | 0.84 | 0.11 | <0.001 | |
| Density of population (inhabitants per km2) | 0.63 | 0.23 | 0.009 |
| Variables Analyzed | Provinces with Altitude >215 m (n = 25) | Provinces with Altitude <215 m (n = 25) | p-Value | ||
|---|---|---|---|---|---|
| Mean | SD | Mean | SD | ||
| Seroprevalence of SARS-CoV-2 IgG, % * | 6.5 | 4.1 | 2.1 | 1.3 | <0.001 |
| Latitude in degrees ** | 40.8 | 1.7 | 39.0 | 4.0 | 0.043 |
| Average absolute humidity (g/m3) ** | 6.4 | 0.7 | 8.3 | 1.2 | <0.001 |
| Average of daily maximum temperatures, °C ** | 15.5 | 1.7 | 18.6 | 2.3 | <0.001 |
| Average of daily minimum temperatures, °C ** | 4.3 | 1.9 | 9.6 | 2.8 | <0.001 |
| Average of daily mean temperatures, °C ** | 9.9 | 1.7 | 13.8 | 2.7 | <0.001 |
| Density of population (inhabitants per km2) | 69 | 163 | 194 | 164 | <0.001 |
Publisher’s Note: MDPI stays neutral with regard to jurisdictional claims in published maps and institutional affiliations. |
© 2021 by the authors. Licensee MDPI, Basel, Switzerland. This article is an open access article distributed under the terms and conditions of the Creative Commons Attribution (CC BY) license (http://creativecommons.org/licenses/by/4.0/).
Share and Cite
Castilla, J.; Fresán, U.; Trobajo-Sanmartín, C.; Guevara, M. Altitude and SARS-CoV-2 Infection in the First Pandemic Wave in Spain. Int. J. Environ. Res. Public Health 2021, 18, 2578. https://doi.org/10.3390/ijerph18052578
Castilla J, Fresán U, Trobajo-Sanmartín C, Guevara M. Altitude and SARS-CoV-2 Infection in the First Pandemic Wave in Spain. International Journal of Environmental Research and Public Health. 2021; 18(5):2578. https://doi.org/10.3390/ijerph18052578
Chicago/Turabian StyleCastilla, Jesús, Ujué Fresán, Camino Trobajo-Sanmartín, and Marcela Guevara. 2021. "Altitude and SARS-CoV-2 Infection in the First Pandemic Wave in Spain" International Journal of Environmental Research and Public Health 18, no. 5: 2578. https://doi.org/10.3390/ijerph18052578
APA StyleCastilla, J., Fresán, U., Trobajo-Sanmartín, C., & Guevara, M. (2021). Altitude and SARS-CoV-2 Infection in the First Pandemic Wave in Spain. International Journal of Environmental Research and Public Health, 18(5), 2578. https://doi.org/10.3390/ijerph18052578