
Mining Complex Genetic Patterns Conferring Multiple Sclerosis Risk


Abstract
1. Introduction
2. Materials and Methods
2.1. Association Rule Mining
2.2. Study Population and Genetic Data
2.3. Statistical Analyses
3. Results
4. Discussion
5. Conclusions
Supplementary Materials
Author Contributions
Funding
Institutional Review Board Statement
Informed Consent Statement
Data Availability Statement
Acknowledgments
Conflicts of Interest
References
- Buscarinu, M.C.; Fornasiero, A.; Ferraldeschi, M.; Romano, S.; Renie, R.; Morena, E.; Romano, C.; Pellicciari, G.; Landi, A.C.; Fagnani, C.; et al. Disentangling the molecular mechanisms of multiple sclerosis: The contribution of twin studies. Neurosci. Biobehav. Rev. 2020, 111, 194–198. [Google Scholar] [CrossRef]
- International Multiple Sclerosis Genetics Consortium. Multiple sclerosis genomic map implicates peripheral immune cells and microglia in susceptibility. Science 2019, 365, eaav7188. [Google Scholar] [CrossRef]
- Mitrovič, M.; Patsopoulos, N.A.; Beecham, A.H.; Dankowski, T.; Goris, A.; Dubois, B.; D’hooghe, M.B.; Lemmens, R.; Van Damme, P.; Søndergaard, H.B.; et al. Low-Frequency and Rare-Coding Variation Contributes to Multiple Sclerosis Risk. Cell 2018, 175, 1679–1687.e7. [Google Scholar] [CrossRef] [PubMed]
- Briggs, F. Unraveling susceptibility to multiple sclerosis. Science 2019, 365, 1383–1384. [Google Scholar] [CrossRef] [PubMed]
- Briggs, F.B.; Acuna, B.; Shen, L.; Ramsay, P.; Quach, H.; Bernstein, A.; Bellesis, K.H.; Kockum, I.S.; Hedstrom, A.K.; Alfredsson, L.; et al. Smoking and risk of multiple sclerosis: Evidence of modification by NAT1 variants. Epidemiology 2014, 25, 605–614. [Google Scholar] [CrossRef] [PubMed]
- Hedstrom, A.K.; Bomfim, I.L.; Barcellos, L.F.; Briggs, F.; Schaefer, C.; Kockum, I.; Olsson, T.; Alfredsson, L. Interaction between passive smoking and two HLA genes with regard to multiple sclerosis risk. Int. J. Epidemiol. 2014, 43, 1791–1798. [Google Scholar] [CrossRef] [PubMed]
- Hedstrom, A.K.; Lima Bomfim, I.; Barcellos, L.; Gianfrancesco, M.; Schaefer, C.; Kockum, I.; Olsson, T.; Alfredsson, L. Interaction between adolescent obesity and HLA risk genes in the etiology of multiple sclerosis. Neurology 2014, 82, 865–872. [Google Scholar] [CrossRef] [PubMed]
- Moutsianas, L.; Jostins, L.; Beecham, A.H.; Dilthey, A.T.; Xifara, D.K.; Ban, M.; Shah, T.S.; Patsopoulos, N.A.; Alfredsson, L.; Anderson, C.A.; et al. Class II HLA interactions modulate genetic risk for multiple sclerosis. Nat. Genet. 2015, 47, 1107–1113. [Google Scholar]
- Galarza-Munoz, G.; Briggs, F.B.S.; Evsyukova, I.; Schott-Lerner, G.; Kennedy, E.M.; Nyanhete, T.; Wang, L.; Bergamaschi, L.; Widen, S.G.; Tomaras, G.D.; et al. Human Epistatic Interaction Controls IL7R Splicing and Increases Multiple Sclerosis Risk. Cell 2017, 169, 72–84.e13. [Google Scholar] [CrossRef] [PubMed]
- Hedstrom, A.K.; Katsoulis, M.; Hossjer, O.; Bomfim, I.L.; Oturai, A.; Sondergaard, H.B.; Sellebjerg, F.; Ullum, H.; Thorner, L.W.; Gustavsen, M.W.; et al. The interaction between smoking and HLA genes in multiple sclerosis: Replication and refinement. Eur. J. Epidemiol. 2017, 32, 909–919. [Google Scholar] [CrossRef] [PubMed]
- Briggs, F.B. Nicotinic acetylcholine receptors alpha7 and alpha9 modifies tobacco smoke risk for multiple sclerosis. Mult. Scler. 2020. [Google Scholar] [CrossRef]
- Niel, C.; Sinoquet, C.; Dina, C.; Rocheleau, G. A survey about methods dedicated to epistasis detection. Front. Genet. 2015, 6, 285. [Google Scholar] [CrossRef] [PubMed]
- Uppu, S.; Krishna, A.; Gopalan, R.P. A Review on Methods for Detecting SNP Interactions in High-Dimensional Genomic Data. IEEE/ACM Trans. Comput. Biol. Bioinform. 2018, 15, 599–612. [Google Scholar] [CrossRef]
- Sawcer, S.; Hellenthal, G.; Pirinen, M.; Spencer, C.C.; Patsopoulos, N.A.; Moutsianas, L.; Dilthey, A.; Su, Z.; Freeman, C.; Hunt, S.E.; et al. Genetic risk and a primary role for cell-mediated immune mechanisms in multiple sclerosis. Nature 2011, 476, 214–219. [Google Scholar] [PubMed]
- Briggs, F.B.; Leung, L.J.; Barcellos, L.F. Annotation of functional variation within non-MHC MS susceptibility loci through bioinformatics analysis. Genes Immun. 2014, 15, 466–476. [Google Scholar] [CrossRef] [PubMed]
- International Multiple Sclerosis Genetics Consortium. A systems biology approach uncovers cell-specific gene regulatory effects of genetic associations in multiple sclerosis. Nat. Commun. 2019, 10, 2236. [Google Scholar] [CrossRef]
- VanderWeele, T.J. The Interaction Continuum. Epidemiology 2019, 30, 648–658. [Google Scholar] [CrossRef] [PubMed]
- Brassat, D.; Motsinger, A.A.; Caillier, S.J.; Erlich, H.A.; Walker, K.; Steiner, L.L.; Cree, B.A.; Barcellos, L.F.; Pericak-Vance, M.A.; Schmidt, S.; et al. Multifactor dimensionality reduction reveals gene-gene interactions associated with multiple sclerosis susceptibility in African Americans. Genes Immun. 2006, 7, 310–315. [Google Scholar] [CrossRef] [PubMed]
- Motsinger, A.A.; Brassat, D.; Caillier, S.J.; Erlich, H.A.; Walker, K.; Steiner, L.L.; Barcellos, L.F.; Pericak-Vance, M.A.; Schmidt, S.; Gregory, S.; et al. Complex gene-gene interactions in multiple sclerosis: A multifactorial approach reveals associations with inflammatory genes. Neurogenetics 2007, 8, 11–20. [Google Scholar] [CrossRef] [PubMed]
- Briggs, F.B.; Bartlett, S.E.; Goldstein, B.A.; Wang, J.; McCauley, J.L.; Zuvich, R.L.; De Jager, P.L.; Rioux, J.D.; Ivinson, A.J.; Compston, A.; et al. Evidence for CRHR1 in multiple sclerosis using supervised machine learning and meta-analysis in 12,566 individuals. Hum. Mol. Genet. 2010, 19, 4286–4295. [Google Scholar] [CrossRef] [PubMed]
- Briggs, F.B.; Goldstein, B.A.; McCauley, J.L.; Zuvich, R.L.; De Jager, P.L.; Rioux, J.D.; Ivinson, A.J.; Compston, A.; Hafler, D.A.; Hauser, S.L.; et al. Variation within DNA repair pathway genes and risk of multiple sclerosis. Am. J. Epidemiol. 2010, 172, 217–224. [Google Scholar] [CrossRef]
- Agrawal, R.; Imieliński, T.; Swami, A. Mining association rules between sets of items in large databases. In Proceedings of the 1993 ACM SIGMOD International Conference on Management of Data, Washington, DC, USA, 26–28 May 1993; Association for Computing Machinery: Washington, DC, USA, 1993; pp. 207–216. [Google Scholar]
- Agrawal, R.; Srikant, R. Fast Algorithms for Mining Association Rules in Large Databases. In Proceedings of the 20th International Conference on Very Large Data Bases, Santiago de Chile, Chile, 12–15 September 1994; Morgan Kaufmann Publishers Inc.: Burlington, MA, USA, 1994; pp. 487–499. [Google Scholar]
- Borgelt, C. Efficient Implementations of Apriori and Eclat. In Proceedings of the Workshop of Frequent Item Set Mining Implementations (FIMI 2003), Melbourne, FL, USA, 19 November 2003. [Google Scholar]
- Koroukian, S.M.; Schiltz, N.K.; Warner, D.F.; Sun, J.; Stange, K.C.; Given, C.W.; Dor, A. Multimorbidity: Constellations of conditions across subgroups of midlife and older individuals, and related Medicare expenditures. J. Comorb. 2017, 7, 33–43. [Google Scholar] [CrossRef]
- Bush, W.S.; Thornton-Wells, T.A.; Ritchie, M.D. Association Rule Discovery Has the Ability to Model Complex Genetic Effects. IEEE Symp. Comput. Intell. Data Min. 2007, 2007, 624–629. [Google Scholar] [PubMed]
- Brin, S.; Motwani, R.; Ullman, J.D.; Tsur, S. Dynamic itemset counting and implication rules for market basket data. In Proceedings of the 1997 ACM SIGMOD International Conference on Management of Data, Tucson, AZ, USA, 13–15 May 1997; Association for Computing Machinery: Tucson, AZ, USA, 1997; pp. 255–264. [Google Scholar]
- Saroufim, P.; Zweig, S.A.; Conway, D.S.; Briggs, F.B.S. Cardiovascular conditions in persons with multiple sclerosis, neuromyelitis optica and transverse myelitis. Mult. Scler. Relat. Disord. 2018, 25, 21–25. [Google Scholar] [CrossRef] [PubMed]
- Polman, C.H.; Reingold, S.C.; Banwell, B.; Clanet, M.; Cohen, J.A.; Filippi, M.; Fujihara, K.; Havrdova, E.; Hutchinson, M.; Kappos, L.; et al. Diagnostic criteria for multiple sclerosis: 2010 revisions to the McDonald criteria. Ann. Neurol. 2011, 69, 292–302. [Google Scholar] [CrossRef] [PubMed]
- Polman, C.H.; Reingold, S.C.; Edan, G.; Filippi, M.; Hartung, H.P.; Kappos, L.; Lublin, F.D.; Metz, L.M.; McFarland, H.F.; O’Connor, P.W.; et al. Diagnostic criteria for multiple sclerosis: 2005 revisions to the “McDonald Criteria”. Ann. Neurol. 2005, 58, 840–846. [Google Scholar] [CrossRef]
- Wang, F.M.; Davis, M.F.; Briggs, F.B. Predicting self-reported depression after the onset of multiple sclerosis using genetic and non-genetic factors. Mult. Scler. 2020. [Google Scholar] [CrossRef] [PubMed]
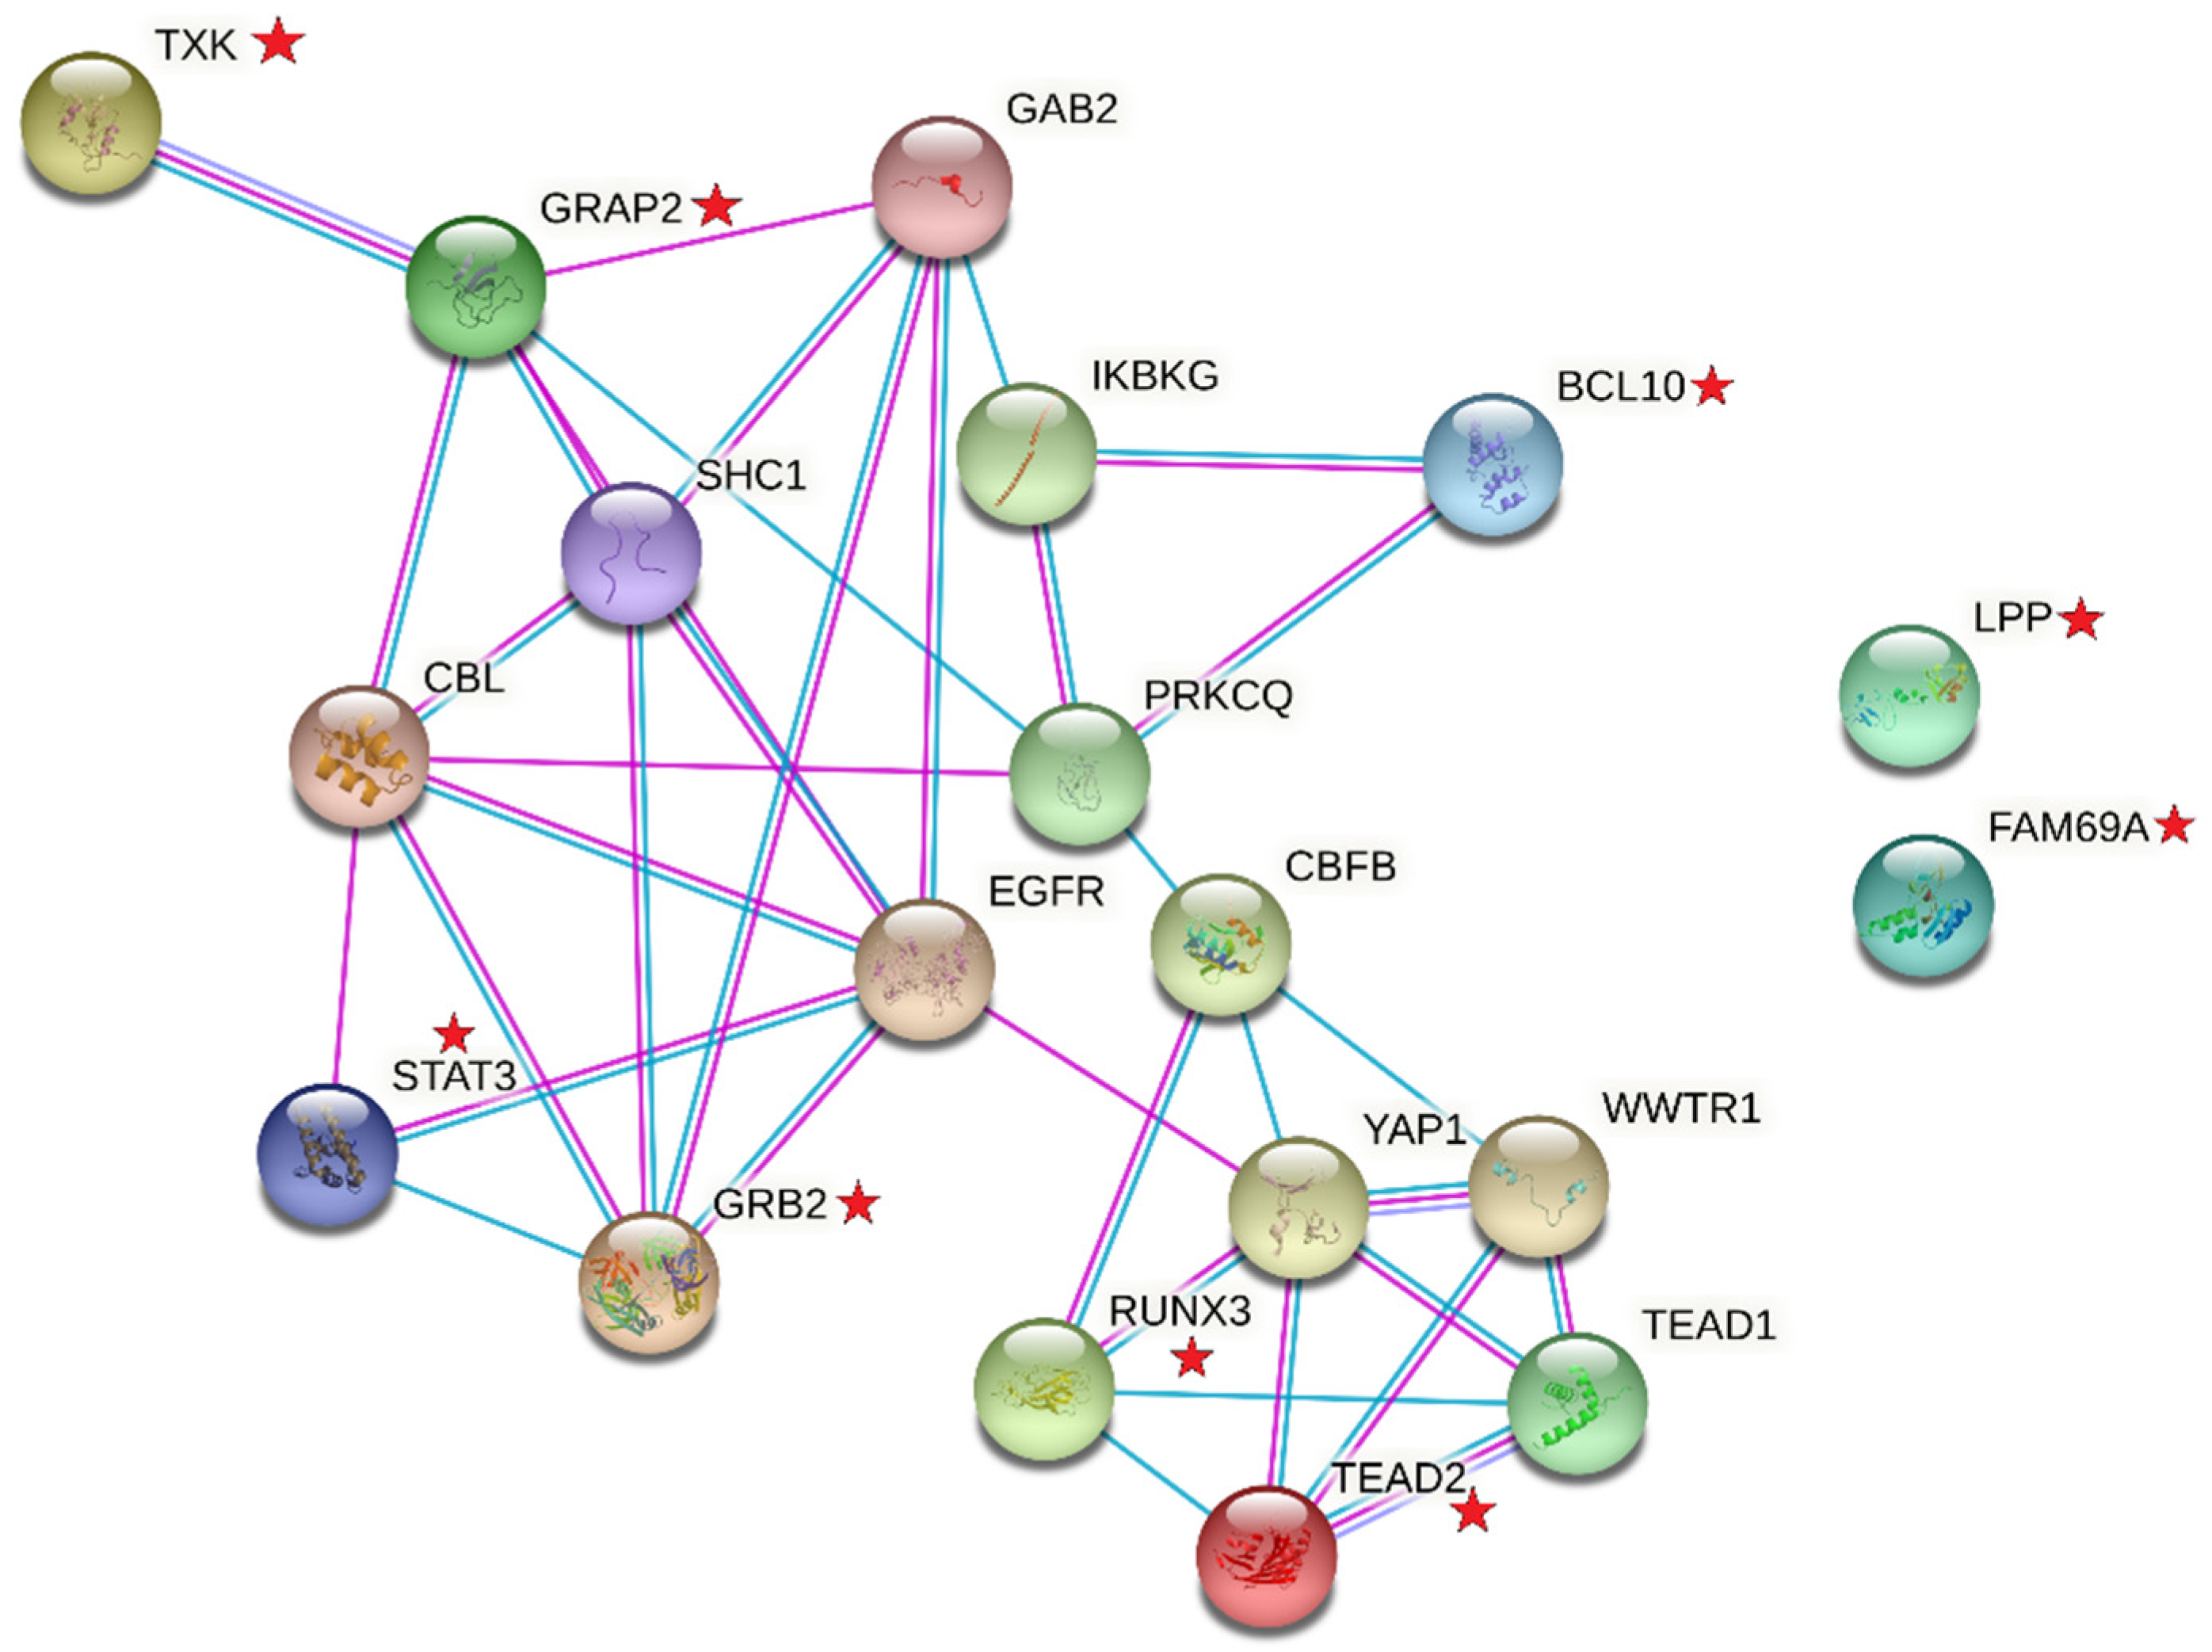
- Szklarczyk, D.; Gable, A.L.; Lyon, D.; Junge, A.; Wyder, S.; Huerta-Cepas, J.; Simonovic, M.; Doncheva, N.T.; Morris, J.H.; Bork, P.; et al. STRING v11: Protein-protein association networks with increased coverage, supporting functional discovery in genome-wide experimental datasets. Nucleic. Acids. Res. 2019, 47, D607–D613. [Google Scholar] [CrossRef] [PubMed]
- Zhang, T.; Ma, J.; Cao, X. Grb2 regulates Stat3 activation negatively in epidermal growth factor signalling. Biochem. J. 2003, 376 Pt 2, 457–464. [Google Scholar] [CrossRef]
- Kimura, T.; Kambe, T. The Functions of Metallothionein and ZIP and ZnT Transporters: An Overview and Perspective. Int. J. Mol. Sci. 2016, 17, 336. [Google Scholar] [CrossRef] [PubMed]
- Bredholt, M.; Frederiksen, J.L. Zinc in Multiple Sclerosis: A Systematic Review and Meta-Analysis. SAGE J. 2016. [Google Scholar] [CrossRef] [PubMed]
- Choi, B.Y.; Jung, J.W.; Suh, S.W. The Emerging Role of Zinc in the Pathogenesis of Multiple Sclerosis. Int. J. Mol. Sci. 2017, 18, 2070. [Google Scholar] [CrossRef]
- Dierichs, L.; Kloubert, V.; Rink, L. Cellular zinc homeostasis modulates polarization of THP-1-derived macrophages. Eur. J. Nutr. 2018, 57, 2161–2169. [Google Scholar] [CrossRef] [PubMed]
- Li, H.; Zhao, Y.; Guo, Y.; Li, Z.; Eisele, L.; Mourad, W. Zinc induces dimerization of the class II major histocompatibility complex molecule that leads to cooperative binding to a superantigen. J. Biol. Chem. 2007, 282, 5991–6000. [Google Scholar] [CrossRef] [PubMed]
- Hoppmann, N.; Graetz, C.; Paterka, M.; Poisa-Beiro, L.; Larochelle, C.; Hasan, M.; Lill, C.M.; Zipp, F.; Siffrin, V. New candidates for CD4 T cell pathogenicity in experimental neuroinflammation and multiple sclerosis. Brain 2015, 138 Pt 4, 902–917. [Google Scholar] [CrossRef]
- Oegema, R.; Baillat, D.; Schot, R.; van Unen, L.M.; Brooks, A.; Kia, S.K.; Hoogeboom, A.J.M.; Xia, Z.; Li, W.; Cesaroni, M.; et al. Human mutations in integrator complex subunits link transcriptome integrity to brain development. PLoS Genet. 2017, 13, e1006809. [Google Scholar] [CrossRef] [PubMed]
- Zhang, Y.; Koe, C.T.; Tan, Y.S.; Ho, J.; Tan, P.; Yu, F.; Sung, W.K.; Wang, H. The Integrator Complex Prevents Dedifferentiation of Intermediate Neural Progenitors back into Neural Stem Cells. Cell Rep. 2019, 27, 987–996.e3. [Google Scholar] [CrossRef]
- Wullaert, A.; Verstrepen, L.; Van Huffel, S.; Adib-Conquy, M.; Cornelis, S.; Kreike, M.; Haegman, M.; El Bakkouri, K.; Sanders, M.; Verhelst, K.; et al. LIND/ABIN-3 is a novel lipopolysaccharide-inducible inhibitor of NF-kappaB activation. J. Biol. Chem. 2007, 282, 81–90. [Google Scholar] [CrossRef]
- Rothhammer, V.; Borucki, D.M.; Tjon, E.C.; Takenaka, M.C.; Chao, C.C.; Ardura-Fabregat, A.; de Lima, K.A.; Gutierrez-Vazquez, C.; Hewson, P.; Staszewski, O.; et al. Microglial control of astrocytes in response to microbial metabolites. Nature 2018, 557, 724–728. [Google Scholar] [CrossRef]
- Park, J.; Min, J.S.; Kim, B.; Chae, U.B.; Yun, J.W.; Choi, M.S.; Kong, I.K.; Chang, K.T.; Lee, D.S. Mitochondrial ROS govern the LPS-induced pro-inflammatory response in microglia cells by regulating MAPK and NF-kappaB pathways. Neurosci. Lett. 2015, 584, 191–196. [Google Scholar] [CrossRef] [PubMed]
- Agapito, G.; Guzzi, P.H.; Cannataro, M. An efficient and scalable SPARK preprocessing methodology for Genome Wide Association Studies. In Proceedings of the 2020 28th Euromicro International Conference on Parallel, Distributed and Network-Based Processing (PDP), Västerås, Sweden, 11–13 March 2020; pp. 369–375. [Google Scholar]
- Montanez, C.A.C.; Fergus, P.; Chalmers, C.; Malim, N.H.A.H.; Abdulaimma, B.; Reilly, D.; Falciani, F. SAERMA: Stacked Autoencoder Rule Mining Algorithm for the Interpretation of Epistatic Interactions in GWAS for Extreme Obesity. IEEE Access 2020, 8, 112379–112392. [Google Scholar] [CrossRef]
- Nguyen, T.; Le, L. Detection of SNP-SNP Interactions in Genome-wide Association Data Using Random Forests and Association Rules. In Proceedings of the 2018 12th International Conference on Software, Knowledge, Information Management & Applications (SKIMA), Phnom Penh, Cambodia, 3–5 December 2018; pp. 1–7. [Google Scholar]


| Genetic Rule | Support | Confidence | Odds Ratio (95% CI) | p Value 1 | Frequency in Controls (n = 179) | Frequency in MS Cases (n = 207) | Genes |
|---|---|---|---|---|---|---|---|
| HLA-DRB1*15:0 rs56678847 rs6880809 | 0.052 | 0.95 | 20.24 (8.48, 37.46) | 4.4 × 10⁻⁹ | 0.6% | 9.7% | HLA-DRB1 SLC30A7 AC093277.1 |
| HLA-DRB1*15:01 rs56678847 rs12434551 | 0.065 | 0.89 | 8.50 (3.20, 31.65) | 4.1 × 10⁻⁴ | 1.7% | 12.1% | HLA-DRB1 SLC30A7 ZFP36L1 |
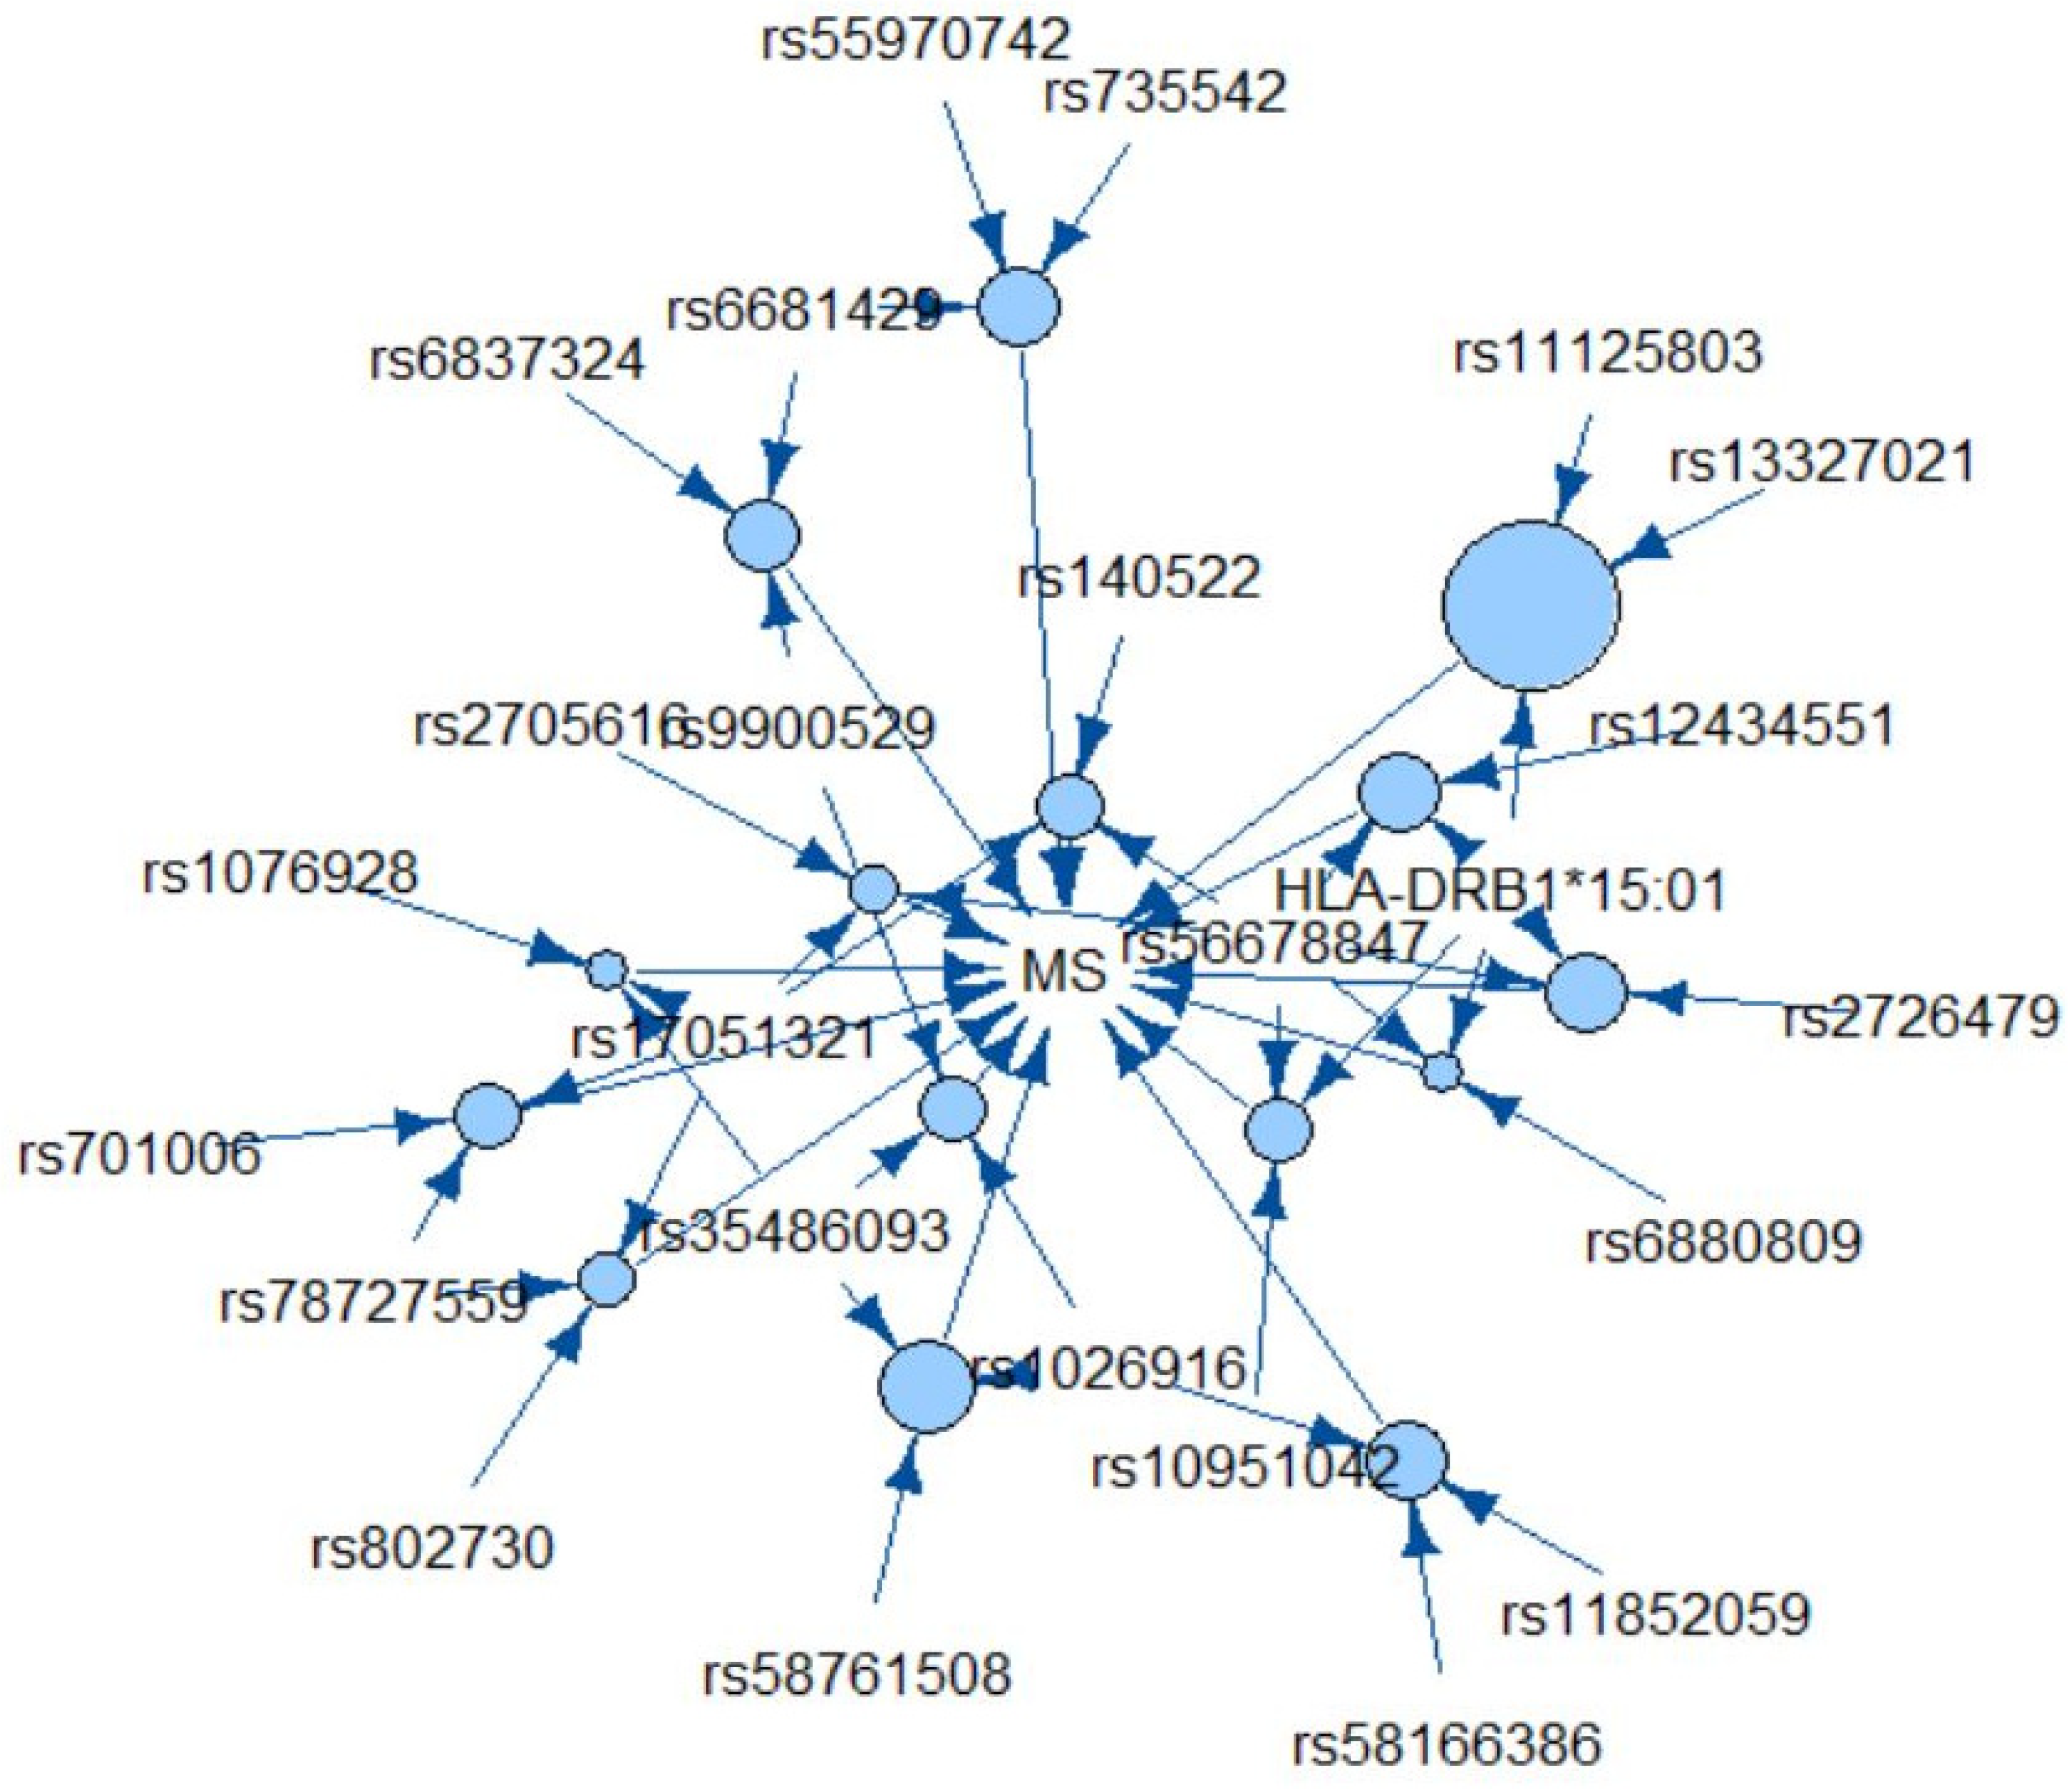
| rs6681429 rs6837324 rs9900529 | 0.062 | 0.89 | 7.71 (2.64, 28.12) | 9.6 × 10⁻⁴ | 1.7% | 11.6% | FAM69A TXK GRB2 |
| HLA-DRB1*15:01 rs56678847 rs10951042 | 0.060 | 0.88 | 7.64 (2.85, 28.05) | 6.9 × 10⁻⁴ | 1.7% | 11.1% | HLA-DRB1 SLC30A7 LOC105375130 |
| rs35486093 rs1026916 rs9900529 | 0.060 | 0.88 | 7.15 (2.60, 26.95) | 0.0014 | 1.7% | 11.1% | BCL10 STAT3 GRB2 |
| rs56678847 rs17051321 rs140522 | 0.060 | 0.88 | 7.61 (2.62, 28.49) | 0.0014 | 1.7% | 11.1% | SLC30A7 TNIP3 ODF3B |
| rs56678847 rs2705616 rs17051321 | 0.054 | 0.88 | 6.88 (2.38, 27.08) | 0.0026 | 1.7% | 10.1% | SLC30A7 AFF1 TNIP3 |
| Genetic Rule | Support | Confidence | Odds Ratio (95% CI) | p Value 1 | Frequency in Controls (n = 179) | Frequency in MS Cases (n = 207) | Genes |
|---|---|---|---|---|---|---|---|
| HLA-DRB1*15:01 rs56678847 rs6880809 | 0.052 | 0.95 | 20.24 (8.48, 37.46) | 4.4 × 10⁻⁹ | 0.6% | 9.7% | HLA-DRB1 SLC30A7 AC093277.1 |
| HLA-DRB1*15:01 rs11125803 rs13327021 | 0.096 | 0.86 | 6.76 (3.13, 20.88) | 1.1 × 10⁻⁴ | 3.4% | 17.9% | HLA-DRB1 ADCY3 - |
| HLA-DRB1*15:01 rs13327021 rs735542 | 0.104 | 0.82 | 4.85 (2.36, 11.97) | 1.7 × 10⁻⁴ | 5.0% | 19.3% | HLA-DRB1 - LOC105375752 |
| HLA-DRB1*15:01 rs56678847 rs12434551 | 0.065 | 0.89 | 8.50 (3.20, 31.65) | 4.1 × 10⁻⁴ | 1.7% | 12.1% | HLA-DRB1 SLC30A7 ZFP36L1 |
| SNP | Chr | Base Pair (hg19) | Gene | Count (%) | Count in Top 15 Rules Ranked by Confidence (%) |
|---|---|---|---|---|---|
| rs78727559 | 8 | 95,851,818 | INTS8 | 37 (32.5%) | 1 (6.7%) |
| rs17051321 | 4 | 122,119,449 | TNIP3 | 36 (31.6%) | 5 (33.3%) |
| HLA-DRB1*15:01 | 6 | 32,489,683 | HLA-DRB1 | 25 (21.9%) | 5 (33.3%) |
| rs56678847 | 1 | 101,422,963 | SLC30A7 | 25 (21.9%) | 6 (40.0%) |
| rs35486093 | 1 | 85,729,820 | BCL10 | 24 (21.1%) | 4 (26.7%) |
| rs1026916 | 17 | 40,529,835 | STAT3 | 12 (10.5%) | 3 (2.0%) |
| rs11852059 | 14 | 52,306,091 | GNG2 | 11 (9.6%) | 1 (6.7%) |
| rs735542 | 8 | 128,175,696 | LOC105375752 | 11 (9.6%) | 1 (6.7%) |
| rs58166386 | 19 | 16,559,421 | EPS15L1 | 7 (6.1%) | 1 (6.7%) |
| rs9900529 | 17 | 73,335,776 | GRB2 | 7 (6.1%) | 2 (13.3%) |
Publisher’s Note: MDPI stays neutral with regard to jurisdictional claims in published maps and institutional affiliations. |
© 2021 by the authors. Licensee MDPI, Basel, Switzerland. This article is an open access article distributed under the terms and conditions of the Creative Commons Attribution (CC BY) license (http://creativecommons.org/licenses/by/4.0/).
Share and Cite
Briggs, F.B.S.; Sept, C. Mining Complex Genetic Patterns Conferring Multiple Sclerosis Risk. Int. J. Environ. Res. Public Health 2021, 18, 2518. https://doi.org/10.3390/ijerph18052518
Briggs FBS, Sept C. Mining Complex Genetic Patterns Conferring Multiple Sclerosis Risk. International Journal of Environmental Research and Public Health. 2021; 18(5):2518. https://doi.org/10.3390/ijerph18052518
Chicago/Turabian StyleBriggs, Farren B. S., and Corriene Sept. 2021. "Mining Complex Genetic Patterns Conferring Multiple Sclerosis Risk" International Journal of Environmental Research and Public Health 18, no. 5: 2518. https://doi.org/10.3390/ijerph18052518
APA StyleBriggs, F. B. S., & Sept, C. (2021). Mining Complex Genetic Patterns Conferring Multiple Sclerosis Risk. International Journal of Environmental Research and Public Health, 18(5), 2518. https://doi.org/10.3390/ijerph18052518