
The Association of White Blood Cells and Air Pollutants—A Population-Based Study

 , ,
, , 
Abstract
:1. Introduction
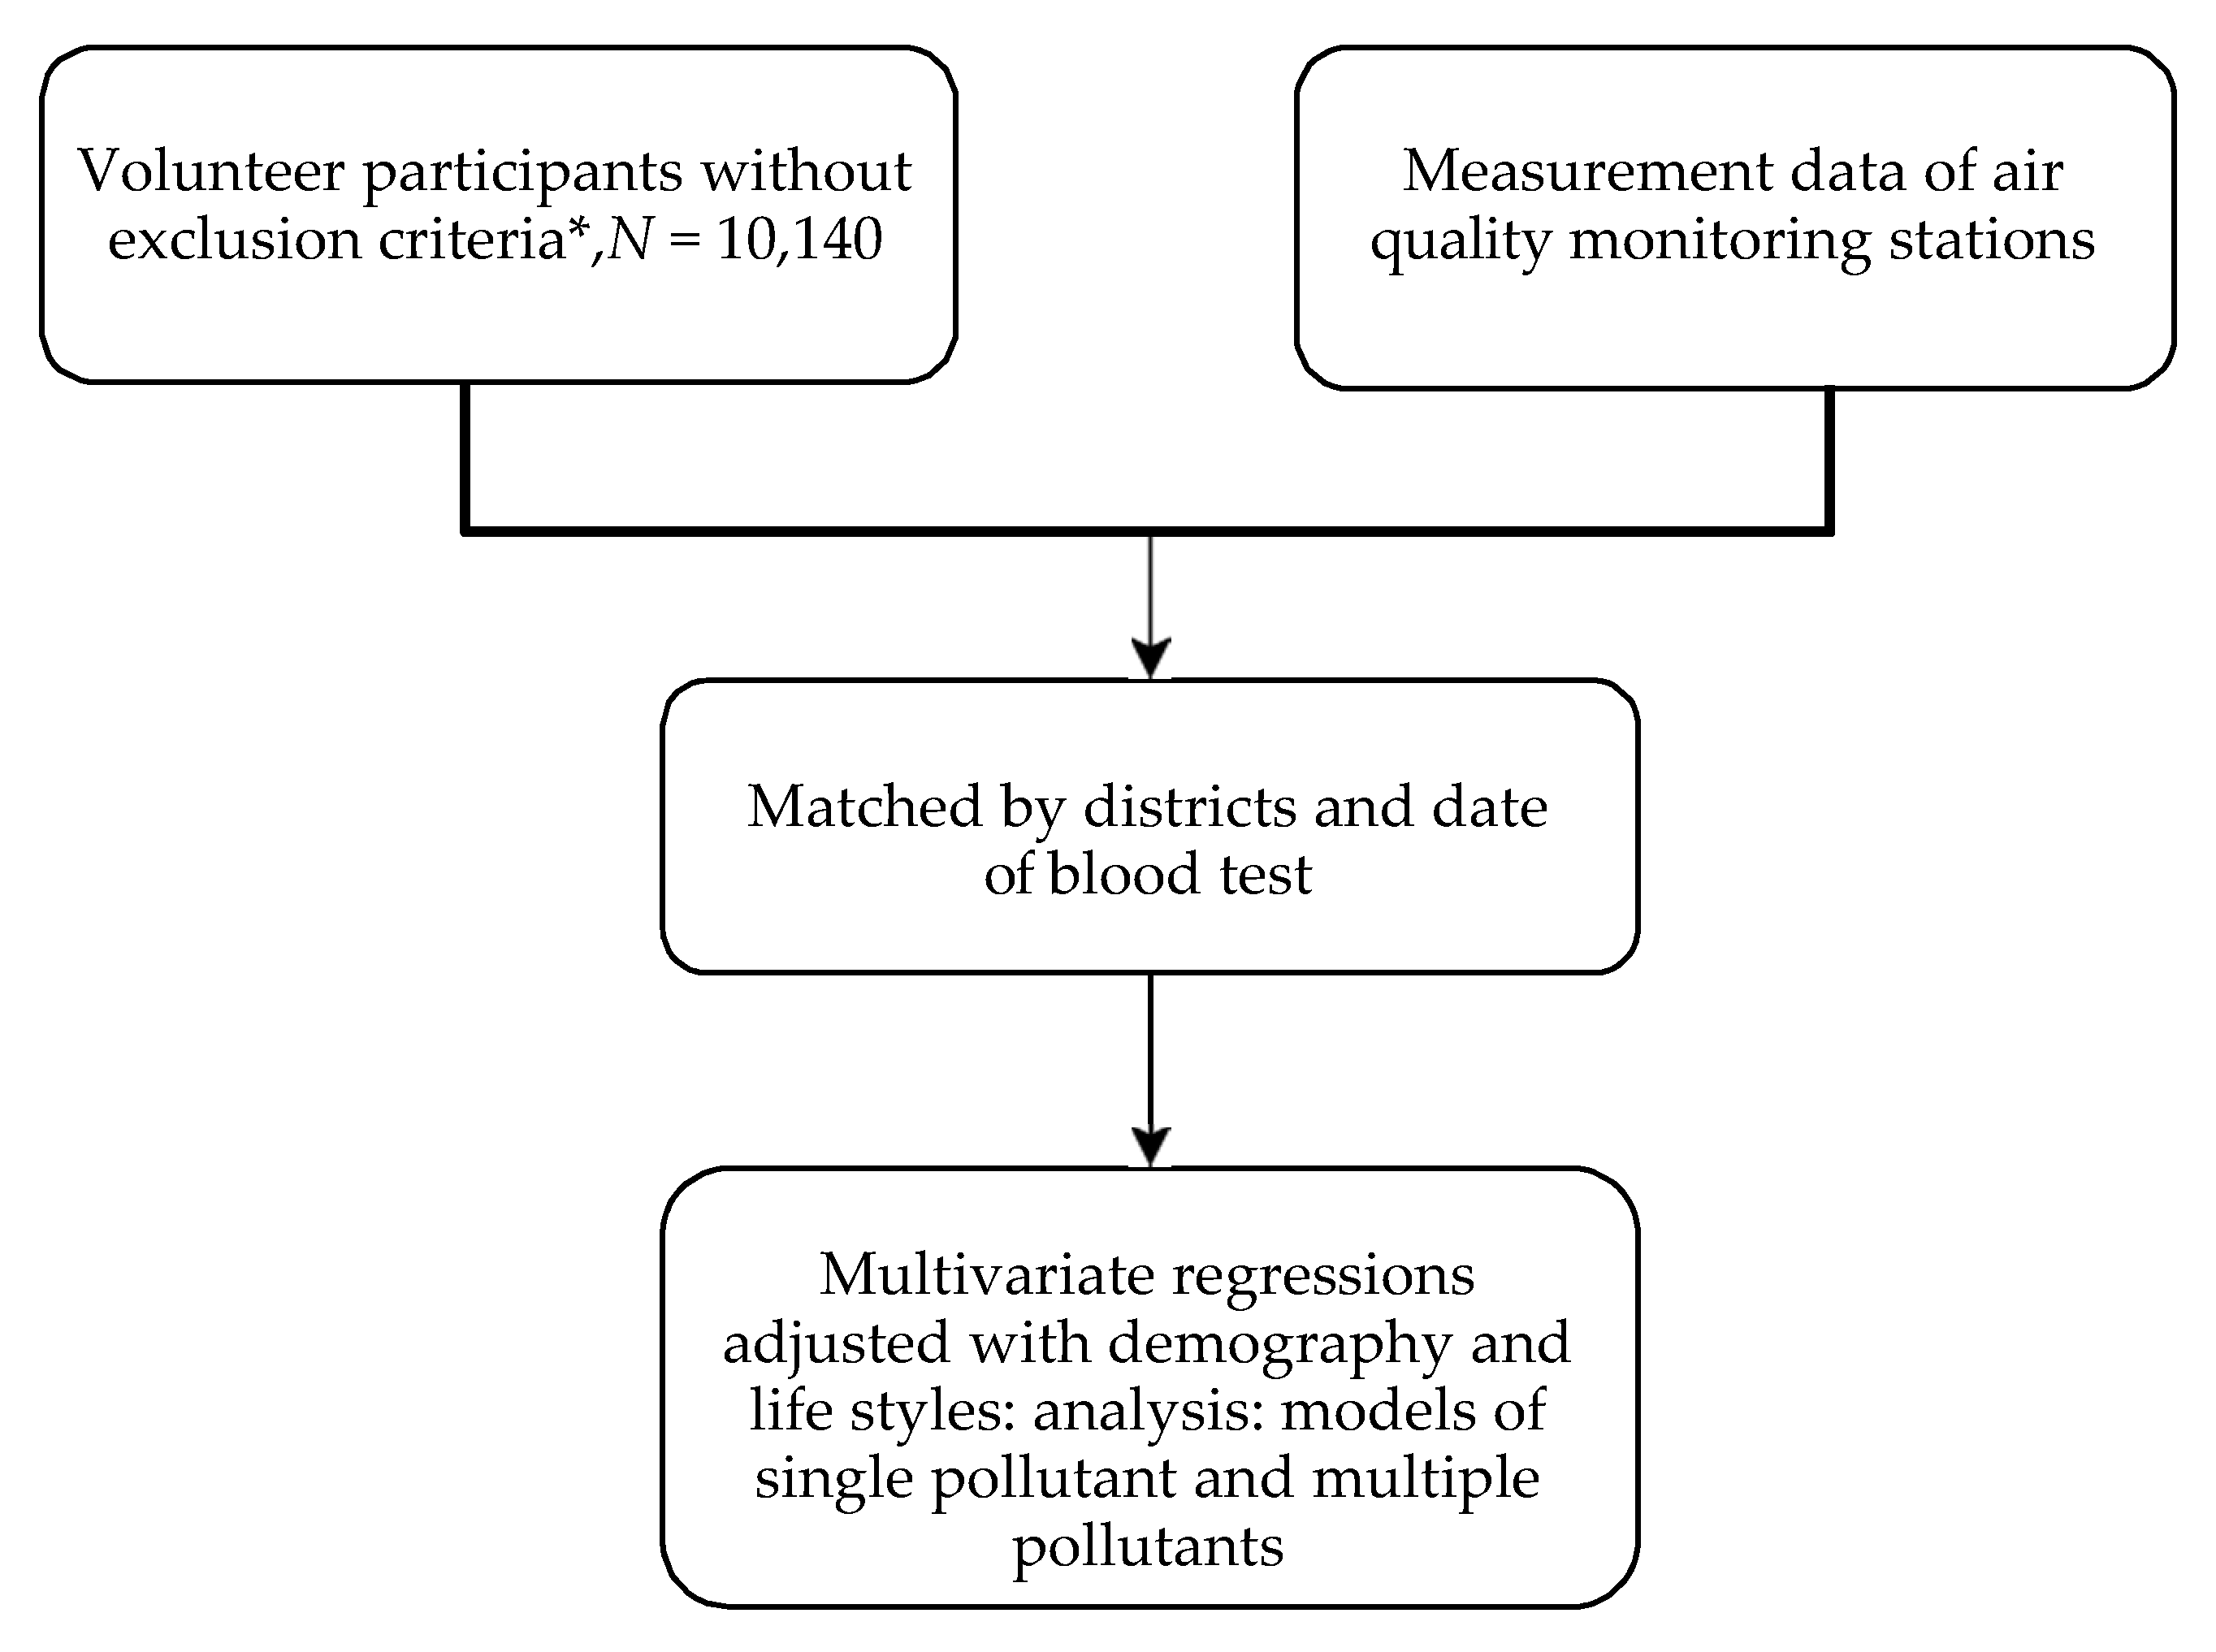
2. Materials and Methods
- [single pollutant model]Y= β0 + β1(age) + β2(gender) + β3(BMI) + β4(cigarette smoking) + β5(alcohol consumption) + β6(betel quid use) + β7(individual pollutant);Y: WBC counts; the individual pollutant: SO2, NO2, CO, O3, PM10
- [multiple pollutants model]Y= β0 + β1(age) + β2(gender) + β3(BMI) + β4(cigarette smoking) + β5(alcohol consumption) + β6(betel quid use) + β7(SO2) + β8(NO2) + β9(CO) + β10(O3) + β11(PM10);Y: WBC counts
3. Results
4. Discussion
5. Conclusions
Author Contributions
Funding
Institutional Review Board Statement
Informed Consent Statement
Acknowledgments
Conflicts of Interest
References
- WHO. 7 Million Premature Deaths Annually Linked to Air Pollution. Available online: http://www.who.int/mediacentre/news/releases/2014/air-pollution/en/ (accessed on 28 February 2021).
- GBD 2016 Disease and Injury Incidence and Prevalence Collaborators. Global, regional, and national incidence, prevalence, and years lived with disability for 328 diseases and injuries for 195 countries, 1990–2016: A systematic analysis for the Global Burden of Disease Study 2016. Lancet 2017, 390, 1211–1259. [Google Scholar] [CrossRef] [Green Version]
- Loomis, D.; Grosse, Y.; Lauby-Secretan, B.; El Ghissassi, F.; Bouvard, V.; Benbrahim-Tallaa, L.; Guha, N.; Baan, R.; Mattock, H.; Straif, K. The carcinogenicity of outdoor air pollution. Lancet Oncol. 2013, 14, 1262–1263. [Google Scholar] [CrossRef]
- Liu, C.; Chen, R.; Sera, F.; Vicedo-Cabrera, A.M.; Guo, Y.; Tong, S.; Coelho, M.S.Z.S.; Saldiva, P.H.N.; Lavigne, E.; Matus, P.; et al. Ambient Particulate Air Pollution and Daily Mortality in 652 Cities. N. Engl. J. Med. 2019, 381, 705–715. [Google Scholar] [CrossRef] [PubMed]
- Wyatt, L.H.; Xi, Y.; Kshirsagar, A.; Di, Q.; Ward-Caviness, C.; Wade, T.J.; Cascio, W.E.; Rappold, A.G. Association of short-term exposure to ambient PM with hospital admissions and 30-day readmissions in end-stage renal disease patients: Population-based retrospective cohort study. BMJ Open 2020, 10, e041177. [Google Scholar] [CrossRef]
- Bae, S.; Kwon, H.J. Current State of Research on the Risk of Morbidity and Mortality Associated with Air Pollution in Korea. Yonsei Med. J. 2019, 60, 243–256. [Google Scholar] [CrossRef] [PubMed]
- Guan, W.-J.; Zheng, X.-Y.; Chung, K.F.; Zhong, N.-S. Impact of air pollution on the burden of chronic respiratory diseases in China: Time for urgent action. Lancet 2016, 388, 1939–1951. [Google Scholar] [CrossRef]
- He, M.Z.; Kinney, P.L.; Li, T.; Chen, C.; Sun, Q.; Ban, J.; Wang, J.; Liu, S.; Goldsmith, J.; Kioumourtzoglou, M.A. Short- and intermediate-term exposure to NO2 and mortality: A multi-county analysis in China. Environ. Pollut. 2020, 261, 114165. [Google Scholar] [CrossRef] [PubMed]
- Hayes, R.B.; Lim, C.; Zhang, Y.; Cromar, K.; Shao, Y.; Reynolds, H.R.; Silverman, D.T.; Jones, R.R.; Park, Y.; Jerrett, M.; et al. PM2.5 air pollution and cause-specific cardiovascular disease mortality. Int. J. Epidemiol. 2020, 49, 25–35. [Google Scholar] [CrossRef] [PubMed]
- Bourdrel, T.; Bind, M.-A.; Béjot, Y.; Morel, O.; Argacha, J.-F. Cardiovascular effects of air pollution. Arch. Cardiovasc. Dis. 2017, 110, 634–642. [Google Scholar] [CrossRef]
- Doiron, D.; de Hoogh, K.; Probst-Hensch, N.; Fortier, I.; Cai, Y.; De Matteis, S.; Hansell, A.L. Air pollution, lung function and COPD: Results from the population-based UK Biobank study. Eur. Respir. J. 2019, 54, 1802140. [Google Scholar] [CrossRef]
- Graber, M.; Mohr, S.; Baptiste, L.; Duloquin, G.; Blanc-Labarre, C.; Mariet, A.S.; Giroud, M.; Béjot, Y. Air pollution and stroke. A new modifiable risk factor is in the air. Rev. Neurol. 2019, 175, 619–624. [Google Scholar] [CrossRef]
- Kim, H.B.; Shim, J.Y.; Park, B.; Lee, Y.J. Long-Term Exposure to Air Pollutants and Cancer Mortality: A Meta-Analysis of Cohort Studies. Int. J. Environ. Res. Public Health 2018, 15, 2608. [Google Scholar] [CrossRef] [Green Version]
- Wong, S.F.; Yap, P.S.; Mak, J.W.; Chan, W.L.E.; Khor, G.L.; Ambu, S.; Chu, W.L.; Mohamad, M.S.; Ibrahim Wong, N.; Ab Majid, N.L.; et al. Association between long-term exposure to ambient air pollution and prevalence of diabetes mellitus among Malaysian adults. Environ. Health A Glob. Access Sci. Source 2020, 19, 37. [Google Scholar] [CrossRef] [Green Version]
- Yang, W.T.; Wang, V.S.; Chang, L.T.; Chuang, K.J.; Chuang, H.C.; Liu, C.S.; Bao, B.Y.; Chang, T.Y. Road Traffic Noise, Air Pollutants, and the Prevalence of Cardiovascular Disease in Taichung, Taiwan. Int. J. Environ. Res. Public Health 2018, 15, 1707. [Google Scholar] [CrossRef] [PubMed] [Green Version]
- Holliday, K.M.; Lamichhane, A.P.; Gondalia, R.; Stewart, J.D.; Madrigano, J.; Shih, R.A.; Yanosky, J.D.; Liao, D.; Wellenius, G.A.; Whitsel, E.A. Air pollution-associated changes in biomarkers of diabetes risk. Environ. Epidemiol. 2019, 3, e059. [Google Scholar] [CrossRef]
- Arias-Perez, R.D.; Taborda, N.A.; Gomez, D.M.; Narvaez, J.F.; Porras, J.; Hernandez, J.C. Inflammatory effects of particulate matter air pollution. Environ. Sci. Pollut. Res. Int. 2020, 27, 42390–42404. [Google Scholar] [CrossRef]
- Uren, N.; Yuksel, S.; Onal, Y. Genotoxic effects of sulfur dioxide in human lymphocytes. Toxicol. Ind. Health 2014, 30, 311–315. [Google Scholar] [CrossRef] [PubMed]
- Valavanidis, A.; Fiotakis, K.; Vlachogianni, T. Airborne particulate matter and human health: Toxicological assessment and importance of size and composition of particles for oxidative damage and carcinogenic mechanisms. J. Environ. Sci. Health C Environ. Carcinog. Ecotoxicol. Rev. 2008, 26, 339–362. [Google Scholar] [CrossRef] [PubMed]
- Veranth, J.M.; Moss, T.A.; Chow, J.C.; Labban, R.; Nichols, W.K.; Walton, J.C.; Watson, J.G.; Yost, G.S. Correlation of in vitro cytokine responses with the chemical composition of soil-derived particulate matter. Environ. Health Perspect. 2006, 114, 341–349. [Google Scholar] [CrossRef] [Green Version]
- Wooding, D.J.; Ryu, M.H.; Li, H.; Alexis, N.E.; Pena, O.; Carlsten, C.; Canadian Respiratory Research, N. Acute air pollution exposure alters neutrophils in never-smokers and at-risk humans. Eur. Respir. J. 2020, 55, 1901495. [Google Scholar] [CrossRef] [PubMed]
- Feng, S.; Gao, D.; Liao, F.; Zhou, F.; Wang, X. The health effects of ambient PM2.5 and potential mechanisms. Ecotoxicol. Environ. Saf. 2016, 128, 67–74. [Google Scholar] [CrossRef] [PubMed]
- Pope, C.A.; Bhatnagar, A.; McCracken, J.P.; Abplanalp, W.; Conklin, D.J.; O’Toole, T. Exposure to Fine Particulate Air Pollution is Associated with Endothelial Injury and Systemic Inflammation. Circ. Res. 2016, 119, 1204–1214. [Google Scholar] [CrossRef] [PubMed] [Green Version]
- Gondalia, R.; Holliday, K.M.; Baldassari, A.; Justice, A.E.; Stewart, J.D.; Liao, D.; Yanosky, J.D.; Engel, S.M.; Jordahl, K.M.; Bhatti, P.; et al. Leukocyte Traits and Exposure to Ambient Particulate Matter Air Pollution in the Women’s Health Initiative and Atherosclerosis Risk in Communities Study. Environ. Health Perspect. 2020, 128, 17004. [Google Scholar] [CrossRef] [PubMed]
- Hahad, O.; Lelieveld, J.; Birklein, F.; Lieb, K.; Daiber, A.; Munzel, T. Ambient Air Pollution Increases the Risk of Cerebrovascular and Neuropsychiatric Disorders through Induction of Inflammation and Oxidative Stress. Int. J. Mol. Sci. 2020, 21, 4306. [Google Scholar] [CrossRef]
- Xing, Y.F.; Xu, Y.H.; Shi, M.H.; Lian, Y.X. The impact of PM2.5 on the human respiratory system. J. Thorac. Dis. 2016, 8, E69–E74. [Google Scholar] [CrossRef] [PubMed]
- Miller, M.R.; Shaw, C.A.; Langrish, J.P. From particles to patients: Oxidative stress and the cardiovascular effects of air pollution. Future Cardiol. 2012, 8, 577–602. [Google Scholar] [CrossRef] [Green Version]
- Ni, L.; Chuang, C.-C.; Zuo, L. Fine particulate matter in acute exacerbation of COPD. Front. Physiol. 2015, 6, 294. [Google Scholar] [CrossRef] [Green Version]
- Glencross, D.A.; Ho, T.R.; Camina, N.; Hawrylowicz, C.M.; Pfeffer, P.E. Air pollution and its effects on the immune system. Free Radic. Biol. Med. 2020, 151, 56–68. [Google Scholar] [CrossRef]
- Tang, H.; Cheng, Z.; Li, N.; Mao, S.; Ma, R.; He, H.; Niu, Z.; Chen, X.; Xiang, H. The short- and long-term associations of particulate matter with inflammation and blood coagulation markers: A meta-analysis. Environ. Pollut. 2020, 267, 115630. [Google Scholar] [CrossRef]
- Tan, W.C.; Qiu, D.; Liam, B.L.; Ng, T.P.; Lee, S.H.; van Eeden, S.F.; D′Yachkova, Y.; Hogg, J.C. The human bone marrow response to acute air pollution caused by forest fires. Am. J. Respir. Crit. Care Med. 2000, 161, 1213–1217. [Google Scholar] [CrossRef]
- Steenhof, M.; Janssen, N.A.; Strak, M.; Hoek, G.; Gosens, I.; Mudway, I.S.; Kelly, F.J.; Harrison, R.M.; Pieters, R.H.; Cassee, F.R.; et al. Air pollution exposure affects circulating white blood cell counts in healthy subjects: The role of particle composition, oxidative potential and gaseous pollutants—The RAPTES project. Inhal. Toxicol. 2014, 26, 141–165. [Google Scholar] [CrossRef] [PubMed]
- Stiegel, M.A.; Pleil, J.D.; Sobus, J.R.; Madden, M.C. Inflammatory Cytokines and White Blood Cell Counts Response to Environmental Levels of Diesel Exhaust and Ozone Inhalation Exposures. PLoS ONE 2016, 11, e0152458. [Google Scholar] [CrossRef] [Green Version]
- Schwartz, J. Air pollution and blood markers of cardiovascular risk. Environ. Health Perspect. 2001, 109, 405–409. [Google Scholar] [CrossRef] [PubMed] [Green Version]
- Ruckerl, R.; Phipps, R.P.; Schneider, A.; Frampton, M.; Cyrys, J.; Oberdorster, G.; Wichmann, H.E.; Peters, A. Ultrafine particles and platelet activation in patients with coronary heart disease—Results from a prospective panel study. Part. Fibre Toxicol. 2007, 4, 1. [Google Scholar] [CrossRef] [PubMed] [Green Version]
- Poursafa, P.; Kelishadi, R.; Amini, A.; Amini, A.; Amin, M.M.; Lahijanzadeh, M.; Modaresi, M. Association of air pollution and hematologic parameters in children and adolescents. J. Pediatr. 2011, 87, 350–356. [Google Scholar] [CrossRef] [PubMed] [Green Version]
- Jacobs, L.; Nawrot, T.S.; de Geus, B.; Meeusen, R.; Degraeuwe, B.; Bernard, A.; Sughis, M.; Nemery, B.; Panis, L.I. Subclinical responses in healthy cyclists briefly exposed to traffic-related air pollution: An intervention study. Environ. Health 2010, 9, 64. [Google Scholar] [CrossRef] [Green Version]
- Zuurbier, M.; Hoek, G.; Oldenwening, M.; Meliefste, K.; Krop, E.; van den Hazel, P.; Brunekreef, B. In-traffic air pollution exposure and CC16, blood coagulation, and inflammation markers in healthy adults. Environ. Health Perspect. 2011, 119, 1384–1389. [Google Scholar] [CrossRef] [Green Version]
- Rich, D.Q.; Kipen, H.M.; Huang, W.; Wang, G.; Wang, Y.; Zhu, P.; Ohman-Strickland, P.; Hu, M.; Philipp, C.; Diehl, S.R.; et al. Association between changes in air pollution levels during the Beijing Olympics and biomarkers of inflammation and thrombosis in healthy young adults. JAMA 2012, 307, 2068–2078. [Google Scholar] [CrossRef]
- Chen, H.; Goldberg, M.S.; Villeneuve, P.J. A systematic review of the relation between long-term exposure to ambient air pollution and chronic diseases. Rev. Environ. Health 2008, 23, 243–297. [Google Scholar] [CrossRef]
- Cheng, F.-J.; Lee, K.-H.; Lee, C.-W.; Hsu, P.-C. Association between Particulate Matter Air Pollution and Hospital Emergency Room Visits for Pneumonia with Septicemia: A Retrospective Analysis. Aerosol Air Qual. Res. 2019, 19, 345–354. [Google Scholar] [CrossRef]
- Liao, D.; Heiss, G.; Chinchilli, V.M.; Duan, Y.; Folsom, A.R.; Lin, H.M.; Salomaa, V. Association of criteria pollutants with plasma hemostatic/inflammatory markers: A population-based study. J. Expo. Anal. Environ. Epidemiol. 2005, 15, 319–328. [Google Scholar] [CrossRef]
- Bruske, I.; Hampel, R.; Socher, M.M.; Ruckerl, R.; Schneider, A.; Heinrich, J.; Oberdorster, G.; Wichmann, H.E.; Peters, A. Impact of ambient air pollution on the differential white blood cell count in patients with chronic pulmonary disease. Inhal. Toxicol. 2010, 22, 245–252. [Google Scholar] [CrossRef] [PubMed] [Green Version]
- Meng, Z.; Qin, G.; Zhang, B. DNA damage in mice treated with sulfur dioxide by inhalation. Environ. Mol. Mutagen. 2005, 46, 150–155. [Google Scholar] [CrossRef]
- Ziemann, C.; Hansen, T.; Pohlmann, G.; Farrar, D.; Pohlenz-Michel, C.; Tillmann, T.; Mangelsdorf, I. Genotoxicity testing of sulfur dioxide (SO2) in a mouse bone marrow micronucleus test complemented with hematological endpoints. Mutat. Res. 2010, 697, 38–46. [Google Scholar] [CrossRef]
- Dennekamp, M.; Akram, M.; Abramson, M.J.; Tonkin, A.; Sim, M.R.; Fridman, M.; Erbas, B. Outdoor air pollution as a trigger for out-of-hospital cardiac arrests. Epidemiology 2010, 21, 494–500. [Google Scholar] [CrossRef]
- Karabacak, M.; Turkdogan, K.A.; Coskun, A.; Akpinar, O.; Duman, A.; Kapci, M.; Eren, S.H.; Karabacak, P. Detection of neutrophil–lymphocyte ratio as a serum marker associated with inflammations by acute carbon monoxide poisoning. J. Acute Dis. 2015, 4, 305–308. [Google Scholar] [CrossRef] [Green Version]
- Siponen, T.; Yli-Tuomi, T.; Aurela, M.; Dufva, H.; Hillamo, R.; Hirvonen, M.R.; Huttunen, K.; Pekkanen, J.; Pennanen, A.; Salonen, I.; et al. Source-specific fine particulate air pollution and systemic inflammation in ischaemic heart disease patients. Occup. Environ. Med. 2015, 72, 277–283. [Google Scholar] [CrossRef] [PubMed]
- Frost-Pineda, K.; Liang, Q.; Liu, J.; Rimmer, L.; Jin, Y.; Feng, S.; Kapur, S.; Mendes, P.; Roethig, H.; Sarkar, M. Biomarkers of potential harm among adult smokers and nonsmokers in the total exposure study. Nicotine Tob. Res. 2011, 13, 182–193. [Google Scholar] [CrossRef]
- Sakaguchi, C.; Miura, N.; Ohara, H.; Nagata, Y. Effects of reduced exposure to cigarette smoking on changes in biomarkers of potential harm in adult smokers: Results of combined analysis of two clinical studies. Biomarkers 2019, 24, 457–468. [Google Scholar] [CrossRef] [PubMed]
- Warner, J.H.; Liang, Q.; Sarkar, M.; Mendes, P.E.; Roethig, H.J. Adaptive regression modeling of biomarkers of potential harm in a population of U.S. adult cigarette smokers and nonsmokers. BMC Med. Res. Methodol. 2010, 10, 19. [Google Scholar] [CrossRef] [Green Version]
- Autrup, H. Ambient Air Pollution and Adverse Health Effects. Procedia Soc. Behav. Sci. 2010, 2, 7333–7338. [Google Scholar] [CrossRef] [Green Version]
- Yang, D.; Yang, X.; Deng, F.; Guo, X. Ambient Air Pollution and Biomarkers of Health Effect. Adv. Exp. Med. Biol. 2017, 1017, 59–102. [Google Scholar] [CrossRef] [PubMed]
- Rumchev, K.; Soares, M.; Zhao, Y.; Reid, C.; Huxley, R. The Association between Indoor Air Quality and Adult Blood Pressure Levels in a High-Income Setting. Int. J. Environ. Res. Public Health 2018, 15, 2026. [Google Scholar] [CrossRef] [PubMed] [Green Version]

| Districts | Nanzih (n = 2466) | Hsiaokang (n = 2508) | Cijin (n = 335) | Cianjhen (n = 4831) | |||||
|---|---|---|---|---|---|---|---|---|---|
| Variables | |||||||||
| Age, year (mean ± SD) | 54.7 ± 5.5 | 54.2 ± 5.9 | 54.3 ± 7.3 | 54.1 ± 6.1 | |||||
| Gender, male | 1094 (44.4%) | 1146 (45.7%) | 166 (49.6%) | 1972 (40.8%) | |||||
| BMI, kg/m2 (mean ± SD) | 24.6 ± 4.0 | 24.6 ± 3.4 | 25.5 ± 3.8 | 24.8 ± 3.9 | |||||
| Education level | College/Graduate | 354 | (14.4%) | 221 | (8.8%) | 24 | (7.2%) | 732 | (15.2%) |
| High school | 984 | (39.9%) | 940 | (37.5%) | 107 | (31.9%) | 2019 | (41.8%) | |
| Elementary school | 837 | (33.9%) | 927 | (37.0%) | 126 | (37.6%) | 1532 | (31.7%) | |
| Illiteracy | 266 | (10.8%) | 405 | (16.2%) | 75 | (22.4%) | 512 | (10.6%) | |
| Cigarette smoking | current | 385 | (15.6%) | 461 | (18.4%) | 51 | (15.2%) | 612 | (12.7%) |
| former | 130 | (5.3%) | 63 | (2.5%) | 26 | (7.8%) | 303 | (6.3%) | |
| never | 1926 | (78.1%) | 1968 | (78.5%) | 250 | (74.6%) | 3780 | (78.2%) | |
| Alcohol consumption | yes | 383 | (15.5%) | 492 | (19.6%) | 41 | (12.2%) | 502 | (10.4%) |
| no | 2046 | (83.0%) | 1998 | (79.7%) | 290 | (86.6%) | 4265 | (88.3%) | |
| Betel quid use | yes | 137 | (5.6%) | 202 | (8.1%) | 18 | (5.4%) | 300 | (6.2%) |
| no | 2301 | (93.3%) | 2280 | (90.9%) | 314 | (93.7%) | 4481 | (92.8%) | |
| WBC count/μL, (mean ± SD) | total | 5915.8 ± 1458.0 | 5726.9 ± 1426.4 | 6290.3 ± 1538.9 | 5982.2 ± 5982.2 | ||||
| neutrophile | 3161.2 ± 1108.3 | 3092.7 ± 1081.7 | 3511.7 ± 1203.9 | 3327.4 ± 1148.4 | |||||
| lymphocyte | 2179.8 ± 633.2 | 2104.0 ± 591.6 | 2201.7 ± 615.8 | 2111.9 ± 621.1 | |||||
| monocyte | 381.0 ± 135.0 | 345.0 ± 125.1 | 381.2 ± 130.3 | 356.2 ± 124.8 | |||||
| eosinophile | 156.2 ± 135.8 | 153.8 ± 130.9 | 162.3 ± 123.3 | 148.2 ± 128.1 | |||||
| basophil | 32.5 ± 22.1 | 30.6 ± 20.5 | 33.5 ± 21.6 | 30.7 ± 20.8 | |||||
| Air pollutants (mean ± SD) | SO2 (ppb) | 6.2 ± 3.1 | 9.6 ± 5.1 | 11.6 ± 3 | 8.4 ± 1.9 | ||||
| NO2 (ppb) | 19.5 ± 4.4 | 18.8 ± 5.1 | 27.5 ± 15.6 | 31.3 ± 12.1 | |||||
| O3 (ppb) | 29.9 ± 10.3 | 24.5 ± 11.1 | 27.1 ± 7.1 | * | |||||
| CO (ppm) | 0.6 ± 0.1 | 0.6 ± 0.2 | 1.1 ± 0.4 | * | |||||
| PM10 (μg/m3) | 61 ± 18.3 | 49 ± 17.2 | 67.2 ± 23.8 | 87.7 ± 33.4 | |||||
| Pollutant | n | Min | Mean (SD) | Q1 | Q3 | Max |
|---|---|---|---|---|---|---|
| SO2 (ppb) | 9767 | 0.40 | 8.25 (3.61) | 5.51 | 10.25 | 44.00 |
| NO2 (ppb) | 9767 | 1.20 | 25.00 (11.11) | 16.21 | 35.61 | 115.60 |
| O3 (ppb) | 5286 | 5.00 | 27.17 (10.83) | 17.46 | 38.54 | 62.60 |
| CO (ppm) | 5286 | 0.23 | 0.61 (0.21) | 0.46 | 0.72 | 2.20 |
| PM10 (μg/m3) | 9664 | 10.92 | 70.22 (31.07) | 42.56 | 92.61 | 289.0 |
| Pollutants | White Blood Cells | Neutrophil Counts | Monocyte Counts | Eosinophil Counts | Basophil Counts | Lymphocyte Counts | ||||||
|---|---|---|---|---|---|---|---|---|---|---|---|---|
| β | (SE) | β | (SE) | β | (SE) | β | (SE) | β | (SE) | β | (SE) | |
| SO2 (ED) | 4.12 | (2.87) | 2.12 | (2.24) | 0.36 | (0.24) | 0.21 | (0.26) | −0.70 | (1.39) | 1.48 | (1.22) |
| SO2 (lag 1) | −3.98 | (2.64) | −0.18 | (2.06) | −1.21 | (0.22) ** | −0.22 | (0.24) | −0.47 | (1.28) | −2.40 | (1.12) |
| SO2 (lag 2) | −2.81 | (2.77) | −1.83 | (2.16) | −0.46 | (0.24) | −0.26 | (0.25) | 0.50 | (1.34) | −0.32 | (1.17) |
| SO2 (lag 3) | −1.25 | (2.71) | 1.65 | (2.12) | −1.26 | (0.23) ** | −0.61 | (0.25) * | 0.68 | (1.33) | −1.37 | (1.15) |
| SO2 (lag 4) | −3.33 | (2.74) | −1.54 | (2.15) | −1.18 | (0.23) ** | −0.84 | (0.25) ** | −1.14 | (1.34) | 0.38 | (1.16) |
| SO2 (lag 5) | −4.18 | (2.69) | −0.98 | (2.12) | −1.40 | (0.23) ** | −0.54 | (0.24) | −0.91 | (1.33) | −0.91 | (1.14) |
| SO2 (lag 6) | −6.87 | (2.60) ** | −2.99 | (2.04) | −1.38 | (0.22) ** | −0.48 | (0.23) | −0.44 | (1.29) | −1.46 | (1.10) |
| SO2 (lag 7) | −3.87 | (2.54) | −3.22 | (2.00) | −0.91 | (0.22) ** | −0.09 | (0.23) | −0.34 | (1.26) | 0.37 | (1.07) |
| a_SO2 | −6.36 | (4.07) | −1.59 | (3.19) | −2.18 | (0.35) ** | −0.83 | (0.37) * | −0.81 | (1.96) | −1.56 | (1.73) |
| NO2 (ED) | 7.72 | (1.14) ** | 5.15 | (0.89) ** | 0.43 | (0.10) ** | 0.20 | (0.10) | 0.47 | (0.56) | 2.01 | (0.48) ** |
| NO2 (lag 1) | 7.56 | (1.14) ** | 5.85 | (0.89) ** | 0.41 | (0.10) ** | 0.24 | (0.10) * | 0.50 | (0.55) | 1.12 | (0.48) * |
| NO2 (lag 2) | 8.67 | (1.22) ** | 6.46 | (0.96) ** | 0.42 | (0.10) ** | 0.12 | (0.11) | 0.98 | (0.60) | 1.71 | (0.52) ** |
| NO2 (lag 3) | 8.17 | (1.28) ** | 6.98 | (1.00) ** | 0.19 | (0.11) | 0.03 | (0.12) | 0.62 | (0.62) | 0.92 | (0.54) |
| NO2 (lag 4) | 9.96 | (1.20) ** | 7.34 | (0.94) ** | 0.48 | (0.10) ** | 0.09 | (0.11) | 0.92 | (0.58) | 2.17 | (0.51) ** |
| NO2 (lag 5) | 8.80 | (1.21) ** | 7.40 | (0.94) ** | 0.34 | (0.10) ** | 0.05 | (0.11) | 0.83 | (0.58) | 1.06 | (0.51) * |
| NO2 (lag 6) | 7.96 | (1.16) ** | 6.64 | (0.90) ** | 0.39 | (0.10) ** | 0.11 | (0.10) | 0.51 | (0.56) | 0.94 | (0.49) |
| NO2 (lag 7) | 7.61 | (1.14) ** | 6.07 | (0.89) ** | 0.43 | (0.10) ** | 0.05 | (0.10) | 0.46 | (0.56) | 1.12 | (0.48) * |
| a_NO2 | 11.00 | (1.33) ** | 8.45 | (1.04) * | 0.52 | (0.11) ** | 0.16 | (0.12) | 0.82 | (0.64) | 1.95 | (0.57) ** |
| O3 (ED) | 5.47 | (1.45) ** | 2.79 | (1.13) * | 0.52 | (0.13) ** | 0.33 | (0.13) * | 0.03 | (0.02) | 1.87 | (0.62) ** |
| O3 (lag 1) | 4.55 | (1.53) ** | 1.46 | (1.20) | 0.27 | (0.14) | 0.35 | (0.14) * | 0.00 | (0.02) | 2.61 | (0.66) ** |
| O3 (lag 2) | 5.18 | (1.48) ** | 2.56 | (1.15) * | 0.31 | (0.13) * | 0.33 | (0.14) * | 0.03 | (0.02) | 2.10 | (0.63) ** |
| O3 (lag 3) | 5.57 | (1.47) ** | 2.44 | (1.15) * | 0.62 | (0.13) ** | 0.46 | (0.14) ** | 0.04 | (0.02) | 2.12 | (0.63) ** |
| O3 (lag 4) | 5.00 | (1.38) ** | 2.37 | (1.08) * | 0.66 | (0.12) ** | 0.46 | (0.13) ** | 0.03 | (0.02) | 1.45 | (0.59) * |
| O3 (lag 5) | 6.22 | (1.37) ** | 3.18 | (1.07) ** | 0.85 | (0.12) ** | 0.45 | (0.13) ** | 0.06 | (0.02) ** | 1.72 | (0.59) ** |
| O3 (lag 6) | 4.97 | (1.42) ** | 2.71 | (1.11) * | 0.75 | (0.13) ** | 0.36 | (0.13) ** | 0.06 | (0.02) ** | 1.16 | (0.61) |
| O3 (lag 7) | 3.42 | (1.42) * | 2.78 | (1.11) * | 0.38 | (0.13) ** | 0.30 | (0.13) * | 0.06 | (0.02) ** | −0.03 | (0.61) |
| a_O3 | 8.08 | (1.82) ** | 4.04 | (1.42) ** | 0.89 | (0.16) ** | 0.61 | (0.17) ** | 0.06 | (0.03) * | 2.55 | (0.78) ** |
| CO (ED) | 337.07 | (77.93) ** | 240.27 | (60.71) ** | 13.13 | (6.91) | 16.12 | (7.21) * | 2.64 | (1.18) * | 70.50 | (33.34) * |
| CO (lag 1) | 362.17 | (77.34) ** | 289.18 | (60.25) ** | 11.07 | (6.87) | 10.45 | (7.18) | 2.27 | (1.17) | 57.05 | (33.05) |
| CO (lag 2) | 295.36 | (78.85) ** | 162.97 | (61.58) ** | 16.24 | (7.01) * | 12.95 | (7.12) | 2.04 | (1.17) | 107.69 | (33.74) ** |
| CO (lag 3) | 343.45 | (79.59) ** | 269.17 | (62.06) ** | 6.06 | (7.08) | 4.65 | (7.19) | 3.01 | (1.19) * | 66.02 | (34.13) |
| CO (lag 4) | 324.90 | (85.52) ** | 238.86 | (66.71) ** | 8.56 | (7.58) | 4.27 | (7.70) | 3.02 | (1.27) * | 79.92 | (36.71) * |
| CO (lag 5) | 242.71 | (87.89) ** | 210.08 | (68.43) ** | −0.66 | (7.79) | 11.59 | (8.13) | 3.22 | (1.33) * | 24.05 | (37.60) |
| CO (lag 6) | 266.09 | (84.07) ** | 275.30 | (65.49) ** | −8.49 | (7.45) | 10.27 | (7.78) | 2.88 | (1.27) * | −5.43 | (35.98) |
| CO (lag 7) | 264.40 | (84.40) ** | 219.94 | (65.89) ** | −1.89 | (7.48) | 7.92 | (7.81) | 2.50 | (1.28) | 41.44 | (36.12) |
| a_CO | 424.80 | (95.84) ** | 329.63 | (74.69) ** | 8.44 | (8.50) | 13.64 | (8.87) | 3.76 | (1.45) * | 78.56 | (41.04) |
| PM10 (ED) | 3.33 | (0.44) ** | 2.34 | (0.35) ** | 0.22 | (0.04) ** | 0.04 | (0.04) | 0.24 | (0.22) | 0.77 | (0.19) ** |
| PM10 (lag 1) | 3.30 | (0.44) ** | 2.59 | (0.34) ** | 0.13 | (0.04) ** | 0.03 | (0.04) | 0.30 | (0.22) | 0.59 | (0.19) ** |
| PM10 (lag 2) | 3.39 | (0.44) ** | 2.44 | (0.35) ** | 0.20 | (0.04) ** | 0.02 | (0.04) | 0.60 | (0.22) ** | 0.76 | (0.19) ** |
| PM10 (lag 3) | 3.34 | (0.43) ** | 2.43 | (0.33) ** | 0.19 | (0.04) ** | 0.05 | (0.04) | 0.37 | (0.21) | 0.66 | (0.18) ** |
| PM10 (lag 4) | 3.76 | (0.41) ** | 2.66 | (0.32) ** | 0.26 | (0.04) ** | 0.07 | (0.04) | 0.47 | (0.20) * | 0.75 | (0.18) ** |
| PM10 (lag 5) | 3.86 | (0.45) ** | 2.59 | (0.35) ** | 0.29 | (0.04) ** | 0.09 | (0.04) * | 0.13 | (0.22) | 0.89 | (0.19) ** |
| PM10 (lag 6) | 3.01 | (0.40) ** | 2.29 | (0.31) ** | 0.21 | (0.03) ** | 0.07 | (0.04) | 0.05 | (0.20) | 0.48 | (0.17) ** |
| PM10 (lag 7) | 2.95 | (0.44) ** | 2.40 | (0.34) ** | 0.14 | (0.04) ** | 0.04 | (0.04) | 0.37 | (0.22) | 0.41 | (0.19) ** |
| a_PM10 | 4.30 | (0.48) ** | 3.12 | (0.37) ** | 0.26 | (0.04) ** | 0.05 | (0.04) | 0.37 | (0.23) | 0.90 | (0.20) ** |
| Lag Days | White Blood Cells | Neutrophil Counts | Monocyte Counts | Eosinophil Counts | Basophil Counts | Lymphocyte Counts | ||||||||
|---|---|---|---|---|---|---|---|---|---|---|---|---|---|---|
| β | (SE) | β | (SE) | β | (SE) | β | (SE) | β | (SE) | β | (SE) | |||
| ED | SO2 | 0.6 | (4.7) | −3.2 | (3.6) | 1.1 | (0.4) | 0.3 | (0.4) | −0.1 | (0.1) | 2.4 | (2.0) | |
| NO2 | 1.4 | (3.8) | −0.7 | (3.0) | −0.1 | (0.3) | 1.1 | (0.4) * | 0.0 | (0.1) | 1.1 | (1.6) | ||
| O3 | 5.3 | (2.7) | 2.8 | (2.1) | 0.6 | (0.2) | 0.4 | (0.3) | 0.0 | (0.0) | 1.4 | (1.2) | ||
| CO | 288.4 | (161.9) | 378.0 | (125.7) * | −17.7 | (14.4) | −18.2 | (15.1) | 2.4 | (2.4) | −51.7 | (69.1) | ||
| PM10 | −1.4 | (1.9) | −1.8 | (1.5) | 0.2 | (0.2) | −0.1 | (0.2) | 0.0 | (0.0) | 0.4 | (0.8) | ||
| Lag 1 | SO2 | −13.0 | (4.7) ** | −7.8 | (3.7) | −2.5 | (0.4) ** | −0.3 | (0.4) | −0.2 | (0.1) | −2.2 | (2.0) | |
| NO2 | 5.5 | (3.9) | 3.7 | (3.0) | 0.9 | (0.3) * | 1.2 | (0.4) * | 0.1 | (0.1) | −0.6 | (1.7) | ||
| O3 | −1.3 | (3.0) | −3.4 | (2.3) | −0.4 | (0.3) | 0.5 | (0.3) | −0.1 | (0.0) | 1.9 | (1.3) | ||
| CO | 436.0 | (174.2) * | 340.4 | (135.6) ** | 43.0 | (15.4) ** | −8.8 | (16.2) | 3.6 | (2.6) | 62.9 | (74.4) | ||
| PM10 | −0.8 | (1.7) | 0.0 | (1.3) | −0.3 | (0.2) | −0.3 | (0.2) | 0.0 | (0.0) | 0.0 | (0.7) | ||
| Lag 2 | SO2 | −17.0 | (4.9) ** | −9.2 | (3.8) * | −2.1 | (0.4) ** | −0.8 | (0.4) | −0.1 | (0.1) | −4.6 | (2.1) * | |
| NO2 | 2.0 | (3.3) | 2.9 | (2.6) | 0.0 | (0.3) | 0.5 | (0.3) | 0.1 | (0.0) | −1.7 | (1.4) | ||
| O3 | 3.0 | (2.8) | 3.3 | (2.2) | −0.5 | (0.2) | 0.1 | (0.2) | 0.0 | (0.0) | 0.2 | (1.2) | ||
| CO | 623.2 | (164.3) ** | 390.6 | (128.2) ** | 44.1 | (14.6) ** | 9.1 | (14.8) | 2.5 | (2.4) | 182.2 | (70.4) * | ||
| PM10 | −3.5 | (1.8) | −3.9 | (1.4) ** | 0.1 | (0.2) | 0.0 | (0.2) | 0.0 | (0.0) | 0.4 | (0.8) | ||
| Lag 3 | SO2 | −13.9 | (4.5) ** | −5.3 | (3.5) | −2.5 | (0.4) ** | −1.0 | (0.4) | 0.0 | (0.1) | −4.7 | (1.9) * | |
| NO2 | −4.0 | (4.0) | −0.5 | (3.1) | −0.4 | (0.4) | 0.2 | (0.4) | 0.0 | (0.1) | −3.5 | (1.7) * | ||
| O3 | 2.8 | (2.5) | 2.7 | (1.9) | 0.0 | (0.2) | 0.4 | (0.2) | 0.0 | (0.0) | −0.2 | (1.1) | ||
| CO | 690.7 | (151.6) ** | 462.9 | (118.3) ** | 49.1 | (13.4) ** | 15.4 | (13.7) | 1.6 | (2.3) | 160.1 | (65.1) * | ||
| PM10 | −1.7 | (1.6) | −2.5 | (1.2) | 0.0 | (0.1) | −0.2 | (0.1) | 0.0 | (0.0) | 1.0 | (0.7) | ||
| Lag 4 | SO2 | −14.3 | (4.4) ** | −11.5 | (3.4) ** | −1.8 | (0.4) ** | −0.7 | (0.4) | −0.1 | (0.1) | −0.4 | (1.9) | |
| NO2 | −13.0 | (4.6) ** | −11.1 | (3.6) ** | −1.5 | (0.4) ** | 0.0 | (0.4) | 0.0 | (0.1) | −0.4 | (2.0) | ||
| O3 | −0.9 | (2.6) | −1.2 | (2.0) | −0.3 | (0.2) | 0.3 | (0.2) | −0.1 | (0.0) | 0.4 | (1.1) | ||
| CO | 718.2 | (148.5) ** | 614.9 | (116.4) ** | 40.2 | (13.1) ** | 5.3 | (13.4) | 3.0 | (2.2) | 70.3 | (63.6) | ||
| PM10 | 1.5 | (1.8) | 0.3 | (1.4) | 0.5 | (0.2) * | 0.0 | (0.2) | 0.1 | (0.0) | 0.6 | (0.8) | ||
| Lag 5 | SO2 | −10.6 | (4.2) * | −8.5 | (3.3) ** | −1.8 | (0.4) ** | −0.6 | (0.4) | −0.1 | (0.1) | −0.1 | (1.8) | |
| NO2 | −10.2 | (4.0) * | −3.7 | (3.2) | −1.2 | (0.4) ** | 0.0 | (0.4) | 0.1 | (0.1) | −5.6 | (1.7) ** | ||
| O3 | 2.7 | (2.5) | 3.4 | (1.9) | 0.0 | (0.2) | 0.0 | (0.2) | 0.0 | (0.0) | −0.7 | (1.1) | ||
| CO | 533.3 | (156.7) ** | 470.4 | (122.7) ** | 27.7 | (13.8) * | 4.9 | (14.5) | 2.3 | (2.4) | 48.6 | (67.0) | ||
| PM10 | 0.8 | (1.9) | −2.5 | (1.5) | 0.4 | (0.2) ** | 0.2 | (0.2) | 0.0 | (0.0) | 2.5 | (0.8) ** | ||
| Lag 6 | SO2 | −16.7 | (4.0) ** | −12.3 | (3.2) ** | −1.6 | (0.4) ** | −0.8 | (0.4) * | −0.2 | (0.1) | −1.6 | (1.7) | |
| NO2 | −17.0 | (4.4) ** | −9.3 | (3.4) ** | −1.7 | (0.4) ** | −0.9 | (0.4) * | 0.0 | (0.1) | −4.8 | (1.9) * | ||
| O3 | 0.0 | (2.4) | −1.4 | (1.8) | 0.3 | (0.2) | 0.1 | (0.2) | 0.0 | (0.0) | 1.4 | (1.0) | ||
| CO | 761.4 | (155.3) ** | 583.4 | (120.8) ** | 32.4 | (13.8) ** | 33.4 | (14.5) * | 5.3 | (2.4) | 110.3 | (66.6) | ||
| PM10 | 2.5 | (1.8) | 1.7 | (1.4) | 0.4 | (0.2) | 0.2 | (0.2) | 0.0 | (0.0) | 0.0 | (0.8) | ||
| Lag 7 | SO2 | −15.3 | (4.1) ** | −10.8 | (3.2) * | −1.6 | (0.4) ** | −0.4 | (0.4) | −0.2 | (0.1) | −2.2 | (1.8) | |
| NO2 | −16.6 | (4.1) ** | −10.2 | (3.2) * | −0.9 | (0.4) * | −1.0 | (0.4) * | −0.1 | (0.1) | −4.1 | (1.8) * | ||
| O3 | −3.9 | (2.3) | −2.6 | (1.8) | −0.1 | (0.2) | 0.2 | (0.2) | 0.0 | (0.0) | −1.2 | (1.0) | ||
| CO | 760.0 | (169.3) ** | 538.0 | (132.0) ** | 36.5 | (15.0) * | 28.6 | (15.7) | 5.1 | (2.6) | 147.0 | (72.8) * | ||
| PM10 | 3.5 | (1.8) | 2.3 | (1.4) | 0.2 | (0.2) | 0.1 | (0.2) | 0.0 | (0.0) | 0.8 | (0.8) | ||
| a_SO2 | −33.7 | (7.3) ** | −23.9 | (5.7) ** | −4.4 | (0.6) ** | −1.3 | (0.7) | −0.4 | (0.1) ** | −3.8 | (3.1) | ||
| a_NO2 | −22.3 | (7.0) ** | −10.2 | (5.5) | −2.2 | (0.6) ** | 0.5 | (0.6) | 0.1 | (0.1) | −10.7 | (3.0) ** | ||
| a_O3 | 0.2 | (4.6) | 0.9 | (3.6) | −0.3 | (0.4) | 0.5 | (0.4) | −0.1 | (0.1) | −0.7 | (2.0) | ||
| a_CO | 1431.1 | (258.2) ** | 1061.9 | (201.7) ** | 105.0 | (22.8) ** | 22.8 | (24.0) | 6.6 | (3.9) | 243.4 | (110.8) * | ||
| a_PM10 | −1.3 | (3.3) | −3.9 | (2.5) | 0.2 | (0.3) | −0.3 | (0.3) | 0.0 | (0.0) | 2.7 | (1.4) | ||
| White Blood Cells | Neutrophil Counts | Monocyte Counts | Eosinophil Counts | Basophil Counts | Lymphocyte Counts | |||||||
|---|---|---|---|---|---|---|---|---|---|---|---|---|
| β | (SE) | β | (SE) | β | (SE) | β | (SE) | β | (SE) | β | (SE) | |
| Gender (male) | 220.7 | (46.1) ** | 116.2 | (36.0) ** | 57.92 | (4.1) ** | 36.76 | (4.3) ** | 1.76 | (0.7) * | 6.66 | −19.8 |
| Age | 4 | −3.5 | −0.49 | −2.7 | 1.17 | (0.3) ** | −0.09 | −0.3 | 0.06 | −0.1 | 3.12 | −1.5 |
| BMI | 65.3 | (5.4) ** | 29.54 | (4.2) ** | 3.83 | (0.5) ** | 2.4 | (0.5) ** | 0.38 | (0.1) ** | 28.67 | (2.3) ** |
| Cigarette smoking | 642.2 | (61.4) ** | 321.48 | (48.0) ** | 47.33 | (5.4) ** | 33.52 | (5.7) ** | 4.39 | (0.9) ** | 239.21 | (26.4) ** |
| Alcohol drinking | −79.8 | −59.3 | −64.71 | −46.3 | −7.93 | −5.2 | −8.52 | −5.5 | 0.72 | −0.9 | 1.01 | −25.4 |
| Betel quid use | −14.9 | −123.1 | −22.57 | −95.9 | −7.47 | −10.9 | 26.61 | (11.4) * | 0.7 | −1.9 | −19.22 | −52.8 |
| a_SO2 | −33.7 | (7.3) ** | −23.86 | (5.7) ** | −4.35 | (0.6) ** | −1.27 | −0.7 | −0.37 | (0.1) ** | −3.8 | −3.1 |
| a_NO2 | −22.3 | (7.0) ** | −10.15 | −5.5 | −2.19 | (0.6) ** | 0.47 | −0.6 | 0.07 | −0.1 | −10.67 | (3.0) ** |
| a_O3 | 0.2 | −4.5 | 0.89 | −3.6 | −0.27 | −0.4 | 0.55 | −0.4 | −0.11 | −0.1 | −0.69 | −2 |
| a_CO | 1431.1 | (258.3) ** | 1061.91 | (201.7) ** | 105.01 | (22.8) ** | 22.82 | −24 | 6.56 | −3.9 | 243.39 | (110.8) * |
| a_PM10 | −1.3 | −3.23 | −3.89 | −2.5 | 0.18 | −0.3 | −0.32 | −0.3 | 0.02 | −0.1 | 2.73 | −1.4 |
| Pollutant | Interquartile in Air (Q3−Q1) | Adjusted Regression Coefficients (SE) of WBC Counts | WBC Changes from Q1 to Q3 |
|---|---|---|---|
| SO2 | 4.74 ppb | −33.7 (7.3) ** | −159.7 |
| NO2 | 19.4 ppb | −22.3 (7.0) ** | −432.6 |
| O3 | 21.08 ppb | 0.2 (4.5) | 4.2 |
| CO | 0.25 ppm | 1431.1 (258.3) ** | 357.8 |
| PM10 | 50.05 μg/m3 | −1.3 (3.23) | −65.1 |
Publisher’s Note: MDPI stays neutral with regard to jurisdictional claims in published maps and institutional affiliations. |
© 2021 by the authors. Licensee MDPI, Basel, Switzerland. This article is an open access article distributed under the terms and conditions of the Creative Commons Attribution (CC BY) license (http://creativecommons.org/licenses/by/4.0/).
Share and Cite
Hung, S.-C.; Cheng, H.-Y.; Yang, C.-C.; Lin, C.-I.; Ho, C.-K.; Lee, W.-H.; Cheng, F.-J.; Li, C.-J.; Chuang, H.-Y. The Association of White Blood Cells and Air Pollutants—A Population-Based Study. Int. J. Environ. Res. Public Health 2021, 18, 2370. https://doi.org/10.3390/ijerph18052370
Hung S-C, Cheng H-Y, Yang C-C, Lin C-I, Ho C-K, Lee W-H, Cheng F-J, Li C-J, Chuang H-Y. The Association of White Blood Cells and Air Pollutants—A Population-Based Study. International Journal of Environmental Research and Public Health. 2021; 18(5):2370. https://doi.org/10.3390/ijerph18052370
Chicago/Turabian StyleHung, Shih-Chiang, Hsiao-Yuan Cheng, Chen-Cheng Yang, Chia-I Lin, Chi-Kung Ho, Wen-Huei Lee, Fu-Jen Cheng, Chao-Jui Li, and Hung-Yi Chuang. 2021. "The Association of White Blood Cells and Air Pollutants—A Population-Based Study" International Journal of Environmental Research and Public Health 18, no. 5: 2370. https://doi.org/10.3390/ijerph18052370
APA StyleHung, S.-C., Cheng, H.-Y., Yang, C.-C., Lin, C.-I., Ho, C.-K., Lee, W.-H., Cheng, F.-J., Li, C.-J., & Chuang, H.-Y. (2021). The Association of White Blood Cells and Air Pollutants—A Population-Based Study. International Journal of Environmental Research and Public Health, 18(5), 2370. https://doi.org/10.3390/ijerph18052370