
Geospatial Analysis of COVID-19: A Scoping Review


Abstract
1. Introduction
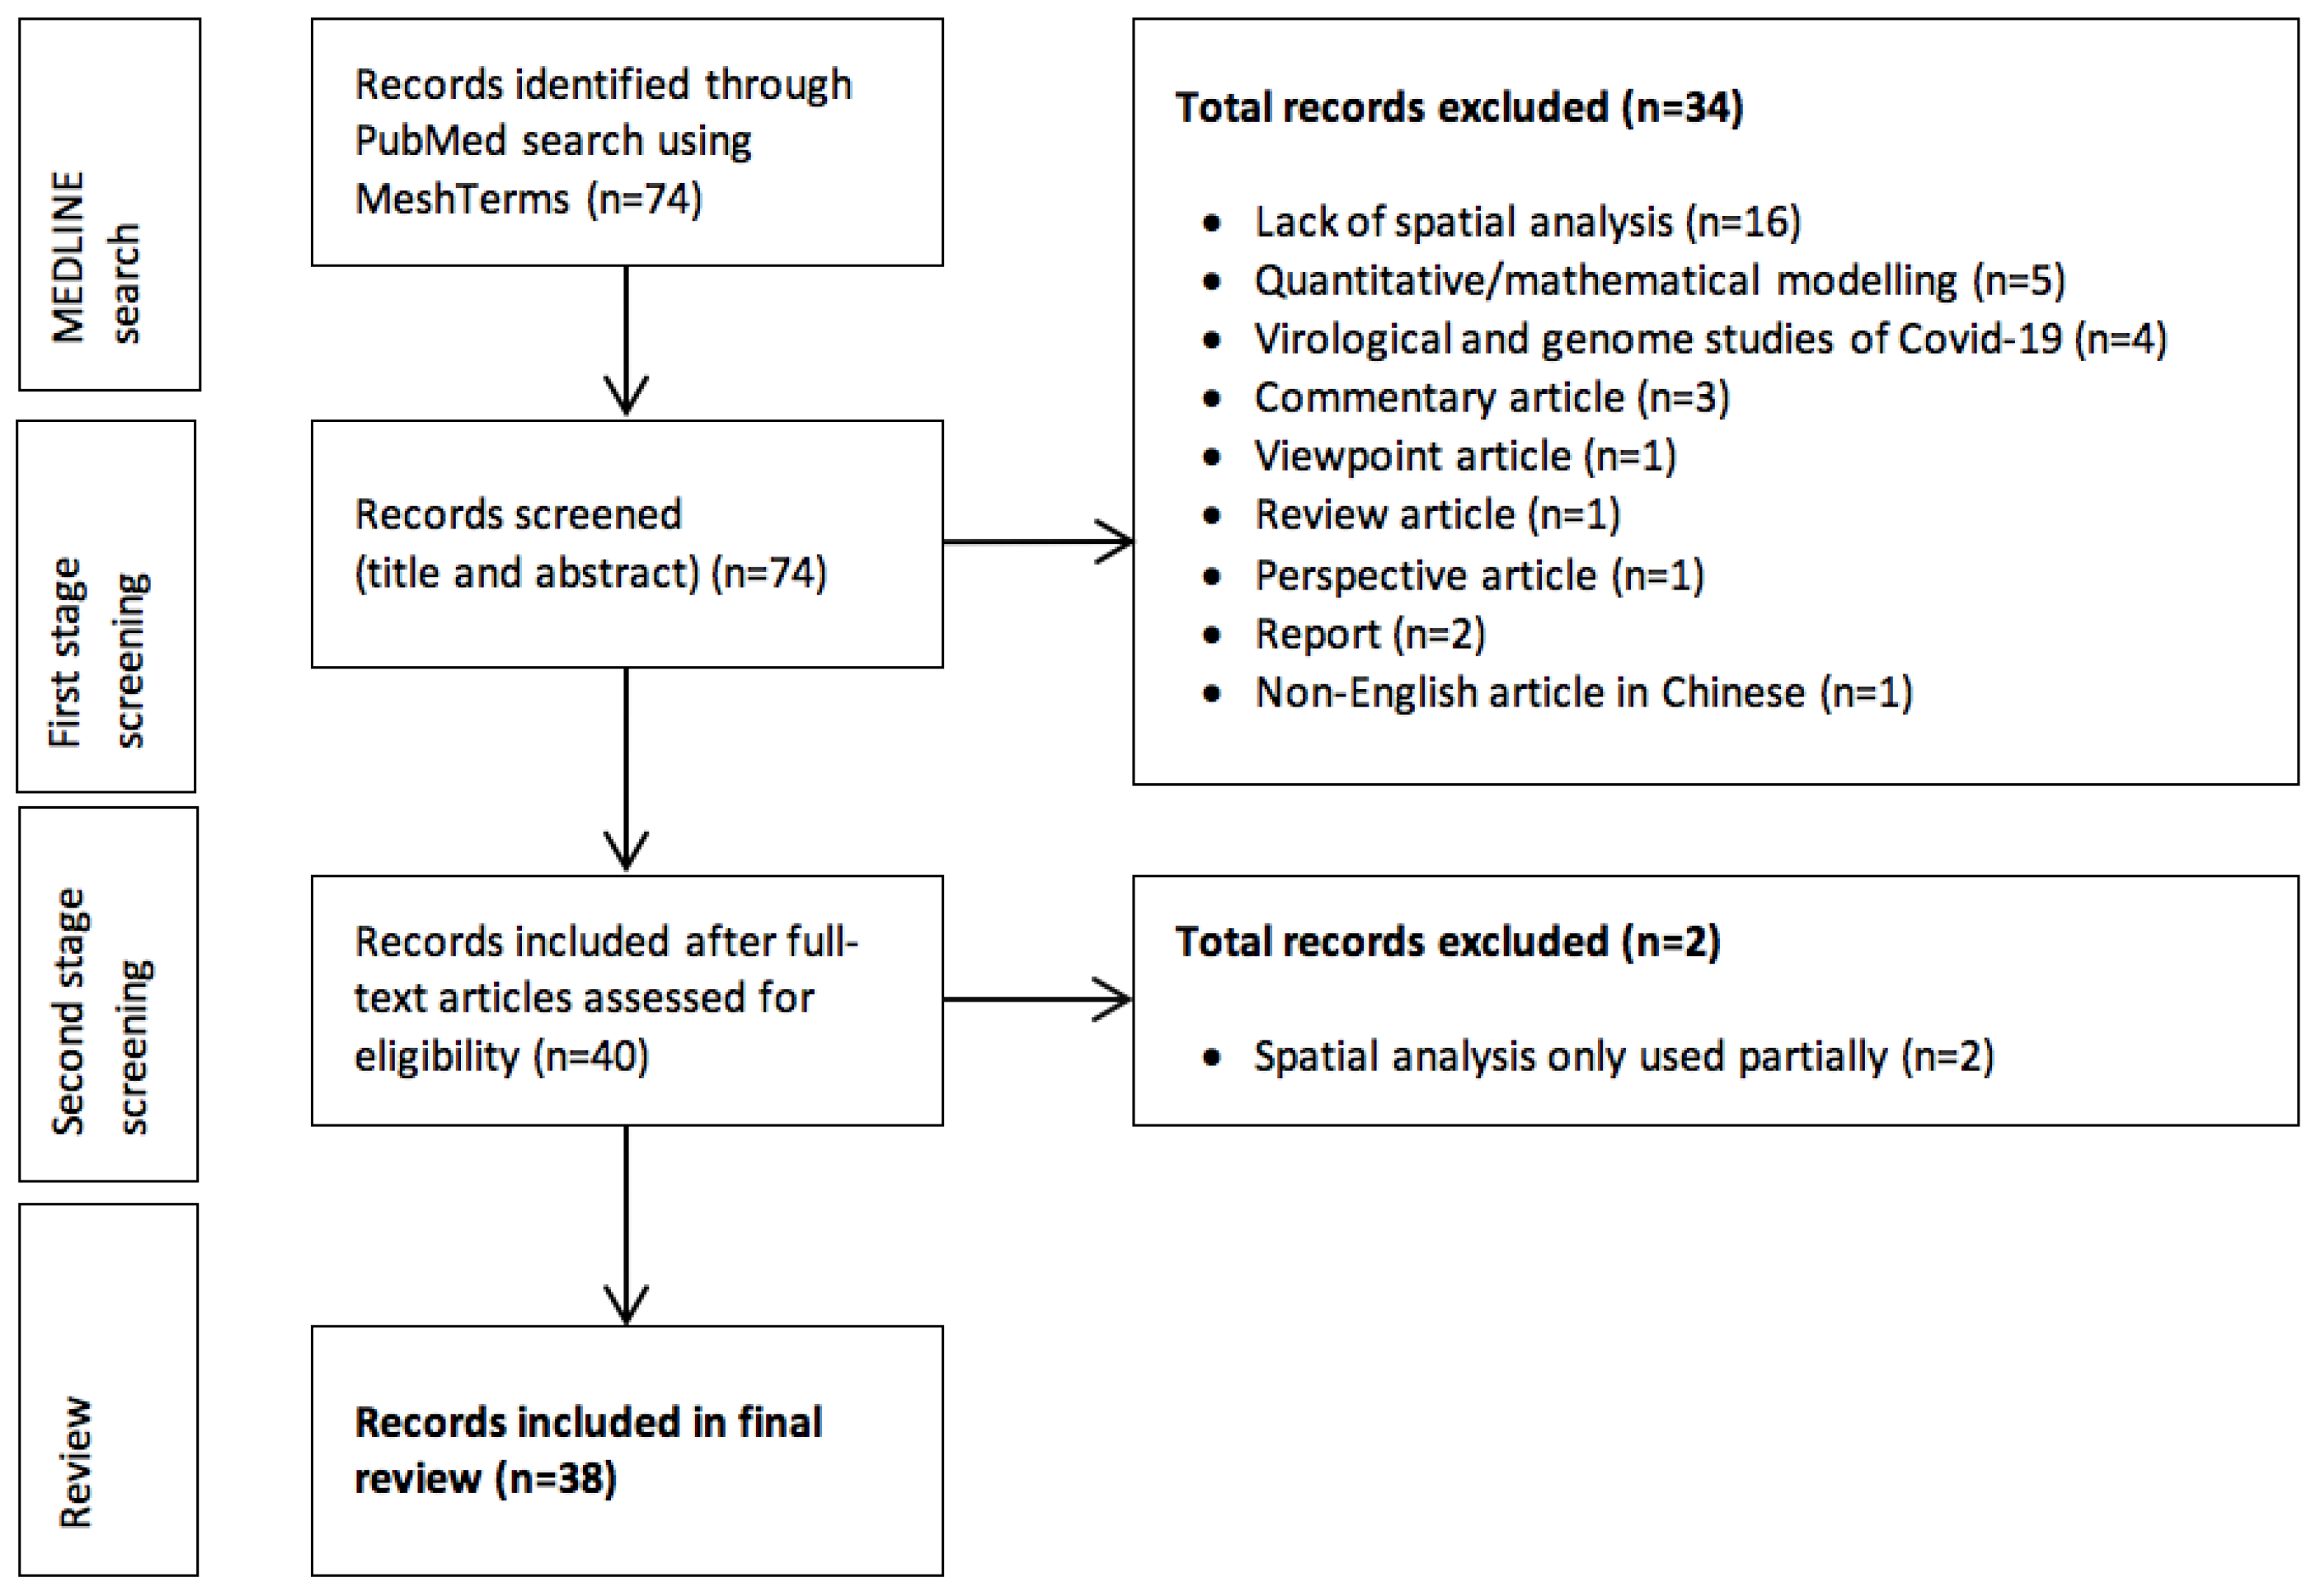
2. Methods
3. Results
3.1. Disease Mapping
3.2. Exposure Mapping
3.3. Spatial Epidemiological Modeling
4. Discussion
5. Conclusions
Author Contributions
Funding
Institutional Review Board Statement
Informed Consent Statement
Data Availability Statement
Conflicts of Interest
References
- Rader, B.; Scarpino, S.; Nande, A.; Hill, A.; Dalziel, B.; Reiner, R.; Pigott, D.; Gutierrez, B.; Shrestha, M.; Brownstein, J.; et al. Crowding and the epidemic intensity of COVID-19 transmission. medRxiv 2020. [Google Scholar] [CrossRef]
- Cao, Y.; Hiyoshi, A.; Montgomery, S. COVID-19 case-fatality rate and demographic and socioeconomic influencers: Worldwide spatial regression analysis based on country-level data. BMJ Open 2020, 10, e043560. [Google Scholar] [CrossRef] [PubMed]
- Miller, L.E.; Bhattacharyya, R.; Miller, A.L. Spatial Analysis of Global Variability in Covid-19 Burden. Risk Manag. Healthc. Policy 2020, 13, 519–522. [Google Scholar] [CrossRef]
- Glass, G.E. Update: Spatial Aspects of Epidemiology: The Interface with Medical Geography. Epidemiol. Rev. 2000, 22, 136–139. [Google Scholar] [CrossRef] [PubMed]
- Kang, D.; Choi, H.; Kim, J.-H.; Choi, J. Spatial epidemic dynamics of the COVID-19 outbreak in China. Int. J. Infect. Dis. 2020, 94, 96–102. [Google Scholar] [CrossRef] [PubMed]
- Pfeiffer, D.; Robinson, T.P.; Stevenson, M.; Stevens, K.B.; Rogers, D.J.; Clements, A.C. Spatial Analysis in Epidemiology; Oxford University Press: Oxford, UK, 2008; p. 142. [Google Scholar]
- Waller, L.A. Disease Mapping. In Encyclopedia of Environmetrics; El-Shaarawi, A.H., Piegorsch, W.W., Eds.; John Wiley & Sons: Hoboken, NJ, USA, 2001. [Google Scholar] [CrossRef]
- Brody, H.; Rip, M.R.; Vinten-Johansen, P.; Paneth, N.; Rachman, S. Map-making and myth-making in Broad Street: The London cholera epidemic, 1854. Lancet 2000, 356, 64–68. [Google Scholar] [CrossRef]
- Gruebner, O.; Khan, M.M.H.; Hostert, P. Spatial epidemiological applications in public health research: Examples from the megacity of Dhaka. In Health in Megacities and Urban Areas; Springer: Berlin/Heidelberg, Germany, 2011; pp. 243–261. [Google Scholar]
- Franch-Pardo, I.; Napoletano, B.M.; Rosete-Verges, F.; Billa, L. Spatial analysis and GIS in the study of COVID-19. A review. Sci. Total Environ. 2020, 739, 140033. [Google Scholar] [CrossRef] [PubMed]
- Tricco, A.C.; Lillie, E.; Zarin, W.; O’Brien, K.K.; Colquhoun, H.; Levac, D.; Moher, D.; Peters, M.D.; Horsley, T.; Weeks, L. PRISMA extension for scoping reviews (PRISMA-ScR): Checklist and explanation. Ann. Intern. Med. 2018, 169, 467–473. [Google Scholar] [CrossRef]
- ESRI. ArcGIS; Environmental Systems Research Institute: Redlands, CA, USA, 1999. [Google Scholar]
- R Core Team. R Programming Language; R Foundation for Statistical Computing: Vienna, Austria, 1993. [Google Scholar]
- Anselin, L.; Syabri, I.; Kho, Y. GeoDa: An Introduction to Spatial Data Analysis. Geogr. Anal. 2006, 38, 5–22. [Google Scholar] [CrossRef]
- OSGeo. QGIS; Open Source Geospatial Foundation: Beaverton, OR, USA, 2002. [Google Scholar]
- Kulldorff M. and Information Management Services, Inc. SaTScanTM: Software for the spatial and space-time scan statistics. 2009. Available online: http://www.satscan.org/ (accessed on 27 February 2021).
- INPE. TerraView 5.3.3; Image Processing Division, Brazilian National Institute of Space Research: Cuiabá, Brazil, 2015. [Google Scholar]
- IBM. IBM SPSS Statistics; IBM: Armonk, NY, USA, 2009. [Google Scholar]
- Microsoft. MS Excel; Microsoft Corporation: Redmond, WA, USA, 1987. [Google Scholar]
- Andrade, L.A.; Gomes, D.S.; Góes, M.A.; Souza, M.S.; Teixeira, D.C.; Ribeiro, C.J.; Alves, J.A.; Araújo, K.C.; Santos, A.D. Surveillance of the first cases of COVID-19 in Sergipe using a prospective spatiotemporal analysis: The spatial dispersion and its public health implications. Rev. Soc. Bras. Med. Trop. 2020, 53, 0037–8682. [Google Scholar] [CrossRef]
- Briz-Redón, Á.; Serrano-Aroca, Á. A spatio-temporal analysis for exploring the effect of temperature on COVID-19 early evolution in Spain. Sci. Total Environ. 2020, 728, 22. [Google Scholar] [CrossRef]
- Cavalcante, J.R.; Abreu, A.J.L. COVID-19 in the city of Rio de Janeiro: Spatial analysis of first confirmed cases and deaths. Epidemiol. Serv. Saude 2020, 29, 9. [Google Scholar] [CrossRef]
- Fan, J.; Liu, X.; Pan, W.; Douglas, M.W.; Bao, S. Epidemiology of Coronavirus Disease in Gansu Province, China, 2020. Emerg. Infect. Dis. 2020, 26, 1257–1265. [Google Scholar] [CrossRef] [PubMed]
- Gao, W.; Sanna, M.; Tsai, M.K.; Wen, C.P. Geo-temporal distribution of 1,688 Chinese healthcare workers infected with COVID-19 in severe conditions-A secondary data analysis. PLoS ONE 2020, 15, e0233255. [Google Scholar] [CrossRef]
- Hohl, A.; Delmelle, E.M.; Desjardins, M.R.; Lan, Y. Daily surveillance of COVID-19 using the prospective space-time scan statistic in the United States. Spat. Spatiotemporal. Epidemiol. 2020, 34, 27. [Google Scholar] [CrossRef] [PubMed]
- Huang, R.; Liu, M.; Ding, Y. Spatial-temporal distribution of COVID-19 in China and its prediction: A data-driven modeling analysis. J. Infect. Dev. Ctries 2020, 14, 246–253. [Google Scholar] [CrossRef] [PubMed]
- Jella, T.K.; Acuña, A.J.; Samuel, L.T.; Mroz, T.E.; Kamath, A.F. Geospatial Mapping of Orthopaedic Surgeons Age 60 and Over and Confirmed Cases of COVID-19. J. Bone Jt. Surg Am. 2020, 102, 1022–1028. [Google Scholar] [CrossRef] [PubMed]
- Jia, J.S.; Lu, X.; Yuan, Y.; Xu, G.; Jia, J.; Christakis, N.A. Population flow drives spatio-temporal distribution of COVID-19 in China. Nature 2020, 582, 389–394. [Google Scholar] [CrossRef]
- Kim, S.; Castro, M.C. Spatiotemporal pattern of COVID-19 and government response in South Korea (as of May 31, 2020). Int. J. Infect. Dis. 2020, 98, 328–333. [Google Scholar] [CrossRef]
- Li, H.; Ding, Z.; Hu, Z.; Chen, F.; Wang, K.; Peng, Z.; Shen, H. Spatial statistical analysis of Coronavirus Disease 2019 (Covid-19) in China. Geospat. Health 2020, 15, 867. [Google Scholar] [CrossRef]
- Liao, R.J.; Ji-Ke, C.N.; Zhang, T.; Liao, Q.; Li, L.; Zhu, T.Y.; Bian, S.Y. Coronavirus disease 2019 epidemic in impoverished area: Liangshan Yi autonomous prefecture as an example. Infect. Dis. Poverty 2020, 9, 1–9. [Google Scholar] [CrossRef]
- Michelozzi, P.; de’Donato, F.; Scortichini, M.; Pezzotti, P.; Stafoggia, M.; De Sario, M.; Costa, G.; Noccioli, F.; Riccardo, F.; Bella, A.; et al. Temporal dynamics in total excess mortality and COVID-19 deaths in Italian cities. BMC Public Health 2020, 20, 1–8. [Google Scholar] [CrossRef] [PubMed]
- Pedrosa, N.L.; Albuquerque, N.L.S. Spatial Analysis of COVID-19 cases and intensive care beds in the State of Ceará, Brazil. Ciência Saúde Coletiva 2020, 25, 2461–2468. [Google Scholar] [CrossRef]
- Ponjavić, M.; Karabegović, A.; Ferhatbegović, E.; Tahirović, E.; Uzunović, S.; Travar, M.; Pilav, A.; Mulić, M.; Karakaš, S.; Avdić, N.; et al. Spatio-temporal data visualization for monitoring of control measures in the prevention of the spread of COVID-19 in Bosnia and Herzegovina. Med. Glas 2020, 17, 265–274. [Google Scholar] [CrossRef]
- Rex, F.E.; Borges, C.A.S.; Käfer, P.S. Spatial analysis of the COVID-19 distribution pattern in São Paulo State, Brazil. Ciência Saúde Coletiva 2020, 25, 3377–3384. [Google Scholar] [CrossRef] [PubMed]
- Rivas, A.L.; Febles, J.L.; Smith, S.D.; Hoogesteijn, A.L.; Tegos, G.P.; Fasina, F.O.; Hittner, J.B. Early network properties of the COVID-19 pandemic—The Chinese scenario. Int. J. Infect. Dis. 2020, 96, 519–523. [Google Scholar] [CrossRef] [PubMed]
- Tang, W.; Liao, H.; Marley, G.; Wang, Z.; Cheng, W.; Wu, D.; Yu, R. The Changing Patterns of Coronavirus Disease 2019 (COVID-19) in China: A Tempogeographic Analysis of the Severe Acute Respiratory Syndrome Coronavirus 2 Epidemic. Clin. Infect. Dis. 2020, 71, 818–824. [Google Scholar] [CrossRef] [PubMed]
- Yang, W.; Deng, M.; Li, C.; Huang, J. Spatio-Temporal Patterns of the 2019-nCoV Epidemic at the County Level in Hubei Province, China. Int. J. Environ. Res. Public Health 2020, 17, 2563. [Google Scholar] [CrossRef]
- de Souza, C.D.F.; Machado, M.F.; do Carmo, R.F. Human development, social vulnerability and COVID-19 in Brazil: A study of the social determinants of health. Infect. Dis. Poverty 2020, 9, 1–10. [Google Scholar] [CrossRef]
- Gomes, D.S.; Andrade, L.A.; Ribeiro, C.J.N.; Peixoto, M.V.S.; Lima, S.; Duque, A.M.; Cirilo, T.M.; Góes, M.A.O.; Lima, A.; Santos, M.B.; et al. Risk clusters of COVID-19 transmission in northeastern Brazil: Prospective space-time modelling. Epidemiol. Infect. 2020, 24. [Google Scholar] [CrossRef] [PubMed]
- Lakhani, A. Which Melbourne Metropolitan Areas Are Vulnerable to COVID-19 Based on Age, Disability, and Access to Health Services? Using Spatial Analysis to Identify Service Gaps and Inform Delivery. J. Pain Symptom Manag. 2020, 60, e41–e44. [Google Scholar] [CrossRef]
- Macharia, P.M.; Joseph, N.K.; Okiro, E.A. A vulnerability index for COVID-19: Spatial analysis at the subnational level in Kenya. BMJ Glob. Health 2020, 5, e003014. [Google Scholar] [CrossRef] [PubMed]
- Natividade, M.D.S.; Bernardes, K.; Pereira, M.; Miranda, S.S.; Bertoldo, J.; Teixeira, M.D.G.; Livramento, H.L.; Aragão, E. Social distancing and living conditions in the pandemic COVID-19 in Salvador-Bahia, Brazil. Ciência Saúde Coletiva 2020, 25, 3385–3392. [Google Scholar] [CrossRef] [PubMed]
- Santos, J.; Siqueira, A.S.P.; Praça, H.L.F.; Albuquerque, H.G. Vulnerability to severe forms of COVID-19: An intra-municipal analysis in the city of Rio de Janeiro, Brazil. Cadernos de Saúde Pública 2020, 36, 18. [Google Scholar] [CrossRef]
- Mollalo, A.; Rivera, K.M.; Vahedi, B. Artificial Neural Network Modeling of Novel Coronavirus (COVID-19) Incidence Rates across the Continental United States. Int. J. Environ. Res. Public Health 2020, 17, 4204. [Google Scholar] [CrossRef] [PubMed]
- Mollalo, A.; Vahedi, B.; Rivera, K.M. GIS-based spatial modeling of COVID-19 incidence rate in the continental United States. Sci. Total Environ. 2020, 728, 22. [Google Scholar] [CrossRef] [PubMed]
- Azevedo, L.; Pereira, M.J.; Ribeiro, M.C.; Soares, A. Geostatistical COVID-19 infection risk maps for Portugal. Int. J. Health Geogr. 2020, 19, 1–8. [Google Scholar] [CrossRef]
- Cordes, J.; Castro, M.C. Spatial analysis of COVID-19 clusters and contextual factors in New York City. Spat. Spatiotemporal. Epidemiol. 2020, 34, 21. [Google Scholar] [CrossRef] [PubMed]
- Cuadros, D.F.; Xiao, Y.; Mukandavire, Z.; Correa-Agudelo, E.; Hernández, A.; Kim, H.; MacKinnon, N.J. Spatiotemporal transmission dynamics of the COVID-19 pandemic and its impact on critical healthcare capacity. Health Place 2020, 64, 25. [Google Scholar] [CrossRef] [PubMed]
- Kraemer, M.U.G.; Yang, C.H.; Gutierrez, B.; Wu, C.H.; Klein, B.; Pigott, D.M.; du Plessis, L.; Faria, N.R.; Li, R.; Hanage, W.P.; et al. The effect of human mobility and control measures on the COVID-19 epidemic in China. Science 2020, 368, 493–497. [Google Scholar] [CrossRef]
- Maciel, J.A.C.; Castro, S., II; Farias, M.R. Initial analysis of the spatial correlation between the incidence of COVID-19 and human development in the municipalities of the state of Ceará in Brazil. Rev. Bras. Epidemiol. 2020, 22, e200057. [Google Scholar] [CrossRef] [PubMed]
- Mizumoto, K.; Dahal, S.; Chowell, G. Spatial variability in the risk of death from COVID-19 in Italy. Int. J. Tuberc. Lung Dis. 2020, 24, 829–837. [Google Scholar] [CrossRef]
- Ramírez, I.J.; Lee, J. COVID-19 Emergence and Social and Health Determinants in Colorado: A Rapid Spatial Analysis. Int. J. Environ. Res. Public Health 2020, 17, 3856. [Google Scholar] [CrossRef] [PubMed]
- Scarpone, C.; Brinkmann, S.T.; Große, T.; Sonnenwald, D.; Fuchs, M.; Walker, B.B. A multimethod approach for county-scale geospatial analysis of emerging infectious diseases: A cross-sectional case study of COVID-19 incidence in Germany. Int. J. Health Geogr. 2020, 19, 1–17. [Google Scholar] [CrossRef] [PubMed]
- Xiong, Y.; Wang, Y.; Chen, F.; Zhu, M. Spatial Statistics and Influencing Factors of the COVID-19 Epidemic at Both Prefecture and County Levels in Hubei Province, China. Int. J. Environ. Res. Public Health 2020, 17, 3903. [Google Scholar] [CrossRef] [PubMed]
- Ye, L.; Hu, L. Spatiotemporal distribution and trend of COVID-19 in the Yangtze River Delta region of the People’s Republic of China. Geospat. Health 2020, 15, 889. [Google Scholar] [CrossRef] [PubMed]
- Zhang, C.H.; Schwartz, G.G. Spatial Disparities in Coronavirus Incidence and Mortality in the United States: An Ecological Analysis as of May 2020. J. Rural Health 2020, 36, 433–445. [Google Scholar] [CrossRef] [PubMed]
- van Oosterhout, C.; Hall, N.; Ly, H.; Tyler, K.M. COVID-19 evolution during the pandemic—Implications of new SARS-CoV-2 variants on disease control and public health policies. Virulence 2021, 12, 507–508. [Google Scholar] [CrossRef] [PubMed]
- WHO. Global Scientists Double Down on SARS-CoV-2 Variants Research at WHO-Hosted Forum. Available online: https://www.who.int/news/item/12-01-2021-global-scientists-double-down-on-sars-cov-2-variants-research-at-who-hosted-forum (accessed on 17 February 2021).
- Kim, J.H.; Marks, F.; Clemens, J.D. Looking beyond COVID-19 vaccine phase 3 trials. Nat. Med. 2021, 27, 205–211. [Google Scholar] [CrossRef] [PubMed]
- Fischer, M.M.; Wang, J. Spatial Data Analysis: Models, Methods and Techniques; Springer Science & Business Media: Berlin/Heidelberg, Germany, 2011. [Google Scholar]


| # | Reference | Study Focus | Main Spatial Techniques | Main Software | Geographic Extent |
|---|---|---|---|---|---|
| Disease Mapping | |||||
| 1 | Andrade et al. [20] | Space–time analysis of COVID-19 | Prospective spatiotemporal scan statistic | QGIS 3.4.11, | Brazil |
| TerraView 4.2.2, SaTScan 9.6 | |||||
| 2 | Briz-Redón and Serrano-Aroca [21] | COVID-19 in relation with temperature | Choropleth maps of COVID-19 accumulated observed and predicted cases | R (automap), | Spain |
| Gstat | |||||
| 3 | Cavalcante and Abreu [22] | Spatial distribution of COVID-19 cases and deaths | SAC with Moran’s I | QGIS 2.14.8, | Brazil |
| GeoDa 1.14.0 | |||||
| 4 | Fan et al. [23] | COVID-19 reported cases | Choropleth incidence map | ArcGIS 10.2.2 | Gansu Province, China |
| LISA cluster analysis | |||||
| 5 | Gao et al. [24] | COVID-19 in healthcare workers | Choropleth map showing distribution of COVID-19 infected health workers | QGIS 3.12 | China |
| 6 | Hohl et al. [25] | COVID-19 space–time clusters through daily surveillance | Poisson space–time scan statistic | SaTScan, | USA |
| R, R Shiny | |||||
| 7 | Huang et al. [26] | COVID-19 confirmed cases | Spatial autocorrelation (SAC) with Moran’s I | None mentioned | China |
| 8 | Jella et al. [27] | COVID-19 confirmed case with age and occupation | Overlay map of COVID-19 confirmed cases and orthopedic surgeons in patients >60 years of age | QGIS 3.12.1 | USA |
| 9 | Jia et al. [28] | COVID-19 and population outflow | Overlay maps of population outflow from Wuhan and COVID-19 confirmed cases | ArcGIS 10.2 | China |
| 10 | Kim & Castro [29] | Change in COVID-19 clusters according to government response | SAC with Moran’s I, Space–time scan statistic for spatio-temporal clusters of COVID-19 | SaTScan 9.6, | South Korea |
| GeoDa 1.14, | |||||
| ArcGIS 10.6.1 | |||||
| 11 | Li et al. [30] | Spatial analysis of COVID-19 clusters | SAC with Moran’s I | ArcGIS 10.4.1 | China |
| 12 | Liao et al. [31] | COVID-19 cases (age, gender, nationality, occupation, and address) | Choropleth maps of COVID-19 confirmed case | ArcGIS 10.2 | China |
| 13 | Michelozzi et al. [32] | COVID-19 mortality in relation with geographic area, age, and sex | Choropleth incidence map | R | Italy |
| 14 | Pedrosa and Albuquerque [33] | Spatial analysis of COVID-19 and healthcare services (number of ICU beds) | Case detection coefficient | Boxmap, | Brazil |
| SAC with Moran’s I (Bayesian method) | Moran Map | ||||
| 15 | Ponjavić et al. [34] | Fast representation of COVID-19 through Geo visualization | Spatial visualization | ELIS (Epidemic Location Intelligence System) | Bosnia and Herzegovina |
| 16 | Rex et al. [35] | COVID-19 in relation with road and air transport | Kernel density estimation | QGIS 3.8 | São Paulo, Brazil |
| 17 | Rivas et al. [36] | Spatial distribution of epidemic nodes and COVID-19 mortality | Spatial visualization of road rail and air connectivity | ArcGIS Pro 2.5.0, | China |
| SPSS, Minitab | |||||
| 18 | Tang et al. [37] | Changing patterns of COVID-19 | Choropleth maps of COVID-19 confirmed cases, SAC with Moran’s I | R, | China |
| ArcGIS 10.2 | |||||
| 19 | Yang et al. [38] | Spatiotemporal patterns of COVID-19 | SAC with Moran’s I | ArcGIS 10.2 | China |
| Exposure Mapping | |||||
| 20 | de Souza et al. [39] | COVID-19 in relation with | Bivariate spatial correlation and multivariate and spatial regression models | GeoDa1.10.0.8 | Brazil |
| living conditions | |||||
| 21 | Gomes et al. [40] | Risk clusters of COVID-19 Transmission | SAC with Moran’s I | QGIS 3.4.11, | Brazil |
| SaTScan 9.6, TerraView 4.2.2 | |||||
| 22 | Lakhani [41] | Vulnerability assessment of COVID-19 by risk factors | Hotspot analysis (Getis-Ord Gi*) | ArcGIS 10.4.1 | Australia |
| 23 | Macharia et al. [42] | Assessment of the vulnerability of COVID-19 (social and epidemiological) | Spatially overlaid via | Arc GIS 10.5, | Kenya |
| arithmetic mean and equally weighted | R 3.4.1 | ||||
| 24 | Natividade et al. [43] | Effect of living conditions on social distancing in COVID-19 pandemic | SAC with Moran’s I | QGIS 2.18, | Salvador-Bahia, Brazil |
| GeoDa 2.14, | |||||
| R | |||||
| 25 | Santos et al. [44] | COVID-19 vulnerability assessment (household density, old age population, tuberculosis incidence) | Choropleth maps of COVID-19 vulnerability Index | ArcGIS 10.5 | Brazil |
| Spatial Epidemiological Modeling | |||||
| 26 | A. Mollalo et al. [45] | Spatial and statistical prediction of COVID-19 | Hotspot analysis by Getis–Ord Gi* | ArcGIS 10.4.1 | USA |
| 27 | A. Mollalo et al. [46] | COVID-19 incidence relation with socio-economic demographic and environmental factors | Multiscale geographically weighted regression | ArcGIS 10.7 | USA |
| 28 | Azevedo et al. [47] | New spatial methodology for spatial predictions assessment | Spatial Modeling, | ArcGIS online | Portugal |
| Stochastic simulations | |||||
| 29 | Cordes and Castro [48] | COVID-19 and urban health inequalities | SAC with Moran’s I I | SaTScan9.6, | New York, |
| Pearson correlations | GeoDa 1.14.0, | USA | |||
| ArcGIS 10.6.1, | |||||
| R 3.6.2 | |||||
| 30 | Cuadros et al. [49] | COVID-19 and healthcare capacity | Spatially-explicit mathematical modeling | ArcGIS 10.2 | USA |
| 31 | Kraemer et al. [50] | Human mobility and control measures in relation with COVID-19 | Generalized linear models (Poisson GLM, negative binomial GLM, log-linear regression) | R package, | China |
| GLMNET | |||||
| 32 | Maciel et al. [51] | Spatial analysis of COVID-19 and its correlation with the municipal human development index (MHDI) | Bivariate LISA analysis, | TerraView 4.1.0, | Brazil |
| global Moran’s I | GeoDa | ||||
| 33 | Mizumoto et al. [52] | COVID-19 confirmed cases | Choropleth maps of COVID-19 morbidity rates and crude fatality rates | R | Italy |
| COVID-19 crude case fatality ratio | |||||
| 34 | Ramírez and Lee [53] | COVID-19 and social health determinants | Interpolation by inverse distance weighted (IDW), Pearson’s correlation | ArcGIS Pro | USA |
| 35 | Scarpone, et al. [54] | Spatial, socio-economic, and built-environment in relation to COVID-19 incidence | SAC with Moran’s I | ArcGIS 10.7.1, | Germany |
| R package spatstat | |||||
| 36 | Xiong, et al. [55] | Spatial statistical analysis of COVID-19 and its Influencing factors | SAC with Moran’s I, Spearman’s rank correlation | ArcGIS 10.7 | China |
| 37 | Ye and Hu [56] | Impacts of control measures on COVID-19 cases | Polynomial regression, SAC with Moran’s I | ArcGIS 10.4.1 | China |
| 38 | Zhang and Schwartz [57] | Spatial pattern of COVID-19 in relation with socio-economic variables of urban and rural counties | Multiple regression analysis | ArcGIS 10.4.3 | USA |
| Reference | Main Findings |
|---|---|
| Disease Mapping | |
| Andrade et al. [20] | Active and emerging spatiotemporal clusters in southern central Sergipe, Brazil |
| Briz-Redón and Serrano-Aroca [21] | No evidence of a relationship between temperature and COVID-19 cases was found in Spain |
| Cavalcante and Abreu [22] | High risk of COVID-19 infection and deaths was found in neighborhoods in the South Zone of the city of Rio de Janeiro, Brazil |
| Fan et al. [23] | Spatial distribution of COVID-19 hotspots in China |
| Gao et al. [24] | Spatial distribution of COVID-19-infected healthcare workers in China, with Wuhan being the most severe, followed by Hubei Province and the rest of China |
| Hohl et al. [25] | As the pandemic progresses, the number of smaller clusters of remarkably steady relative risk increased in USA |
| Huang et al. [26] | Spatial patterns of COVID-19 in China, showing severe epidemic situation in Hubei province |
| Jella et al. [27] | Highest quintile of orthopaedic surgeons ≥60 years of age in New York, New Jersey, California, and Florida. These states were also most severely affected by COVID-19 in the USA |
| Jia et al. [28] | Spatial distribution of population outflow from Wuhan to the rest of China, evidence for an association between population outflow and COVID-19 cases |
| Kim & Castro [29] | South Korean government’s epidemic response measures were significantly associated with changes in COVID-19 clusters |
| Li et al. [30] | Provinces with high and low COVID-19 clusters in China, with Hubei as the only province with high-low aggregation |
| Liao et al. [31] | Strict preventive strategies aimed at the local culture, with inter-sectoral coordination and high degree of public cooperation, helped in controlling COVID-19 in Liangshan Prefecture, China |
| Michelozzi et al. [32] | Age and sex were confirmed as risk factors for COVID-19-related mortality in Italy, with elderly (aged 65+ years) and male persons exhibiting higher mortality |
| Pedrosa and Albuquerque [33] | Spatial distribution of intensive-care bed capacity was significantly associated with COVID-19 in Ceará, Brazil |
| Ponjavić et al. [34] | Distribution of COVID-19 incidence rates in Bosnia and Herzegovina |
| Rex et al. [35] | Metropoliton region of São Paulo State was a hotspot of COVID-19 |
| Rivas et al. [36] | Network properties, including synchronicity and directionality, determined the epidemic profiles observed in several Chinese provinces, fostering the planning and implementation of more precise and locally specific interventions to control COVID-19 |
| Tang et al. [37] | Spatial intensity of COVID-19 infection in China |
| Yang et al. [38] | Spatial clusters with high incidence rates were concentrated in Wuhan Metropolitan Area due to the high intensity of spatial interaction of the population |
| Exposure Mapping | |
| de Souza et al. [39] | Municipalities with low living conditions were highly exposed and would therefore need urgent attention to control the spread of disease in Brazil |
| Gomes et al. [40] | Higher COVID-19 risk in the northeastern metropolitan areas were found as compared to the more rural parts of Brazil |
| Lakhani [41] | Disability and access to health services were risk factors for COVID-19 in an elderly population in Melbourne, Australia |
| Macharia et al. [42] | COVID-19 risk was heterogeneously distributed across multiple social epidemiological indicators in Kenya |
| Natividade et al. [43] | Better living conditions were associated with a higher social distance index, as compared to areas with poor living conditions in Salvador Bahia, Brazil |
| Santos et al. [44] | City neighborhoods with higher average household density, high tuberculosis incidence, and large older populations (>60 years) were more vulnerable to COVID-19 infections in Rio De Janeiro, Brazil |
| Spatial Epidemiological Modeling | |
| A. Mollalo et al. [45] | Ischemic heart disease, pancreatic cancer, and leukemia, along with household income and precipitation were significant factors for predicting COVID-19 incidence rates in the USA |
| A. Mollalo et al. [46] | Income inequality was an influential factor in explaining COVID-19 incidence particularly in the tri-state area in the USA |
| Azevedo et al. [47] | Spatial uncertainty of COVID-19 infection risk was found in Portugal |
| Cordes and Castro [48] | Negative associations of white race, education, and income with proportion positive tests, and positive associations with black race, Hispanic ethnicity, and poverty in New York City, USA |
| Cuadros et al. [49] | Higher COVID-19 attack rates in specific highly connected and urbanised regions could have significant implications for critical healthcare in these regions, notwithstanding their potentially high healthcare capacity compared to more rural and less connected areas in the USA |
| Kraemer et al. [50] | Significant decrease in COVID-19 infections was found after implementation of governmental control measures to contain the disease in China |
| Maciel et al. [51] | There was a positive bivariate correlation between municipal human development index (MHDI) and the incidence of COVID-19 with the formation of a cluster in the metropolitan region of Fortaleza, Brazil |
| Mizumoto et al. [52] | Case fatality rates of COVID-19 estimates were statistically associated with population density and cumulative morbidity rate in Italy |
| Ramírez and Lee [53] | Population density and asthma in urban areas and poverty and unemployment in rural areas were determinants of high COVID-19 mortality in Colorado, USA |
| Scarpone et al. [54] | Location, densities of the built environment, and socio-economic variables were important predictors of COVID-19 incidence rates in Germany |
| Xiong et al. [55] | Social and economic development and population movement have strong impact on COVID-19 spread in Hubei province, China |
| Ye and Hu [56] | The effectiveness of control measures of COVID-19 in the Yangtze River Delta region of China |
| Zhang and Schwartz [57] | Positive associations were found among population density, older age, and poverty with COVID-19 incidence and mortality in urban and rural counties in the USA |
Publisher’s Note: MDPI stays neutral with regard to jurisdictional claims in published maps and institutional affiliations. |
© 2021 by the authors. Licensee MDPI, Basel, Switzerland. This article is an open access article distributed under the terms and conditions of the Creative Commons Attribution (CC BY) license (http://creativecommons.org/licenses/by/4.0/).
Share and Cite
Fatima, M.; O’Keefe, K.J.; Wei, W.; Arshad, S.; Gruebner, O. Geospatial Analysis of COVID-19: A Scoping Review. Int. J. Environ. Res. Public Health 2021, 18, 2336. https://doi.org/10.3390/ijerph18052336
Fatima M, O’Keefe KJ, Wei W, Arshad S, Gruebner O. Geospatial Analysis of COVID-19: A Scoping Review. International Journal of Environmental Research and Public Health. 2021; 18(5):2336. https://doi.org/10.3390/ijerph18052336
Chicago/Turabian StyleFatima, Munazza, Kara J. O’Keefe, Wenjia Wei, Sana Arshad, and Oliver Gruebner. 2021. "Geospatial Analysis of COVID-19: A Scoping Review" International Journal of Environmental Research and Public Health 18, no. 5: 2336. https://doi.org/10.3390/ijerph18052336
APA StyleFatima, M., O’Keefe, K. J., Wei, W., Arshad, S., & Gruebner, O. (2021). Geospatial Analysis of COVID-19: A Scoping Review. International Journal of Environmental Research and Public Health, 18(5), 2336. https://doi.org/10.3390/ijerph18052336