Article

Differences in Abnormal Water Metabolism between SD Rats and KM Mice Intoxicated by Microcystin-RR

MOE Key Lab of Environment and Health, Institute of Environmental Medicine, School of Public Health, Tongji Medical College, Huazhong University of Science and Technology, Wuhan 430030, China
*
Author to whom correspondence should be addressed.
Int. J. Environ. Res. Public Health 2021, 18(4), 1900; https://doi.org/10.3390/ijerph18041900
Submission received: 15 November 2020 / Revised: 9 February 2021 / Accepted: 10 February 2021 / Published: 16 February 2021
(This article belongs to the Section Environmental Health)

Abstract

:
The effects of microcystin-RR (MC-RR) on water metabolism were studied on Sprague–Dawley (SD) rats and KunMing (KM) mice. In the single dose toxicity test, polydipsia, polyuria, hematuria and proteinuria were found in group of rats receiving a MC-RR dose of 574.7 μg/kg, and could be relieved by dexamethasone (DXM). Gradient damage was observed in kidney and liver in rats with gradient MC-RR doses of 574.7, 287.3, and 143.7 μg/kg. No significant water metabolic changes or kidney injuries were observed in mice treated with MC-RR doses of 210.0, 105.0, and 52.5 μg/kg. In the continuous exposure test, in which mice were administrated with 140.0, 70.0, and 35.0 μg/kg MC-RR for 28 days, mice in the 140.0 μg/kg group presented increasing polydipsia, polyuria, and liver damage. However, no anatomic or histological changes, including related serological and urinary indices, were found in the kidney. In summary, abnormal water metabolism can be induced by MC-RR in rats through kidney injury in single dose exposure; the kidney of SD rats is more sensitive to MC-RR than that of KM mouse; and polydipsia and polyuria in mice exposed to MC-RR for 28 days occurred but could not be attributed to kidney damage.

1. Introduction

Microcystins (MCs) are a group of natural cyclic peptides produced by multiple cyanobacterial species, with more than 279 analogues found so far [1,2], of which MC-LR and MC-RR are most common toxins [3,4,5,6]. According to published reports, MCs are specific hepatotoxic agents capable of causing acute liver damage in wild and domestic animals exposed to high doses and play a role in tumor promotion in long-term tested animals exposed to lower doses of these toxins [7,8,9,10,11]. To date, a large number of studies have investigated hepatic toxicity resulting from MCs [12,13,14,15]. Some studies have also reported nephrotoxicity, reproductive toxicity, and gastrointestinal toxicity caused by MCs in rats, fish and other species [1,16,17,18,19,20,21,22,23]. Regarding nephrotoxicity, whether the kidneys of different animals are all responsive to MCs is unclear.
Rats and mice are common animal models for toxicological studies in mammals. Previous studies reported consistent conclusions to support the nephrotoxicity of MCs in rats [19,20,24,25,26,27,28,29,30,31,32,33,34,35], but had different views on mice in terms of whether MCs could injure mouse kidneys. Qin, studying the toxicity of MC-LR in mice, found negative outcomes for the kidney, though they did not exclude possible endoplasmic reticulum stress (EMS) in kidney cells [26]. Jayaraj’s study reported that no inhibition of protein phosphatase activity was detected in the kidneys of mice under acute MC-LR exposure [27]. Al-Jassabi’s study suggested that MC-LR resulted in kidney tubule injury and renal oxidative damage in mice [28]. Xu’s research also suggested that MC-LR induced nephrotoxicity in mice [29]. In addition, Yi’s study reported histopathological changes in mouse kidney after three months of exposure to MC-LR [30]. However, most researchers focus on the tissue and cell injury and ignore the metabolic abnormalities. Due to water metabolism and electrolyte balance being tightly associated with kidney function [31], abnormal water metabolism is usually described as a symptom of kidney impairment and is often omitted when there are no obvious organ changes in the kidney. The effect of MCs on water metabolism in different test animals is unclear. Whether the changes of water intake and output in test animals induced by MCs are definitively caused by kidney damage also needs to be explored.
Over the past decades, most research has been focused on MC-LR and relatively little on MC-RR. These two analogues are cyclic heptapeptides that differ in one amino acid at two variable L-amino acid units (X and Y), MC-LR with a leucine and MC-RR with an arginine respectively [32]. This chemical differentiation results in differences in their nature and toxicity. Although the biotoxicity of MC-RR is a little bit lower than MC-LR [33,34,35], MC-RR is often detected in bodies of water and accounts for a higher proportion in the analogues. The level of MC-RR in these environments can be larger than MC-LR sometimes [36,37], so research on MC-RR for its toxicity is of great importance.
The present investigation aimed to understand the effect of MC-RR on water metabolism in the rat and mouse. Considering water metabolism is relevant to kidney function, the nephrotoxicity of MC-RR in the rat and mouse was also evaluated to explore the possible causes of water metabolic changes. As the liver is the main target of MCs and involves much metabolic reaction, some basic liver-related indices were monitored at the same time. This study was undertaken in two steps: a single dose toxicity test and a continuous exposure experiment, to explore and compare the effects of MC-RR on the two animals’ water metabolism and their related organ tropism.

2. Materials and Methods

2.1. Animals

Specific pathogen free (SPF) male Sprague–Dawley (SD) rats and KunMing (KM) mice were bought from the Laboratory Animal Center of Huazhong University of Science and Technology (Wuhan, China). All animals prior to the experiment were allowed to acclimatize to their surrounding conditions for a week with sufficient food and water ad libitum under a 12 h light/dark cycle and at 25 ± 2 °C room temperature.

2.2. MC-RR Extraction and Purification

MC-RR was extracted from Microcystis blooms occurring in Zhongshan Park, Wuhan (China). The extraction and purification procedures were as follows: 70% methanol aqueous solution was used to extract MCs from the collected cyanobacterial slurry with magnetic stirring at 120 r/min for 40 min at room temperature. The ratio of methanol aqueous solution (mL) to cyanobacterial slurry (g) was 10:1. The extracting solution was centrifuged at 9000× g for 8 min to collect the supernatant. To precipitate the phycocyanin, the supernatant was adjusted to pH 4 and placed stably for 120 min. Then, the phycocyanin was removed by centrifugation and filtration. After the phycocyanin was removed, the supernatant was adjusted to pH 7 and then methanol was removed by rotary evaporation. The crude extract was filtered through 0.45 μm pore size membrane filters to prepare for primary purification. Primary purification was performed by solid phase extraction (SPE) using an Oasis HLB column (Waters, Milford, MA, USA). The columns were activated by methanol and distilled water, and washed by 20 and 30% methanol aqueous solution successively after loading the crude extract. Then, 100% methanol was used to wash the columns for collection of the final eluent. The final eluent was concentrated to 2 mL by rotary evaporation for subsequent steps.
Secondary purification was performed by a Sephadex LH-20 column (500 mm × 26 mm i.d.) with 100% methanol eluted at 1 mL/min flow rate [38]. The eluent was collected every 5 mL per tube, and tubes that contained MC-RR (identified by high-performance liquid chromatography (HPLC)) were selected for the third purification steps. MC-RR was separated through the third purification process with a DEAE-52 (DEAE-cellulose) column (300 mm × 26 mm i.d.). In this process, distilled water and 3 mmol/L sodium solution eluted the column successively with a flow rate of 1 mL/min. The eluents were identified and quantified by HPLC according to the MC-RR standard (Enzo Life Sciences Inc., Lausen, Switzerland). Eluent with a purity of MC-RR > 90% was collected for use in the animal experiments (Supplementary Material Figure S1).

2.3. Experimental Procedures on Animals

2.3.1. Single-Dose Toxicity Test

Single-Dose Toxicity Study of MC-RR in Rats and Mice for Water Metabolism

Rats aged 6 weeks and weighing 150–220 g were randomly divided into 4 groups, with 6 animals in each group. The animals were fed in metabolic cages and administered to MC-RR. According to the median lethal dose (LD50) obtained in the pre-experiment, the 4 groups of rats were given intraperitoneal injections of a high dose (574.7 μg/kg (3/4 LD50)), medium dose (287.3 μg/kg), low dose (143.7 μg/kg), or physiological saline as control. Mice aged 6 weeks and weighing 27–33 g were arranged in the same way as the rats, but the toxin MC-RR was administered at a high dose (210.0 μg/kg (3/4 LD50)), medium dose (105.0 μg/kg), low dose (52.5 μg/kg), with physiological saline as control. After 24 h, urine and blood samples of animal subjects were collected, and then the animals were euthanized and underwent postmortem and histopathologic examination. Weight gain, water intake, and urine output were recorded and calculated at two time periods: 24 h before and 24 h after intraperitoneal injection.

Blocking Tests of Rat Nephrotoxicity

The rats were separated into 5 groups. While being given the high doses of toxins described above, the rats were simultaneously administered different doses of dexamethasone (DXM, purity ≥97%, purchased from Sigma-Aldrich, St. Louis., MO, USA): high dose group DXM 50.0 mg/kg + MC-RR 574.7 μg/kg; medium dose group DXM 10.0 mg/kg + MC-RR 574.7 μg/kg; low dose group DXM 2.0 mg/kg + MC-RR 574.7 μg/kg; positive control group DXM 0.0 mg/kg + MC-RR 574.7 μg/kg, and saline control group. Twenty-four hours after administration, urine, blood and body organ samples were taken for biochemical and pathologic measurement and analysis to understand the changes in the structure and function of the kidney and liver.

2.3.2. Continuous Exposure Experiment of MC-RR in Mice for Water Metabolism

Based on the results of single-dose toxicity of MC-RR in mice, a short-term toxicity test was performed to explore the possible impact on water metabolism and related organs. KM mice were randomly divided into 4 groups, with 35 in each group. The mice were fed in metabolic cages, with 7 in each cage in order to collect the urine effectively. The 4 groups were labeled in terms of toxin dosage given: high dose: 140.0 μg/kg; medium dose: 70.0 μg/kg; low dose: 35.0 μg/kg; and physiological saline as negative control. The animals were given intraperitoneal injection daily for 28 days, and continued to be observed until the 42nd day. The animals’ daily weight and drinking and urine volume were recorded. On the 7th, 14th, 28th, 35th, and 42nd days, 7 subjects in each group were sampled and euthanized for toxicological examination, including urinalysis, sodium and potassium ion levels in urine and serum, antidiuretic hormone (ADH) in blood, serum enzymes, kidney and liver weight, and histological examination.

2.3.3. Sample Collection and Process

The urine volumes were pooled and recorded in each metabolic cage. The urine used for urinalysis, including specific gravity, Na+ and K+, was collected directly from the bladders. Blood samples were obtained from the optical orbits of the animals. The blood was naturally clotted and then centrifuged at 2500× g at 4 °C for 10 min to harvest the serum for following analysis. After blood collection was finished, the animals were euthanized to sample the organs, such as kidneys and liver. The organs were weighed and fixed in 4% polyformaldehyde for further histological examination.

2.4. Urinalysis

For routine urine and some chemical indices, semiquantitative colorimetric reagent strips (dry chemical method) (Acon, Hangzhou, China) were used for detection in urine. Urine specific gravity (USG) was determined using a LSUD-digital urinometer (Guangzhou Mingrui Electronic Technology Co., Ltd, Guangzhou, China).

2.5. Detection of Na+and K+ Levels in Urine and Blood

The urine and blood samples were diluted 200- and 100-fold, respectively, using deionized water prior to instrument detection for Na+ and K+ concentration. Samples were analyzed by an AA240Fs fast sequential atomic absorption spectrometer (Agilent, Santa Clara, CA, USA) coupled with flame atomization and sodium and potassium hollow cathode lamps with the current operating at 5 mA and air/C2H2 as gas form. The instrument working conditions were as follows: wavelength for sodium 589.6 nm, slit width 0.2 nm; wavelength for potassium 769.9 nm, slit width 1.0 nm.

2.6. Serum Biochemical Index Assay

A Mindray BS-200 Chemistry Analyzer (Shenzhen Mindray Bio-Medical Electronics Co., Ltd., Shenzhen, China) was applied for serum index detection, including albumin (ALB), alkaline phosphatase (ALP), alanine aminotransferase (ALT), glutamic oxaloacetic transaminase (aspartate aminotransferase, AST), creatinine (CREA), serum lactate dehydrogenase (LDH), glucose (Glu), total cholesterol (TC), total protein (TP), uric acid (UA), and urea nitrogen (BUN). ADH was measured using ELISA kits (Anoric Bio-technology Co., Ltd., Tianjin, China) according to the manufacturer’s instructions.

2.7. Histopathological Examination

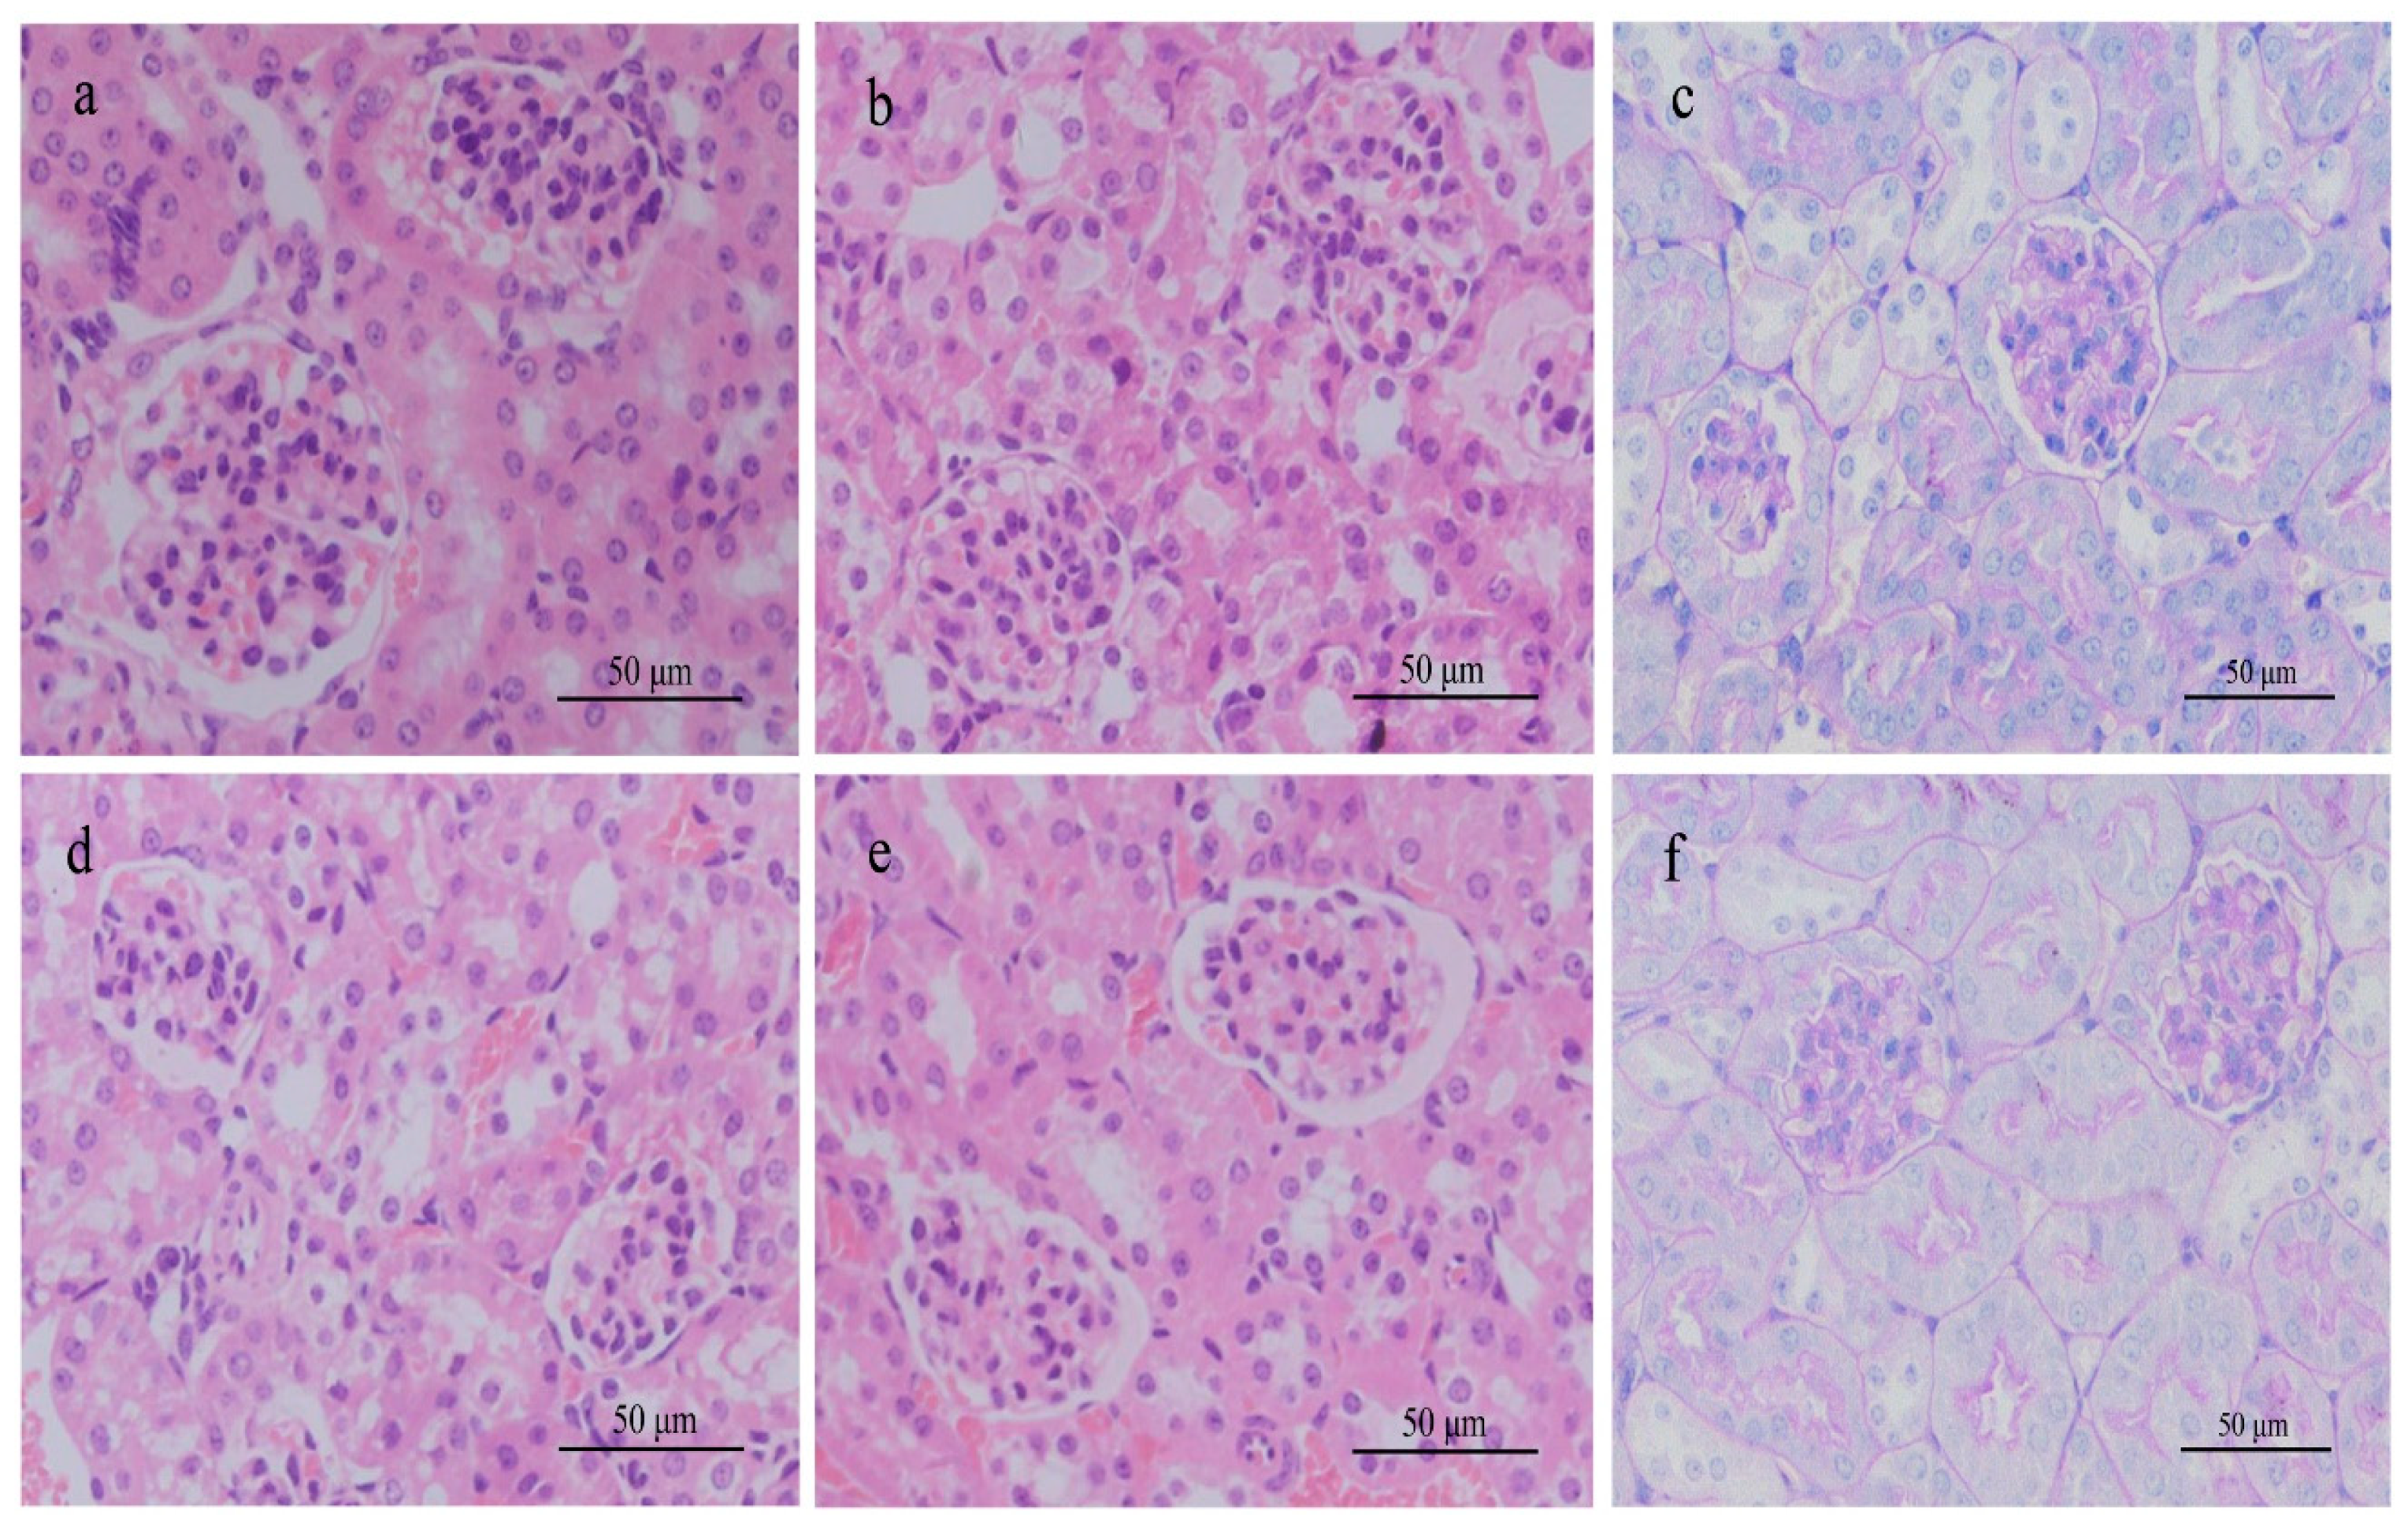
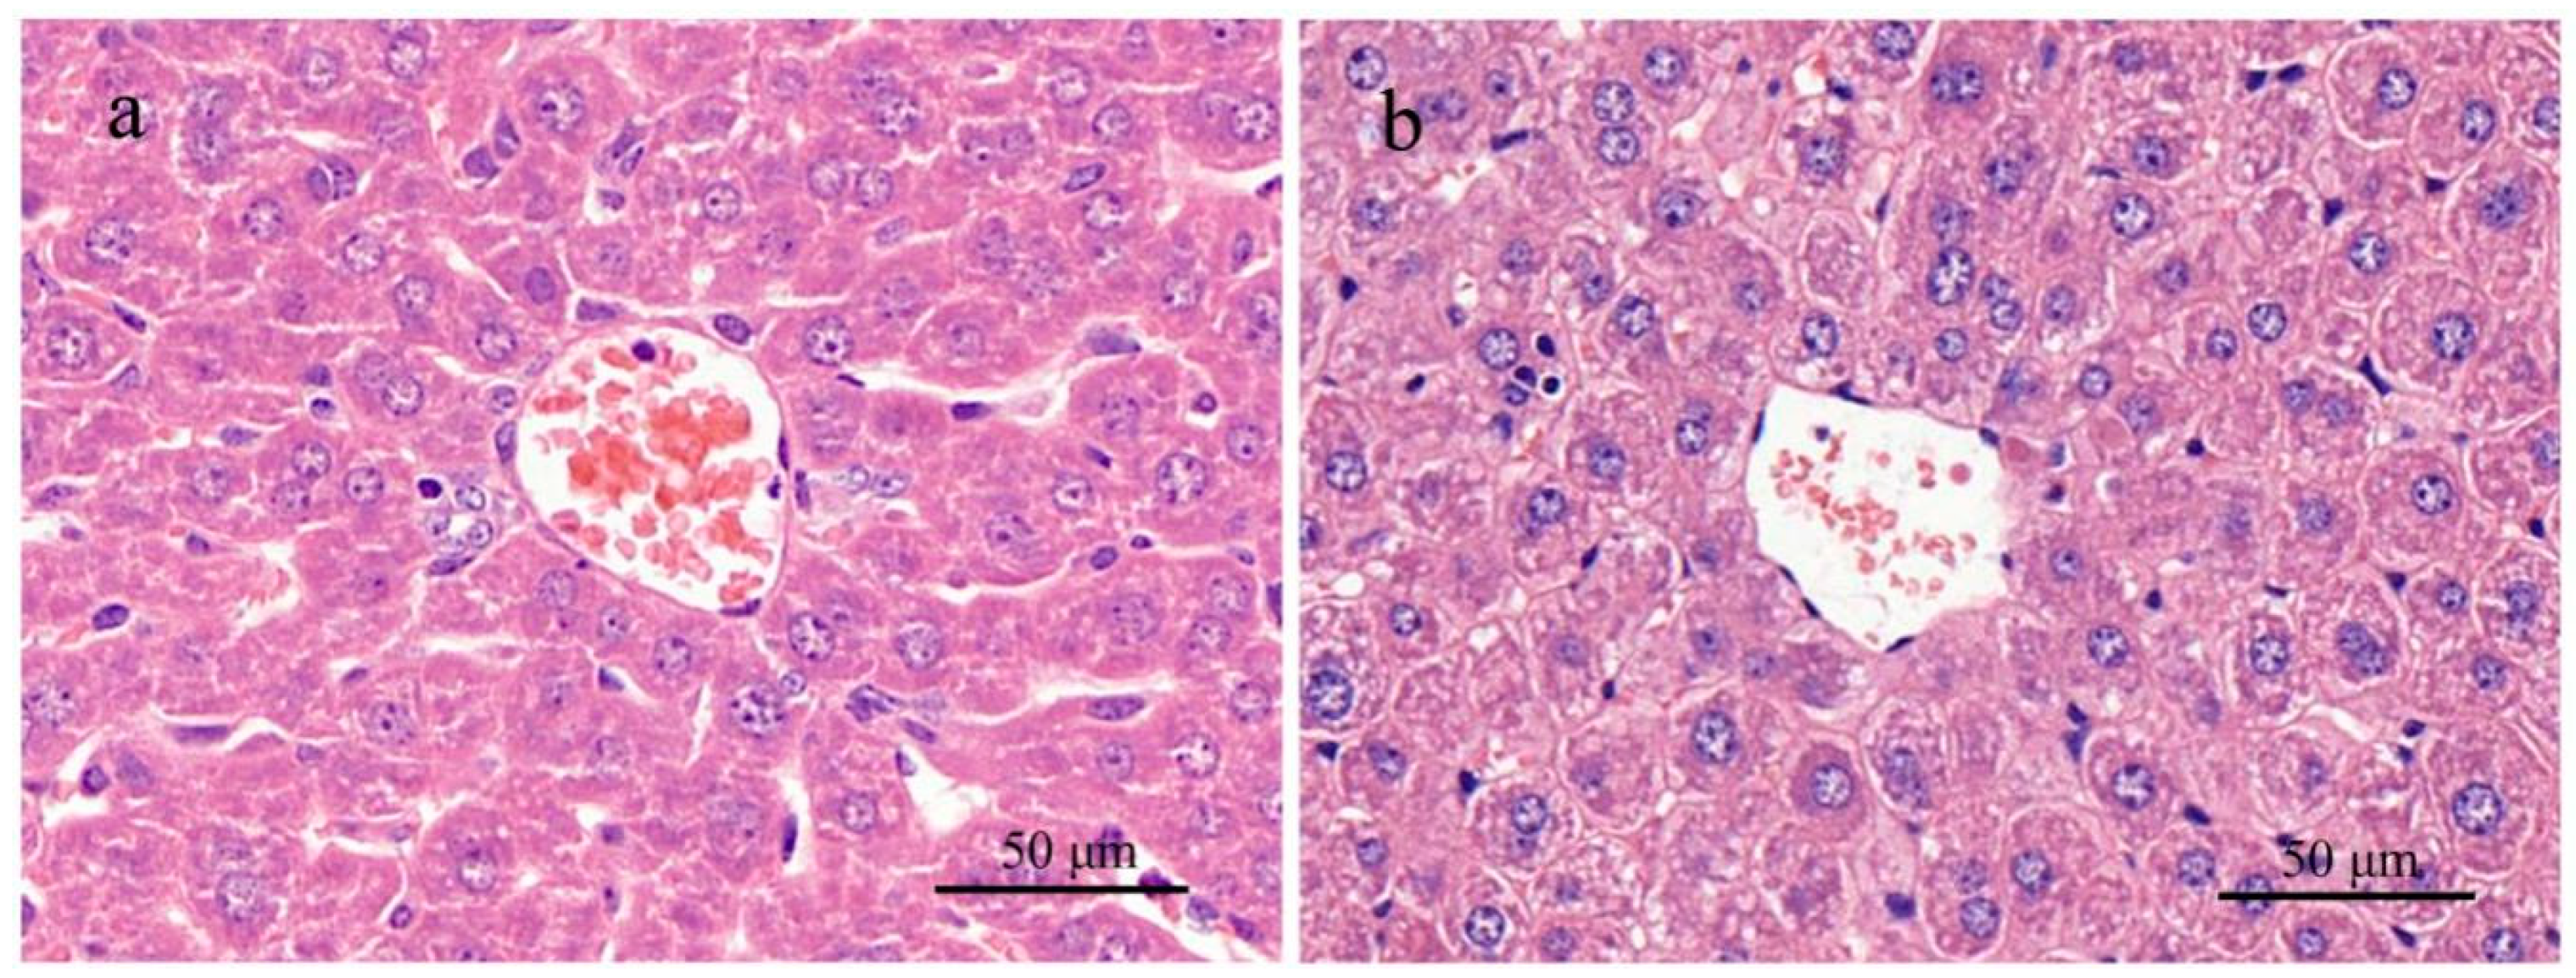
The kidney and liver tissues fixed by polyformaldehyde were embedded in paraffin, cut to a thickness of 2 µm, stained with hematoxylin-eosin (HE), and examined using a light microscope. Periodic acid-Schiff (PAS) stain was applied to the kidney tissues to observe histological changes in glomerular mesangium, or basement membrane.

2.8. Statistical Analysis

Statistical analysis was performed with SPSS for Windows software version 19.0 (SPSS Inc, Chicago, IL, USA). The homogeneity of variances was tested using Levene’s test. One-way analysis of variance (ANOVA) was used for homogeneous data, followed by Dunnett’s test, and Dunnett’s T3 test was performed to compare the heterogeneous data. p < 0.05 was considered to be significant.

3. Results

3.1. Changes of Water Metabolism in Rats and Mice after Single-Dose Administration of MC-RR

3.1.1. Water Intake, Urine Output

The urine output of the rats started to increase 6 h after administration of a high-dose of MC-RR (574.7 μg/kg). Gross hematuria appeared 12 h later and urine volume was significantly on the rise at 24 h. Other dosage groups did not show apparent alterations in urine output compared with the control group. Regarding water intake, no notable difference was observed in the rat groups except for a slight increase in the high-dose MC-RR group. As for the mouse subjects, water intake and urine excretion displayed similar volume levels between exposed groups and the control group (Table 1).
DXM had the effect of alleviating the abnormal output of urine. There was a dose-dependent effect of DXM in countering the symptoms of polyuria, in which the urine output of rats in the high dose group (DXM 50.0 mg/kg + MC-RR 574.7 μg/kg) almost approached the levels of the saline control group (Table 1).

3.1.2. Behavior and Weight

Both rats and mice gradually went into a lethargic state after administration of high doses of MC-RR. Other symptoms included anorexia, cold limbs, etc. As seen in Table 1, the weight gain of the rats in the high-dose group sharply declined with statistical significance compared with the saline control group. Various amounts of DXM were able to reverse the weight loss of the rats in the high-dose group. The weight gain of rats in the DXM + MC-RR groups increased with the DXM dosage. Significant differences were shown in the weight gain of the groups given 10.0 and 50.0 mg/kg of DXM compared with the group given 574.7 μg/kg MC-RR (0.0 mg/kg DXM). Nevertheless, the body weights of the mice in each group did not change much, with no statistical difference between them.

3.1.3. Urinalysis

Urinalysis showed a notable increase in urobilinogen, microalbumin, protein, and creatinine in the rats administered high-dose MC-RR. Occult blood and ketone were also detected, and the leukocyte count was much higher than that of the control group. Uric calcium and pH value were lower than normal ranges. Even in the medium-dose group of rats, urine protein displayed a rising trend accompanied by occult blood. However, no abnormal phenomena occurred in rats in the low-dose group. Under intervention with different levels of the DXM, all of the above indices (urobilinogen, microalbumin, protein, and creatinine) in the high-dose MC-RR groups tended to return to normal in a dose-effect manner, as shown in Table 2. In contrast, the urine indices for mice in any treated group showed no apparent differences with those of control.
The concentration of Na+ in urine in all groups of rats exposed to MC-RR were prominently higher than the control group (p = 0.000 for 574.7 μg/kg MC-RR group; p = 0.000 for 287.3 μg/kg MC-RR group; p = 0.001 for 143.7 μg/kg MC-RR group), showing a dose-response effect (Table 3). However, the levels of K+ in urine in all exposed groups of rats were lower than the control group (p = 0.000 for 574.7 μg/kg MC-RR group; p = 0.000 for 287.3 μg/kg MC-RR group; p = 0.003 for 143.7 μg/kg MC-RR group). On the other hand, the concentrations of Na+ and K+ in the urine of mice showed no differences between overall treated groups and the control group (p = 0.271 and 0.270, respectively).
From Table 4, it can be seen that the USG in rats in high dose group decreased slightly, while no statistical differences in USG have been observed between the test groups and the control groups either in rat or mice (rat p = 0.092; mouse p = 0.156).

3.1.4. Serum Biochemical Indices in Rats and Mice in Single-Dose Toxicity Test

Serum biochemical analyses indicated that the UA in rats went down in high-dose group with statistical significance in comparison with the control in rats (p = 0.000). No significant differences were found in kidney indices of mice.
The ALT, AST, ALP, and LDH levels in rats in the high-dose group were significantly higher than those of the control group (p = 0.001, 0.000, 0.000, and 0.001, respectively). The ALT and AST of rats in the medium-dose group also increased compared with the control (p = 0.000). Regarding mice exposed to high-dose MC-RR, the ALT, AST, ALP, and LDH levels increased more than the control (ALT, AST, ALP p = 0.000; LDH p = 0.001). No changes in these indices in the low-dose group were observed.
The results indicate that a high dose of the toxin could cause damage to target organs such as the liver in both animals within 24 h. Using DXM to counter the toxicity could result in significantly lower serum indices (ALT, AST, ALP, and LDH) in tested animals in a dose-effect manner compared to the high-dose MC-RR group (Table 5).
Two inorganic elements in blood, Na+ or K+, were also measured in rats and mice. The Na+ in blood of rats in the high- and medium-dose groups was lower than the control (p = 0.000 and 0.022, respectively), whereas the K+ level in the high-dose group was higher than the control (p = 0.001). Such abnormal alterations in Na+ and K+ in the low-dose rat group and overall mouse groups were not observed (Table 3).

3.1.5. Visceral Coefficients of Rats and Mice in Single-Dose Toxicity Test

There were some increases in the kidney/body and liver/body coefficients of the high-dose rat group, but there was no statistical significance compared with the control group. For rats in the medium- and low-dose groups and mice in all groups, no significant differences were observed in visceral coefficients in the detected organs (Table 4).

3.1.6. Histological Examination of Rats and Mice in Single-Dose Experiment

H&E stained sections of rat kidney from the high-dose group showed dilation of the kidney tubules, swollen or balloon-like endothelial cells, necrosis and detachment of cells, lymphatic cell infiltration, and destruction of normal kidney structures (Figure 1). In other toxin-treated groups of rats and all treated groups of mice, histopathological changes were not obvious compared with the control groups, as shown in Figure 1 and Figure 2. In the high-dose toxin experiments with intervention by different amounts of DXM, the low dose of DXM resulted in congestion of blood vessels, slight dilation of kidney tubules (Figure 1f), partial detachment of endothelial cells, and infiltration of inflammatory cells in rat kidney. With medium-dose DXM, infiltration of inflammatory cells could be seen, while with high-dose DXM, the kidney structures in rats were intact without necrosis, similar to the saline group, as shown in Figure 1.
Examined macroscopically, the rat liver in high-dose groups exhibited hyperemic swelling with some hemorrhagic spots. In histological sections stained with H&E, apparent dot necrosis of hepatocytes, swollen or balloon-like hepatocytes, infiltration of inflammatory cells, and sinusoidal dilatation occurred, but cord-like arrangements of hepatic cells remained in parts (Figure 3). Liver sections stained with H&E in the medium-dose rat group showed inflammable cell infiltration. However, no significant histopathological changes were observed for the low-dose group. In contrast, histological sections stained with H&E from mice in the high-dose group displayed an enlarged texture of the liver compared to the saline control group. Under an optical microscope, sinusoid expansion, cellular swelling, and infiltration of inflammatory cells could be seen, but the hepatic cord remained intact (Figure 2). In sections from mice given a medium dose, only inflammatory cell infiltration was observed. No abnormal changes were found in sections from mice given a low dose.

3.2. Changes of Water Metabolism in KM Mice under the Continuous Exposure to MC-RR

3.2.1. Water Intake and Urine Output

As shown in Figure 4a, the water intake of mice in the high-dose group rose on the ninth day and increased more quickly than that of other groups. The intake dropped abruptly on day 30 after the toxin was stopped, and returned to the average levels of the other groups until day 34. Mice in the medium- and low-dose groups did not show obvious differences in water intake compared with the physiological saline group.
The urine output in the high-dose group began to rise on day 8 and went up day-by-day until the toxin was stopped. Then the urine volume declined and was back to levels similar to the control group. Urine excretion in the other groups did not display significant alterations compared with the control, as seen in Figure 4b.

3.2.2. Body Weight

The body weight gain of mice in the high-dose group started to decline clearly on day 9 and these mice continued to lose more than other groups until the toxin was stopped. After the toxin was stopped, the weight of the mice gradually went back to normal (Figure 4c).

3.2.3. Urinalysis

Na+ and K+ Content in Urine

The levels of Na+ and K+ in mouse urine are shown in Table 3. Two ion concentrations in the high-dose group were much lower than those of other treated groups (p = 0.000), while the urine Na+ and K+ levels in the medium- and low-dose groups stayed at similar levels to those of the control. Fourteen days after suspension of treatment (day 42), the urine levels of Na+ and K+ in the high-dose group returned to normal and no longer showed any statistical difference with other groups and the control.

Components Detected in Urine

Detection using semiquantitative colorimetric reagent strips for all tested groups demonstrated that the main items in urine, including leukocytes, occult blood, glucose, urobilinogen, hemoglobin, albumin, microalbumin, ketone, ascorbic acid, and nitrite were all negative. Urine creatinine, uric calcium, and pH levels in the toxin treated groups were also within normal ranges.

Urine Specific Gravity

The results in Table 4 show that urine specific gravity in all treated groups varied little within the first week, but dropped down in the high-dose group at 2 to 3 weeks, significantly different from the other groups (p = 0.000). Meanwhile, the urine specific gravity in the medium- and low-dose groups remained stable, showing no statistical difference with the control. After suspension of the toxin, the urine specific gravity in the high-dose group bounced back and did not show any statistical difference between other treated groups and the control group in the following week.

3.2.4. Serum Index Analysis

The interval sampling and examination of serum enzyme activity from tested subjects are shown in Table 6. TP, UA, and BUN did not show any significant changes in any groups during the overall experiment. CREA in the high-dose group decreased on the 28th day (p = 0.035) and went back to normal on days 35 and 42. In the high-dose group, ALT levels in mice were obviously higher than in other treated groups and kept going up with repeated administration. Seven days after the toxin was suspended, the ALT in the high-dose group started to decline, but was still higher than the control group (p = 0.000). Up to 14 days later, on day 42, the ALT in the high-dose group returned to normal, with no statistical difference compared with the control (p = 0.985). On the 28th day of the experiment, the ALT in the medium-dose group was found to be higher than that of the saline group (p = 0.000). Once the toxin was stopped, the ALT in the medium-dose group soon went back to normal. The enzyme AST in the high-dose group went up slightly over 1 to 2 weeks but without significant statistical difference compared with the physiological saline group. On day 28, AST in the high-dose group exhibited significantly higher levels than the control group (p = 0.000). Even after the toxin was suspended, AST in the high-dose group was still above the control level (p = 0.002). AST in the medium- and low-dose groups did not show any statistical differences with the control group. The enzyme ALP in mice in the high-dose group rose in the second week of the experiment, clearly above the other groups. When the exposure was stopped, ALP in the high-dose group went down but maintained a level above the control group. On days 14 and 28, TC in the high-dose group rose, showing a significant difference with the control group (p = 0.000 for the two days), whereas GLU decreased (p = 0.000 for the two days). Both TC and GLU returned to normal levels after the toxin was stopped. In addition, ALB in the high-dose group decreased on day 28 and went back to normal when the administration was suspended.
The serum levels of Na+ and K+ in various treated mouse groups did not show significant differences between each other and the control group, as shown in Table 3. The ADH in the blood of mice in the high-dose group was higher than that of the control on day 14 (p = 0.037) and day 28 (p = 0.000). When exposure to the toxin was stopped, blood ADH in the high-dose group went back to normal on day 35, and did not show statistical difference with the control any more. Throughout the experiment, there were no significantly statistical differences in ADH between the medium- and low-dose groups and the control group (Table 7).

3.2.5. Visceral Coefficients

In the whole experiment, the kidney visceral coefficient in all tested mice in any group did not show significant differences. The autopsies of the subjects on days 14 and 28 showed that the liver visceral coefficient in the high-dose group increased compared to the control (p = 0.004, p = 0.000, respectively). After administration was stopped, the liver visceral coefficients returned to normal. A significant increase in liver visceral coefficient in the medium-dose group was seen on day 28, but no statistical differences were found in the low-dose group (Table 4).

3.2.6. Histopathologic Alteration

In both HE and PAS stained sections of mouse kidneys (Figure 5), kidney microstructure was intact and clear for all tested groups. No significant lesions were detected on these kidneys in histology. In the HE stained section of mouse liver of the high-dose group, cellular swelling, ballooning changes, sinusoidal dilation, and infiltration of inflammatory cells were present on day 28 of treatment, as shown in Figure 6. For the medium- and low-dose groups, hepatic histopathologic changes were not found.

4. Discussion

As we know, microcystins are hepatoxins that have been confirmed in many species and reported in a number of studies [14,39,40,41,42]. Some papers have reported that the toxins also targeted other organs of tested animals [24,43,44,45]. However, more data are needed to support firm conclusions on the toxicity to other organs, such as kidneys. The kidney is a critical organ to keep water metabolism normal. Abnormal water metabolism is often identified by water intake and output, and attributed to kidney injury. However, water metabolism is a complicated process that involves several organizational systems. Kidney injury is not the only way to change water metabolism. Previous studies had various conclusions on the nephrotoxicity of MCs, but paid less attention to water metabolic changes. In the present study, the effects of MC-RR on water metabolism and the relevant nephrotoxicity in the two animals (SD rats and KM mice) were examined and compared at the same time.
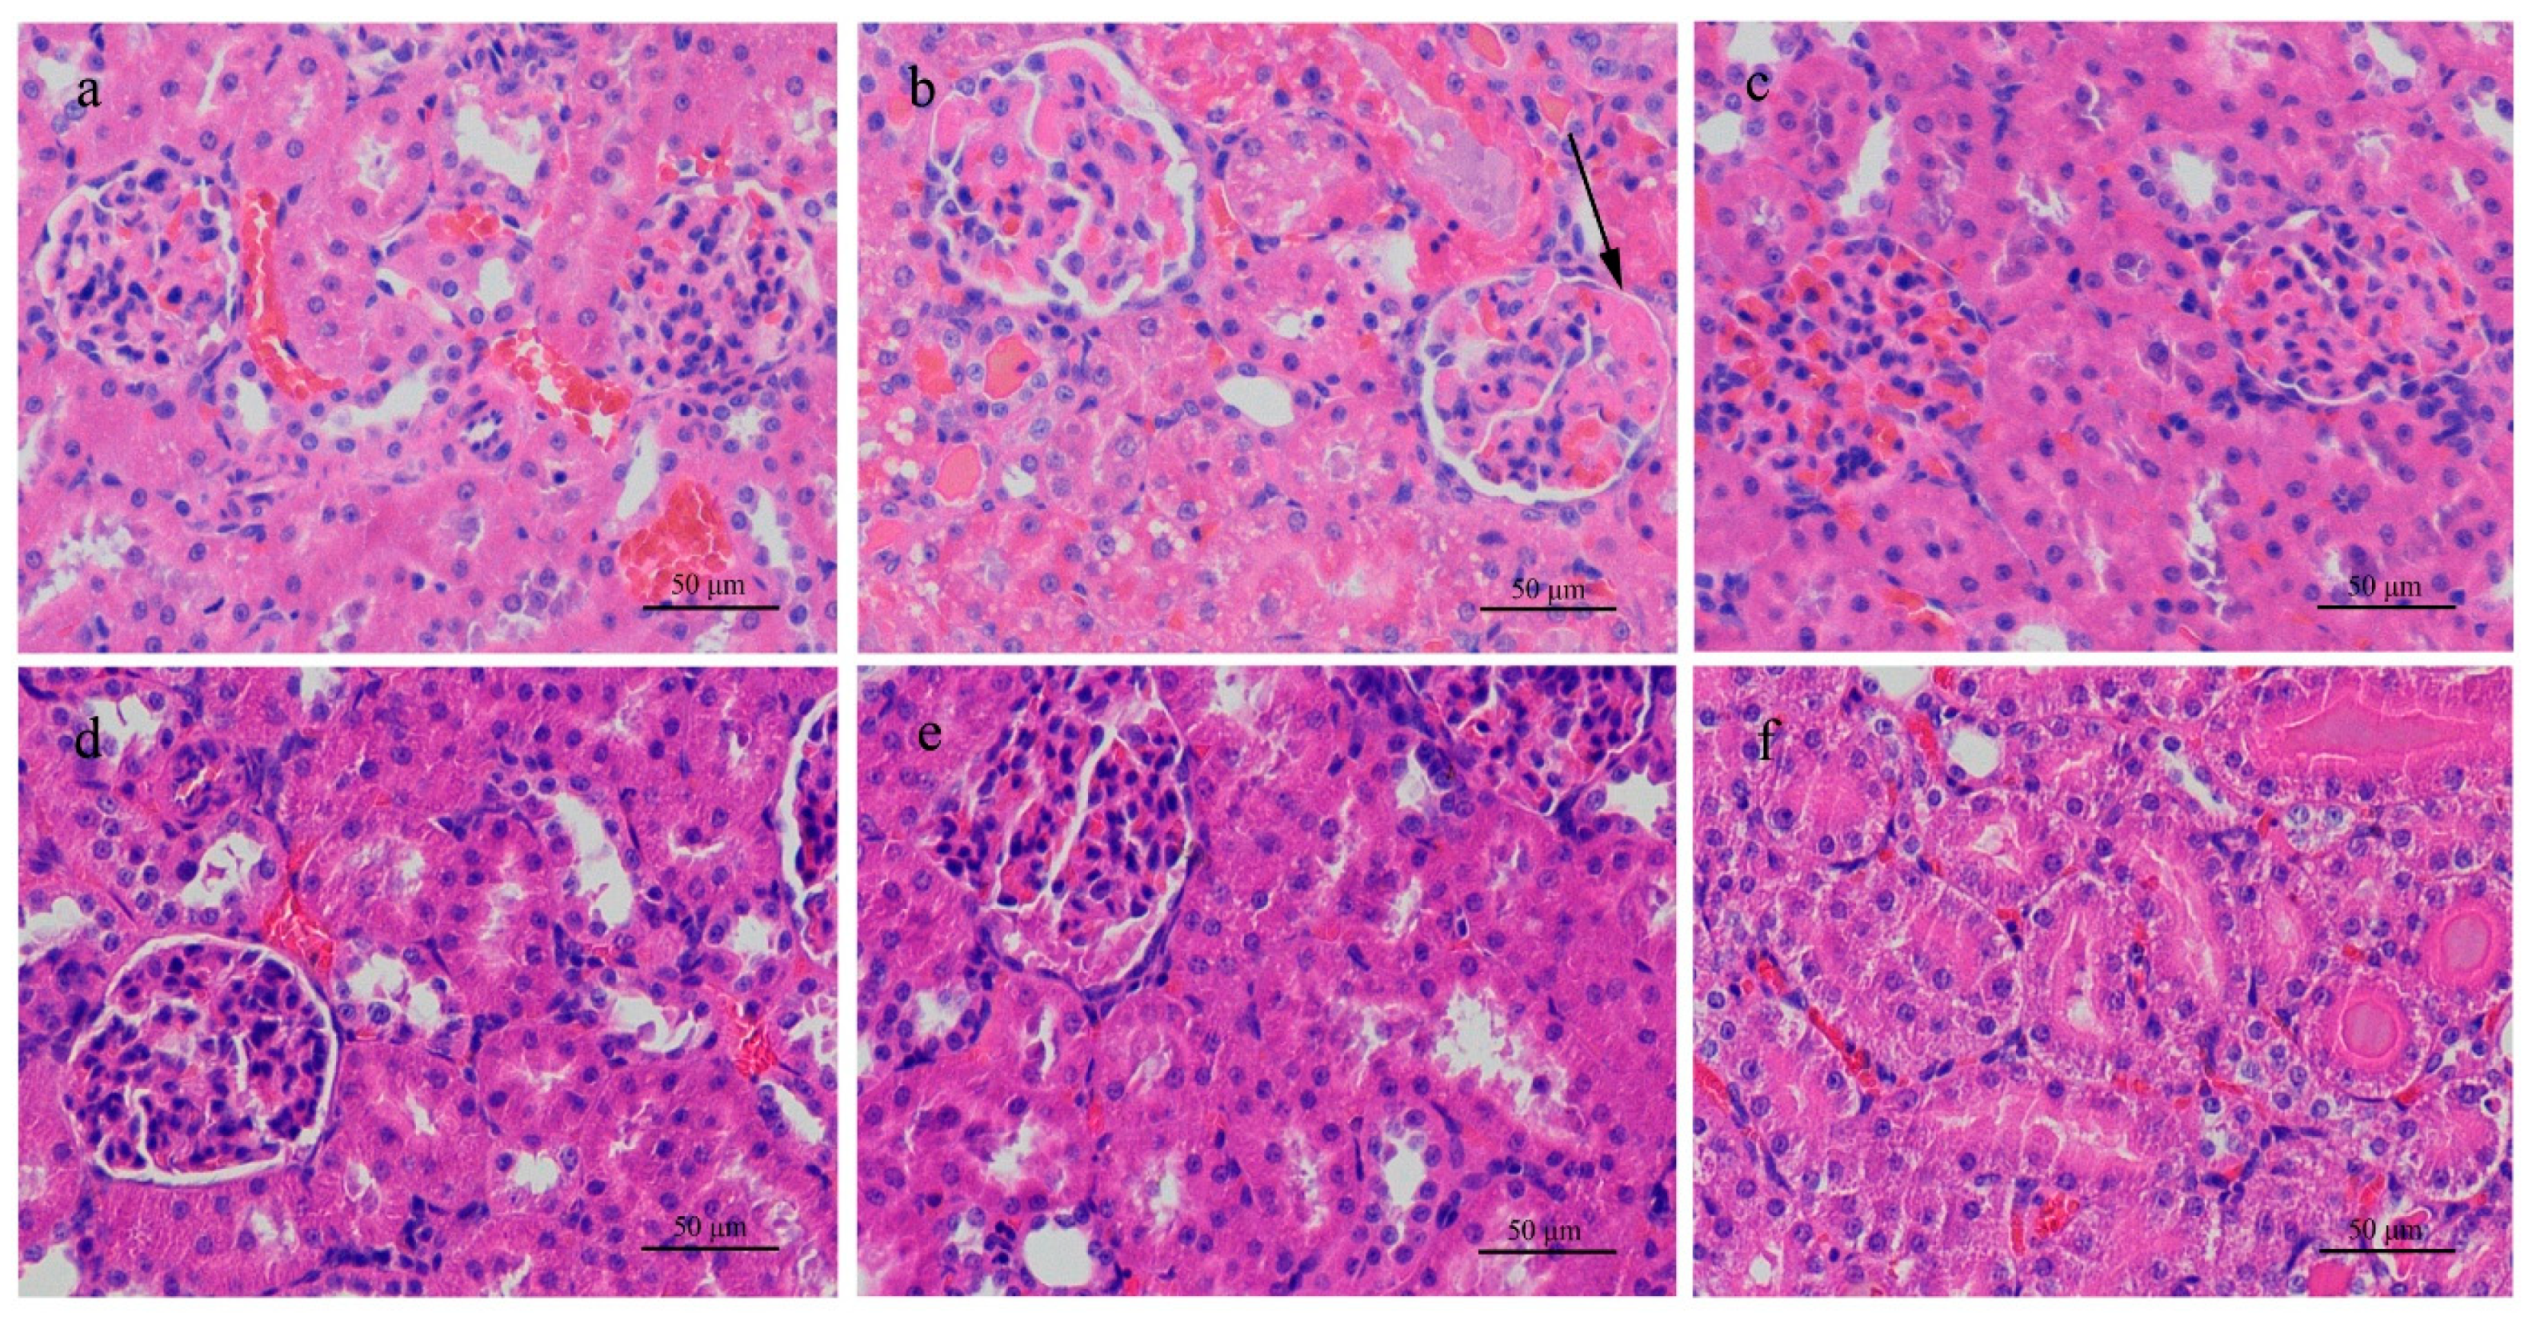
In the single-dose test, the highest dose of the MC-RR was 3/4 LD50 with which we could better observe possible nephrotoxicity and avoid the death of the subjects. Both animals were sensitive to the given toxin and showed a series of pathological changes within 24 h. For example, rats administered 574.7 μg/kg of MC-RR (high dose) showed abnormal behaviors, such as lethargy state and anorexia. However, only rats in the high-dose group showed abnormal water metabolism, polyuria, and polydipsia. The slowed down weight gain in this group was mainly attributed to the increased urine excretion 6 h after administration started and loss of appetite. Together with the unusual urinary excretion, gross hematuria appeared in rats 12 h after administration. This means that damage might be present in the urinary system.
Further urinalysis showed a notable increase in bilirubin/urobilinogen, microalbumin, protein, and creatinine in rats given a high dose, suggesting that the toxin injured both the liver and kidney. The increased bilirubin/urobilinogen in urine came from the liver damage and the increased microalbumin, protein, and creatinine in urine pointed to kidney injury. The histologic examination strongly supported this judgment. Kidney sections stained with H&E from high-dose rats demonstrated various histopathologic changes, such as necrosis and detachment of cells, and destruction of normal kidney structures. Milutinović’s research reported damage to the kidney cortex and medulla of rats with a long-term MC-LR and MC-YR treatment in a single low dose [25]. Although the kinds of MC and the experimental method in Milutinović’s study differ from this study, kidney damage was observed after MC treatment in both. The kidney tubule is the place where water and salt reabsorption occur [46]. Damage to the kidney tubules resulted in polyuria and high Na+ with low K+ in urine in this study, especially in the high-dose group. Serious polyuria then caused the polydipsia.
In the medium-dose (287.3 μg/kg) group of rats, urine protein and occult blood were detected with histologic alteration of inflammable cell infiltration, but such toxic effect was definitely mild compared to the high-dose group. Although the symptoms and histopathologic changes were not observed in rats given the low dose (143.7 μg/kg) group, the abnormal higher concentration of Na+ and lower K+ in urine found in this group may be more sensitive indices that reflected the early or slight damage of the kidney by MC-RR. Within 24 h, from clinical symptoms to histopathology and laboratory analysis, all examination evidence proved that the rat kidneys were targeted by high, medium, and low doses of MC-RR to some extent. These results are similar to Lowe’s report, in which he used only a single dose of MC-LR to observe the nephrotoxicity [
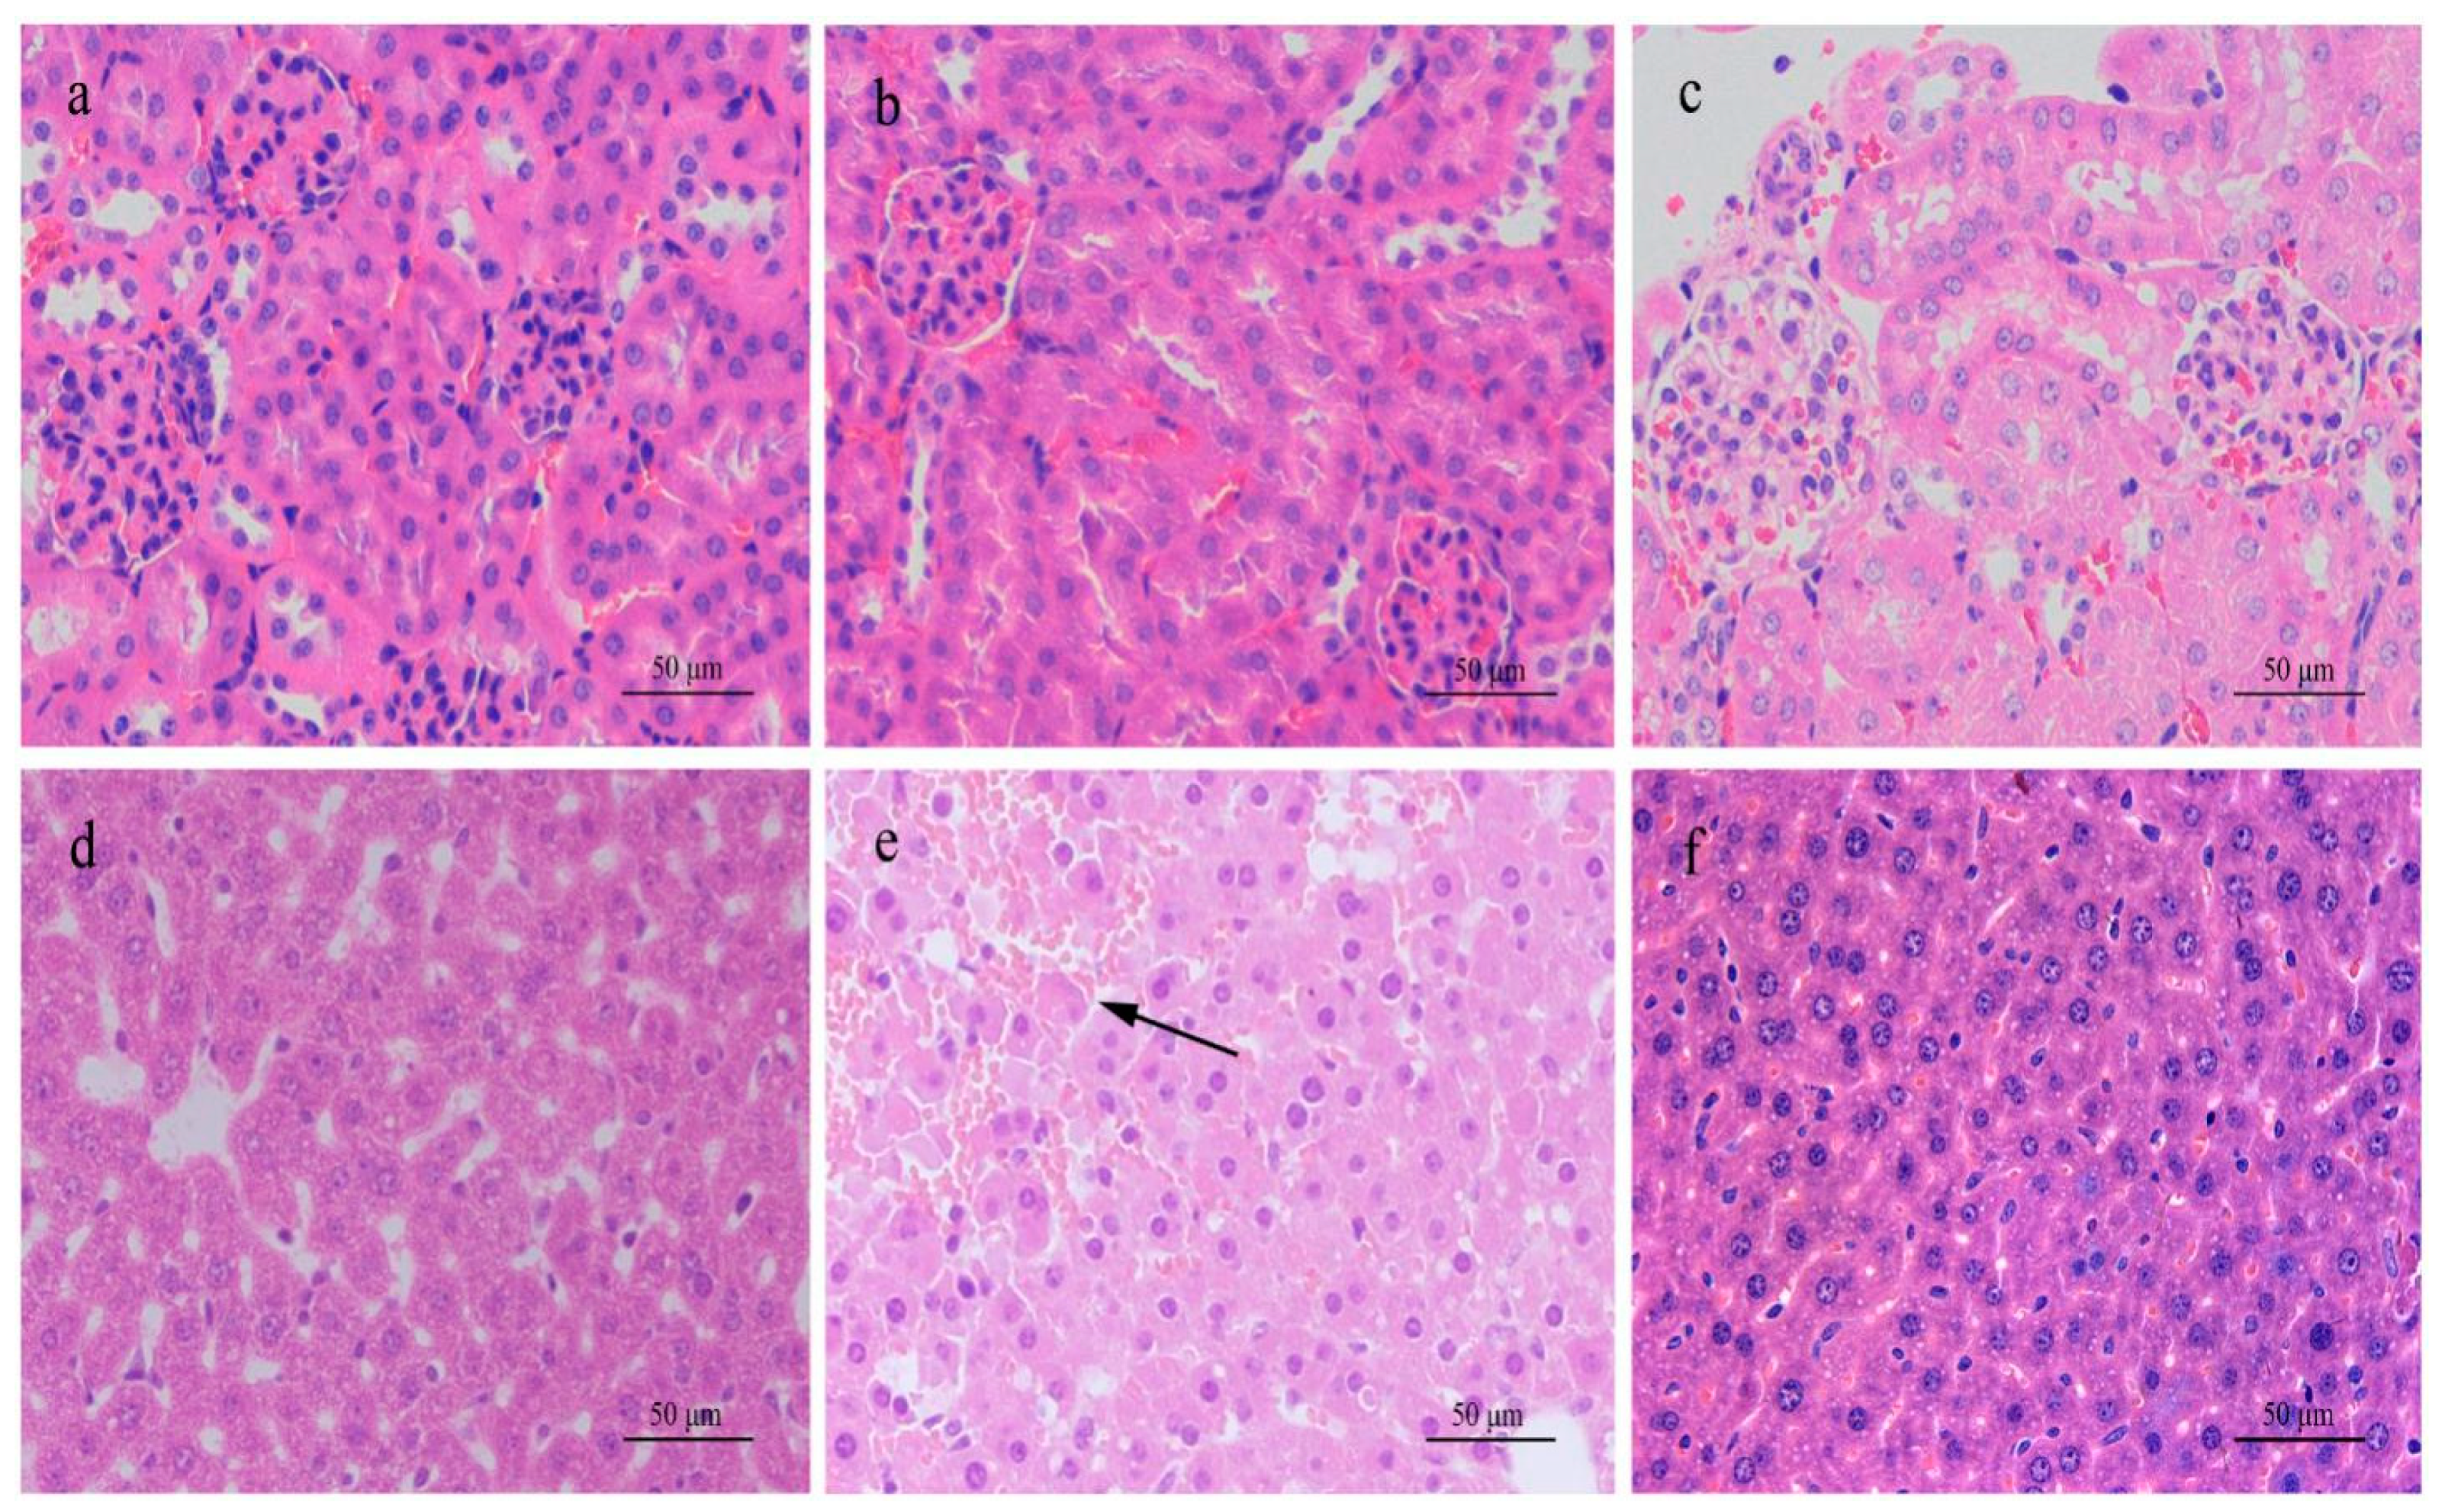
47]. Although the toxin and dosage used were different between his study and this one, the pathologic changes in rats were similar. In this study, gradient dosages were used so that a dose effect could be observed. However, no dysfunction or pathologic alteration in the mouse urinary system and kidney were observed with any toxin dosage given, whereas liver damage was prominent.
The serologic analysis showed that many key enzymatic activities reflecting the function of the kidney and liver in rats were higher or lower in the high- and medium-dose groups than the control, indicating that the related organs were damaged and the enzymes were released into the blood. For mice, nonspecific enzymes, such as ALT, AST, ALP, and LDH were abnormally in the blood serum in the high-dose group, suggested certain organ damage. Combined with the increased TC and decreased GLU in the high-dose group, the liver injury was mostly confirmed. The histopathologic liver changes in the high-dose group also confirmed liver damage. However, no kidney-related specificity index was found to have an abnormal level in mice. The Na+ in blood of the high-dose rat group was lower and the K+ level was higher than the control. Such a trend echoed their levels in urine, but this urine change could be observed in all rat groups, not exclusively limited to the high dose-group. The Na+ and K+ changes in blood lagged behind those in urine. The large amount of water and Na+ lost from the urine in the high-dose group was the main reason why the changes of Na+ and K+ levels in blood in this group were more obvious than in other groups.
In terms of the pathogenic symptoms and possible mechanisms, the intervention measure, DXM, was used to examine the offset effects on pathogenic phenomena in the present investigation. When different doses of DXM (50.0, 10.0, and 2.0 mg/kg) combined with 574.7 μg/kg of MC-RR was administered to rats, the overall pathologic symptoms and histopathologic lesions were improved, showing a good dose-response relationship. These results suggest that DXM, a universal anti-inflammatory drug, could counter the acute damage caused by MC-RR. From another angle, the polydipsia polyuria relief occuring under DXM administration also suggests that the polydipsia polyuria observed in rats was mainly caused by kidney injury. There was corroboration between this part of the results and Nobre’s study, which reported that the DXM could block the increased glomerular filtration rate and urinary flow caused by MC-LR in the isolated perfused rat kidney [19]. The differences in the kidney effect between rats and mice under single dose MC-RR treatment were obvious and in sharp contrast. Though the high dose for the two animals was 3/4 LD50, the nephrotoxocity was explicit in rats but was not reflected in mice, implying that SD rat kidney is more sensitive than KM mouse kidney to MC-RR exposure. The reasons for this difference in the two animals have not been fully clarified. Previous studies suggested that the MCs enter the cells or tissues through organic anion transporting polypeptides (Oatps), which include several members [43,48,49,50]. The kinds of Oatps distributed in rat and mouse kidneys are not exactly the same [51,52,53,54,55]. Maybe the types and content of Oatps in the two animals’ kidneys are part of the reasons for the different response to MC-RR.
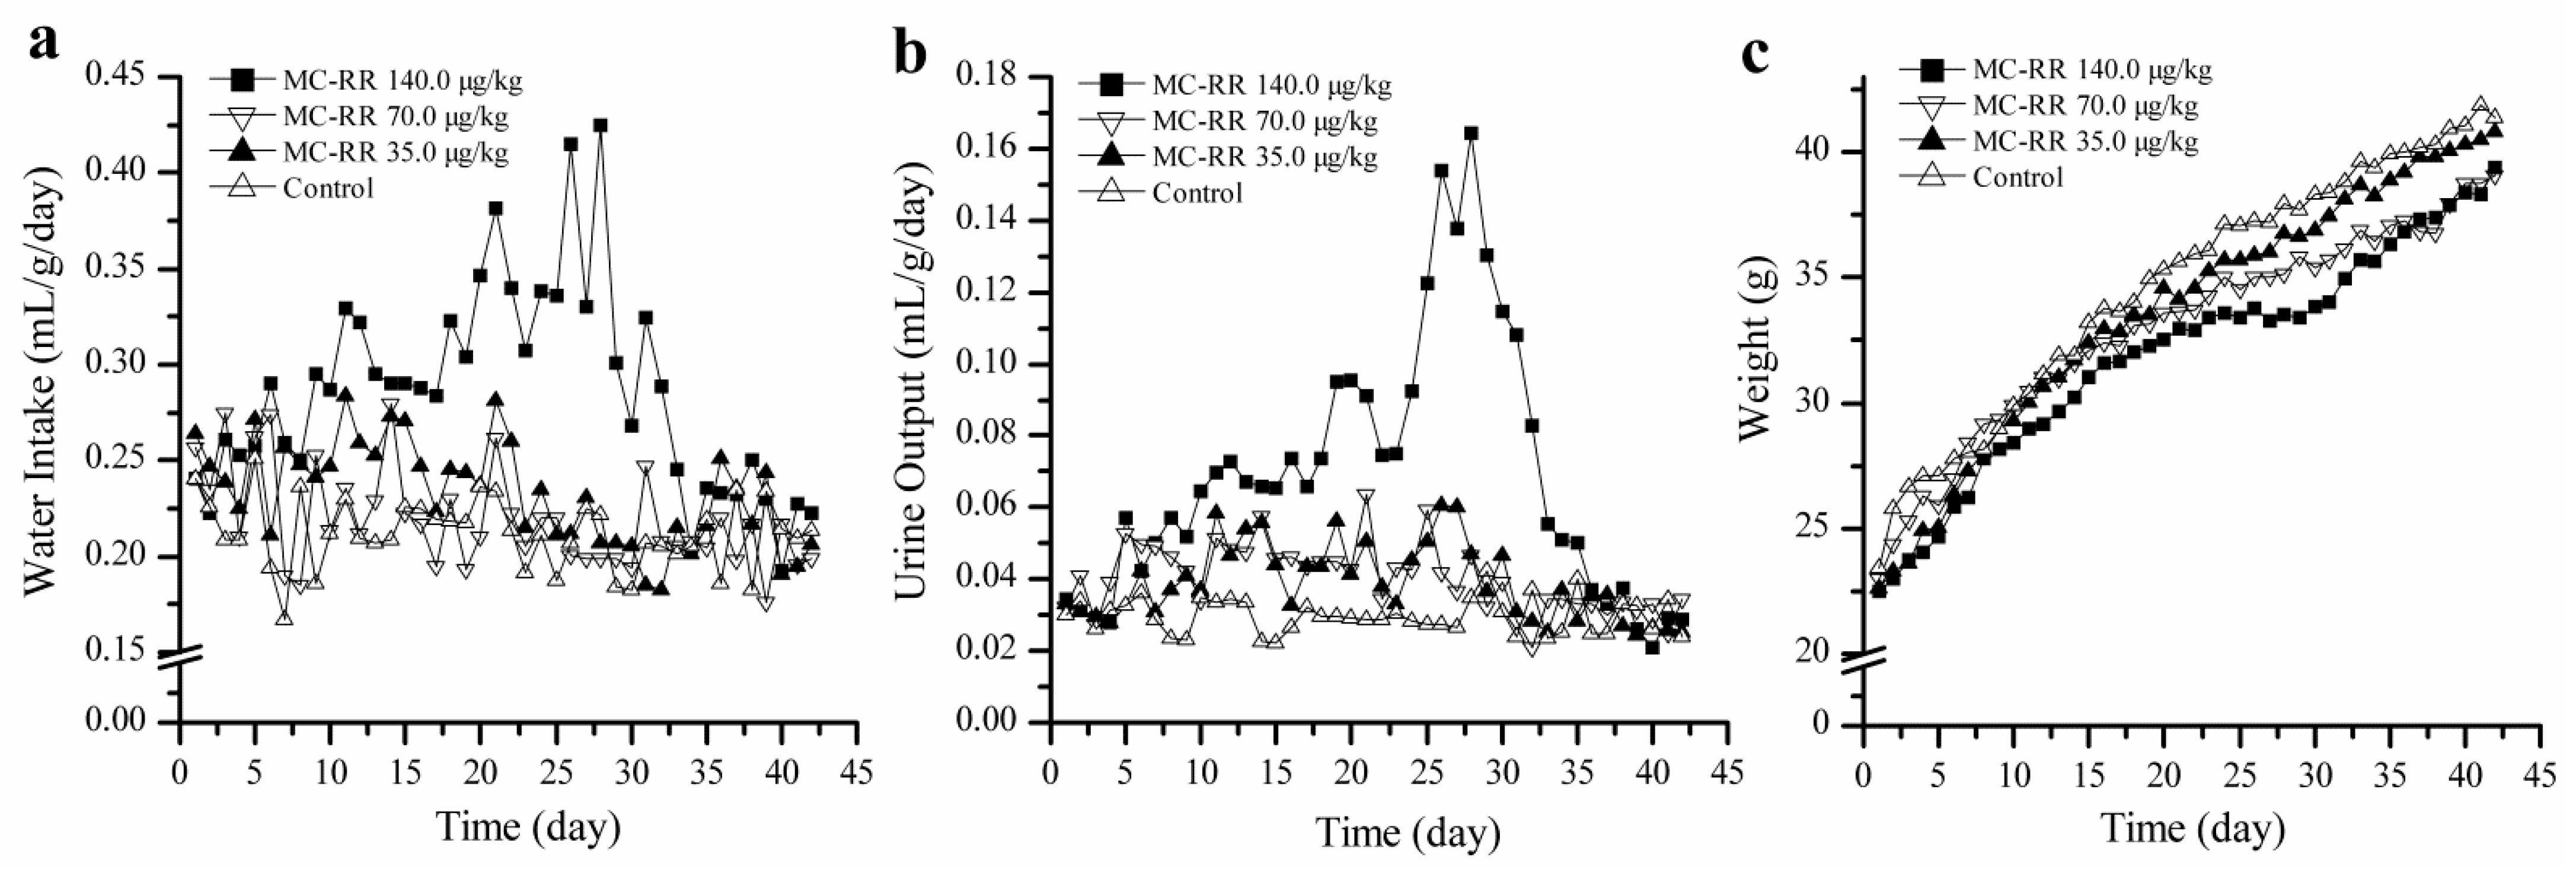
Since abnormal water metabolism in rats was found to be mainly caused by the kidney damage in the single dose toxicity experiment, the continuous exposure test was performed on the mice in the present study. In the continuous exposure experiment, the weight gain of mice in receiving a high dose (140.0 μg/kg) started to slow down on day 9 and water intake increased on the same day, because the urine output was increased on day 8 ahead of the weight loss and increased water intake. The three symptoms became worse with repeated administration until the toxin was stopped on day 29, indicating that there was a problem in water metabolism. It seems that the urinary system and kidney function should be responsible for such pathologic phenomena, since the symptoms were quite like rat intoxication. However, further urine and serum analysis did not support this assumption, because the indices reflecting kidney function in urine and blood were almost all within normal ranges, except specific gravity and levels of Na+ and K+ in mouse urine; in the urine of mice in the high-dose group, they were significant lower than the control simply due to the large volume of urine diluting them.
A different scenario could be seen with rats in this experiment, in that their levels of Na+ and K+ were quite opposite to their abnormal level, caused by kidney damage. The histological examination of mice given a high dose showed that the structure of the kidney under the microscope was intact and well arranged just like the control group. Therefore, the evidence to associate kidney damage with water metabolic dysfunction was not yet found in mice, even though the toxicity test extended to the 42nd day. Hooser and Qin’s research may support this part of the results, that no significant kidney injury was found in mice after MC administration in the acute experiment [56] or long-term exposure [26], although these studies used MC-LR and paid no attention to the related water metabolism. The dysfunction of water metabolism in rats and mice treated with MC-RR was compared for the first time in the present study.
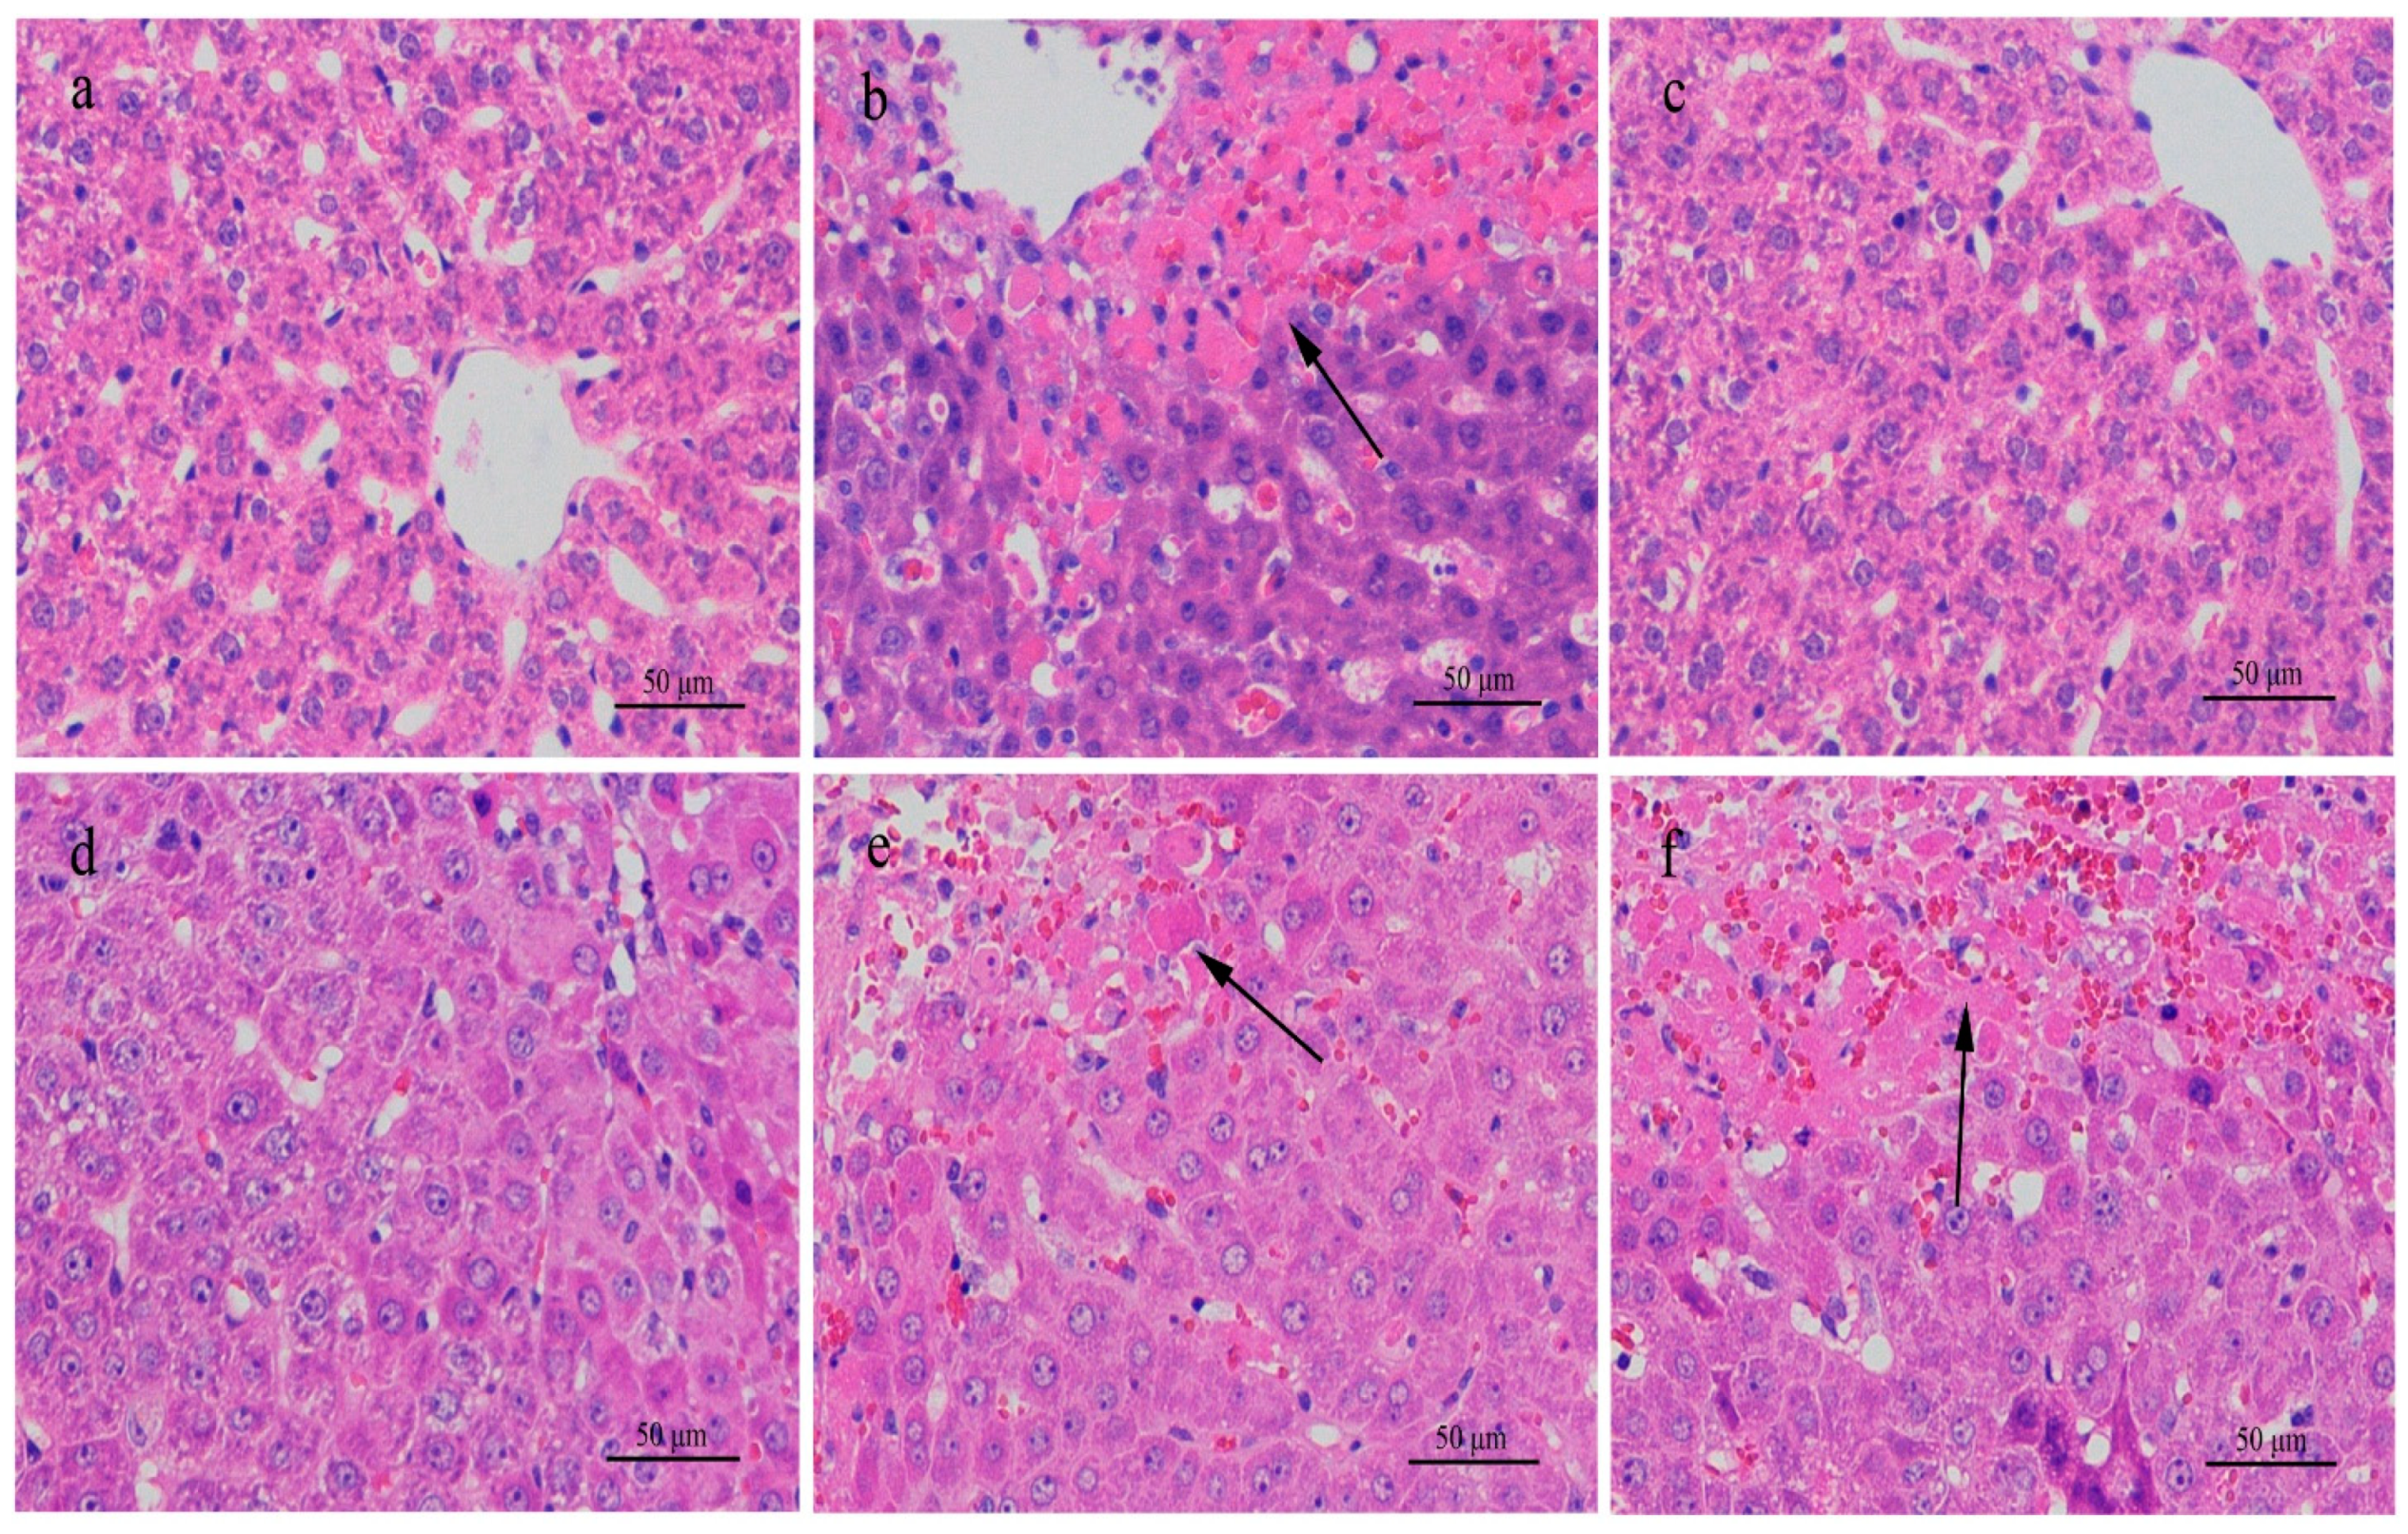
We expected that the toxin would affect the livers of mice in the high-dose group when samples were collected for the first time on day 7, showing increasing serum ALT. Other serum indices (AST, ALP, and TC) started to increase around day 14 and returned to normal or were relieved one or two weeks after administration was stopped on day 29. This trend was also shown in histologic liver changes. When the toxin was given, the liver sections from mice in the high-dose group showed various lesions; however, when the toxin was stopped, the histologic liver changes did not show evident lesions any more. The continuous exposure experiment demonstrated that the liver damage in mice by high-dose toxin was reversible. As long as the mice were not exposed to the MC-RR, all the abnormal values went back to normal levels.
The polydipsia polyuria of the mice in the high-dose group showed the same change trend as the liver damage, suggesting that the abnormal water metabolism was synchronous with the MC-RR exposure and more related to the abnormal liver system rather than the kidney. The changes of ADH in the high-dose group were mainly considered as feedback regulation. Water metabolism involves several organs and systems, not only the kidney [57]. When water metabolism is found to be abnormal, it implies injury to the relative systems. In Zhong’s study, water metabolism dysfunction induced by MC-RR in mice was thought to be caused by liver damage [58]. Zhao’s research reported similar polydipsia induced by MC-LR and attributed the polydipsia to the thyroid dysfunction, but they did not pay attention to the urine volume [59]. Those two reports suggested that the polydipsia was caused by dysfunction of the thyroid or liver, not the kidney. On the other hand, Yi evaluated the influence of chronic exposure to MC-LR on mouse kidney, and found kidney injury after three months [30]. Thus, although the kidney damage indices were not found in our study, the possibility of dysfunction originating from the kidney cannot be easily excluded. The real mechanism of polydipsia polyuria that occurred in mice intoxicated by MC-RR is not yet clear. The normal level K+ in blood indicated that the polydipsia polyuria was not a result of hypokalemia and aldosteronism. The low blood glucose levels and increased ADH in mice also exclude diabetes and diabetes insipidus, which are common causes of polydipsia polyuria [60,61]. The outcomes from the present study offer two possible causes: dysfunction originating in the kidney without parenchymal damage, and liver-related metabolic dysfunction. More extensive and detailed research is needed to find the mechanism.

5. Conclusions

In the present study, possible abnormal water metabolism induced by microcystin-RR in SD rats and KM mice was explored and compared. The results show that rats administered MC-RR intraperitoneally at a dose of 574.7 μg/kg (3/4 LD50 dose) exhibited polydipsia and polyuria with gross hematuria, urinary microalbumin and protein, and histopathologic kidney changes within 24 h. On the contrary, mice administered MC-RR at a dose of 210.0 μg/kg (3/4 LD50 dose) did not display obvious abnormalities in drinking and urination in a single-dose toxicity test. Kidney injury was not demonstrated in mice with negative outcomes by macro- and micro-examination. DXM could neutralize the nephrotoxicity caused by the toxin and effectively alleviate the pathologic kidney symptoms and signs in rats. A continuous exposure experiment was performed on mice for 42 days. Mice receiving 140.0 μg/kg MC-RR daily showed polydipsia polyuria on day 9 that became worse with time. Nevertheless, the water metabolic dysfunction was reversible when administration of the toxin was stopped. The overall examination of the mice, including postmortem, serum enzymes and histopathology, did not show an association of the symptoms with the kidney. The changing patterns of polydipsia polyuria were consistent with liver damage under MC-RR treatment, indicating that some other MC-triggered metabolic pathways or liver-related metabolic route might play a role. In a word, polydipsia and polyuria may be induced by MC-RR in SD rats and KM mice with different causes or metabolic pathways. The SD rat kidney is more sensitive to MC-RR compared with the KM mice kidney. High-dose MC-RR can cause water metabolic dysfunction in rats by damaging the kidney, but cannot affect the drinking volume and urine volume of mice in single-dose exposure. Continuous exposure of high-dose MC-RR can induce abnormal water metabolism in mice without significant kidney injury.

Supplementary Materials

The following are available online at https://www.mdpi.com/1660-4601/18/4/1900/s1, Figure S1: Chromatograms of MC-RR standard (a) and the purified MC- RR (b and c).

Author Contributions

Conceptualization, W.X. and K.G.; Methodology, W.X., F.S., K.G. and Q.Z.; Investigation, W.X., Q.Z., F.S., W.W. and Z.Z.; Validation, F.S., W.X. and W.W.; Data Curation, F.S. and W.X.; Writing–Original Draft Preparation, W.X.; Writing–Review & Editing, K.G. and W.X.; Supervision, K.G. All authors have read and agreed to the published version of the manuscript.

Funding

This research was funded by National Natural Science Foundation of China, grant number 20977038.

Institutional Review Board Statement

The study was conducted according to “Principles of Laboratory Animal Care”, and approved by the Institutional Animal Care and Use Committee Tongji Medical College, Huazhong University of Science and Technology ([2014] IACUC Number: 2413).

Informed Consent Statement

Not applicable.

Conflicts of Interest

The authors declare no conflict of interest.

References

  1. Chen, L.; Giesy, J.P.; Adamovsky, O.; Svirčev, Z.; Meriluoto, J.; Codd, G.A.; Mijovic, B.; Shi, T.; Tuo, X.; Li, S.-C.; et al. Challenges of using blooms of Microcystis spp. in animal feeds: A comprehensive review of nutritional, toxicological and microbial health evaluation. Sci. Total Environ. 2021, 764, 142319. [Google Scholar] [CrossRef]
  2. Bouaïcha, N.; Miles, C.O.; Beach, D.G.; Labidi, Z.; Djabri, A.; Benayache, N.Y.; Nguyen-Quang, T. Structural diversity, characterization and toxicology of microcystins. Toxins 2019, 11, 714. [Google Scholar] [CrossRef] [Green Version]
  3. Nasri, A.-B.; Bouaïcha, N.; Fastner, J. First report of a microcystin-containing bloom of the Cyanobacteria Microcystis spp. in Lake Oubeira, Eastern Algeria. Arch. Environ. Contam. Toxicol. 2004, 46, 197–202. [Google Scholar] [CrossRef] [PubMed]
  4. Mankiewicz, J.; Komárková, J.; Izydorczyk, K.; Jurczak, T.; Tarczyńska, M.; Zalewski, M. Hepatotoxic cyanobacterial blooms in the lakes of northern Poland. Environ. Toxicol. 2005, 20, 499–506. [Google Scholar] [CrossRef]
  5. Znachor, P.; Jurczak, T.; Komárková, J.; Jezberová, J.; Mankiewicz, J.; Kaštovská, K.; Zapomělová, E. Summer changes in cyanobacterial bloom composition and microcystin concentration in eutrophic Czech reservoirs. Environ. Toxicol. 2006, 21, 236–243. [Google Scholar] [CrossRef] [PubMed]
  6. Su, X.; Xue, Q.; Stinman, A.D.; Zhao, Y.; Xie, L. Spatiotemporal dynamics of microcystin variants and relationships with environmental parameters in Lake Taihu, China. Toxins 2015, 7, 3224–3244. [Google Scholar] [CrossRef] [PubMed]
  7. Nishiwaki-Matsushima, R.; Ohta, T.; Nishiwaki, S.; Suganuma, M.; Kohyama, K.; Ishikawa, T.; Carmichael, W.W.; Fujiki, H. Liver tumor promotion by the cyanobacterial cyclic peptide toxin microcystin-LR. J. Cancer Res. Clin. Oncol. 1992, 118, 420–424. [Google Scholar] [CrossRef] [PubMed]
  8. Ito, E.; Kondo, F.; Terao, K.; Harada, K.-I. Neoplastic nodular formation in mouse liver induced by repeated intraperitoneal injections of microcystin-LR. Toxicon 1997, 35, 1453–1457. [Google Scholar] [CrossRef]
  9. Yoshida, T.; Makita, Y.; Nagata, S.; Tsutsumi, T.; Yoshida, F.; Sekijima, M.; Tamura, S.; Ueno, Y. Acute oral toxicity of microcystin-LR, a cyanobacterial hepatotoxin, in mice. Nat. Toxins 1997, 5, 91–95. [Google Scholar] [CrossRef] [PubMed]
  10. Jochimsen, E.M.; Carmichael, W.W.; An, J.; Cardo, D.M.; Cookson, S.T.; Holmes, C.E.M.; Antunes, M.B.; Filho, D.A.D.M.; Lyra, T.M.; Barreto, V.S.T.; et al. Liver failure and death after exposure to microcystins at a hemodialysis center in Brazil. N. Engl. J. Med. 1998, 338, 873–878. [Google Scholar] [CrossRef] [PubMed]
  11. Herfindal, L.; Selheim, F. Microcystin produces disparate effects on liver cells in a dose dependent manner. Mini-Rev. Med Chem. 2006, 6, 279–285. [Google Scholar] [CrossRef] [PubMed]
  12. Ohta, T.; Nishiwaki, R.; Yatsunami, J.; Komori, A.; Suganuma, M.; Fujiki, H. Hyperphosphorylation of cytokeratins 8 and 18 by microcystin-LR, a new liver tumor promoter, in primary cultured rat hepatocytes. Carcinogenesis 1992, 13, 2443–2447. [Google Scholar] [CrossRef] [PubMed]
  13. Frangez, R.; Kosec, M.; Sedmak, B.; Beravs, K.; Demsar, F.; Juntes, P.; Pogacnik, M.; Suput, D. Subchronic liver injuries caused by microcystins. Pflugers Arch. Eur. J. Phy. 2000, 440, R103–R104. [Google Scholar] [CrossRef]
  14. Zhang, Z.; Zhang, X.-X.; Wu, B.; Yin, J.; Yu, Y.; Yang, L. Comprehensive insights into microcystin-LR effects on hepatic lipid metabolism using cross-omics technologies. J. Hazard. Mater. 2016, 315, 126–134. [Google Scholar] [CrossRef]
  15. Rai, A.K.; Chaturvedi, R.; Kumar, A. Proteomic evidences for microcystin-RR-induced toxicological alterations in mice liver. Sci. Rep. 2018, 8, 1310. [Google Scholar] [CrossRef] [Green Version]
  16. Kubickova, B.; Babica, P.; Hilscherová, K.; Šindlerová, L. Effects of cyanobacterial toxins on the human gastrointestinal tract and the mucosal innate immune system. Environ. Sci. Eur. 2019, 31, 31. [Google Scholar] [CrossRef] [Green Version]
  17. McLellan, N.L.; Manderville, R.A. Toxic mechanisms of microcystins in mammals. Toxicol. Res. 2017, 6, 391–405. [Google Scholar] [CrossRef] [Green Version]
  18. Svirčev, Z.; Lalić, D.; Savić, G.B.; Tokodi, N.; Backović, D.D.; Chen, L.; Meriluoto, J.; Codd, G.A. Global geographical and historical overview of cyanotoxin distribution and cyanobacterial poisonings. Arch. Toxicol. 2019, 93, 2429–2481. [Google Scholar] [CrossRef]
  19. Nobre, A.C.L.; Martins, A.M.C.; Havt, A.; Benevides, C.; Lima, A.A.M.; Fonteles, M.C.; Monteiro, H.S.A. Renal effects of supernatant from rat peritoneal macrophages activated by microcystin-LR: Role protein mediators. Toxicon 2003, 41, 377–381. [Google Scholar] [CrossRef]
  20. Khan, S.A.; Ghosh, S.; Wickstrom, M.; Miller, L.A.; Hess, R.; Haschek, W.M.; Beasley, V.R. Comparative pathology of microcystin-lr in cultured hepatocytes, fibroblasts, and renal epithelial cells. Nat. Toxins 1995, 3, 119–128. [Google Scholar] [CrossRef]
  21. Fischer, W.; Dietrich, D. Pathological and biochemical characterization of microcystin-induced hepatopancreas and kidney damage in carp (Cyprinus carpio). Toxicol. Appl. Pharmacol. 2000, 164, 73–81. [Google Scholar] [CrossRef] [Green Version]
  22. Van der Merwe, D.; Sebbag, L.; Nietfeld, J.C.; Aubel, M.T.; Foss, A.; Carney, E. Investigation of a Microcystis aeruginosa cyanobacterial freshwater harmful algal bloom associated with acute microcystin toxicosis in a dog. J. Vet. Diagn. Investig. 2012, 24, 679–687. [Google Scholar] [CrossRef] [Green Version]
  23. Wang, Z.; Li, G.; Wu, Q.; Liu, C.; Shen, J.; Yan, W. Microcystin-LR exposure induced nephrotoxicity by triggering apoptosis in female zebrafish. Chemosphere 2019, 214, 598–605. [Google Scholar] [CrossRef]
  24. Moreno, I.; Pichardo, S.; Josa, A.; Gómez-Amores, L.; Mate, A.; Vazquez, C.M.; Cameán, A.M. Antioxidant enzyme activity and lipid peroxidation in liver and kidney of rats exposed to microcystin-LR administered intraperitoneally. Toxicon 2005, 45, 395–402. [Google Scholar] [CrossRef] [PubMed]
  25. Milutinović, A.; Sedmak, B.; Horvat-Znidarsic, I.; Suput, D. Renal injuries induced by chronic intoxication with microcystins. Cell. Mol. Biol. Lett. 2002, 7, 139–141. [Google Scholar] [PubMed]
  26. Qin, W.; Xu, L.; Zhang, X.; Wang, Y.; Meng, X.; Miao, A.; Yang, L. Endoplasmic reticulum stress in murine liver and kidney exposed to microcystin-LR. Toxicon 2010, 56, 1334–1341. [Google Scholar] [CrossRef]
  27. Jayaraj, R.; Rao, P.L. Protein phosphorylation profile and adduct formation in liver and kidney of microcystin-LR-treated mice. Toxicon 2006, 48, 272–277. [Google Scholar] [CrossRef] [PubMed]
  28. Al-Jassabi, S.; Ahmed, K.-A.; Abdulla, M. Antioxidant effect of curcumin against microcystin-LR-induced renal oxidative damage in Balb/c mice. Trop. J. Pharm. Res. 2012, 11, 531–536. [Google Scholar] [CrossRef] [Green Version]
  29. Xu, C.; Shu, W.-Q.; Cao, J.; Qiu, Z.-Q.; Zhao, Q.; Chen, J.-A.; Zeng, H.; Fu, W.-J. [Antagonism effects of green tea against microcystin induced oxidant damage on liver and kidney]. Zhonghua Yu Fang Yi Xue Za Zhi 2007, 41, 8–12. [Google Scholar] [PubMed]
  30. Yi, X.; Xu, S.; Huang, F.; Wen, C.; Zheng, S.; Feng, H.; Guo, J.; Chen, J.; Feng, X.; Yang, A.F. Effects of chronic exposure to microcystin-LR on kidney in mice. Int. J. Environ. Res. Public Health 2019, 16, 5030. [Google Scholar] [CrossRef] [Green Version]
  31. Berl, T.; Combs, S. Chapter 30—Water metabolism in chronic kidney disease. In Chronic Renal Disease; Kimmel, P.L., Rosenberg, M.E., Eds.; Academic Press: Salt Lake City, UT, USA, 2015; pp. 367–374. [Google Scholar]
  32. Roué, M.; Darius, H.T.; Chinain, M. Solid Phase Adsorption Toxin Tracking (SPATT) technology for the monitoring of aquatic toxins: A review. Toxins 2018, 10, 167. [Google Scholar] [CrossRef] [PubMed] [Green Version]
  33. Gupta, N.; Pant, S.C.; Vijayaraghavan, R.; Rao, P.V.L. Comparative toxicity evaluation of cyanobacterial cyclic peptide toxin MC variants (LR, RR, YR) in mice. Toxicology. 2003, 188, 28. [Google Scholar] [CrossRef]
  34. Miao, H.-F.; Qin, F.; Tao, G.-J.; Tao, W.-Y.; Ruan, W.-Q. Detoxification and degradation of microcystin-LR and -RR by ozonation. Chemosphere 2010, 79, 355–361. [Google Scholar] [CrossRef] [PubMed]
  35. Díez-Quijada, L.; Puerto, M.; Gutiérrez-Praena, D.; Llana-Ruiz-Cabello, M.; Jos, A.; Cameán, A.M. Microcystin-RR: Occurrence, content in water and food and toxicological studies. A review. Environ. Res. 2019, 168, 467–489. [Google Scholar] [CrossRef] [PubMed]
  36. Wu, S.; Wang, S.; Yang, H.; Xie, P.; Ni, L.; Xu, J. Field studies on the environmental factors in controlling microcystin production in the subtropical shallow lakes of the Yangtze River. Bull. Environ. Contam. Toxicol. 2008, 80, 329–334. [Google Scholar] [CrossRef]
  37. Zhang, S.H.; Chang, J.J.; Cao, J.Y.; Yang, C.L. Comparative studies on growth and physiological responses of unicellular and colonial Microcystis aeruginosa to Acorus calamus. Bull. Environ. Contam. Toxicol. 2014, 94, 225–231. [Google Scholar] [CrossRef]
  38. Zhang, Y.; Huang, X.; Xiao, W.; Zhong, Q.; Gu, K. Purification and identification of microcystin-RR. Chin. J. Chromatogr. 2013, 31, 260–263. [Google Scholar] [CrossRef] [Green Version]
  39. Ding, W.-X.; Ong, C.N. Role of oxidative stress and mitochondrial changes in cyanobacteria-induced apoptosis and hepatotoxicity. FEMS Microbiol. Lett. 2003, 220, 1–7. [Google Scholar] [CrossRef] [Green Version]
  40. Huang, P.; Zheng, Q.; Xu, L.-H. The apoptotic effect of oral administration of microcystin-RR on mice liver. Environ. Toxicol. 2010, 26, 443–452. [Google Scholar] [CrossRef]
  41. Sedan, D.; Laguens, M.; Copparoni, G.; Aranda, J.O.; Giannuzzi, L.; Marra, C.A.; Andrinolo, D. Hepatic and intestine alterations in mice after prolonged exposure to low oral doses of Microcystin-LR. Toxicon 2015, 104, 26–33. [Google Scholar] [CrossRef] [PubMed]
  42. Mrdjen, I.; Morse, M.A.; Ruch, R.J.; Knobloch, T.J.; Choudhary, S.; Weghorst, C.M.; Lee, J. Impact of Microcystin-LR on liver function varies by dose and sex in mice. Toxins 2018, 10, 435. [Google Scholar] [CrossRef] [Green Version]
  43. Fischer, W.; Altheimer, S.; Cattori, V.; Meier, P.; Dietrich, D.; Hagenbuch, B. Organic anion transporting polypeptides expressed in liver and brain mediate uptake of microcystin. Toxicol. Appl. Pharmacol. 2005, 203, 257–263. [Google Scholar] [CrossRef] [PubMed] [Green Version]
  44. Zhao, Y.; Xie, P.; Tang, R.; Zhang, X.; Li, L.; Li, D. In vivo studies on the toxic effects of microcystins on mitochondrial electron transport chain and ion regulation in liver and heart of rabbit. Comp. Biochem. Physiol. C Toxicol. Pharmacol. 2008, 148, 204–210. [Google Scholar] [CrossRef] [PubMed]
  45. Žegura, B.; Gajski, G.; Straser, A.; Vrhovac, V.G.; Filipic, M. Microcystin-LR induced DNA damage in human peripheral blood lymphocytes. Mutat. Res. Toxicol. Environ. Mutagen. 2011, 726, 116–122. [Google Scholar] [CrossRef] [PubMed]
  46. Feher, J. Chapter 7.4—Tubular reabsorption and secretion. In Quantitative Human Physiology; Feher, J., Ed.; Academic Press: Salt Lake City, UT, USA, 2017; pp. 719–729. [Google Scholar]
  47. Lowe, J.; Souza-Menezes, J.; Freire, D.S.; Mattos, L.J.; Castiglione, R.C.; Barbosa, C.M.; Santiago, L.; Ferrão, F.M.; Cardoso, L.H.D.; da Silva, R.T.; et al. Single sublethal dose of microcystin-LR is responsible for different alterations in biochemical, histological and physiological renal parameters. Toxicon 2012, 59, 601–609. [Google Scholar] [CrossRef] [PubMed]
  48. Ding, J.; Wang, J.; Xiang, Z.; Diao, W.; Su, M.; Shi, W.; Wan, T.; Han, X. The organic anion transporting polypeptide 1a5 is a pivotal transporter for the uptake of microcystin-LR by gonadotropin-releasing hormone neurons. Aquat. Toxicol. 2017, 182, 1–10. [Google Scholar] [CrossRef]
  49. Feurstein, D.; Holst, K.; Fischer, A.; Dietrich, D. Oatp-associated uptake and toxicity of microcystins in primary murine whole brain cells. Toxicol. Appl. Pharmacol. 2009, 234, 247–255. [Google Scholar] [CrossRef] [Green Version]
  50. Fischer, A.; Hoeger, S.; Stemmer, K.; Feurstein, D.; Knobeloch, D.; Nussler, A.; Dietrich, D. The role of organic anion transporting polypeptides (OATPs/SLCOs) in the toxicity of different microcystin congeners in vitro: A comparison of primary human hepatocytes and OATP-transfected HEK293 cells. Toxicol. Appl. Pharmacol. 2010, 245, 9–20. [Google Scholar] [CrossRef] [PubMed] [Green Version]
  51. Kusuhara, H.; Sugiyama, Y. Role of transporters in the tissue-selective distribution and elimination of drugs: Transporters in the liver, small intestine, brain and kidney. J. Control. Release 2002, 78, 43–54. [Google Scholar] [CrossRef]
  52. Kim, R.B. Organic anion-transporting polypeptide (OATP) transporter family and drug disposition. Eur. J. Clin. Investig. 2003, 33, 1–5. [Google Scholar] [CrossRef]
  53. Mikkaichi, T.; Suzuki, T.; Tanemoto, M.; Ito, S.; Abe, T. The Organic Anion Transporter (OATP) family. Drug Metab. Pharmacokinet. 2004, 19, 171–179. [Google Scholar] [CrossRef]
  54. Cheng, X.; Maher, J.; Chen, C.; Klaassen, C.D. Tissue distribution and ontogeny of mouse organic anion transporting polypeptides (OATPS). Drug Metab. Dispos. 2005, 33, 1062–1073. [Google Scholar] [CrossRef] [PubMed]
  55. Cheng, X.; Klaassen, C.D. Tissue distribution, ontogeny, and hormonal regulation of xenobiotic transporters in mouse kidneys. Drug Metab. Dispos. 2009, 37, 2178–2185. [Google Scholar] [CrossRef] [Green Version]
  56. Hooser, S.B.; Beasley, V.R.; Lovell, R.A.; Carmichael, W.W.; Haschek, W.M. Toxicity of microcystin LR, a cyclic heptapeptide hepatotoxin from microcystis aeruginosa, to rats and mice. Vet. Pathol. 1989, 26, 246–252. [Google Scholar] [CrossRef] [Green Version]
  57. Carey, R.M.; Padia, S.H. Chapter 1—Physiology and regulation of the renin–angiotensin–aldosterone system. In Textbook of Nephro-Endocrinology; Singh, A.K., Williams, G.H., Eds.; Academic Press: Salt Lake City, UT, USA, 2018; pp. 1–25. [Google Scholar]
  58. Zhong, Q.; Sun, F.; Wang, W.; Xiao, W.; Zhao, X.; Gu, K. Water metabolism dysfunction via renin-angiotensin system activation caused by liver damage in mice treated with microcystin-RR. Toxicol. Lett. 2017, 273, 86–96. [Google Scholar] [CrossRef] [PubMed]
  59. Zhao, Y.; Xue, Q.; Su, X.; Xie, L.; Yan, Y.; Steinman, A.D. Microcystin-LR induced thyroid dysfunction and metabolic disorders in mice. Toxicology 2015, 328, 135–141. [Google Scholar] [CrossRef] [PubMed]
  60. Dabrowski, E.; Kadakia, R.; Zimmerman, D. Diabetes insipidus in infants and children. Best Pract. Res. Clin. Endocrinol. Metab. 2016, 30, 317–328. [Google Scholar] [CrossRef]
  61. Kopp, P.A. Preface—Disturbances of water and electrolyte balance. Best Pract. Res. Clin. Endocrinol. Metab. 2016, 30, 159–160. [Google Scholar] [CrossRef]
Figure 1. H & E stained histological sections of the kidneys of rats exposed to different concentrations of microcystin-RR (MC-RR) for 24 h. (a) 0.0 μg/kg MC-RR. (b) 574.7 μg/kg MC-RR. Necrosis of glomerular cells (arrow). (c) 287.3 μg/kg MC-RR. (d) 50.0 mg/kg DXM mixed with 574.7 μg/kg MC-RR. (e) 10.0 mg/kg DXM mixed with 574.7 μg/kg MC-RR. (f) 2.0 mg/kg DXM mixed with 574.7 μg/kg MC-RR.
Ijerph 18 01900 g001
Figure 2. H & E stained histological sections of the kidneys and livers of mice exposed to different concentrations of MC-RR for 24 h. (a) Kidney in 0.0 μg/kg MC-RR group (control group). (b) Kidney in 210.0 μg/kg MC-RR group. (c) Kidney in 105.0 μg/kg MC-RR group. (d) Liver in 0.0 μg/kg MC-RR group (control group). (e) Liver in 210.0 μg/kg MC-RR group. Sinusoid expansion and hyperemia (arrow). (f) Liver in 105.0 μg/kg MC-RR group.
Ijerph 18 01900 g002
Figure 3. H & E stained histological sections of the livers of rats exposed to different concentrations of MC-RR for 24 h. (a) 0.0 μg/kg MC-RR. (b) 574.7 μg/kg MC-RR. (c) 287.3 μg/kg MC-RR. (d). 50.0 mg/kg DXM mixed with 574.7 μg/kg MC-RR. (e) 10.0 mg/kg DXM mixed with 574.7 μg/kg MC-RR. (f) 2.0 mg/kg DXM mixed with 574.7 μg/kg MC-RR. Note necrosis areas in Figure 3b,e,f (arrows).
Ijerph 18 01900 g003
Figure 4. Water intake (a), urine output (b) and body weight (c) of mice treated with MC-RR in the continuous exposure experiment.
Ijerph 18 01900 g004
Figure 5. Kidneys of mice exposed to different concentrations of MC-RR for 28 days. (a) H & E stained histological section for 0.0 μg/kg MC-RR. (b) H & E stained histological section for 140.0 μg/kg MC-RR. (d) H & E stained histological section for 70.0 μg/kg MC-RR. (e) H & E stained histological section for 35.0 μg/kg MC-RR. (c) PAS-stained histological section for 0.0 μg/kg MC-RR. (f) PAS-stained histological section for 140.0 μg/kg MC-RR.
Ijerph 18 01900 g005
Figure 6. H & E stained histological sections of the livers of mice exposed to MC-RR at concentrations of 0.0 μg/kg (a) and 140.0 μg/kg (b) for 28 days.
Ijerph 18 01900 g006
Table 1. Water intake, urine output and weight gain of Sprague–Dawley (SD) rats and KunMing (KM) mice treated with microcystin-RR (MC-RR) in single-dose experiment (mean ± SD, n = 6).
GroupWater Intake (10−1 mL/g/24 h)Urine Output (102 mL/g/24 h)Weight Gain (g/24 h)
Before TestAfter AdministrationBefore TestAfter AdministrationBefore TestAfter Administration
SD RatSaline control1.50 ± 0.0471.48 ± 0.0764.43 ± 0.3144.45 ± 0.3969.71 ± 3.15510.78 ± 3.023
143.7 μg/kg MC-RR1.44 ± 0.0501.53 ± 0.1004.03 ± 0.4144.22 ± 0.7409.12 ± 1.4778.69 ± 1.441
287.3 μg/kg MC-RR1.46 ± 0.0321.44 ± 0.0464.18 ± 0.4114.35 ± 0.6658.31 ± 3.2629.28 ± 2.124
574.7 μg/kg MC-RR1.55 ± 0.0831.84 ± 0.112 *α4.35 ± 0.63916.79 ± 1.069 *α9.94 ± 1.3943.53 ± 2.358 *α
KM MouseSaline control2.83 ± 0.0322.72 ± 0.1032.56 ± 0.1162.62 ± 0.0612.08 ± 0.4792.63 ± 0.686
52.5 μg/kg MC-RR2.88 ± 0.0752.83 ± 0.0672.71 ± 0.07142.61 ± 0.0952.45 ± 0.5892.62 ± 0.534
105.0 μg/kg MC-RR2.78 ± 0.1122.79 ± 0.0542.74 ± 0.0902.75 ± 0.1392.18 ± 0.4752.25 ± 0.413
210.0 μg/kg MC-RR2.85 ± 0.0692.83 ± 0.0432.63 ± 0.0832.68 ± 0.0182.40 ± 0.3792.05 ± 0.446
SD RatSaline control1.48 ± 0.0241.50 ± 0.0234.38 ± 0.2134.42 ± 0.28710.28 ± 2.5369.23 ± 1.807
0.0 mg/kg DXM + MC-RR 574.7 μg/kg1.49 ± 0.0531.86 ± 0.044 * α4.47 ± 0.50917.72 ± 0.659 * α9.12 ± 2.5653.48 ± 0.916 * α
2.0 mg/kg DXM + MC-RR 574.7 μg/kg1.50 ± 0.0681.58 ± 0.043 * #4.16 ± 0.34015.7 ± 0.871 * α9.84 ± 1.5645.06 ± 1.679 * α
10.0 mg/kg DXM + MC-RR 574.7 μg/kg1.487 ± 0.0801.51 ± 0.040 #3.94 ± 0.2588.98 ± 0.793 # α9.49 ± 1.7717.13 ± 1.330 * # α
50.0 mg/kg DXM + MC-RR 574.7 μg/kg1.50 ± 0.0581.50 ± 0.053 #4.01 ± 0.3954.24 ± 0.876 #9.85 ± 1.6729.53 ± 2.192 #
* Significantly different from the saline control group (0.0 μg/kg MC-RR), p < 0.05; # Significantly different from the 0.0 mg/kg DXM + MC-RR 574.7 μg/kg group, p < 0.05; α Significantly different from the self-control (before test), p < 0.05.
Table 2. Urinalysis of SD rats and KM mice treated with MC-RR in single dose experiment detected by the semiquantitative colorimetric reagent strip.
GroupLeukocyte (Leu/μL)Urobilinogen (μmol/L)Micro-albumin (mg/L)Protein (g/L)Bilirubin (mmol/L)Glucose (mmol/L)Ascorbic Acid (mmol/L)Ketone (mmol/L)Nitrite *Creatinine (mmol/L)pHOccult Blood (Ery/μL)Calcium (mmol/L)
SD RatSaline control<15≤3.510−30<0.15<17.0<2.8<0.56<0.5Negative≤0.97.5–8.5<105.0–10.0
143.7 μg/kg MC-RR<15≤3.510−30<0.15<17.0<2.8<0.56<0.5Negative≤0.97.5–8.0<105.0–10.0
287.3 μg/kg MC-RR≤15≤3.510−800.15–0.30<17.0<2.8<0.56<0.5Negative≤0.97.0–8.510–255.0–10.0
574.7 μg/kg MC-RR70–12570–14030–1500.15–1.00<17.0<2.8<0.560.5–1.5Negative0.9–4.46.0–7.580–2001.0–2.5
KM MouseSaline control<15≤3.5≤10<0.15<17.0<2.8<0.56<0.5Negative≤0.97.0–8.5<105.0–10.0
52.5 μg/kg MC-RR<15≤3.5≤10<0.15<17.0<2.8<0.56<0.5Negative≤0.97.5–8.5<105.0–10.0
105.0 μg/kg MC-RR<15≤3.5≤10<0.15<17.0<2.8<0.56<0.5Negative≤0.97.5–8.5<105.0–10.0
210.0 μg/kg MC-RR<15≤3.5≤10<0.15<17.0<2.8<0.56<0.5Negative≤0.97.0–8.0<102.5–10.0
SD RatSaline control<15≤3.510–30<0.15<17.0<2.8<0.56<0.5Negative≤0.97.5–8.5<105.0–10.0
0.0 mg/kg DXM + MC-RR 574.7 μg/kg70–125140–20080–1500.15–1.00≤17.0<2.8<0.56<0.5Negative0.9–17.76.0–7.080–2001.0–2.5
2.0 mg/kg DXM + MC-RR 574.7 μg/kg15–70140–20080–1500.15–1.00≤17.0<2.8<0.56< 0.5Negative0.9–17.75.0–7.080–2001.0–5.0
10.0 mg/kg DXM + MC-RR 574.7 μg/kg15–7017–20080–1500.15–1.00<17.0<2.80.00–1.14<0.5Negative0.9–8.86.0–7.510–252.5–5.0
50.0 mg/kg DXM + MC-RR 574.7 μg/kg<15≤3.580–1500.15–0.30<17.0<2.80.56–1.14<0.5Negative≤0.96.5–7.5≤102.5–5.0
* Qualitative test for this index with the result described by “Negative” or “Positive”.
Table 3. Concentration of Na+ and K+ in urine and serum for SD rat and KM mouse (mean ± SD).
AnimalTimeMC-RR Dosage (μg/kg)Na+ in Urine (mg/L)K+ in Urine (mg/L)Na+ in Serum (mg/L)K+ in Serum (mg/L)
Single dose experiment (n = 6)SD Rat24 h0.03368.6 ± 202.6110031.2 ± 469.043723.0 ± 158.36278.9 ± 34.50
143.74169.3 ± 290.28 *9193.0 ± 371.53 *3670.9 ± 115.45277.8 ± 33.18
287.36183.0 ± 234.86 *8363.7 ± 450.92 *3443.9 ± 183.78 *283.1 ± 32.33
574.77812.5 ± 436.24 *3443.8 ± 221.59 *3165.7 ± 192.05 *362.5 ± 30.04 *
KM Mouse24 h0.03041.4 ± 302.817717.4 ± 89.713303.3 ± 241.35281.3 ± 12.17
52.53256.4 ± 244.927919.8 ± 262.833077.7 ± 131.42276.2 ± 18.32
105.02974.5 ± 219.127826.1 ± 283.903148.8 ± 80.68265.6 ± 11.00
210.03119.5 ± 226.077985.3 ± 298.803208.9 ± 139.36297.7 ± 13.33
Continuous exposure experiment (n = 7)KM Mouse28th day0.03174.8 ± 387.077918.2 ± 242.433107.1 ± 93.03265.4 ± 20.76
35.03033.6 ± 243.717916.4 ± 232.303136.7 ± 98.92272.5 ± 32.68
70.02885.2 ± 364.977797.5 ± 272.123210.2 ± 82.94260.0 ± 25.24
140.0989.6 ± 244.02 *1336.4 ± 101.25 *3171.9 ± 41.68263.8 ± 19.09
42nd day0.02979.4 ± 244.217874.9 ± 179.493182.4 ± 153.93273.8 ± 23.13
35.03012.2 ± 237.528021.0 ± 219.973308.8 ± 110.69276.6 ± 14.21
70.02989.6 ± 219.587966.3 ± 210.533284.4 ± 111.91280.6 ± 32.61
140.02855.2 ± 250.437807.9 ± 292.553175.3 ± 95.78259.9 ± 15.97
* Significantly different from the saline control group (0.0 μg/kg MC-RR), p < 0.05.
Table 4. Organ coefficient and urine specific gravity of SD rats and KM mice (mean ± SD).
AnimalTimeMC-RR Dosage (μg/kg)Urine Specific GravityOrgan Coefficient (% of Body Weight)
KidneyLiver
Single dose experiment (n = 6)SD Rat24 h0.01.032 ± 0.01230.911 ± 0.0784.77 ± 0.081
143.71.041 ± 0.01820.958 ± 0.0534.68 ± 0.231
287.31.031 ± 0.01380.977 ± 0.1244.97 ± 0.656
574.71.020 ± 0.00581.123 ± 0.2075.13 ± 0.275
KM Mouse24 h0.01.053 ± 0.00241.38 ± 0.1025.60 ± 0.400
52.51.054 ± 0.00581.33 ± 0.1415.72 ± 0.344
105.01.056 ± 0.00501.39 ± 0.0555.43 ± 0.457
210.01.052 ± 0.00461.31 ± 0.1535.60 ± 0.400
Continuous exposure experiment (n = 7)KM Mouse7th day0.01.053 ± 0.00441.29 ± 0.1325.64 ± 0. 410
35.01.055 ± 0.00531.18 ± 0.0645.69 ± 0.259
70.01.054 ± 0.00601.24 ± 0.0565.95 ± 0.315
140.01.054 ± 0.00641.31 ± 0. 1015.89 ± 0. 260
14th day0.01.054 ± 0.00601.26 ± 00374.96 ± 0.182
35.01.052 ± 0.00561.39 ± 0.1675.39 ± 0.570
70.01.051 ± 0.00351.37 ± 0.2215.22 ± 0.501
140.01.018 ± 0.0077 *1.32 ± 0.1045.86 ± 0.522 *
28th day0.01.055 ± 0.00541.29 ± 0.0924.77 ± 0.169
35.01.054 ± 0.00571.29 ± 0.1414.92 ± 0.230
70.01.053 ± 0.00721.39 ± 0.1295.69 ± 0.446 *
140.01.015 ± 0.0076 *1.25 ± 0.1015.66 ± 0.305 *
42nd day0.01.054 ± 0.00701.40 ± 0.1805.04 ± 0.265
35.01.055 ± 0.00531.26 ± 0.1095.27 ± 0.435
70.01.053 ± 0.00511.36 ± 0.0925.20 ± 0.485
140.01.056 ± 0.00781.25 ± 0.0935.01 ± 0.571
* Significantly different from the saline control group (0.0 μg/kg MC-RR), p < 0.01.
Table 5. Serum biochemical analysis of SD rats and KM mice treated with MC-RR in single dose experiment (mean ± SD, n = 6).
GroupCreatinine (mmol/L)Uric Acid (mmol/L)Urea Nitrogen (mmol/L)Alanine Aminotransferase (IU/L)Glutamic Oxaloacetic transaminase (IU/L)Alkaline Phosphatase (IU/L)Lactic Dehydrogenase (IU/L)Albumin (g/L)Glucose (mmol/L)Total Cholesterol (mmol/L)Total Protein (g/L)
SD RatSaline control35.43 ± 6.705133.72 ± 25.462.99 ± 0.45544.15 ± 8.943136.37 ± 29.228412.91 ± 31.575376.16 ± 37.78432.45 ± 3.2567.79 ± 0.3741.70 ± 0.37451.93 ± 6.049
143.7 μg/kg MC-RR28.75 ± 4.127105.13 ± 11.6473.73 ± 0.63855.10 ± 7.539204.41 ± 47.776436.81 ± 57.679277.99 ± 48.72333.27 ± 2.1217.858 ± 0.9971.61 ± 0.27452.35 ± 5.329
287.3 μg/kg MC-RR38.07 ± 9.047123.20 ± 19.3984.55 ± 0.71487.43 ± 10.936 **341.12 ± 61.419 **504.29 ± 75.969298.91 ± 65.91933.05 ± 0.6957.416 ± 1.0771.90 ± 0.13952.53 ± 2.109
574.7 μg/kg MC-RR48.13 ± 11.56677.23 ± 12.371 **4.61 ± 2.091976.07 ± 231.512 **1215.17 ± 130.027**842.45 ± 75.342 **1318.13 ± 325.223 **33.07 ± 2.7786.844 ± 0.7191.82 ± 0.26457.90 ± 11.013
KM MouseSaline control27.13 ± 2.099153.68 ± 5.0703.73 ± 0.16634.90 ± 2.672130.21 ± 11.895189.08 ± 9.653479.06 ± 9.11234.30 ± 1.3966.31 ± 0.4492.59 ± 0.24660.65 ± 1.379
52.5 μg/kg MC-RR26.71 ± 2.0645150.92 ± 4.5403.73 ± 0.24637.66 ± 2.678140.66 ± 10.483187.53 ± 7.363499.56 ± 21.26534.23 ± 0.5696.52 ± 0.3262.54 ± 0.14159.38 ± 4.845
105.0 μg/kg MC-RR27.17 ± 3.602153.53 ± 4.9503.84 ± 0.40540.59 ± 4.171 *134.65 ± 10.288184.80 ± 19.889510.73 ± 44.97833.57 ± 1.1236.07 ± 0.4682.68 ± 0.19359.53 ± 1.734
210.0 μg/kg MC-RR24.73 ± 2.562144.18 ± 14.9604.09 ± 0.58763.83 ± 4.134 **185.86 ± 8.770**272.07 ± 7.567 **552.91 ± 21.362 **34.98 ± 1.9616.40 ± 0.6992.67 ± 0.29958.95 ± 2.688
SD RatSaline controlNDNDND47.47 ± 7.847144.84 ± 23.050408.58 ± 53.478317.15 ± 49.304NDNDNDND
0.0 mg/kg DXM + MC-RR 574.7 μg/kgNDNDND1001.43 ± 2.672 **1223.33 ± 200.147 **866.39 ± 86.98 **1268.86 ± 285.334 **NDNDNDND
2.0 mg/kg DXM + MC-RR 574.7 μg/kgNDNDND625.16 ± 26.054 ** #1354.57 ± 51.446**#697.09 ± 14.698 ** #1002.08 ± 40.163 **NDNDNDND
10.0 mg/kg DXM + MC-RR 574.7 μg/kgNDNDND93.41 ± 21.091 * ##361.38 ± 18.384**##564.82 ± 19.894** ##583.84 ± 19.245 ** ##NDNDNDND
50.0 mg/kg DXM + MC-RR 574.7 μg/kgNDNDND70.17 ± 13.115 * ##190.78 ± 15.600 * ##486.85 ± 13.374 ##514.94 ± 31.356 ** ##NDNDNDND
* Significantly different from the saline control group (0.0 μg/kg MC-RR), p < 0.05; ** Significantly different from the saline control group (0.0 μg/kg MC-RR), p < 0.01; # Significantly different from the 0.0 mg/kg DXM + 574.7 μg/kg MC-RR group, p < 0.05; ## Significantly different from the 0.0 mg/kg DXM + 574.7 μg/kg MC-RR group, p < 0.01; ND: No detection.
Table 6. Serum biochemical analysis of KM mice treated with MC-RR in continuous exposure experiment (mean ± SD, n = 7).
MC-RR Dosage (μg/kg)Albumin (g/L)Alanine Aminotransferase (IU/L)Alkaline Phosphatase (IU/L)Glutamic Oxaloacetic Transaminase (IU/L)Urea Nitrogen (mmol/L)Creatinine (mmol/L)Glucose (mmol/L)Total Cholesterol (mmol/L)Total Protein (g/L)Uric Acid (mmol/L)
7th day0.030.23 ± 0.56842.30 ± 3.25554.93 ± 13.380141.41 ± 14.0254.09 ± 0.31771.44 ± 4.1069.08 ± 0.6302.05 ± 0.28862.26 ± 1.215119.96 ± 20.052
35.0 31.01 ± 1.11155.21 ± 13.6545.57 ± 10.886144.63 ± 20.9864.10 ± 0.23170.66 ± 4.1549.12 ± 0.7412.12 ± 0.29262.04 ± 1.868110.39 ± 21.005
70.029.91 ± 1.02755.21 ± 13.65567.07 ± 22.606147.61 ± 21.0264.06 ± 0.27072.07 ± 3.2148.63 ± 0.5142.14 ± 0.25261.23 ± 0.976108.70 ± 20.921
140.030.56 ± 0.88198.48 ± 27.081 *92.51 ± 25.885 *188.69 ± 58.8313.96 ± 0.28169.93 ± 4.8898.14 ± 0.9862.23 ± 0.35860.49 ± 1.503103.54 ± 22.823
14th day0.030.16 ± 0.78944.14 ± 10.12760.19 ± 8.999154.03 ± 16.7494.00 ± 0.26370.46 ± 3.1799.24 ± 0.381.99 ± 0.26860.78 ± 1.831110.99 ± 15.422
35.0 29.53 ± 0.97644.17 ± 6.76656.00 ± 14.439156.71 ± 18.6094.02 ± 0.37370.29 ± 2.7649.16 ± 1.0111.99 ± 0.25362.00 ± 1.547109.91 ± 23.107
70.030.26 ± 1.12150.24 ± 6.71065.31 ± 7.371146.17 ± 26.1613.90 ± 0.28369.14 ± 3.5807.55 ± 0.296 *2.14 ± 0.29760.91 ± 1.720112.68 ± 15.416
140.029.97 ± 0.450137.14 ± 22.760 *96.77 ± 9.122 *193.214 ± 44.5784.00 ± 0.24669.94 ± 2.4076.55 ± 0.372 *3.12 ± 0.321 *61.14 ± 1.367114.94 ± 19.323
28th day0.030.09 ± 0.77842.53 ± 7.48964.21 ± 6.564145.03 ± 13.7784.08 ± 0.20671.20 ± 2.25810.07 ± 0.5621.99 ± 0.22861.34 ± 1.852110.70 ± 18.762
35.0 29.91 ± 0.91943.16 ± 6.31261.74 ± 10.527143.27 ± 16.6354.14 ± 0.22869.14 ± 3.7239.27 ± 0.8532.03 ± 0.26660.14 ± 2.052109.77 ± 18.858
70.028.87 ± 1.41163.80 ± 5.525 *64.11 ± 7.049157.71 ± 12.4444.05 ± 0.38170.93 ± 3.1197.78 ± 0.432 *2.06 ± 0.25261.39 ± 1.631115.69 ± 19.889
140.026.46 ± 0.866 *148.26 ± 9.466 *133.97 ± 22.060 *214.042 ± 24.292 *3.97 ± 0.30866.87 ± 3.458 *6.04 ± 0.465 *2.84 ± 0.462 *62.10 ± 2.036112.54 ± 18.587
35th day0.029.60 ± 0.61639.60 ± 6.11963.56 ± 11.527147.79 ± 7.2473.98 ± 0.30971.31 ± 3.0509.43 ± 1.0192.09 ± 0.25261.60 ± 1.910114.50 ± 15.150
35.0 29.76 ± 0.76838.64 ± 6.27464.36 ± 9.727142.89 ± 7.6233.89 ± 0.26970.66 ± 2.6679.28 ± 0.5752.07 ± 0.16760.71 ± 2.023117.93 ± 18.973
70.030.00 ± 0.92941.17 ± 4.28566.14 ± 6.432153.57 ± 10.9164.03 ± 0.25872.13 ± 4.1628.69 ± 0.6552.13 ± 0.26962.14 ± 1.682113.73 ± 11.466
140.029.64 ± 0.90770.00 ± 13.075 *111.286 ± 6.048 *186.53 ± 9.739 *4.08 ± 0.31571.93 ± 3.9498.96 ± 0.4602.32 ± 0.42761.73 ± 1.227119.43 ± 18.655
42nd day0.030.08 ± 0.66737.96 ± 4.18465.34 ± 8.383153.06 ± 17.1714.02 ± 0.29571.73 ± 3.8999.42 ± 0.5242.19 ± 0.34162.26 ± 2.811119.26 ± 16.825
35.0 31.07 ± 0.63735.49 ± 4.41662.50 ± 9.637160.93 ± 11.0123.97 ± 0.33171.40 ± 4.4779.28 ± 0.5752.22 ± 0.31261.80 ± 2.131116.23 ± 13.663
70.030.46 ± 0.68834.07 ± 4.32067.63 ± 8.176169.69 ± 13.6204.11 ± 0.30472.24 ± 3.6448.69 ± 0.6552.15 ± 0.31762.34 ± 2.609113.24 ± 12.241
140.029.51 ± 1.10438.79 ± 8.10791.24 ± 14.434 *183.40 ± 16.591 *4.01 ± 0.33370.00 ± 2.8318.96 ± 0.4602.28 ± 0.37160.60 ± 2.011117.29 ± 15.093
* Significantly different from the saline control group (0.0 μg/kg MC-RR), p < 0.05.
Table 7. Antidiuretic hormone (ADH) levels of KM mice in continuous exposure experiment (mean ± SD, n = 7).
MC-RR Dosage (μg/kg)7th Day14th Day28th Day35th Day42nd Day
0.0203.60 ± 25.491208.69 ± 33.740198.60 ± 11.229196.99 ± 26.105204.94 ± 35.174
35.0198.51 ± 13.311192.44 ± 21.701189.58 ± 37.184188.87 ± 24.173205.29 ± 28.520
70.0207.17 ± 37.415218.27 ± 26.093218.24 ± 22.832200.12 ± 19.228196.82 ± 23.195
140.0198.96 ± 26.346228.15 ± 24.805 *267.79 ± 20.126 **189.31 ± 17.105203.78 ± 24.784
* Significantly different from the saline control group (0.0 μg/kg MC-RR), p < 0.05; ** Significantly different from the saline control group (0.0 μg/kg MC-RR), p < 0.01.
Publisher’s Note: MDPI stays neutral with regard to jurisdictional claims in published maps and institutional affiliations.

