
Dietary Quality in Vegetarian and Omnivorous Female Students in Germany: A Retrospective Study

 , , , and
Abstract
1. Introduction
2. Materials and Methods
2.1. Study Design
2.2. Dietary Assessment
2.3. Overall Dietary Quality
2.4. Physical Activity
2.5. Anthropometric and Socio-Economic Measurements
2.6. Statistical Analysis
3. Results
3.1. Study Participants
3.2. Nutrient Intake
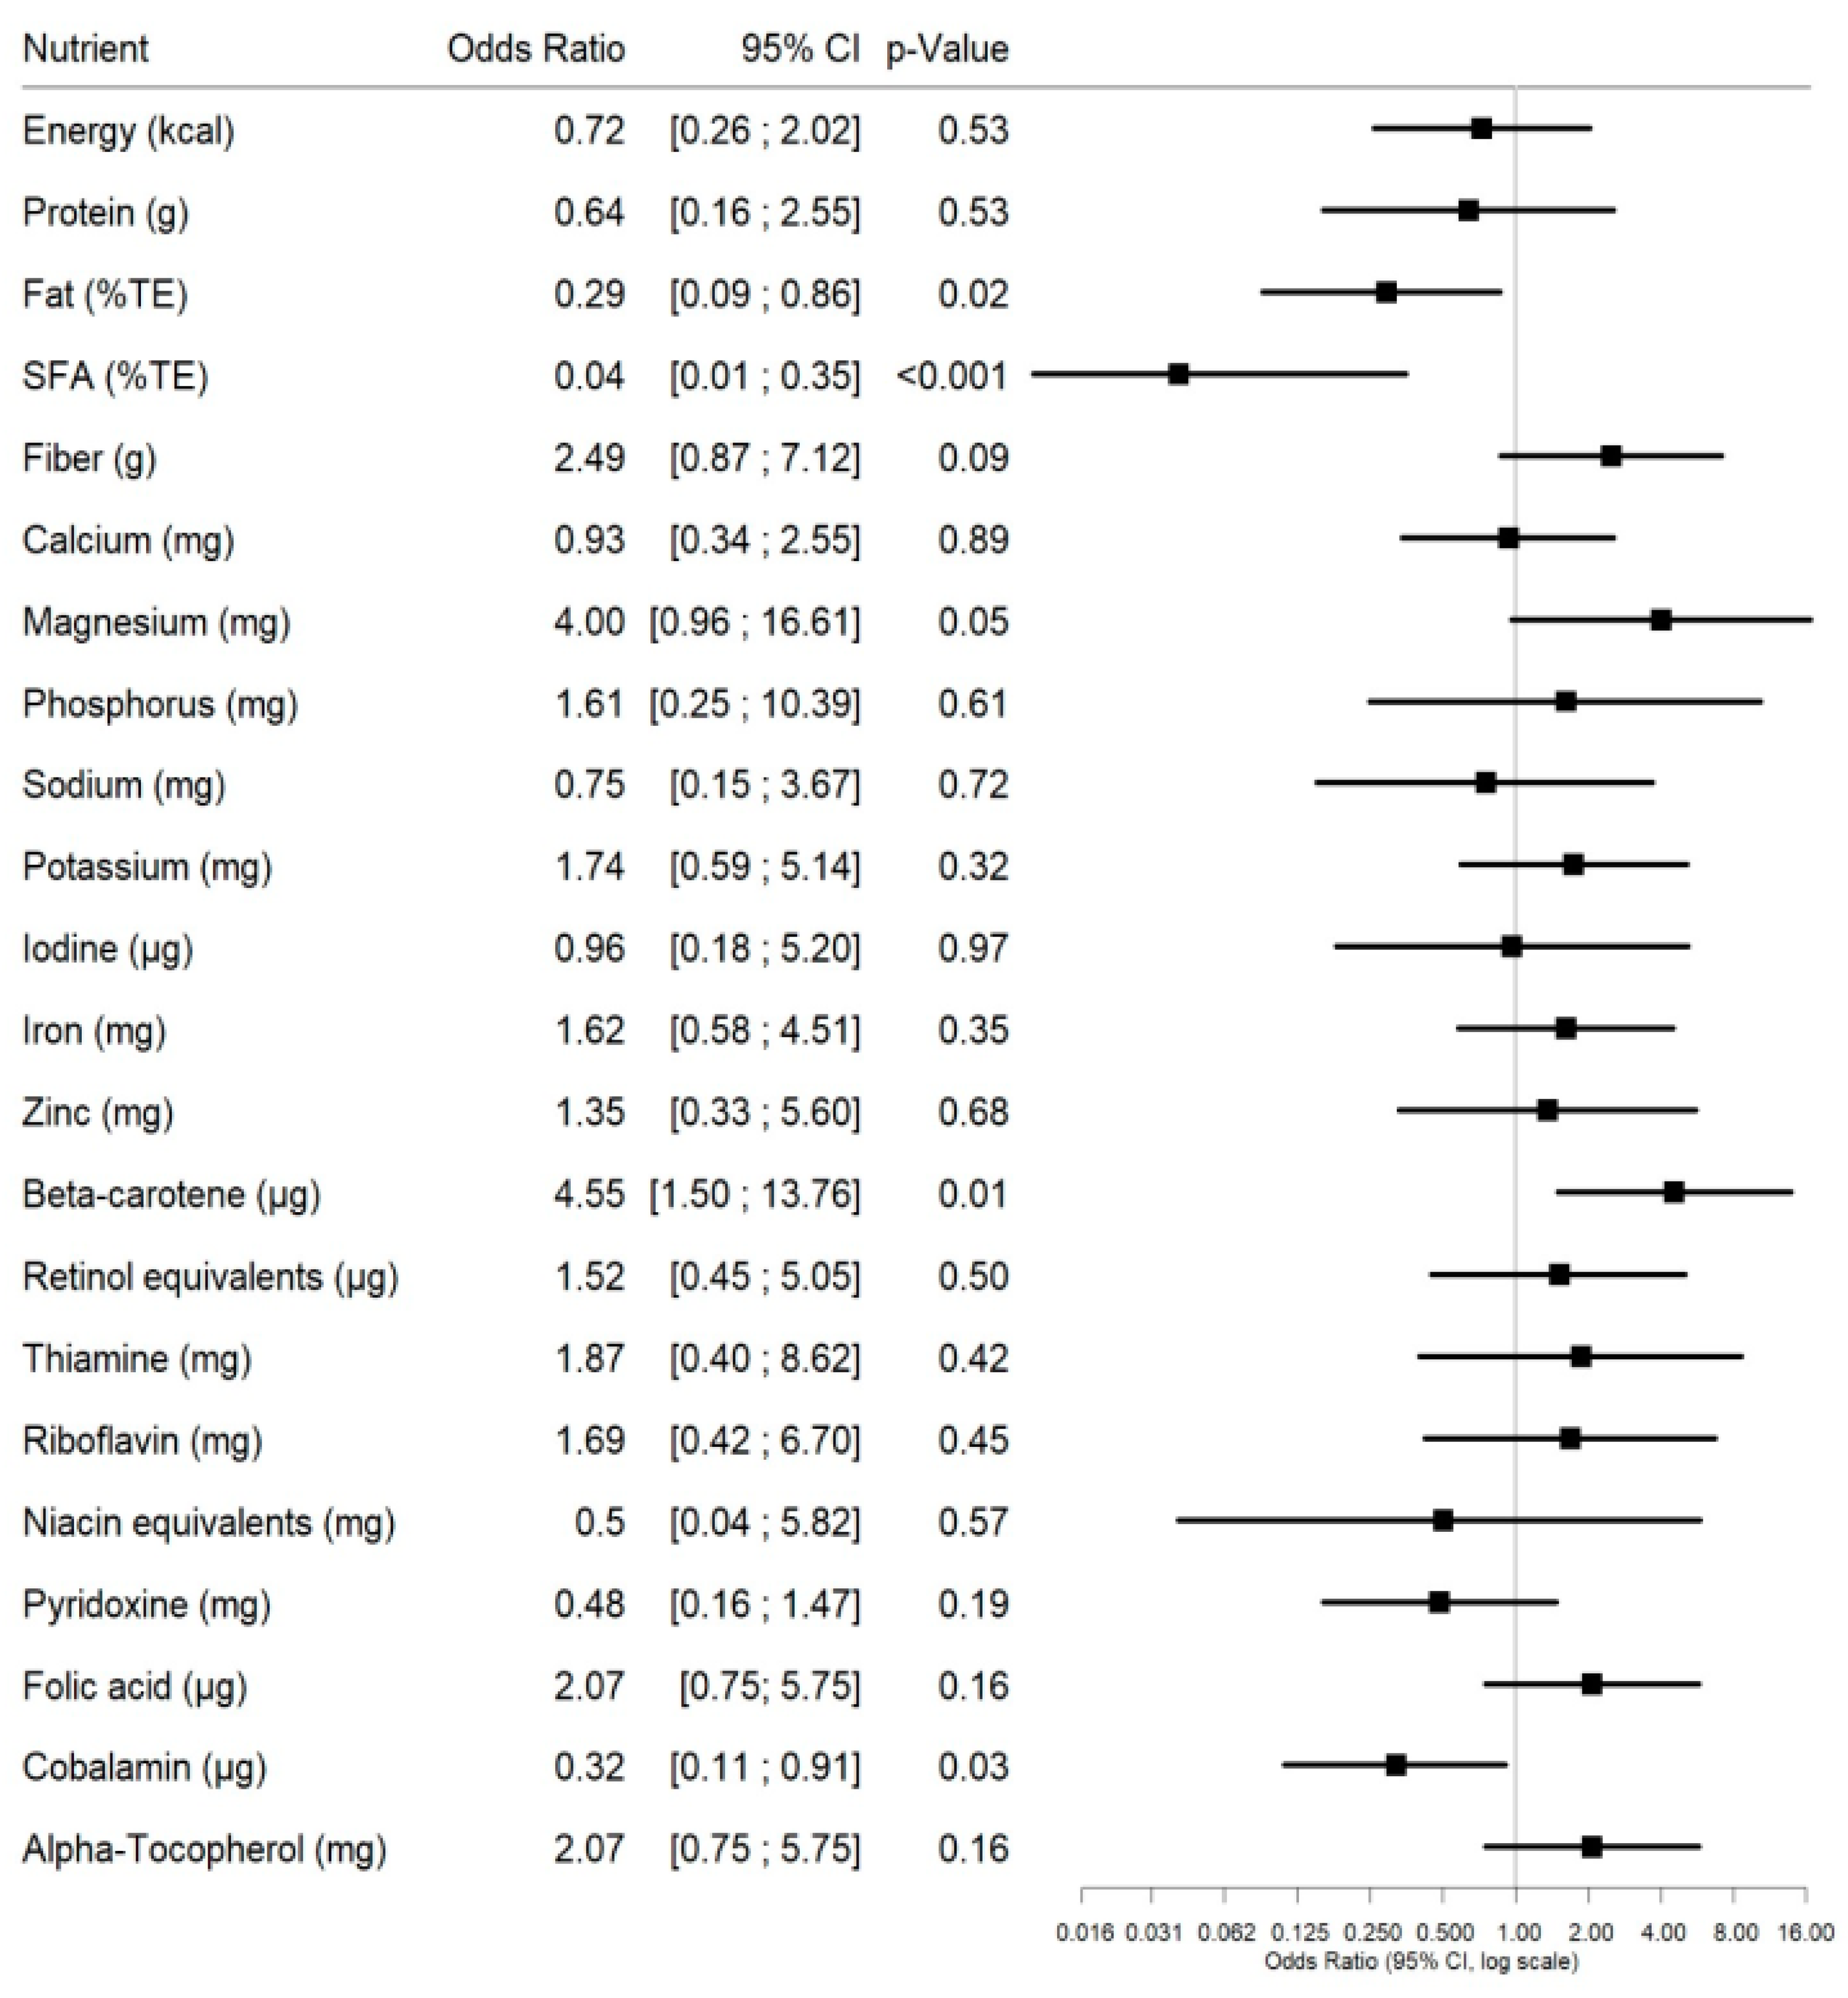
3.3. Odds for Meeting DRV
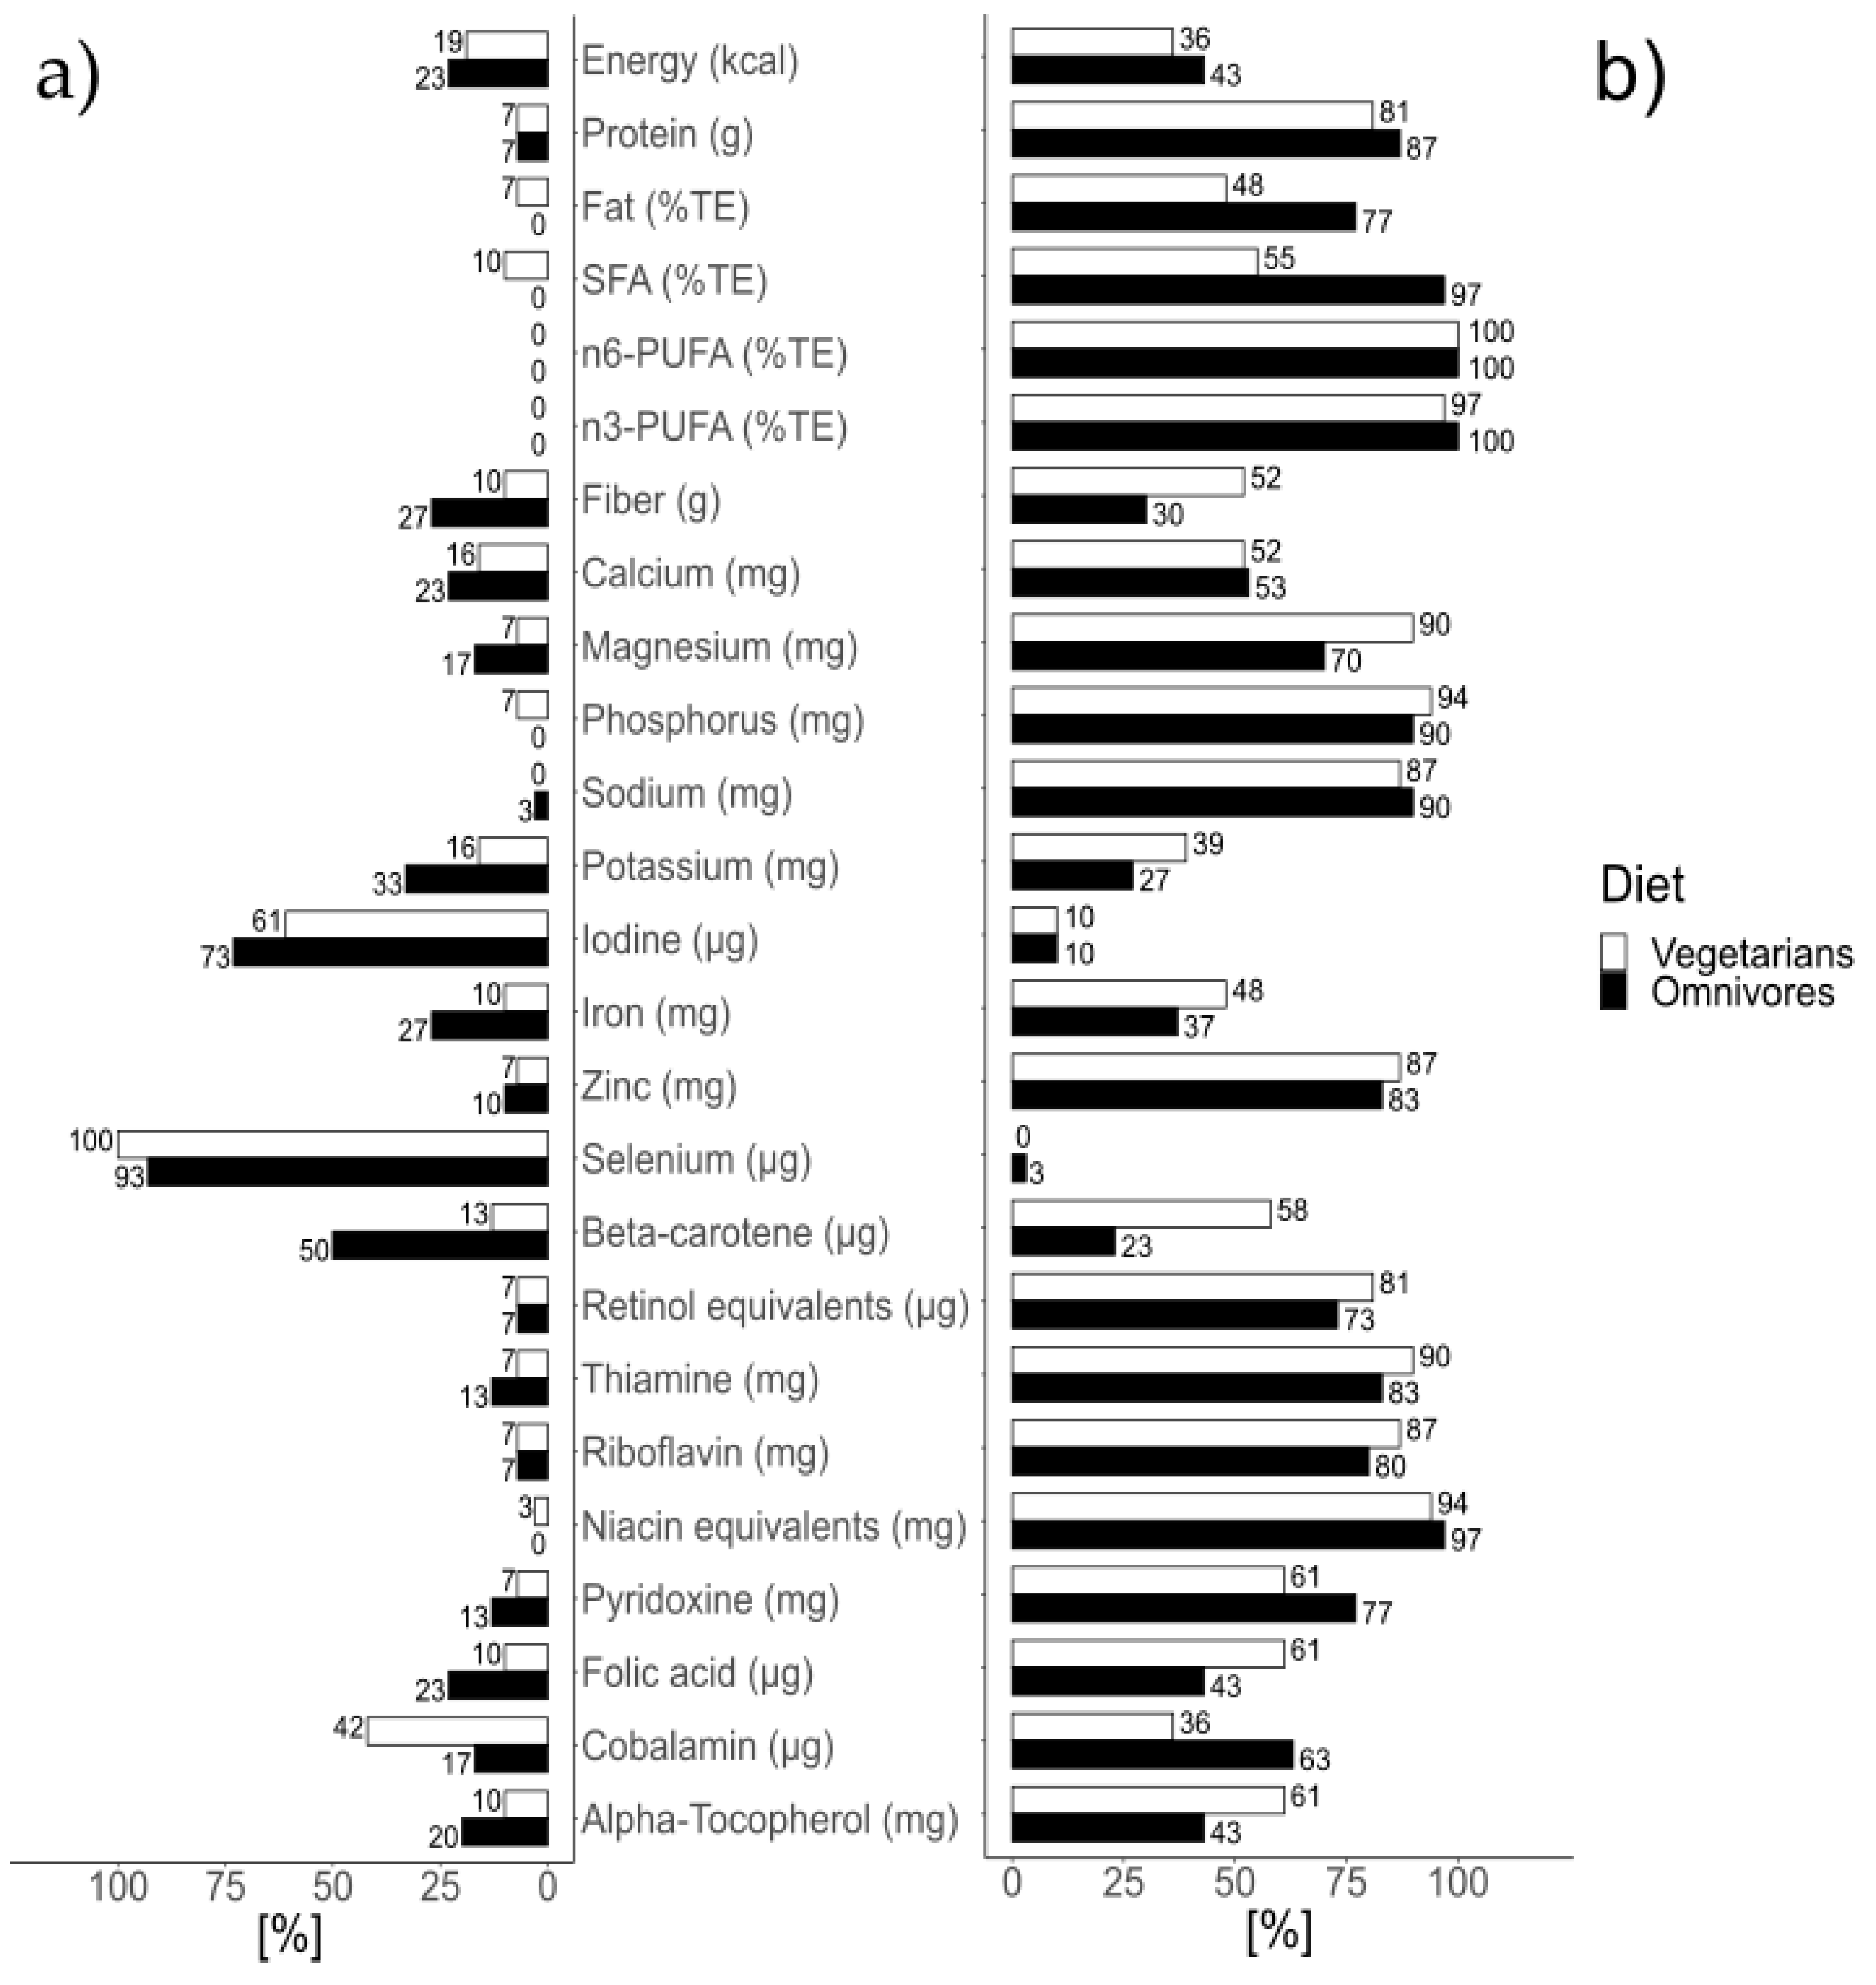
3.4. Comparison of Nutrient Intakes with DRV
3.5. HEI-2015
4. Discussion
4.1. HEI-2015
4.2. Macronutrients
4.3. Micronutrients
5. Strengths and Limitations
6. Conclusions
Author Contributions
Funding
Institutional Review Board Statement
Informed Consent Statement
Data Availability Statement
Acknowledgments
Conflicts of Interest
References
- Craig, W.J. Nutrition concerns and health effects of vegetarian diets. Nutr. Clin. Pract. 2010, 25, 613–620. [Google Scholar] [CrossRef]
- Lyons, S.; Tol, R.S.J.; Leahy, E. An Estimate of the Number of Vegetarians in the World; Working Paper, No. 340; Economic & Social Research Institute (ESRI): Dublin, Ireland, 2010. [Google Scholar]
- Fraser, G.E. Vegetarian diets: What do we know of their effects on common chronic diseases? Am. J. Clin. Nutr. 2009, 89, 1607S–1612S. [Google Scholar] [CrossRef]
- Olfert, M.D.; Wattick, R.A. Vegetarian Diets and the Risk of Diabetes. Curr. Diab. Rep. 2018, 18, 101. [Google Scholar] [CrossRef] [PubMed]
- Rizzo, N.S.; Jaceldo-Siegl, K.; Sabate, J.; Fraser, G.E. Nutrient profiles of vegetarian and nonvegetarian dietary patterns. J. Acad. Nutr. Diet. 2013, 113, 1610–1619. [Google Scholar] [CrossRef]
- DGE—Deutsche Gesellschaft für Ernährung e.V. Reference Values for Nutrient Supply. Available online: https://www.dge.de/wissenschaft/referenzwerte/ (accessed on 6 April 2020).
- Clarys, P.; Deliens, T.; Huybrechts, I.; Deriemaeker, P.; Vanaelst, B.; De Keyzer, W. Comparison of nutritional quality of the vegan, vegetarian, semi-vegetarian, pesco-vegetarian and omnivorous diet. Nutrients 2014, 6, 1318–1332. [Google Scholar] [CrossRef]
- Keller, M. Vegetarische und vegane Ernährung—Chancen und Risiken. Ernährung Med. 2015, 30, 55–60. [Google Scholar] [CrossRef]
- Key, T.J.; Appleby, P.N.; Rosell, M.S. Health effects of vegetarian and vegan diets. Proc. Nutr. Soc. 2006, 65, 35–41. [Google Scholar] [CrossRef] [PubMed]
- Barr, S.I.; Broughton, T.M. Relative weight, weight loss efforts and nutrient intakes among health-conscious vegetarian, past vegetarian and nonvegetarian women ages 18 to 50. J. Am. Coll. Nutr. 2000, 19, 781–788. [Google Scholar] [CrossRef]
- McEvoy, C.T.; Temple, N.; Woodside, J.V. Vegetarian diets, low-meat diets and health: A review. Public Health Nutr. 2012, 15, 2287–2294. [Google Scholar] [CrossRef]
- Mensink, G.B.M.; Barbossa, C.L.; Brettschneider, A.-K. Prevalence of persons following a vegetarian diet in Germany. J. Health Monit. 2016, 1. [Google Scholar] [CrossRef]
- Nössler, C.; Schneider, M.; Carlsohn, A.; Lührmann, P. Ernährungsmuster und Nährstoffzufuhr von Studentinnen und Studenten. Aktuelle Ernährungsmed. 2016, 41. [Google Scholar] [CrossRef]
- Goossens, J.; Mathijssen, G.; Simillion, H.; Finglas, P.; Segovia-Lizano, D. Introducing personalized nutrition services in a behavioural motivation concept for connected food service environments. Agro Food Ind. Hi Tech 2020, 31, 48. [Google Scholar]
- Segovia-Lizano, D.; Goossens, J.; Astley, S.; Berry RFinglas, P. Quisper and development of a personalized nutrition community. Agro Food Ind. Hi-Tech 2020, 31, 36. [Google Scholar]
- Fallaize, R.; Weech, M.; Zenun Franco, R.; Kehlbacher, A.; Hwang, F.; Lovegrove, J. The eNutri app–Using diet quality indices to deliver automated personalised nutrition advice. Agro Food Ind. Hi-Tech 2020, 31, 44–47. [Google Scholar]
- Fallaize, R.; Forster, H.; Macready, A.L.; Walsh, M.C.; Mathers, J.C.; Brennan, L.; Gibney, E.R.; Gibney, M.J.; Lovegrove, J.A. Online dietary intake estimation: Reproducibility and validity of the Food4Me food frequency questionnaire against a 4-day weighed food record. J. Med. Internet Res. 2014, 16, e190. [Google Scholar] [CrossRef] [PubMed]
- Forster, H.; Fallaize, R.; Gallagher, C.; O’Donovan, C.B.; Woolhead, C.; Walsh, M.C. Online dietary intake estimation: The Food4Me food frequency questionnaire. J. Med. Internet Res. 2014, 16, e150. [Google Scholar] [CrossRef]
- Marshall, S.J.; Livingstone, K.M.; Celis-Morales, C.; Forster, H.; Fallaize, R.; O’Donovan, C.B. Reproducibility of the Online Food4Me Food-Frequency Questionnaire for Estimating Dietary Intakes across Europe. J. Nutr. 2016, 146, 1068–1075. [Google Scholar] [CrossRef] [PubMed]
- Zenun Franco, R.; Fallaize, R.; Lovegrove, J.A.; Hwang, F. Online dietary intake assessment using a graphical food frequency app (eNutri): Usability metrics from the EatWellUK study. PLoS ONE 2018, 13, e0202006. [Google Scholar] [CrossRef]
- German Nutrient Data Base. Max Rubner-Institut, Bundesforschungsinstitut für Ernährung und Lebensmittel (MRI), Karlsruhe. Available online: https://blsdb.de/ (accessed on 2 April 2020).
- NIH—National Cancer Institute. The Healthy Eating Index. Available online: https://epi.grants.cancer.gov/hei/population-ratio-method.html (accessed on 4 April 2020).
- U.S. Department of Health and Human Services. 2015–2020 Dietary Guidelines for Americans; USDA: Washington, DC, USA, 2015. Available online: https://health.gov/our-work/food-nutrition/2015-2020-dietary-guidelines (accessed on 2 April 2020).
- Basiotis, P.P.; Carlson, A.; Gerrior, S.A.; Juan, W.Y.; Lino, M. The Healthy Eating Index: 1999–2000. U.S. Department of Agriculture, Center for Nutrition Policy and Promotion. CNPP-12. 2002. Available online: https://fns-prod.azureedge.net/sites/default/files/healthy_eating_index/HEI99-00report.pdf (accessed on 2 April 2020).
- GPPAQ-Guidance. The General Practice Physical Activity Questionnaire (GPPAQ)—A Screening Tool to Assess Adult Physical Activity Levels Within Primary Care. NHS, 2009. Available online: https://assets.publishing.service.gov.uk/government/uploads/system/uploads/attachment_data/file/192453/GPPAQ_-_guidance.pdf (accessed on 1 April 2020).
- Bland, J.M.; Altman, D.G. Statistics notes. The odds ratio. BMJ 2000, 320, 1468. [Google Scholar] [CrossRef] [PubMed]
- Huang, T.; Yang, B.; Zheng, J.; Li, G.; Wahlqvist, M.L.; Li, D. Cardiovascular disease mortality and cancer incidence in vegetarians: A meta-analysis and systematic review. Ann. Nutr. Metab. 2012, 60, 233–240. [Google Scholar] [CrossRef] [PubMed]
- Kahleova, H.; Pelikanova, T. Vegetarian Diets in the Prevention and Treatment of Type 2 Diabetes. J. Am. Coll. Nutr. 2015, 34, 448–458. [Google Scholar] [CrossRef]
- Turner-McGrievy, G.; Harris, M. Key elements of plant-based diets associated with reduced risk of metabolic syndrome. Curr. Diab. Rep. 2014, 14, 524. [Google Scholar] [CrossRef] [PubMed]
- Yokoyama, Y.; Nishimura, K.; Barnard, N.D.; Takegami, M.; Watanabe, M.; Sekikawa, A. Vegetarian diets and blood pressure: A meta-analysis. JAMA Intern. Med. 2014, 174, 577–587. [Google Scholar] [CrossRef] [PubMed]
- Parker, H.W.; Vadiveloo, M.K. Diet quality of vegetarian diets compared with nonvegetarian diets: A systematic review. Nutr. Rev. 2019, 77, 144–160. [Google Scholar] [CrossRef]
- Clarys, P.; Deriemaeker, P.; Huybrechts, I.; Hebbelinck, M.; Mullie, P. Dietary pattern analysis: A comparison between matched vegetarian and omnivorous subjects. Nutr. J. 2013, 12, 82. [Google Scholar] [CrossRef]
- Conrad, Z.; Karlsen, M.; Chui, K.; Jahns, L. Diet quality on meatless days: National Health and Nutrition Examination Survey (NHANES), 2007–2012. Public Health Nutr. 2017, 20, 1564–1573. [Google Scholar] [CrossRef]
- Krebs-Smith, S.M.; Pannucci, T.E.; Subar, A.F.; Kirkpatrick, S.I.; Lerman, J.L.; Tooze, J.A. Update of the Healthy Eating Index: HEI-2015. J. Acad. Nutr. Diet. 2018, 118, 1591–1602. [Google Scholar] [CrossRef] [PubMed]
- Davey, G.K.; Spencer, E.A.; Appleby, P.N.; Allen, N.E.; Knox, K.H.; Key, T.J. EPIC-Oxford: Lifestyle characteristics and nutrient intakes in a cohort of 33 883 meat-eaters and 31 546 non meat-eaters in the UK. Public Health Nutr. 2003, 6, 259–269. [Google Scholar] [CrossRef] [PubMed]
- Levin, N.; Rattan, J.; Gilat, T. Energy intake and body weight in ovo-lacto vegetarians. J. Clin. Gastroenterol. 1986, 8, 451–453. [Google Scholar] [CrossRef]
- Nebl, J.; Schuchardt, J.P.; Wasserfurth, P.; Haufe, S.; Eigendorf, J.; Tegtbur, U. Characterization, dietary habits and nutritional intake of omnivorous, lacto-ovo vegetarian and vegan runners—A pilot study. BMC Nutr. 2019, 5, 51. [Google Scholar] [CrossRef]
- Sobiecki, J.G.; Appleby, P.N.; Bradbury, K.E.; Key, T.J. High compliance with dietary recommendations in a cohort of meat eaters, fish eaters, vegetarians, and vegans: Results from the European Prospective Investigation into Cancer and Nutrition-Oxford study. Nutr. Res. 2016, 36, 464–477. [Google Scholar] [CrossRef]
- Fink-Gremmels, J. Nutrition, residues and health. Fleischwirtsch. Int. 1993, 2, 3–13. [Google Scholar]
- Krajcovicová-Kudlácková, M.; Simoncic, R.; Béderová, A.; Klvanová, J. Plasma fatty acid profile and alternative nutrition. Ann. Nut. Metab. 1997, 41, 365–370. [Google Scholar] [CrossRef]
- Tur, J.A.; Bibiloni, M.M.; Sureda, A.; Pons, A. Dietary sources of omega 3 fatty acids: Public health risks and benefits. Br. J. Nutr. 2012, 107, 23–52. [Google Scholar] [CrossRef]
- Bradbury, K.E.; Tong, T.Y.N.; Key, T.J. Dietary intake of high-protein foods and other major foods in meat-eaters, poultry eaters, fish-eaters, vegetarians, and vegans in UK Biobank. Nutrients 2017, 9, 1317. [Google Scholar] [CrossRef]
- Farmer, B.; Larson, B.T.; Fulgoni, V.L.; Rainville, A.J.; Liepa, G.U. A vegetarian dietary pattern as a nutrient-dense approach to weight management: An analysis of the national health and nutrition examination survey 1999–2004. J. Am. Diet. Assoc. 2011, 111, 819–827. [Google Scholar] [CrossRef] [PubMed]
- Slattery, M.L.; Jacobs, D.R.; Hilner, J.E.; Caan, B.J.; Van Horn, L.; Bragg, C. Meat consumption and its associations with other diet and health factors in young adults: The CARDIA study. Am. J. Clin. Nutr. 1991, 54, 930–935. [Google Scholar] [CrossRef] [PubMed]
- Newby, P.K.; Tucker, K.L.; Wolk, A. Risk of overweight and obesity among semivegetarian, lactovegetarian, and vegan women. Am. J. Clin. Nutr. 2005, 81, 1267–1274. [Google Scholar] [CrossRef]
- Deriemaeker, P.; Aerenhouts, D.; Hebbelinck, M.; Clarys, P. Nutrient based estimation of acid-base balance in vegetarians and non-vegetarians. Plant Foods Hum. Nutr. 2010, 65, 77–82. [Google Scholar] [CrossRef]
- Marier, J.R. Magnesium content of the food supply in the modern-day world. Magnesium 1986, 5, 1–8. [Google Scholar]
- Seelig, M.S. Magnesium requirements in human nutrition. Magnes. Bull. 1981, 3, 26–47. [Google Scholar]
- Strazzullo, P.; D’Elia, L.; Kandala, N.-B.; Cappuccio, F.P. Salt intake, stroke, and cardiovascular disease: Meta-analysis of prospective studies. BMJ 2009, 339, b4567. [Google Scholar] [CrossRef] [PubMed]
- Weaver, C.M. Potassium and health. Adv. Nutr. 2013, 4, 368S–377S. [Google Scholar] [CrossRef] [PubMed]
- Zimmermann, M.B. Iodine deficiency in industrialized countries. Clin. Endocrinol. 2011, 75, 287–288. [Google Scholar] [CrossRef]
- Hunt, J.R. Bioavailability of iron, zinc, and other trace minerals from vegetarian diets. Am. J. Clin. Nutr. 2003, 78, 633S–639S. [Google Scholar] [CrossRef]
- Schweter, A.; Heimgärtner, C.; Jäger, J.; Schleicher, K.; Witetschek, S.; Lührmann, P. Ernährungsverhalten und körperliche Aktivität von Schwäbisch Gmünder Studentinnen. Prävent. Gesundh. 2011, 6, 270–276. [Google Scholar] [CrossRef]
- Bedford, J.L.; Barr, S.I. Diets and selected lifestyle practices of self-defined adult vegetarians from a population-based sample suggest they are more “health conscious”. Int. J. Behav. Nutr. Phys. Act. 2005, 2, 4. [Google Scholar] [CrossRef]
- Gille, D.; Schmid, A. Vitamin B12 in meat and dairy products. Nutr. Rev. 2015, 73, 106–115. [Google Scholar] [CrossRef]
- Watanabe, F. Vitamin B12 sources and bioavailability. Exp. Biol. Med. 2007, 232, 1266–1274. [Google Scholar] [CrossRef]
- Gilsing, A.M.J.; Crowe, F.L.; Lloyd-Wright, Z.; Sanders, T.A.B.; Appleby, P.N.; Allen, N.E. Serum concentrations of vitamin B12 and folate in British male omnivores, vegetarians and vegans: Results from a cross-sectional analysis of the EPIC-Oxford cohort study. Eur. J. Clin. Nutr. 2010, 64, 933–939. [Google Scholar] [CrossRef]
- Herrmann, W.; Geisel, J. Vegetarian lifestyle and monitoring of vitamin B-12 status. Clin. Chim. Acta 2002, 326, 47–59. [Google Scholar] [CrossRef]
- Kwok, T.; Cheng, G.; Woo, J.; Lai, W.K.; Pang, C.P. Independent effect of vitamin B12 deficiency on hematological status in older Chinese vegetarian women. Am. J. Hematol. 2002, 70, 186–190. [Google Scholar] [CrossRef] [PubMed]
- Mann, N.J.; Li, D.; Sinclair, A.J.; Dudman, N.P.; Guo, X.W.; Elsworth, G.R. The effect of diet on plasma homocysteine concentrations in healthy male subjects. Eur. J. Clin. Nutr. 1999, 53, 895–899. [Google Scholar] [CrossRef] [PubMed]
- Refsum, H.; Yajnik, C.S.; Gadkari, M.; Schneede, J.; Vollset, S.E.; Orning, L. Hyperhomocysteinemia and elevated methylmalonic acid indicate a high prevalence of cobalamin deficiency in Asian Indians. Am. J. Clin. Nutr. 2001, 74, 233–241. [Google Scholar] [CrossRef] [PubMed]
- Bechthold, A.; Albrecht, V.; Leschik-Bonnet, E.; Heseker, H. Beurteilung der Vitaminversorgung in Deutschland. Teil 1: Daten zur Vitaminzufuhr. Ernährungs Umsch. 2012, 59, 324–336. [Google Scholar]
- Bechthold, A.; Albrecht, V.; Leschik-Bonnet, E.; Heseker, H. Beurteilung der Vitaminversorgung in Deutschland. Teil 2: Kritische Vitamine und Vitaminzufuhr in besonderen Lebenssituationen. Ernährungs Umsch. 2012, 59, 396–401. [Google Scholar]
- Holick, M.F. Vitamin D deficiency. N. Engl. J. Med. 2007, 357, 266–281. [Google Scholar] [CrossRef] [PubMed]
- Walsh, J.H.; Wyse, B.W.; Hansen, R.G. Pantothenic acid content of 75 processed and cooked foods. J. Am. Diet. Assoc. 1981, 78, 140–144. [Google Scholar]
- Molag, M.L.; De Vries, J.H.; Ocké, M.C.; Dagnelie, P.C.; Van den Brandt, P.A.; Jansen, M.C.J.F. Design characteristics of food frequency questionnaires in relation to their validity. Am. J. Epidemiol. 2007, 166, 1468–1478. [Google Scholar] [CrossRef]


| Variable | Vegetarians (n = 31) | Omnivores (n = 30) | ||
|---|---|---|---|---|
| % of Participants | Mean ± SD | % of Participants | Mean ± SD | |
| Age (years) | 25.0 ± 17.7 | 20.0 ± 14.1 | ||
| BMI (kg/m²)a | 21.9 ± 7.0 | 22.5 ± 0.8 | ||
| BMI classificationa | ||||
| Underweight (<18.5 kg/m2) | 12.9 | 0 | ||
| Normal weight (≥18.5 to ≤24.9 kg/m2) | 77.4 | 83.3 | ||
| Overweight (≥25.0 kg/m2) | 9.7 | 16.7 | ||
| Physical activity levelsb | ||||
| Inactive | 6.5 | 10.0 | ||
| Moderately inactive | 16.1 | 10.0 | ||
| Moderately active | 12.9 | 16.7 | ||
| Active | 64.5 | 63.3 | ||
| Place of residence | ||||
| Northern Germany c | 9.6 | 13.3 | ||
| Western Germany d | 19.4 | 6.7 | ||
| Eastern Germany e | 19.4 | 20.0 | ||
| Southern Germany f | 51.6 | 60.0 | ||
| Household net income | ||||
| Not specified | 19.4 | 20.0 | ||
| No income | 19.4 | 23.3 | ||
| <10.000 €/year | 41.9 | 26.7 | ||
| 10.000–24.999 €/year | 9.7 | 10.0 | ||
| 25.000–39.999 €/year | 6.5 | 13.3 | ||
| 40.000–54.999 €/year | 0.0 | 3.3 | ||
| >55.000 €/year | 3.2 | 3.3 | ||
| Dietary supplementation | ||||
| Omega-3, fish oil or cod liver oil | 3.2 | 6.7 | ||
| Vitamin C | 9.7 | 10.0 | ||
| Vitamin D | 25.8 | 13.3 | ||
| Calcium | 0.0 | 6.7 | ||
| Iron | 25.8 | 20.0 | ||
| Nutritional Information | Vegetarians (n = 31) | Omnivores (n = 30) | p Value a | Dietary Reference Values (DRV) b | ||
|---|---|---|---|---|---|---|
| Mean ± SD | Median (IQR) c | Mean ± SD | Median (IQR) c | per Day | ||
| Energy (kcal) | 1993.5 ± 714.1 | 1905.1 (2594-1545) | 2070.9 ± 764.2 | 2089.4 (2767-1535) | 0.60 | 2150 |
| Energy (kJ) | 8352.6 ± 2989.4 | 7975.0 (10863-6482) | 8675.1 ± 3201.3 | 8750.0 (11590-6427) | 0.61 | No DRV |
| Protein (%TE) d | 15.6 ± 3.1 | 15.2 (19-13) | 16.2 ± 3.3 | 15.6 (18-15) | 0.58 | No DRV |
| Protein (g) | 79.0 ± 35.8 | 72.2 (105-51) | 84.3 ± 37.9 | 80.9 (106-54) | 0.57 | 48 |
| Fat (%TE) | 29.3 ± 6.1 | 29.6 (34-25) | 33.4 ± 5.0 | 32.1 (37-30) | 0.01 * | 30 |
| Fat (g) | 67.1 ± 33.2 | 64.0 (91-39) | 75.7 ± 26.4 | 73.3 (98-60) | 0.16 | No DRV |
| SFA (g) e | 24.8 ± 14.7 | 21.4 (33-15) | 31.5 ± 12.1 | 30.6 (39-23) | 0.02 * | No DRV |
| SFA (%TE) | 10.6 ± 3.3 | 10.6 (12-9) | 13.9 ± 3.0 | 13.5 (16-12) | 0.0001 *** | 10 |
| C16:0 (g) | 12.1 ± 6.9 | 11.0 (17-7) | 14.6 ± 5.4 | 14.7 (18-11) | 0.01 * | No DRV |
| C18:0 (g) | 4.3 ± 2.6 | 3.6 (6-2) | 6.5 ± 2.7 | 5.8 (9-4) | 0.002 ** | No DRV |
| MUFA (g) f | 22.6 ± 12.5 | 19.2 (31-13) | 25.2 ± 8.7 | 24.7 (32-20) | 0.15 | No DRV |
| MUFA (%TE) | 9.7 ± 2.7 | 9.8 (12-8) | 11.2 ± 2.6 | 10.8 (12-10) | 0.02 * | No DRV |
| PUFA (g) g | 15.3 ± 7.0 | 14.6 (21-10) | 13.8 ± 7.4 | 13.5 (17-9) | 0.32 | No DRV |
| PUFA (%TE) | 7.0 ± 2.3 | 6.0 (9-5) | 6.0 ± 1.9 | 5.4 (7-4) | 0.07 | No DRV |
| n6-PUFA (g) h | 12.9 ± 6.4 | 11.9 (17-8) | 11.4 ± 5.7 | 11.3 (15-7) | 0.36 | No DRV |
| n6-PUFA (%TE) | 5.9 ± 2.2 | 5.6 (7-4) | 5.0 ± 1.5 | 4.5 (6-4) | 0.10 | 2.5 |
| n3-PUFA (g) i | 2.2 ± 1.0 | 2.0 (2.9-1.6) | 2.3 ± 1.5 | 2.0 (2.5-1.6) | 0.88 | No DRV |
| n3-PUFA (%TE) | 1.0 ± 0.3 | 1.0 (1.2-0.8) | 0.8 ± 0.1 | 1.0 (1.1-0.7) | 0.26 | 0.5 |
| LC-n3-PUFA (g) j | 0.1 ± 0.2 | 0.1 (0.2-0) | 0.2 ± 0.2 | 0.2 (0.4-0.1) | 0.004 ** | No DRV |
| Cholesterol (mg) | 196.8 ± 157.4 | 135.2 (270-65) | 282.7 ± 161.1 | 238.3 (382-168) | 0.013 * | No DRV |
| Fiber (g) k | 34.7 ± 12.6 | 33.1 (48-27) | 26.3 ± 12.4 | 25.7 (31-17) | 0.01 ** | 30 |
| Starch (g) | 138.7 ± 58.3 | 134.8 (169-106) | 125.5 ± 57.6 | 123.8 (144-81) | 0.38 | No DRV |
| Carbohydrates (%TE) | 46.8 ± 6.3 | 47.9 (51-41) | 43.9 ± 5.6 | 45.2 (48-41) | 0.05 | 50 |
| Carbohydrates (g) | 243.7 ± 80.9 | 229.7 (299-203) | 245.4 ± 103.4 | 242.9 (112-168) | 0.97 | No DRV |
| Total sugars (%TE) | 18.3 ± 5.0 | 18.3 (22-15) | 19.9 ± 6.0 | 18.8 (24-16) | 0.39 | No DRV |
| Glucose (g) | 19.4 ± 7.9 | 18.5 (24-14) | 18.4 ± 8.4 | 17.5 (23-12) | 0.56 | No DRV |
| Sucrose (g) | 37.8 ± 20.1 | 28.5 (58-22) | 54.8 ± 38.7 | 50.3 (68-26) | 0.046 * | No DRV |
| Lactose (g) | 9.6 ± 12.0 | 5.5 (13-2) | 14.9 ± 13.4 | 10.3 (19-6) | 0.02 * | No DRV |
| Fructose (g) | 24.3 ± 12.7 | 23.4 (31-13) | 21.0 ± 12.0 | 19.1 (27-12) | 0.27 | No DRV |
| Calcium (mg) | 1137.9 ± 548.5 | 1004.6 (1440-727) | 1208.6 ± 733.8 | 1074.3 (1546-715) | 0.91 | 1000 |
| Magnesium (mg) | 524.6 ± 188.0 | 502.9 (652-392) | 429.8 ± 221.8 | 381.0 (564-294) | 0.03 * | 300 |
| Phosphorus (mg) | 1579.1 ± 672.0 | 1436.6 (2133-1099) | 1587.1 ± 726.8 | 1473.4 (2248-1010) | 0.99 | 700 |
| Sodium (mg) | 2771.8 ± 1134.8 | 2747.2 (3622-1823) | 2774.6 ± 1211.1 | 2627.9 (3260-1862) | 0.83 | 1500 |
| Potassium (mg) | 3740.6 ± 1267.6 | 3665.5 (4592-2882) | 3347.4 ± 1528.0 | 3077.8 (4117-2162) | 0.16 | 4000 |
| Iodine (µg) | 130.5 ± 62.1 | 116.7 (164-92) | 117.8 ± 55.3 | 108.6 (144-75) | 0.37 | 200 |
| Iron (mg) | 16.3 ± 5.9 | 15.0 (22-12) | 13.8 ± 6.4 | 12.8 (17-10) | 0.08 | 15 |
| Zinc (mg) | 12.6 ± 5.0 | 11.4 (17-9) | 12.2 ± 4.9 | 11.5 (16-8) | 0.97 | 8.0 |
| Selenium (µg) | 6.8 ± 7.0 | 4.3 (10-2) | 11.7 ± 15.8 | 7.3 (12-3) | 0.17 | 60 |
| Beta-carotene (µg) | 6204.6 ± 3595.0 | 5224.5 (7308-3653) | 4807.0 ± 5147.8 | 3228.8 (4720-2278) | 0.01 ** | 4800 |
| Retinol (µg) l | 330.2 ± 251.0 | 267.2 (499-134) | 614.4 ± 479.0 | 486.4 (747-292) | 0.0021 ** | No DRV |
| Retinol equivalents (µg) | 1383.3 ± 676.6 | 1294.6 (1723-884) | 1455.1 ± 1118.8 | 1155.9 (1682-795) | 0.56 | 800 |
| Thiamine (mg) | 1.8 ± 1.0 | 1.7 (2.1-1.2) | 1.8 ± 1.3 | 1.4 (2.3-1.0) | 0.82 | 1.0 |
| Riboflavin (mg) | 2.1 ± 0.9 | 1.7 (2.7-1.6) | 2.3 ± 1.7 | 2.0 (2.4-1.3) | 0.58 | 1.1 |
| Niacin (mg) | 17.0 ± 9.2 | 14.3 (21-11) | 18.0 ± 10.5 | 15.6 (45-23) | 0.72 | No DRV |
| Niacin equivalents (mg) | 31.6 ± 13.1 | 30.7 (38-22) | 33.8 ± 15.4 | 30.6 (45-23) | 0.76 | 12.5 |
| Pantothenic acid (mg) | 5.4 ± 2.4 | 4.7 (7-4) | 5.6 ± 2.8 | 5.1 (6-3) | 0.82 | 6.0 |
| Pyridoxine (mg) | 1.9 ± 0.8 | 1.9 (2.6-1.3) | 2.0 ± 1.7 | 1.8 (2.4-1.5) | 0.77 | 1.4 |
| Biotin (µg) | 63.5 ± 29.2 | 63.5 (84-42) | 56.3 ± 27.6 | 49.7 (69-35) | 0.32 | 30-60 |
| Folic acid (µg) | 354.6 ± 129.0 | 351.9 (461-265) | 304.0 ± 150.7 | 287.9 (342-216) | 0.08 | 300 |
| Cobalamin (µg) | 3.5 ± 2.3 | 3.3 (5-2) | 5.6 ± 3.6 | 4.7 (6-3) | 0.01 ** | 4.0 |
| Ascorbic acid (mg) | 152.0 ± 75.7 | 138.8 (192-106) | 136.7 ± 69.9 | 123.3 (177-86) | 0.41 | 95 |
| Cholecalciferol (µg) | 8.9 ± 8.8 | 5.9 (11-4) | 7.8 ± 9.5 | 4.2 (7-4) | 0.30 | 20 |
| Alpha-Tocopherol (mg) | 13.9 ± 5.8 | 13.2 (20-9) | 12.1 ± 5.5 | 11.3 (16-9) | 0.28 | 12 |
| Alcohol (g) | 11.2 ± 17.5 | 5.4 (11-0.2) | 6.7 ± 6.9 | 4.4 (12-0.8) | 0.72 | 10 |
| Components | Maximum Scores | Scoring Vegetarians (n = 31) | Scoring Omnivores (n = 30) | p Value d | ||
|---|---|---|---|---|---|---|
| Mean ± SD | Median (IQR) c | Mean ± SD | Median (IQR) c | |||
| Adequacya | ||||||
| Total fruits 1 | 5 | 4.2 ± 1.7 | 5.0 (5-5) | 4.3 ± 1.5 | 5.0 (5-5) | 0.82 |
| Whole fruits 2 | 5 | 4.1 ± 1.7 | 5.0 (5-4) | 4.0 ± 1.6 | 5.0 (5-3.4) | 0.94 |
| Total vegetables | 5 | 4.8 ± 0.8 | 5.0 (5-5) | 4.5 ± 1.3 | 5.0 (5-5) | 0.36 |
| Greens & Beans 3 | 5 | 5.0 ± 0.2 | 5.0 (5-5) | 4.6 ± 1.2 | 5.0 (5-5) | 0.06 |
| Whole Grains | 10 | 9.7 ± 1.4 | 10.0 (10-10) | 9.3 ± 2.1 | 10.0 (10-10) | 0.30 |
| Dairy 4 | 10 | 5.4 ± 4.3 | 4.8 (10-1.1) | 8.0 ± 3.1 | 10.0 (10-7.1) | 0.01 ** |
| Total Protein Foods | 5 | 2.8 ± 0.6 | 2.7 (3.2-2.3) | 2.9 ± 0.6 | 2.8 (3.1-2.6) | 0.63 |
| Seafood & Plant Proteins 5 | 5 | 4.8 ± 0.7 | 5.0 (5-5) | 3.9 ± 1.4 | 4.9 (5-2.6) | 0.001 ** |
| Fatty Acids 6 | 10 | 6.7 ± 2.0 | 6.5 (8-4.9) | 5.1 ± 1.5 | 4.7 (6-4.1) | 0.001 ** |
| Moderationb | ||||||
| Refined Grains | 10 | 9.3 ± 0.9 | 9.7 (10-8.8) | 9.4 ± 0.7 | 9.6 (10-9.1) | 0.71 |
| Sodium | 10 | 6.7 ± 2.8 | 7.0 (9.1-5) | 6.9 ± 2.7 | 7.3 (9.4-5) | 0.92 |
| Added Sugars 7 | 10 | 9.3 ± 1.1 | 10.0 (10-8.8) | 7.9 ± 2.3 | 8.4 (10-7.1) | 0.003 ** |
| Saturated Fats | 10 | 6.5 ± 3.3 | 6.7 (9.3-5.2) | 3.3 ± 2.7 | 3.1 (5.6-0.6) | 0.0002 *** |
| Total Score | 100 | 79.0 ± 16.0 | 82.5 (100-66.3) | 73.9 ± 17.7 | 80.7 (100-63.8) | 0.83 |
Publisher’s Note: MDPI stays neutral with regard to jurisdictional claims in published maps and institutional affiliations. |
© 2021 by the authors. Licensee MDPI, Basel, Switzerland. This article is an open access article distributed under the terms and conditions of the Creative Commons Attribution (CC BY) license (http://creativecommons.org/licenses/by/4.0/).
Share and Cite
Blaurock, J.; Kaiser, B.; Stelzl, T.; Weech, M.; Fallaize, R.; Franco, R.Z.; Hwang, F.; Lovegrove, J.; Finglas, P.M.; Gedrich, K. Dietary Quality in Vegetarian and Omnivorous Female Students in Germany: A Retrospective Study. Int. J. Environ. Res. Public Health 2021, 18, 1888. https://doi.org/10.3390/ijerph18041888
Blaurock J, Kaiser B, Stelzl T, Weech M, Fallaize R, Franco RZ, Hwang F, Lovegrove J, Finglas PM, Gedrich K. Dietary Quality in Vegetarian and Omnivorous Female Students in Germany: A Retrospective Study. International Journal of Environmental Research and Public Health. 2021; 18(4):1888. https://doi.org/10.3390/ijerph18041888
Chicago/Turabian StyleBlaurock, Julia, Birgit Kaiser, Tamara Stelzl, Michelle Weech, Rosalind Fallaize, Rodrigo Zenun Franco, Faustina Hwang, Julie Lovegrove, Paul M. Finglas, and Kurt Gedrich. 2021. "Dietary Quality in Vegetarian and Omnivorous Female Students in Germany: A Retrospective Study" International Journal of Environmental Research and Public Health 18, no. 4: 1888. https://doi.org/10.3390/ijerph18041888
APA StyleBlaurock, J., Kaiser, B., Stelzl, T., Weech, M., Fallaize, R., Franco, R. Z., Hwang, F., Lovegrove, J., Finglas, P. M., & Gedrich, K. (2021). Dietary Quality in Vegetarian and Omnivorous Female Students in Germany: A Retrospective Study. International Journal of Environmental Research and Public Health, 18(4), 1888. https://doi.org/10.3390/ijerph18041888