Article

Identification of Risk Factors for Suicidal Ideation and Attempt Based on Machine Learning Algorithms: A Longitudinal Survey in Korea (2007–2019)

1
Yonsei Graduate Program in Cognitive Science, Yonsei University, Seoul 03722, Korea
2
Department of Psychology, Yonsei University, Seoul 03722, Korea
*
Author to whom correspondence should be addressed.
These authors contributed equally.
Int. J. Environ. Res. Public Health 2021, 18(23), 12772; https://doi.org/10.3390/ijerph182312772
Submission received: 14 October 2021 / Revised: 24 November 2021 / Accepted: 1 December 2021 / Published: 3 December 2021

Abstract

:
Investigating suicide risk factors is critical for socioeconomic and public health, and many researchers have tried to identify factors associated with suicide. In this study, the risk factors for suicidal ideation were compared, and the contributions of different factors to suicidal ideation and attempt were investigated. To reflect the diverse characteristics of the population, the large-scale and longitudinal dataset used in this study included both socioeconomic and clinical variables collected from the Korean public. Three machine learning algorithms (XGBoost classifier, support vector classifier, and logistic regression) were used to detect the risk factors for both suicidal ideation and attempt. The importance of the variables was determined using the model with the best classification performance. In addition, a novel risk-factor score, calculated from the rank and importance scores of each variable, was proposed. Socioeconomic and sociodemographic factors showed a high correlation with risks for both ideation and attempt. Mental health variables ranked higher than other factors in suicidal attempts, posing a relatively higher suicide risk than ideation. These trends were further validated using the conditions from the integrated and yearly dataset. This study provides novel insights into suicidal risk factors for suicidal ideations and attempts.

1. Introduction

In the past 10 years, approximately 800,000 people committed suicide annually [1,2,3]. Suicidal mortality is considered a critical factor for both social and public health [4,5,6]. Many previous studies have suggested that death by suicide has socioeconomic and psychological consequences, burdening members of society [7,8,9]. Paul et al. [10] analyzed the social and economic burden of suicide in the Hong Kong SAR. In addition, Shumona et al. [11] attempted to validate suicidal risk factors and their impact in rural Bangladesh. They suggested that the burden of suicide is a major health problem. In the current COVID-19 pandemic, depression and suicide are important mental health care challenges [12,13,14].
To solve problems related to suicide, researchers have attempted to identify its underlying factors. Using systematic reviews, Elizabeth et al. [15] proposed several risk factors associated with suicidal self-directed violence among veterans living in the US. In addition, Mościcki [16] investigated the contributions of sociodemographic factors (e.g., age, gender, race, and socioeconomic status) to suicidal risk based on epidemiologic studies. Madelyn et al. [17] demonstrated the risk of psychosocial factors associated with suicide in children and adolescents. In their final analysis, socioenvironmental circumstances were confirmed to be a significant factor in teenage suicide risk.
Previous studies have focused on two categories of risk factors: “psychiatric or clinical” and “economic or social elements”, which were determined to be influential factors in related studies. However, the focus on these variables in related studies differed depending on the topic of interest or the population studied. First, when conducting research with psychiatric patient groups, major associations between the clinical variables and suicidal risk were found. For example, Gregory et al. [18] attempted to determine the risk factors for psychiatric outpatient groups. Various variables, including the current intensity of the patients’ specific attitudes and behaviors, were collected from a total of 6981 patients. The contributions of psychiatric variables to the risk of eventual suicide were identified among diverse categories of variables, including clinical and economic factors. Second, when conducting research on patient groups from specific population (e.g., children or adolescents), socioeconomic factors were found to be major influencing factors. Esben et al. [19] estimated the risk factors for young people living in Denmark. Their participants answered survey questions detailing mental illness, employment, and income. Having parents with a low socioeconomic status was found to be a relatively high risk factor for suicide among young people. To reflect the diverse characteristics of the population as much as possible, we analyzed large-scale and longitudinal datasets collected from the Korean public. Moreover, in terms of a multivariate analysis, diverse variables, including both clinical and socioeconomic factors, were used to determine associations between the factors.
In addition, the study groups were divided according to suicide-related events. Nock and Banaji [20] predicted suicidal ideation and suicide attempts based on test results. Their participants were divided into three groups (i.e., non-suicidal, suicide ideators, and recent suicide attempters), and the analysis results were compared. To examine the different characteristics of suicide attempters and suicide completers, Konrad [21] evaluated their medical fitness, personality, and clinical characteristics. Matthew et al. [22] compared the risk factors of suicidal ideation, plans, and attempts through a cross-national analysis. Some researchers analyzed the effects of risk factors by comparing multiple datasets. To investigate the effects of factors contributing to suicide events, namely, suicide ideation, planning, attempts, and completion, datasets of multiple events were compared in numerous previous studies [23,24,25].
To identify risk factors based on participant characteristics, diverse methodologies for analysis, including statistical modeling, have been applied. Gutierrez et al. [26] used structural equation modeling to determine the relationships between candidate risk factors. A chi-square analysis was subsequently used to validate the modeling results. Berman [27] utilized descriptive statistics (e.g., mean and proportions) to summarize patient characteristics. Fisher’s exact test with a two-tailed test was used to compare the clinical characteristics of the patient groups. Using Pearson’s correlation analysis, Park and Jang [28] evaluated the association between suicide rates and risk factors among Korean adolescents.
In recent studies, machine learning algorithms have shown better performance than traditional statistical methods for structural type datasets (e.g., datasets collected from surveys). Subramani et al. [29] attempted to forecast the risk of diabetes through electronic medical records (EMRs) with machine learning classifiers, such as support vector machines and decision trees. Sangita et al. [30] used a logistic regression model to investigate the nutritional status of children using Indian demographic and health survey datasets. From these studies, it was confirmed that machine learning models have sufficient capability to analyze structural datasets.
Machine learning models have been applied in many previous studies to investigate the risk factors for suicide. De la Garza et al. [31] attempted to determine the risk factors for nonfatal suicide attempts. They utilized the importance of features in trained algorithms to determine the emphasized variables. Samah et al. [32] proposed a machine learning-based framework to detect potential suicide risk factors using text datasets collected from Twitter. The decision tree model and K-means clustering algorithms were applied to classify the risk levels. The clustering results and classification performances were used to identify the risk factors for suicide. The authors reported that words related to feelings of depression and self-harm were important in classifying suicide risk levels.
Suicidal ideation and attempt are compared in this study to analyze and determine the relative influence of risk factors. The degree of risk for suicide ideation was set as a low-risk condition, and that for suicide attempt was set as a relatively high-risk condition. The importance of different risk factors for a suicide attempt was examined in the high-suicide-risk group based on the underlying effects (e.g., economic and psychological burden). Machine learning algorithms were used to compare the influence of risk factors for suicidal ideation and suicide attempts separately with that of suicide risk (i.e., suicide ideation was classified as a low suicide risk, and suicide attempt was classified as a relatively high suicide risk). The longitudinal dataset obtained from the general population of Korea was utilized to determine the risk factors. In addition, a new risk-factor score based on feature importance and the rank of the variable was proposed to confirm their importance in suicidal ideation and attempt.
The major contributions of our research are as follows. First, to reflect the various characteristics of the study population, large-scale (n = 215,522) and longitudinal (from 1998 to 2019) datasets collected in Korea were used. Second, machine learning algorithms were applied to detect the inherent patterns and factors in the dataset associated with suicide ideation and suicidal attempts from the dataset. Third, a novel risk-factor score was proposed and applied to compare the importance of the factors using the results of the machine learning classifiers. Finally, the risks for suicide ideation and attempt were separately validated based on a comparison between the risks of both suicide ideation and attempt.

2. Materials and Methods
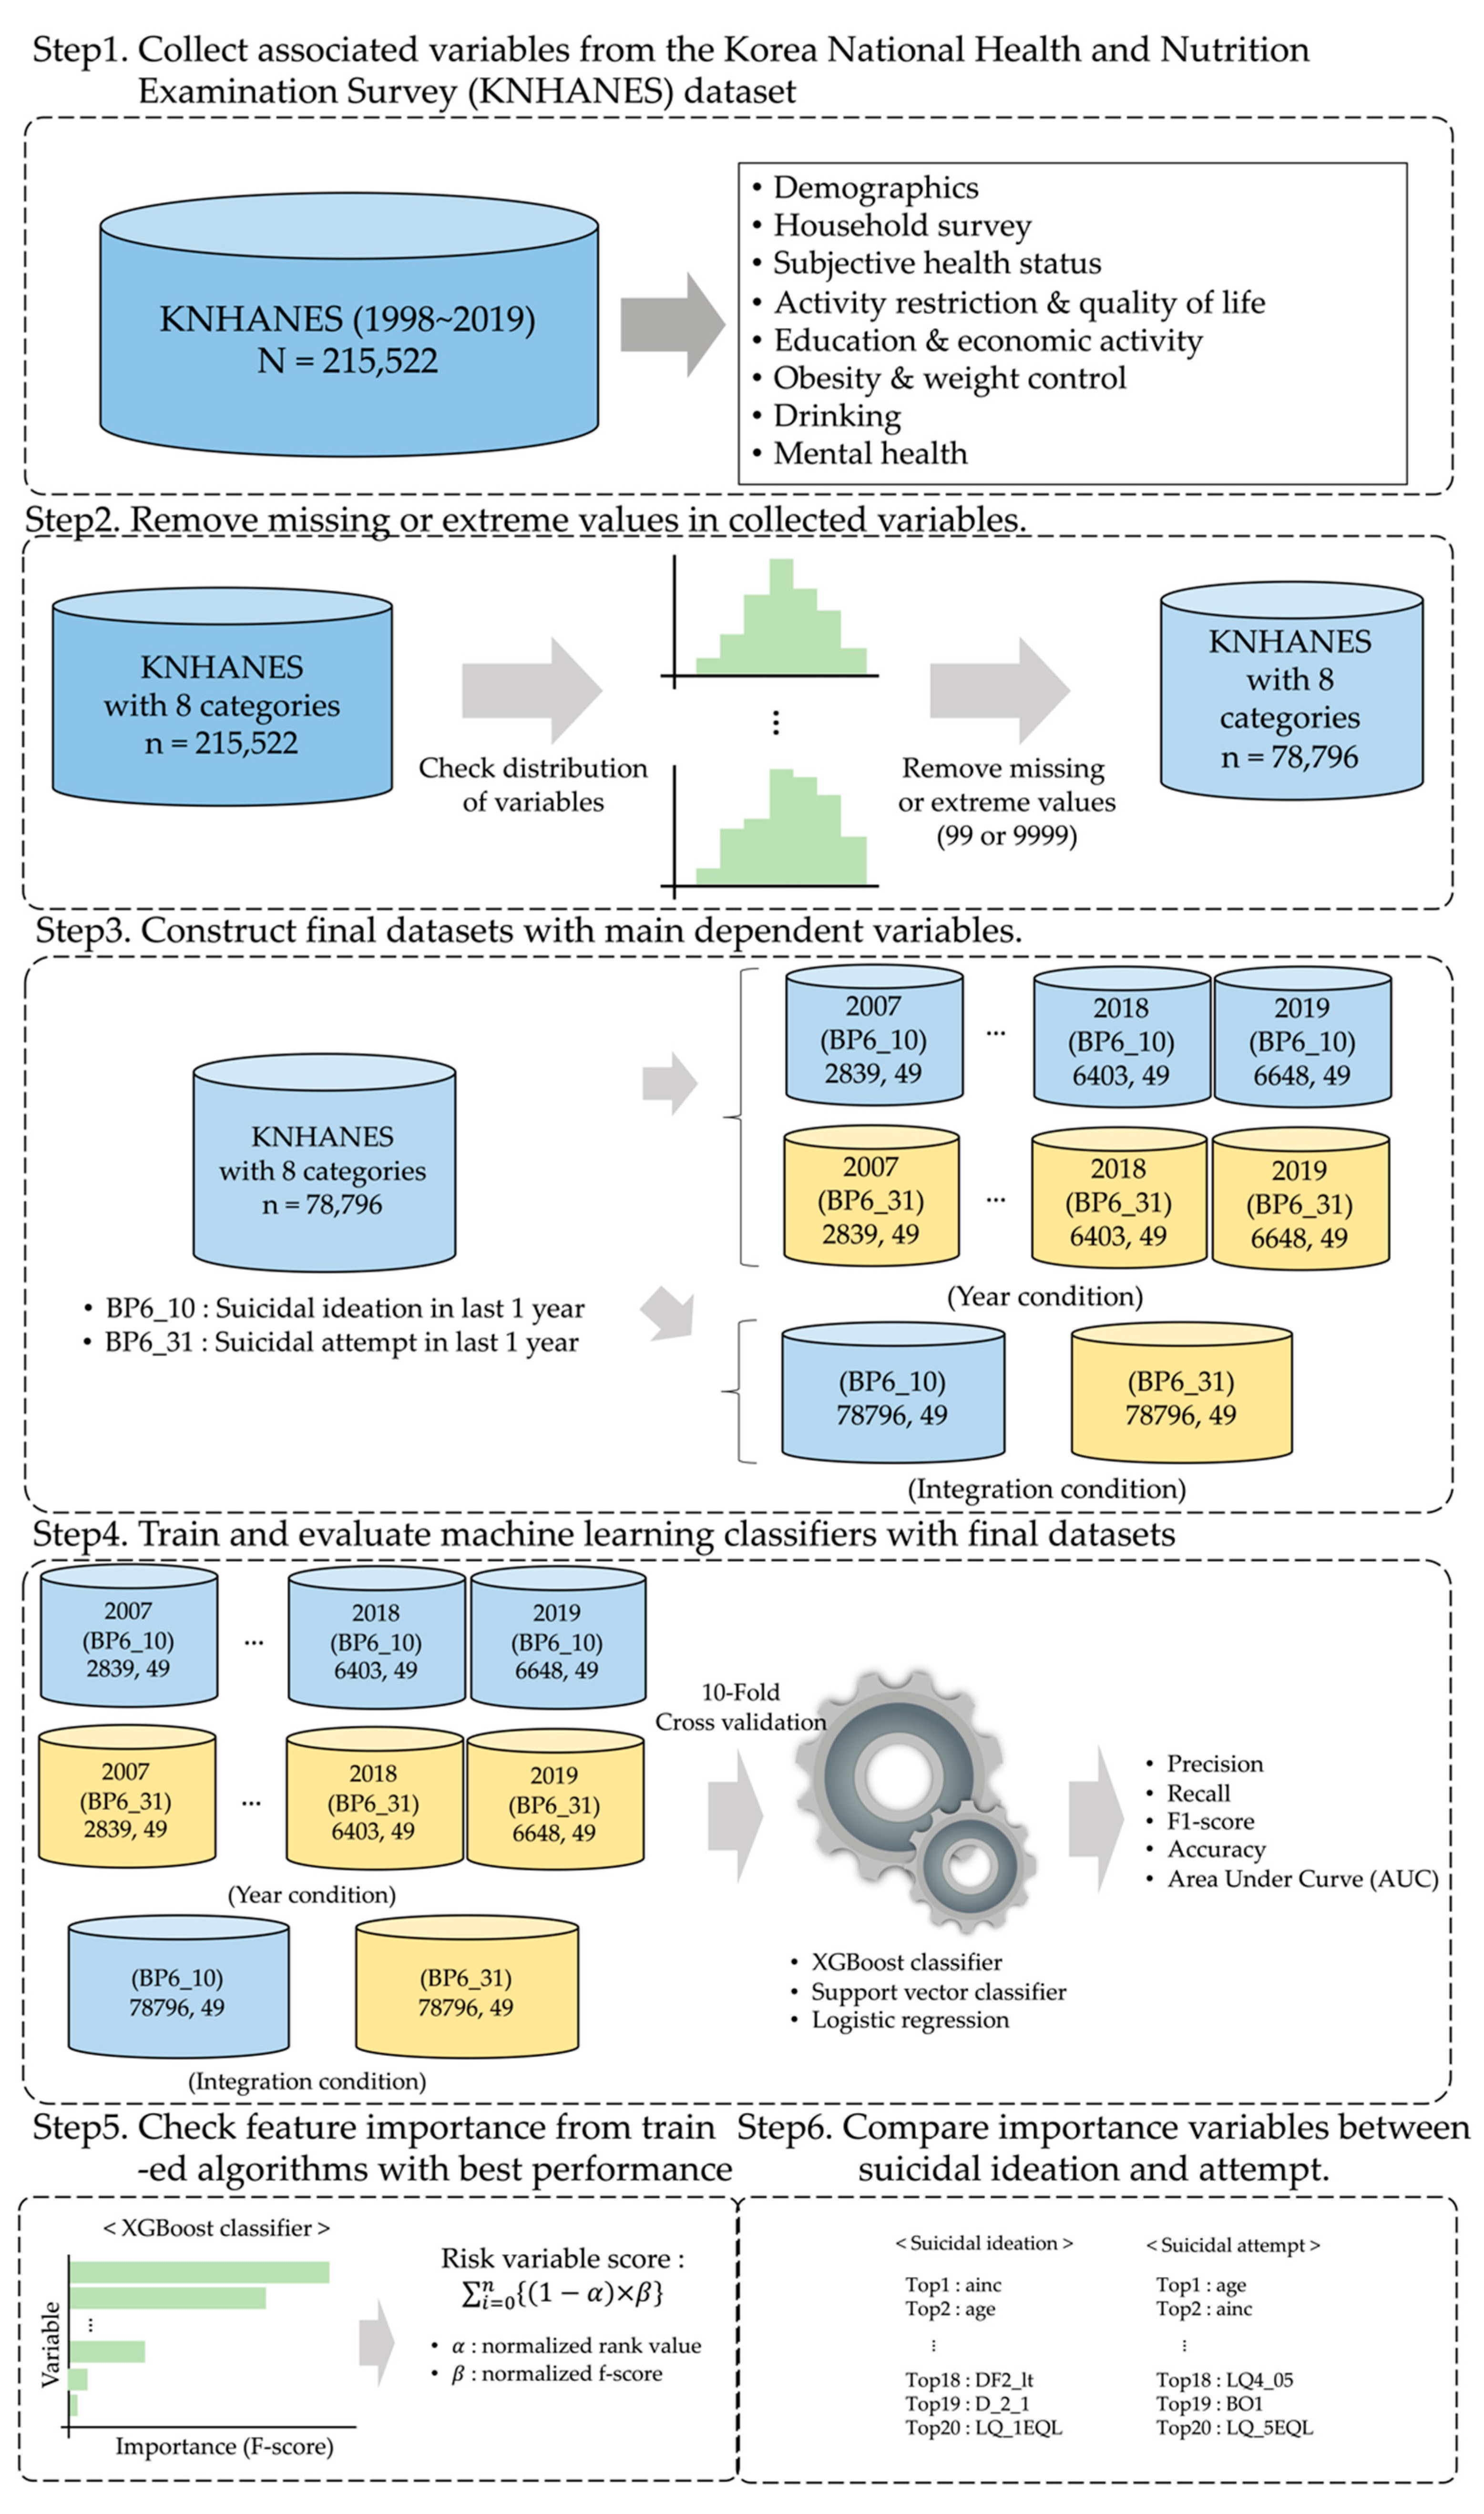
2.1. Overview

To determine the major risk factors for suicidal ideation and attempts, our research was divided into six steps. First, the associated variables were collected from the Korea National Health and Nutrition Examination Survey (KNHANES) dataset. Second, missing or extreme values among the collected variables were removed to better reflect the characteristics of the participants. Third, the final datasets were constructed based on the main dependent variables (i.e., suicide ideation and suicide attempts). Fourth, three machine-learning algorithms were trained and evaluated using previously organized datasets. Fifth, the importance of each feature was determined using the model with the best classification performance. Finally, the score of each variable was calculated and compared to reveal the differences between ideation and suicide attempts. The detailed steps are shown in Figure 1.

2.2. Data Source

In this study, the open-source KNHANES dataset released by the Korea Disease Control and Prevention Agency (KDCA) [33] was utilized to compare the risk factors of suicidal ideation and attempts. KNHANES is a longitudinal survey that investigates the health status, health-related awareness and behavior, and nutritional status of people living in Korea. This survey is conducted annually by the KDCA. The first survey was conducted in 1998 and was repeated at three-year intervals until 2005. Since 2007, surveys have been conducted annually. A total of 216,815 people participated in the survey from 1998 to 2019. The original datasets collected from the surveys are available to the public. The KNHANES dataset was constructed using nine categories of survey variables. A detailed list of the categories is presented in Table 1.
The survey results were stored in two datafiles. In the first file, survey variables for the health behavior, blood test, blood pressure test, and hand grip test results were included. The other test results (dietary life, food safety, food intake, and dietary life evaluation) were stored in a second datafile. All variables in the data files can be merged based on the participant ID.
Additionally, the public dataset on suicide rate released by the Korean Statistical Information Service (KOSIS) was utilized to investigate the effects of suicide rate on the associated risk factors. In this study on the KNHANES datasets from 1998 to 2019, twenty-one suicide rate values were used for the analysis.

2.3. Data Preprocessing

2.3.1. Collection and Selection of Associated Variables from Datasets

To reflect the various characteristics of the participants, all available datasets in KNHANES (i.e., from 1998 to 2019) were utilized. In addition, the associated variables, including socioeconomic and psychiatric variables, were selected from the datasets. Among the nine categories of variables, the variables for demographics, household, subjective health status, activity restriction and quality of life, education and economic activity, obesity and weight control, drinking, and mental health were extracted to identify major suicidal risk factors. The dimensions of the original dataset were (215,522, 851). After the extraction of relevant variables, the dimensions of the remaining dataset were (78,796, 58). The baseline characteristics of the datasets are listed in Table 2.

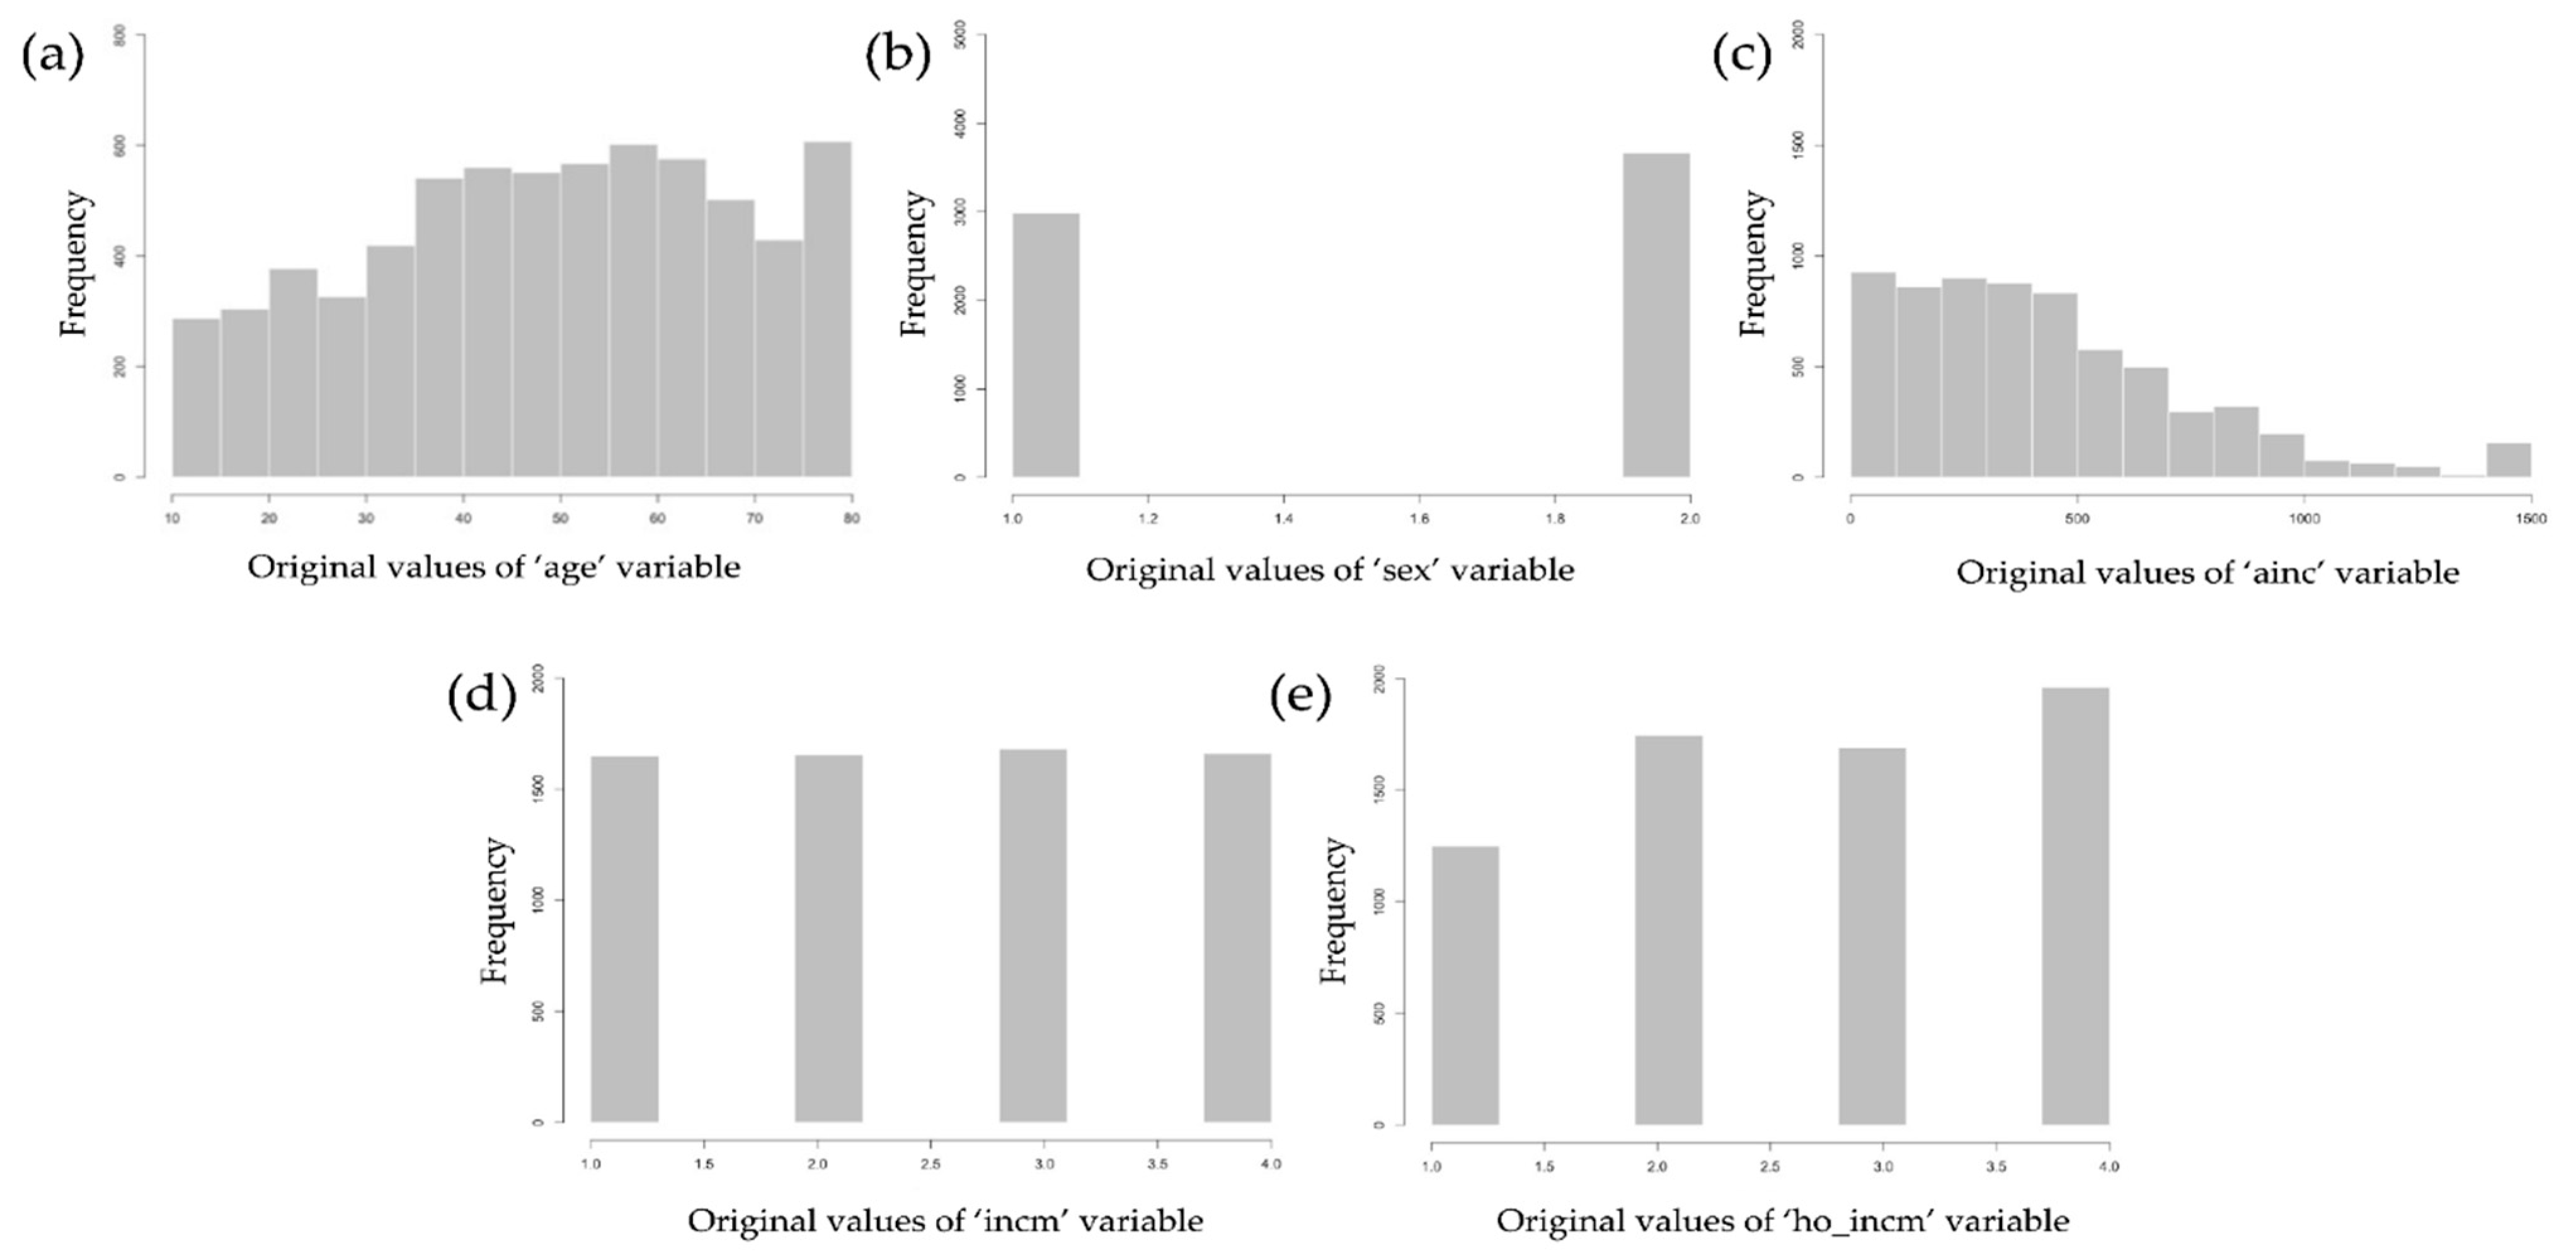
2.3.2. Removal of Missing or Extreme Data in the Dataset

The distributions of the variables were analyzed to remove missing or extreme values from the data. In the KNHANES dataset, the missing values were coded as 99 or 9999. To reflect the exact response to each variable, the distribution of each variable was examined using histograms. After removing the variables in more than half of the responses, 48 variables remained. The distribution of the variables used in our study is shown in Figure 2.
After verifying the distribution of each variable in the datasets, the remaining variables in the datasets from 1998 to 2019 were compared. For the comparison, common variables were selected from a total of 13 datasets for the years 2007 to 2019. Datasets from 1998 to 2006, with uncommon variables, were excluded. The dimensions and number of participants for the 13 datasets from 2007 to 2019 are listed in Table 3.

2.3.3. Generation of the Final Datasets for the Evaluation of Machine Learning Classifiers

To verify the difference between suicidal ideation and attempt, we set “BP6_10” (suicidal ideation within the last year) and “BP6_31” (suicide attempts within the last year) as the dependent variables. Other variables were applied to the machine learning classifiers as independent variables. The dataset was divided by year to compare the analysis results individually, and the integrated dataset was further analyzed, regardless of the year, to investigate differences in the risk factors. The suicide rates per year in the dataset were used to determine the effect of suicide rate on major risk factors for suicide.
Based on the aforementioned conditions used for the comparison in our study, the comparison of the experimental results was performed under a total of 28 conditions (two dependent conditions in 14 datasets from 2007 to 2019). The datasets for the 28 conditions were divided into training and test datasets with an 8:2 ratio.

2.4. Training and Evaluation of Machine Learning Classification Algorithm

As described in the previous section, the machine learning classifiers were applied to the 28 conditions in the datasets for a comparison. In this study, the XGBoost classifier, support vector classifier, and logistic regression were used. According to the binary characteristics of the dependent variables (“BP6_10” and “BP6_31”), all algorithms performed binary classification tasks under all experimental conditions. The BP6_10 and BP6_31 variables were collected from different survey questions. The BP6_10 values consisted of binary answers to “Have you thought about suicide within the last year?” The BP6_31 values consisted of binary answers to “Have you attempted suicide within the last year?” Participants answered both questions in binary format (i.e., yes = 1; no = 0). The importance of the features was recorded for the test dataset to identify important features among the independent variables using the trained algorithms.
A random search was conducted to determine the optimal hyperparameters of the three ML classifiers, as listed in Table 4. In addition, to prevent overfitting of the classification algorithms, 10-fold cross-validations were applied when training the algorithms.

2.5. Calculation of the Risk-Factor Score from Feature Importance Results

From the evaluation of the trained algorithms on the test datasets, the importance of each feature was determined for the best performing classifier. The importance scores (e.g., F-score for XGBoost classifier, coefficients for SVC, and logistic regression) and rank for each variable were confirmed through the analysis of feature importance. To simultaneously consider both results (importance score and rank of the variable), a new quantified score was devised for the risk of each variable by integrating the importance and rank. The proposed score for each variable was calculated using the following formula:
Risk - factor   score = i = 0 n ( 1 α i ) × β i n
where α denotes a normalized rank between 0 and 1, and β represents the normalized importance score. In our study, a 10-fold cross-validation was used for training and evaluating the algorithms. As a result, 10 evaluation sets were used for each experiment, and the same results for the evaluation of the variables were observed. Finally, to create a single score, the values for multiple variables were averaged.

2.6. Machine Learning (ML) Classification Algorithms

2.6.1. XGBoost Classifier

The XGBoost classifier is a supervised learning algorithm based on gradient boosting methods [34]. This classification model was constructed using classification and regression tree (CART) methods. In addition, it is an ensemble model composed of several decision-tree models. The objective function of this algorithm with ensemble learning is as follows:
Objective   function = i = 1 n L ( y i , y i ) + j = 1 m Ω ( f j )
where   y i = k = 1 K f k ( x i )
In the above function, the first formula indicates the objective function of the XGBoost classifier. Function L is the loss function for the algorithm evaluation. In addition, the function Ω denotes the regularization term and mean complexity of the models. y i values are calculated using the k th decision tree, represented by f k . In this study, y i set class labels can denote suicidal ideation or attempts (e.g., coded with 0 or 1 for suicidal ideation or attempt, respectively, within the past year).

2.6.2. Support Vector Classifier

The second classification algorithm used in this study is the support vector classifier (SVC) with radial basis function (RBF) kernels [35]. This classification algorithm divides the feature space into hyperplanes that are separated using class labels. A radial basis function kernel with non-linear characteristics was applied to the classifiers. In previous studies, linear kernels were used for binary classification tasks [36]. Here, it was experimentally verified that the SVC model with the RBF kernel resulted in better model performance compared with the model with a linear kernel. In addition, completely participant-separated datasets were used to avoid overfitting the classifiers.

2.6.3. Logistic Regression

The last classification algorithm used in our study was the logistic regression model. This classification model calculates the log-odds value of each variable and applies a sigmoid function to each result [37]. The probability that the data belong to the corresponding class was calculated using this model. A probability higher than 0.5 indicates that the variable was classified as being a risk factor for having had suicidal ideation or attempt in the past year. The basic form of this model including the variables and classes for suicidal ideation or attempts is as follows:
F ( z ) = E ( Y X ) = 1 1 + e ( α + β i X i )
where   z = α + β i X i + β 2 X 2 + + β k X k

2.7. Evaluation Metrics

The classification performance of the machine learning classifiers was compared using five evaluation metrics. To evaluate the experimental results obtained from the model, the true positive (TP), true negative (TN), false negative (FN), and false positive (FP) values were calculated using the confusion matrix. The ratio of correctly classified samples was calculated based on TP and TN values. In addition, incorrectly classified samples were indicated by FN and FP. Finally, we obtained four indicators: precision, recall, f1-score, and accuracy. Furthermore, the true positive rate (TPR) and false positive rate (FPR) were determined to establish the receiver operating characteristic (ROC) curve. The area under the curve (AUC) was calculated from the ROC curve.
Precision = TP TP + FP
Recall = TP TP + FN
F 1 score = 2 × Precision × Recall Precision + Recall
Accuracy = TP + TN TP + FP + TN + FN
True   Positive   Rate = TP TP + FN
False   Positive   Rate = FP FP + TN

2.8. Tools

All codes for ML classifiers and data preprocessing were written using Python (version 3.7.1; scikit-learn, version 2.4.1) and R (version 4.0.3) programming languages.

3. Results

3.1. Classification Performance Results from ML Classifiers

To identify risk factors using various variables, three machine-learning classifiers were applied to the preprocessed datasets. The classification performance results were compared using five evaluation metrics (precision, recall, f1-score, accuracy, and AUC). Among the three classifiers (XGBoost, SVC, and LR) used in this study, the XGBoost classifier demonstrated the best classification performance. In the experimental results, the highest evaluation metrics for both dependent variables were obtained from the integrated datasets. In addition, for the yearly datasets, the XGBoost classifier showed better performance than the other two algorithms. Details of the classification performance results are listed in Table 5, Table 6 and Table 7.

3.2. Feature Importance for the Identification of Risk Factors

Based on the classification performance results, important features from the trained XGBoost classifier were determined. The models with the best classification performances were selected to determine which features of the trained algorithms were important and reflected the characteristics of the variables. Common and unique factors associated with suicidal ideation and suicide attempts were identified and compared.
For the case with the integrated dataset, important features and their risk-factor scores are listed in Table 8. There are seven common variables with a high rank (ranked 1 to 7). Socioeconomic variables (e.g., average monthly income, age, drinking age, and education level) and nonmental health-related variables were identified as common variables. Next, the differences in ranks between the variables were examined for middle and low ranks (from rank 8 to 20). Unlike suicidal ideation-related risk factors, mental health-related variables (e.g., prevalence of depression, anxiety/depression in quality of life, and depression for more than 2 weeks) were ranked higher as being a risk factor for suicidal attempt.
In the results on the yearly dataset conditions, trends similar to those of the integrated dataset conditions were identified. The detailed results of the yearly dataset conditions are listed in Table 9, Table 10 and Table 11 and Supplementary Tables S1–S5. In addition, the suicide rate was analyzed by year, together with the experimental results. First, socioeconomic variables, including average monthly income, were found among the high ranking common variables of the two dependent variables. Second, similar to the analysis results obtained from the previously integrated dataset, mental health-related variables were confirmed to be ranked relatively high for risk of suicidal attempt. Third, considering the suicide rate, it was verified that the aforementioned characteristics of mental health variables were more prominent. For example, in 2009, 2010, and 2011, when the suicide rate was relatively high (31.0% in 2009, 31.2% in 2010, and 31.7% in 2011), the prevalence of depression, subjective health status, and depression for more than 2 weeks were ranked higher than other results for the same socioeconomic variables in 13 years.

4. Discussion

In this study, the risk factors associated with suicidal ideation and attempts were compared using machine learning classifiers. To determine the important factors, machine-learning algorithms were utilized for dataset analysis. After confirming the related factors using the classification algorithm, a novel risk-factor score based on the rank and importance scores was calculated from the algorithm to evaluate the importance of variables. To investigate the differences in the importance of factors, based on suicide risk level, suicide ideation was set as having a low suicide risk and suicide attempt was set as having a high suicide risk, prior to analyzing the results. In the experimental results, we found that the associations of socioeconomic and sociodemographic variables were high for both suicide ideation and attempt. In addition, the risk-factor scores of mental health variables were higher than those for other variables for the high suicide risk condition (i.e., suicide attempt).
Reasonable evidence was gathered from previous studies on the research topics (i.e., suicidal risk factors, suicidal ideation, suicidal attempts, and machine learning algorithms) before conducting our study. First, with regard to suicidal ideation and risk factors, Hintikka et al. [38] analyzed a 3-year prospective follow-up dataset collected from people living in Finland (n = 1339) to identify factors associated with suicidal ideation. From a longitudinal follow-up dataset, the authors focused on the risk factors of suicidal ideation. The impacts of sociodemographic and socioeconomic factors, including lifestyle, were identified for suicidal ideation. Weber et al. [39] examined the relationship between suicidal ideation and the diverse variables in a population sampled from college students. Among the variables used in this study, depression- and hopelessness-related variables showed a strong association with the main dependent variable (suicidal ideation). Kleiman et al. [40] attempted to identify related risk factors and their degree of variation in suicidal ideation within a short period of time. Well-known risk factors for suicidal ideation, such as hopelessness, burdensomeness, and loneliness, were varied and correlated with suicidal ideation. Second, many previous studies have associated various risk factors with suicide attempts. For example, Beautrais et al. [41] applied case–control designed datasets collected from 129 young people who had made serious suicide attempts. Among the various factors, the contributions of the risk factors of childhood adversity, social disadvantage, and psychiatric morbidity were found to be significant in the analysis results. Teti et al. [42] systematically reviewed several published studies to find similar risk factors for suicide among Latin American and Caribbean people. Major depressive disorder, family dysfunction, and prior suicide attempts were confirmed as the main risk factors. Parra-Uribe et al. [43] focused on the risk factors of suicide re-attempts and completed suicides after previous attempts. The authors identified the influences of alcohol use, personality disorders, and younger age on suicide re-attempts.
Finally, regarding the investigation of risk factors using machine learning algorithms, there were several previous studies on the detection of associated factors and suicide. Taneja et al. [44] applied a random forest classifier to predict the risk of sepsis from clinical variables in electronic medical record (EMR) datasets. The prediction model proposed that the “PCT” and “IL-6” variables are important in predicting risk of sepsis. Walsh et al. [45] applied machine learning algorithms to predict the risk of suicide attempts. A dataset comprising 5167 people was analyzed using the random forest algorithm. Among the predictors used in random forest models, non-fatal prior experience of suicide attempts, hospital utilization history, and visit tallies are the most important predictors. Colin et al. [46] used a machine-learning model to predict suicide attempts in adolescents. Longitudinal datasets collected from 974 adolescents over 17 years were used to investigate the effects of associated factors. Random forest algorithms were used to analyze the datasets. Among the feature importance results of predictors, the top 20 predictors were compared to evaluate their importance. Body mass index (BMI), age, anilide medications, propionic acid derivative medication, and selective serotonin reuptake inhibitors were identified as the top five important factors for suicide attempt prediction. A history of episodic mood disorder and other medication-related variables ranked relatively low in the experimental results.
Based on previous studies, we found it reasonable to conduct research on the selected topics of our study (i.e., identification of major risk factors for suicidal ideation and attempts with machine learning models). The experimental design of previous studies was adopted in our study. Unlike previous researchers who used datasets on specific patient groups, De la Garza et al. [31] used longitudinal datasets from a National US survey to investigate the characteristics of the general population. They divided the datasets based on intervals (e.g., from 2001 to 2002 was wave 1 and from 2004 to 2006 was wave 2) to compare the effects of the factors between periods. From the collected datasets, risk factors for suicide attempts were detected using a machine learning algorithm (random forest model). In wave 1, various variables, such as disorder-related variables (e.g., alcohol use, drug use, and nicotine dependence) and mood disorders (panic and bipolar disorder), were collected through interviews with participants. Three years after wave 1, in wave 2, the main dependent variables (i.e., non-fatal suicide attempts) were collected. A balanced random forest classifier was used to identify factors associated with suicide attempts through processed features in wave 1 and binary suicide attempts in wave 2. To quantify the importance of each variable, Youden J statistics were calculated to set the cut-off points for the evaluation metric values. Six evaluation indices (sensitivity, specificity, positive predictive value, negative predictive value, alarms per 100 evaluations, and number needed for evaluation) were used to examine the performance of the classification models. Among the 2985 available input features, the top 20 most important variables were compared. The authors found that individuals who “felt that they wanted to die” and “thought about committing suicide” showed the highest importance scores in the experimental results. In addition, the effects of socioeconomic disadvantages were observed in the analysis results.
Su et al. [47] used structured electronic health records (EHRs) from the Connecticut Children’s Medical Center (CCMC) for the 2011–2016 duration to predict suicidal risk in children and adolescents. From the CCMC EHR database, approximately 641,708 visits for 129,485 patients were extracted. To compare the model classification performances, several datasets with different conditions for the period were analyzed. The main dependent variables (i.e., suicide attempts) were identified using the International Classification of Diseases, Ninth Revision (ICD-9) code. In addition, demographics, prescribed medications, and clinical variables were included in the extracted datasets. The prediction model was evaluated using four evaluation indices (receiver operator characteristic curve, sensitivity, specificity, and positive predictive value). The variables were grouped and the performances of the prediction models were evaluated to confirm the usefulness of the predictive models proposed. The frequency of specific predictors was measured to confirm the influence of the variables on prediction. Symptoms and signs involving emotional state, depressive episode, and gender showed the highest rank among the input variables. In addition, antidepressant medications, including sertraline and escitalopram, and urine culture test variables were found to be highly important variables.
Design processes from previous studies were incorporated in our study, as described above. First, partial datasets with related variables were extracted from the KNHANES dataset from 1998 to 2019. For the common variables, only 13 datasets collected from 2007 to 2019 were selected. Second, the distributions of variables in the extracted datasets were examined to remove extreme or missing data. After removing more than half of the variables with missing data, 48 variables remained, including demographics, socioeconomic status, and mental health categories. Third, to select an optimized machine learning algorithm, the performances of the three classification models in our study were compared. Finally, the feature importance of the classifiers in identifying risk factors was determined for the best performance.
To compare the risk factors between suicide ideation and attempts, the importance of each variable in the datasets was evaluated with respect to suicide ideation and attempts. In addition, the conditions of the integrated dataset and year dataset were compared. The experimental results were analyzed, with suicidal ideation being a relatively low-risk group and suicidal attempt being a high-risk group. First, the results were compared from the perspective of the integrated dataset, regardless of the time-series, such as the year datasets. Socioeconomic and sociodemographic variables (e.g., average monthly income, age, education status, and drinking age) were confirmed to have a high rank and were common factors in both suicide ideation and attempt. In Ferretti and Coluccia [48], the trends in socioeconomic factors associated with determinants of suicide in the general population of Europe were similar, unlike that in the group of patients with mental illnesses. Mortensen et al. [49] suggested that a high risk of suicide was associated with unemployment and other socioeconomic factors in the Danish population. Among relatively low ranking factors, the rank of mental health-related variables (e.g., prevalence of depression, anxiety, depression related quality of life, and depression for more than 2 weeks) in high suicidal risk conditions (i.e., suicidal attempt) was higher than that in low-risk conditions (i.e., suicidal ideation). Based on these results, in the integrated dataset conditions, sociodemographic and socioeconomic factors are important for both suicidal ideation and attempts. In addition, mental health variables including depression or anxiety are risk factors for suicide attempts.
Second, the risk factors were investigated using yearly datasets with suicidal rate data to compare the factors for high and low suicide rates. From 2007 to 2019, the suicide rates in 2009, 2010, and 2011 were higher than in other years. Similar to the integrated dataset conditions, sociodemographic and socioeconomic factors were found to rank high for both ideation and attempt over 13 years. In datasets with a relatively high suicide rate, trends of depression prevalence and depression for more than two weeks ranking high were clearly identified. From these trends in the results, we confirmed that the yearly dataset with a high suicide rate showed similar trends to the results of the integrated datasets.
In conclusion, in terms of major risk factors for suicide, the analysis results based on a longitudinal dataset collected from the general population and analyzed using a machine learning classification model indicated that socioeconomic and sociodemographic factors were associated with both suicidal ideation and suicide attempts. Similar trends were validated on yearly datasets with yearly suicide rates, resulting in a high rank for social variables and a relatively higher rank for mental health variables associated with high suicide ranks.

5. Conclusions

In social and public health, an investigation of suicide risk factors is critical to solving or decreasing the impact of suicide on the public. In this study, we applied machine learning algorithms to identify risk factors for suicidal ideation and attempts using longitudinal datasets collected from the general population living in Korea. To compare the differences between suicidal ideation and suicidal attempt factors, the KNHANES dataset was preprocessed for two dependent variables (‘BP6_10′: suicide ideation and ‘BP6_31′: suicide attempt). In addition, datasets collected over 13 years (from 2007 to 2019) were analyzed to determine the associated risk factors for both the integrated dataset and datasets by year in terms of the importance of factors under different dataset conditions. Furthermore, to confirm the optimized machine learning algorithms for our research topic, we compared the performances of three machine learning classifiers (XGBoost classifier, support vector classifier, and logistic regression). Among the three classifiers, XGBoost showed the best performance on five evaluation metric values. Based on these results, we evaluated the feature importance of XGBoost in identifying important risk factors of suicidal ideation and attempt. As a common factor for ideation and attempts, sociodemographic and socioeconomic factors ranked high for various variables. In addition, we found that mental health variables showed a relatively high rank in the suicidal attempt condition, which was considered a high risk for suicide. From these experimental results, it was concluded that sociodemographic and socioeconomic factors are critical for suicide in the general population. In the high-risk group with suicidal attempts, mental health factors could also influence their suicide risk.
The first strength of this study was the application of machine learning algorithms to investigate the associated risk factors for suicidal ideation and suicide attempts. Second, the risk of each factor was determined using a new quantitative score calculated from the rank and importance scores calculated using machine learning algorithms. Third, large-scale real-world datasets collected from people living in Korea were utilized to reflect practical tendencies. Finally, the influence of risk factors on suicide ideation and attempts were evaluated and compared through conditions for risk of suicide. Our study has some limitations. First, we extracted and utilized several variables without considering a wide range of factors. However, we tried to select variables that were associated with suicide in previous studies. Second, various methodologies, including deep learning algorithms for the analysis of factors, can be applied to address our research questions. In our study, ML algorithms were used to facilitate the confirmation of feature importance. Third, additional comparisons and external validation will be required in future studies required on datasets collected from other countries to generalize the results.

Supplementary Materials

The following are available online at https://www.mdpi.com/article/10.3390/ijerph182312772/s1, Table S1: Important features and risk-factor score in yearly dataset condition (2007 and 2008), Table S2: Important features and risk-factor score in yearly dataset condition (2012 and 2013), Table S3: Important features and risk-factor score in yearly dataset condition (2014 and 2015), Table S4: Important features and risk-factor score in yearly dataset condition (2016 and 2017), Table S5: Important features and risk-factor scores in yearly dataset conditions (2018 and 2019).

Author Contributions

Conceptualization, S.C. and J.C.; methodology, S.C. and J.C.; software, J.C.; validation, S.C., J.C., I.K. and S.H.; formal analysis, S.C. and J.C.; investigation, S.C., J.C. and I.K.; writing—original draft preparation, S.C. and J.C.; writing—review and editing, S.C., J.C. and I.K.; project administration, S.H. All authors have read and agreed to the published version of the manuscript.

Funding

This research was supported in part by the Yonsei Signature Research Cluster Program of 2021 (2021-22-0005) and in part by the Brain Research Program through the National Research Foundation of Korea (NRF) funded by the Ministry of Science, ICT and Future Planning (2017M3C7A1029485).

Institutional Review Board Statement

Not applicable.

Informed Consent Statement

Not applicable.

Data Availability Statement

In this study, we used the open-source KNHANES dataset released by the Korea Disease Control and Prevention Agency (KDCA).

Conflicts of Interest

The authors declare no conflict of interest.

References

  1. World Health Organization. Suicide Worldwide in 2019. Available online: https://www.who.int/publications/i/item/9789240026643 (accessed on 30 September 2021).
  2. World Health Organization. Suicide in the World. Available online: https://www.who.int/publications/i/item/suicide-in-the-world (accessed on 30 September 2021).
  3. World Health Organization. Suicide in the World: Global Health Estimates. 2019. Available online: https://apps.who.int/iris/handle/10665/326948 (accessed on 30 September 2021).
  4. Birt, C.; Bille-Brahe, U.; Cabecadas, M.; Chishti, P.; Corcoran, P.; Elgie, R.; Williamson, E. Suicide mortality in the European Union. Eur. J. Public Health 2003, 13, 108–114. [Google Scholar] [CrossRef]
  5. Hedegaard, H.; Curtin, S.C.; Warner, M. Increase in Suicide Mortality in the United States, 1998–2018. Available online: https://stacks.cdc.gov/view/cdc/86670 (accessed on 29 September 2021).
  6. Mustard, C.A.; Bielecky, A.; Etches, J.; Wilkins, R.; Tjepkema, M.; Amick, B.C.; Aronson, K.J. Suicide mortality by occupation in Canada, 1991–2001. Can. J. Psychiatry 2010, 55, 369–376. [Google Scholar] [CrossRef] [Green Version]
  7. Jeon, S.Y.; Reither, E.N.; Masters, R.K. A population-based analysis of increasing rates of suicide mortality in Japan and South Korea, 1985–2010. BMC Public Health 2016, 16, 356. [Google Scholar] [CrossRef] [Green Version]
  8. Thibodeau, L.; Lachaud, J. Impact of economic fluctuations on suicide mortality in Canada (1926–2008): Testing the Durkheim, Ginsberg, and Henry and Short theories. Death Stud. 2016, 40, 305–315. [Google Scholar] [CrossRef]
  9. Sverre, J.M. Trends in suicide mortality among the elderly in Norway, 1966–1986. Epidemiology 1991, 2, 252–256. [Google Scholar] [CrossRef] [PubMed]
  10. Yip, P.S.; Liu, K.Y.; Law, C.K.; Law, Y.W. Social and economic burden of suicides in Hong Kong SAR: A year of life lost perspective. Crisis 2005, 26, 156–159. [Google Scholar] [CrossRef] [PubMed]
  11. Sharmin Salam, S.; Alonge, O.; Islam, M.I.; Hoque, D.M.E.; Wadhwaniya, S.; Ul Baset, M.K.; El Arifeen, S. The burden of suicide in rural Bangladesh: Magnitude and risk factors. Int. J. Environ. Res. Public Health 2017, 14, 1032. [Google Scholar] [CrossRef] [Green Version]
  12. Gunnell, D.; Appleby, L.; Arensman, E.; Hawton, K.; John, A.; Kapur, N.; Yip, P.S. Suicide risk and prevention during the COVID-19 pandemic. Lancet Psychiatry 2020, 7, 468–471. [Google Scholar] [CrossRef]
  13. McIntyre, R.S.; Lee, Y. Preventing suicide in the context of the COVID-19 pandemic. World Psychiatry 2020, 19, 250–251. [Google Scholar] [CrossRef]
  14. John, A.; Pirkis, J.; Gunnell, D.; Appleby, L.; Morrissey, J. Trends in suicide during the covid-19 pandemic. BMJ 2020, 371, m4352. [Google Scholar] [CrossRef] [PubMed]
  15. Haney, E.M.; O’Neil, M.E.; Carson, S.; Low, A.; Peterson, K.; Denneson, L.M.; Kansagara, D. Suicide Risk Factors and Risk Assessment Tools: A Systematic Review; Department of Veterans Affairs (US): Washington, DC, USA, 2012.
  16. Mościcki, E.K. Identification of suicide risk factors using epidemiologic studies. Psychiatr. Clin. N. Am. 1997, 20, 499–517. [Google Scholar] [CrossRef]
  17. Gould, M.S.; Fisher, P.; Parides, M.; Flory, M.; Shaffer, D. Psychosocial risk factors of child and adolescent completed suicide. Arch. Gen. Psychiatry 1996, 53, 1155–1162. [Google Scholar] [CrossRef] [PubMed]
  18. Brown, G.K.; Beck, A.T.; Steer, R.A.; Grisham, J.R. Risk factors for suicide in psychiatric outpatients: A 20-year prospective study. J. Consult. Clin. Psychol. 2000, 68, 371–377. [Google Scholar] [CrossRef]
  19. Agerbo, E.; Nordentoft, M.; Mortensen, P.B. Familial, psychiatric, and socioeconomic risk factors for suicide in young people: Nested case-control study. BMJ 2002, 325, 74. [Google Scholar] [CrossRef] [PubMed] [Green Version]
  20. Nock, M.K.; Banaji, M.R. Prediction of suicide ideation and attempts among adolescents using a brief performance-based test. J. Consult. Clin. Psychol. 2007, 75, 707–715. [Google Scholar] [CrossRef] [PubMed] [Green Version]
  21. Michel, K. Suicide risk factors: A comparison of suicide attempters with suicide completers. Br. J. Psychiatry 1987, 150, 78–82. [Google Scholar] [CrossRef]
  22. Nock, M.K.; Borges, G.; Bromet, E.J.; Alonso, J.; Angermeyer, M.; Beautrais, A.; Williams, D. Cross-national prevalence and risk factors for suicidal ideation, plans and attempts. Br. J. Psychiatry 2008, 192, 98–105. [Google Scholar] [CrossRef]
  23. Simon, M.; Chang, E.S.; Zeng, P.; Dong, X. Prevalence of suicidal ideation, attempts, and completed suicide rate in Chinese aging populations: A systematic review. Arch. Gerontol. Geriatr. 2013, 57, 250–256. [Google Scholar] [CrossRef] [Green Version]
  24. Ribeiro, J.D.; Huang, X.; Fox, K.R.; Franklin, J.C. Depression and hopelessness as risk factors for suicide ideation, attempts and death: Meta-analysis of longitudinal studies. Br. J. Psychiatry 2018, 212, 279–286. [Google Scholar] [CrossRef]
  25. Baca-Garcia, E.; Perez-Rodriguez, M.M.; Oquendo, M.A.; Keyes, K.M.; Hasin, D.S.; Grant, B.F.; Blanco, C. Estimating risk for suicide attempt: Are we asking the right questions?: Passive suicidal ideation as a marker for suicidal behavior. J. Affect. Disord. 2011, 134, 327–332. [Google Scholar] [CrossRef] [PubMed] [Green Version]
  26. Gutierrez, P.M.; Rodriguez, P.J.; Garcia, P. Suicide risk factors for young adults: Testing a model across ethnicities. Death Stud. 2001, 25, 319–340. [Google Scholar] [CrossRef]
  27. Berman, A.L. Risk factors proximate to suicide and suicide risk assessment in the context of denied suicide ideation. Suicide Life-Threat. Behav. 2018, 48, 340–352. [Google Scholar] [CrossRef] [PubMed]
  28. Park, S.; Jang, H. Correlations between suicide rates and the prevalence of suicide risk factors among Korean adolescents. Psychiatry Res. 2018, 261, 143–147. [Google Scholar] [CrossRef]
  29. Mani, S.; Chen, Y.; Elasy, T.; Clayton, W.; Denny, J. Type 2 diabetes risk forecasting from EMR data using machine learning. In AMIA Annual Symposium Proceedings; American Medical Informatics Association: Bethesda, MD, USA, 2012. [Google Scholar]
  30. Khare, S.; Kavyashree, S.; Gupta, D.; Jyotishi, A. Investigation of nutritional status of children based on machine learning techniques using Indian demographic and health survey data. Procedia Comput. Sci. 2017, 115, 338–349. [Google Scholar] [CrossRef]
  31. De la Garza, Á.G.; Blanco, C.; Olfson, M.; Wall, M.M. Identification of suicide attempt risk factors in a national US survey using machine learning. JAMA Psychiatry 2021, 78, 398–406. [Google Scholar] [CrossRef]
  32. Fodeh, S.; Li, T.; Menczynski, K.; Burgette, T.; Harris, A.; Ilita, G.; Raicu, D. Using machine learning algorithms to detect suicide risk factors on twitter. In Proceedings of the IEEE 2019 International Conference on Data Mining Workshops (ICDMW), Beijing, China, 8–11 November 2019. [Google Scholar]
  33. The Korea National Health and Nutrition Examination Survey (KNHANES). Korea Centers for Disease Control and Prevention. Available online: https://knhanes.cdc.go.kr/knhanes/eng/index.do (accessed on 25 September 2021).
  34. Chen, T.; Guestrin, C. Xgboost: A scalable tree boosting system. In Proceedings of the 22nd ACM SIGKDD International Conference on Knowledge Discovery and Data Mining, San Francisco, CA, USA, 13–17 August 2016. [Google Scholar]
  35. Tong, S.; Koller, D. Support vector machine active learning with applications to text classification. J. Mach. Learn. Res. 2001, 2, 45–66. [Google Scholar]
  36. Bhavsar, H.; Panchal, M.H. A review on support vector machine for data classification. Int. J. Adv. Res. Comput. Eng. Technol. IJARCET 2012, 1, 185–189. [Google Scholar]
  37. Feng, J.; Xu, H.; Mannor, S.; Yan, S. Robust logistic regression and classification. Adv. Neural Inf. Process. Syst. 2014, 27, 253–261. [Google Scholar]
  38. Hintikka, J.; Koivumaa-Honkanen, H.; Lehto, S.M.; Tolmunen, T.; Honkalampi, K.; Haatainen, K.; Viinamäki, H. Are factors associated with suicidal ideation true risk factors? Soc. Psychiatry Psychiatr. Epidemiol. 2009, 44, 29–33. [Google Scholar] [CrossRef] [PubMed]
  39. Weber, B.; Metha, A.; Nelsen, E. Relationships among multiple suicide ideation risk factors in college students. J. Coll. Stud. Psychother. 1997, 11, 49–64. [Google Scholar] [CrossRef]
  40. Kleiman, E.M.; Turner, B.J.; Fedor, S.; Beale, E.E.; Huffman, J.C.; Nock, M.K. Examination of real-time fluctuations in suicidal ideation and its risk factors: Results from two ecological momentary assessment studies. J. Abnorm. Psychol. 2017, 126, 726–738. [Google Scholar] [CrossRef]
  41. Beautrais, A.L.; Joyce, P.R.; Mulder, R.T. Risk factors for serious suicide attempts among youths aged 13 through 24 years. J. Am. Acad. Child Adolesc. Psychiatry 1996, 35, 1174–1182. [Google Scholar] [CrossRef] [PubMed]
  42. Teti, G.L.; Rebok, F.; Rojas, S.M.; Grendas, L.; Daray, F.M. Systematic review of risk factors for suicide and suicide attempt among psychiatric patients in Latin America and Caribbean. Rev. Panam. Salud Pública 2014, 36, 124–133. [Google Scholar]
  43. Parra-Uribe, I.; Blasco-Fontecilla, H.; Garcia-Parés, G.; Martínez-Naval, L.; Valero-Coppin, O.; Cebrià-Meca, A.; Palao-Vidal, D. Risk of re-attempts and suicide death after a suicide attempt: A survival analysis. BMC Psychiatry 2017, 17, 163. [Google Scholar] [CrossRef] [PubMed] [Green Version]
  44. Taneja, I.; Damhorst, G.L.; Lopez-Espina, C.; Zhao, S.D.; Zhu, R.; Khan, S.; Bashir, R. Diagnostic and prognostic capabilities of a biomarker and EMR-based machine learning algorithm for sepsis. Clin. Transl. Sci. 2021, 14, 1578–1589. [Google Scholar] [CrossRef] [PubMed]
  45. Walsh, C.G.; Ribeiro, J.D.; Franklin, J.C. Predicting suicide attempts in adolescents with longitudinal clinical data and machine learning. J. Child Psychol. Psychiatry 2018, 59, 1261–1270. [Google Scholar] [CrossRef]
  46. Walsh, C.G.; Ribeiro, J.D.; Franklin, J.C. Predicting risk of suicide attempts over time through machine learning. Clin. Psychol. Sci. 2017, 5, 457–469. [Google Scholar] [CrossRef]
  47. Su, C.; Aseltine, R.; Doshi, R.; Chen, K.; Rogers, S.C.; Wang, F. Machine learning for suicide risk prediction in children and adolescents with electronic health records. Transl. Psychiatry 2020, 10, 413. [Google Scholar] [CrossRef] [PubMed]
  48. Ferretti, F.; Coluccia, A. Socio-economic factors and suicide rates in European Union countries. Leg. Med. 2009, 11, S92–S94. [Google Scholar] [CrossRef]
  49. Mortensen, P.B.; Agerbo, E.; Erikson, T.; Qin, P.; Westergaard-Nielsen, N. Psychiatric illness and risk factors for suicide in Denmark. Lancet 2000, 355, 9–12. [Google Scholar] [CrossRef]
Figure 1. Overview of the research scheme adopted in this study.
Ijerph 18 12772 g001
Figure 2. Distributions of variables used in our study: (a) distribution of “age”, (b) distribution of “sex”, (c) distribution of “ainc”, (d) distribution of “incm”, and (e) distribution of “ho_incm”.
Ijerph 18 12772 g002
Table 1. Categories of variables in the KNHANES dataset.
NoCategoriesType of Variables
1Health behaviorCategorical
2Blood pressure measurementContinuous
3Blood testContinuous
4Grip strength testContinuous
5Dietary life surveyCategorical
6Food safety investigationCategorical
7Food intake frequency surveyCategorical
8Food intake surveyContinuous
9Dietary life evaluation indexContinuous
Table 2. Baseline characteristics of the KNHANES dataset.
CharacteristicKNHANES
Age (years), mean (SD)48.5 (18.0)
No. of participants (n)78,796
Gender, n (%)Male34,230 (43.5%)
Female44,566 (56.5%)
Height (cm), mean (SD)156.1 (19.7)
Weight (kg), mean (SD)57.1 (18.0)
BMI, mean (SD)22.6 (4.2)
Table 3. Dimensions and number of participants for datasets from 2007 to 2019.
YearDimension
(# of Columns, # of Rows)
No. of Participants
2007(2839, 49)2839
2008(6585, 49)6585
2009(7399, 49)7399
2010(6175, 49)6175
2011(5977, 49)5977
2012(6125, 49)6125
2013(5941, 49)5941
2014(5655, 49)5655
2015(5899, 49)5899
2016(6542, 49)6542
2017(6608, 49)6608
2018(6403, 49)6403
2019(6648, 49)6648
Table 4. Hyperparameters applied in the machine learning classifiers.
AlgorithmHyperparameterValue
(Argument)
XGBoost classifierEta0.3
Gamma0
max_depth6
min_child_weight1
Support vector classifierKernelrbf
Gammaauto
Logistic regressionPenaltyL2
Solvernewton-cg
Table 5. Classification performance results for classifiers with yearly datasets (2007–2013).
YearDependent
Variable
ClassifierPrecisionRecallF1-ScoreAccuracyAUC 1
2007BP6_10 2XGBoost0.8500.8660.8590.8860.920
SVC 40.8460.6050.6000.8560.843
LR 50.7070.7110.7270.8160.859
BP6_31 3XGBoost0.8830.9350.9110.9350.958
SVC0.8680.5300.5230.6580.656
LR0.5270.6000.5950.7580.798
2008BP6_10XGBoost0.8690.8410.8510.8870.893
SVC0.7210.5860.5230.8150.805
LR0.7040.7580.7060.7840.829
BP6_31XGBoost0.8930.9410.9110.9380.955
SVC0.4710.5060.4850.4590.649
LR0.5300.6000.4960.7100.692
2009BP6_10XGBoost0.8940.8570.8790.8830.898
SVC0.7430.6480.6440.8240.807
LR0.6880.7370.7080.7830.828
BP6_31XGBoost0.9080.9330.9130.9320.958
SVC0.5490.5370.4840.4190.731
LR0.5510.6820.5670.7510.761
2010BP6_10XGBoost0.9160.9240.9110.9370.920
SVC0.7260.5540.4970.8400.809
LR0.6760.7570.6980.8060.833
BP6_31XGBoost0.9060.9370.9130.9370.963
SVC0.6670.5400.5270.8140.725
LR0.5500.6730.5650.7630.752
2011BP6_10XGBoost0.9480.9650.9480.9590.925
SVC0.7890.5330.5230.8170.830
LR0.6850.7820.7090.8180.848
BP6_31XGBoost0.9130.9450.9250.9420.956
SVC0.4690.5030.4870.7280.637
LR0.5090.5890.5770.6920.601
2012BP6_10XGBoost0.9430.9540.9370.9430.924
SVC0.7930.8600.7990.8610.786
LR0.8570.7910.8010.7900.819
BP6_31XGBoost0.9190.9510.9320.9510.965
SVC0.4760.5000.4880.8650.710
LR0.5350.6440.5150.7650.731
2013BP6_10XGBoost0.9300.9480.9360.9480.978
SVC0.5380.5070.4990.5250.833
LR0.5860.7780.6020.8330.842
BP6_31XGBoost0.9850.9920.9880.9920.988
SVC0.4960.5000.4980.6040.852
LR0.5190.8000.5020.8640.826
1 AUC: area under curve; 2 BP6_10: suicidal ideation in the previous year; 3 BP6_31: suicide attempts within the last year; 4 SVC: support vector classifier; 5 LR: logistic regression.
Table 6. Classification performance results for classifiers with yearly datasets (2014–2019).
YearDependent
Variable
ClassifierPrecisionRecallF1-ScoreAccuracyAUC 1
2014BP6_10 2XGBoost0.9140.9530.9320.9530.981
SVC 40.4750.5000.4870.5160.865
LR 50.5870.7490.5990.8390.828
BP6_31 3XGBoost0.9600.9800.9690.9800.977
SVC0.4900.5000.4950.7850.687
LR0.5600.6770.5850.6830.745
2015BP6_10XGBoost0.9270.9430.9320.9430.980
SVC0.6530.5550.5490.4640.851
LR0.6160.8170.6460.8580.870
BP6_31XGBoost0.9830.9910.9870.9910.989
SVC0.4960.5000.4980.5350.742
LR0.5180.7570.5010.8440.854
2016BP6_10XGBoost0.9170.9420.9290.9550.989
SVC0.4810.5000.4900.6370.797
LR0.5930.7430.6000.7460.888
BP6_31XGBoost0.9880.9940.9910.9940.990
SVC0.4970.5000.4980.8840.789
LR0.5090.6760.4790.8500.744
2017BP6_10XGBoost0.9390.9520.9410.9520.980
SVC0.5010.5010.4910.6520.866
LR0.6050.8110.6340.8610.881
BP6_31XGBoost0.9880.9940.9910.9940.990
SVC0.4970.5000.4980.3950.862
LR0.5130.7300.4940.8620.844
2018BP6_10XGBoost0.9180.9580.9380.9580.972
SVC0.4790.5000.4980.5830.837
LR0.5600.7250.5640.8380.829
BP6_31XGBoost0.9840.9920.9880.9920.990
SVC0.4970.5000.4980.8360.876
LR0.5120.7120.4850.8520.864
2019BP6_10XGBoost0.9370.9500.9390.9500.982
SVC0.4750.5000.4870.5040.866
LR0.5990.8050.6240.8510.879
BP6_31XGBoost0.9910.9950.9930.9950.990
SVC0.4980.5000.4990.5490.806
LR0.5090.7270.4900.8720.821
1 AUC: area under curve; 2 BP6_10: suicidal ideation in the previous year; 3 BP6_31: suicide attempts within the last year; 4 SVC: support vector classifier; 5 LR: logistic regression.
Table 7. Classification performance results for classifiers with integrated datasets.
Dependent
Variable
ClassifierPrecisionRecallF1-scoreAccuracyAUC 1
BP6_10 2XGBoost0.8740.8930.8780.8930.950
SVC 40.4420.5000.4700.8850.811
LR 50.6530.7790.6770.8080.853
BP6_31 3XGBoost0.9770.9860.9810.9860.990
SVC0.4930.5000.4970.6820.766
LR0.5240.7940.4930.8050.850
1 AUC: area under curve; 2 BP6_10: suicidal ideation in the previous year; 3 BP6_31: suicide attempts within the last year; 4 SVC: support vector classifier; 5 LR: logistic regression.
Table 8. Important features and risk-factor score in the integrated dataset.
RankDVVariableVariable
Description
Risk
Variable Score
DVVariableVariable
Description
Risk-Factor Score
1BP6_10 1aincAverage monthly income0.2023BP6_31 2aincAverage monthly income0.2030
2 ageAge of participant0.1653 ageAge of participant0.1472
3 BD2Drinking age0.1088 BD2Drinking age0.1107
4 BP8Average sleep time per day0.0729 BP8Average sleep time per day0.0969
5 educEducation level0.0518 educEducation level0.0392
6 BO1Subjective body type recognition0.4209 BO1Subjective body type recognition0.0389
7 D_1_1Subjective health status0.0377 D_1_1Subjective health status0.0330
8 BP1Awareness of usual stress0.0301 BO1_1Weight change in past 1 year0.0292
9 BO1_1Weight change in past 1 year0.0277 BP1Awareness of usual stress0.0274
10 incmPersonal income0.0244 houseHome ownership0.0231
11 houseHome ownership0.0244 DF2_ltPrevalence of depression0.0216
12 DF2_ltPrevalence of depression0.0220 LQ_5EQLEuroQoL: anxiety/depression0.0208
13 EC1_1Economic activity0.0202 incmPersonal income0.0208
14 LQ_4EQLEuroQoL: pain/discomfort0.0188 LQ_4EQLEuroQoL: pain/discomfort0.0190
15 ho_incmHousehold income0.0178 BP5Depression for 2 weeks
or more
0.0189
16 D_2_1Uncomfortable experience
in past 2 weeks
0.0167 EC1_1Economic activity0.0171
17 sexSex of participant0.0166 sexSex of participant0.0163
18 LQ_5EQLEuroQoL: anxiety/depression0.0149 D_2_1Uncomfortable experience
in past 2 weeks
0.0140
19 BP5Depression for 2 weeks
or more
0.0142 ho_incmHousehold income0.0140
20 LQ_1EQLEuroQoL: athletic ability0.0111 LQ_3EQLEuroQoL: daily activity0.0118
1 BP6_10: suicide ideation within the last year; 2 BP6_31: suicide attempts within the last year.
Table 9. Important features and risk-factor score in yearly dataset condition (2009).
RankDVVariableVariable
Description
Risk
Variable Score
DVVariableVariable
Description
Risk-Factor Score
1BP6_10 1aincAverage monthly income0.1700BP6_31 2ageAge of participant0.2000
2 ageAge of participant0.1651 aincAverage monthly income0.1545
3 LQ_VASEuroQoL: total score0.1168 LQ_VASEuroQoL: total score0.1241
4 BD2Drinking age0.1045 BD2Drinking age0.1049
5 BP8Average sleep time per day0.0516 BP8Average sleep time per day0.0337
6 educEducation level0.0447 educEducation level0.0299
7 BO1Subjective body type recognition0.0375 BO1_1Weight change in past 1 year0.0297
8 D_1_1Subjective health status0.0350 BO1Subjective body type recognition0.0297
9 BO1_1Weight change in past 1 year0.0310 DF2_ltPrevalence of depression0.0278
10 BP1Awareness of usual stress0.0288 incmPersonal income0.0248
11 incmPersonal income0.0266 ho_incmHousehold income0.0231
12 houseHome ownership0.0228 LQ_5EQLEuroQoL: anxiety/depression0.0210
13 EC1_1Economic activity0.0203 houseHome ownership0.0202
14 ho_incmHousehold income0.0184 BP5Depression for 2 weeks
or more
0.0168
15 sexSex of participant0.0147 EC1_1Economic activity0.0161
16 LQ_4EQLEuroQoL: pain/discomfort0.0136 D_1_1Subjective health status0.0159
17 BP5Depression for 2 weeks
or more
0.0135 LQ4_22Activity restriction: old age0.0145
18 D_2_1Uncomfortable experience
in past 2 weeks
0.0127 D_2_1Uncomfortable experience
in past 2 weeks
0.0134
19 DF2_ltPrevalence of depression0.0114 LQ_4EQLEuroQoL: pain/discomfort0.0125
20 LQ_1EQLEuroQoL: athletic ability0.0085 LQ_1EQLEuroQoL: athletic ability0.0097
1 BP6_10: suicide ideation within the last year; 2 BP6_31: suicide attempts within the last year.
Table 10. Important features and risk-factor score in yearly dataset condition (2010).
RankDVVariableVariable
Description
Risk
Variable Score
DVVariableVariable
Description
Risk-Factor Score
1BP6_10 1aincAverage monthly income0.2007BP6_31 2aincAverage monthly income0.2158
2 ageAge of participant0.1594 ageAge of participant0.1703
3 LQ_VASEuroQoL: total score0.1232 LQ_VASEuroQoL: total score0.1505
4 BD2Drinking age0.1014 BD2Drinking age0.1420
5 BP8Average sleep time per day0.0486 BP8Average sleep time per day0.0342
6 educEducation level0.0442 D_1_1Subjective health status0.0223
7 BO1Subjective body type recognition0.0372 BO1Subjective body type recognition0.0197
8 D_1_1Subjective health status0.0305 educEducation level0.0196
9 BP1Awareness of usual stress0.0258 LQ4_08Activity restriction: high blood pressure0.0186
10 BO1_1Weight change in past 1 year0.0248 BO1_1Weight change in past 1 year0.0185
11 houseHome ownership0.0222 BP1Awareness of usual stress0.0184
12 incmPersonal income0.0212 incmPersonal income0.0163
13 EC1_1Economic activity0.0206 LQ_5EQLEuroQoL: anxiety/depression0.0156
14 LQ4_08Activity restriction: high blood pressure0.0175 DF2_ltPrevalence of depression0.0145
15 D_2_1Uncomfortable experience in past 2 weeks0.0156 LQ4_10Activity restriction: cancer0.0136
16 LQ_4EQLEuroQoL: pain/discomfort0.0156 sexSex of participant0.0133
17 ho_incmHousehold income0.0143 houseHome ownership0.0119
18 sexSex of participant0.0140 BP5Depression for 2 weeks or more0.0119
19 BP5Depression for 2 weeks or more0.0140 EC1_1Economic activity0.0102
20 DF2_ltPrevalence of depression0.0114 LQ4_01Activity restriction: fracture/joint injury0.0098
1 BP6_10: suicide ideation within the last year; 2 BP6_31: suicide attempts within the last year.
Table 11. Important features and risk-factor score in the yearly dataset condition (2011).
RankDVVariableVariable
Description
Risk
Variable Score
DVVariableVariable
Description
Risk-Factor Score
1BP6_10 1aincAverage monthly income0.2107BP6_31 2aincAverage monthly income0.2338
2 ageAge of participant0.1574 ageAge of participant0.2127
3 LQ_VASEuroQoL: total score0.1208 LQ_VASEuroQoL: total score0.1690
4 BD2Drinking age0.1085 BD2Drinking age0.0694
5 BP8Average sleep time per day0.0482 ho_incmHousehold income0.0412
6 educEducation level0.0400 educEducation level0.0281
7 BO1Subjective body type recognition0.0336 BP8Average sleep time per day0.0261
8 D_1_1Subjective health status0.0270 BO1Subjective body type recognition0.0203
9 BP1Awareness of usual stress0.0264 BO1_1Weight change in past 1 year0.0185
10 BO1_1Weight change in past 1 year0.0245 DF2_ltPrevalence of depression0.0169
11 incmPersonal income0.0244 EC1_1Economic activity0.0163
12 EC1_1Economic activity0.0207 D_1_1Subjective health status0.0152
13 houseHome ownership0.0168 BP1Awareness of usual stress0.0152
14 sexSex of participant0.0168 LQ_5EQLEuroQoL: anxiety/depression0.0136
15 BP5Depression for 2 weeks
or more
0.0159 D_2_1Uncomfortable experience
in past 2 weeks
0.0117
16 ho_incmHousehold income0.0155 BP5Depression for 2 weeks
or more
0.0116
17 D_2_1Uncomfortable experience
in past 2 weeks
0.0143 incmPersonal income0.0094
18 LQ_4EQLEuroQoL: pain/discomfort0.0143 LQ1_sbLying in a sickbed in past 1 month0.0083
19 DF2_ltPrevalence of depression0.0111 LQ_4EQLEuroQoL: pain/discomfort0.0082
20 LQ_5EQLEuroQoL: anxiety/depression0.0094 LQ4_05Activity restriction:
breathing problem/lung disease
0.0077
1 BP6_10: suicide ideation within the last year; 2 BP6_31: suicide attempts within the last year.
Publisher’s Note: MDPI stays neutral with regard to jurisdictional claims in published maps and institutional affiliations.

