
The Influence of Emotional Health on the Activity Characteristics of the Elderly and the Selection of Environmental Quality Factors in Residential Areas


Abstract
:1. Introduction
2. Materials and Methods
2.1. Study Design and Participants
2.2. Measures
2.2.1. Elderly Self-Assessment of Emotions and Health
2.2.2. Personal and Social Information of the Elderly
2.2.3. Evaluation of Residential Environment Elements and Collection of Physical Activity Rules
2.3. Data Analysis
3. Results
3.1. Sample Characteristics
3.2. The Activity Characteristic of the Elderly in Different Emotional States and the Choice Tendency of Environmental Quality Factors
3.3. Impact Analysis
4. Discussion
4.1. Different Activity Characteristics from Positive and Negative Emotions in Different Residential Environments, and Difference Analysis of the Selection of Environmental Quality Factors
4.2. Analysis of the Impact of the Emotional Status of the Elderly on the Choice of Environmental Quality among Different Types of Residential Environments
4.3. Research Value and Deficiency
5. Conclusions
Author Contributions
Funding
Institutional Review Board Statement
Informed Consent Statement
Data Availability Statement
Acknowledgments
Conflicts of Interest
References
- Kowitt, S.D.; Aiello, A.E.; Callahan, L.F. Associations among neighborhood poverty, perceived neighborhood environment, and depressed mood are mediated by physical activity, perceived individual control, and loneliness. Health Place 2020, 62, 102278. [Google Scholar] [CrossRef] [PubMed]
- Notice of the Municipal Government on Printing and Distributing the 12th Five Year Plan for the Development of Civil Affairs in Shanghai. Available online: https://www.shanghai.gov.cn/nw29273/20200820/0001-29273_31711.html (accessed on 2 May 2012).
- 2021 Community Home-Based Elderly Care Status and Future Trend Report. Available online: https://research.ke.com/121/ArticleDetail?id=450 (accessed on 2 May 2012).
- Tu, H.J.; Lu, X.J. Rethinking of "9073" Pension Service Structure—Based on Survey on Decision-making of Architectural Planning Group of Old Residential Quarters in Shanghai. Hous. Sci. 2020, 3, 27–33. [Google Scholar]
- Zhang, J.M.; Liu, Z.Y.; Zhu, Y.S. The mediating effect of affect balance in the relationship between health condition and life satisfaction in long-lived elders: The application of structural equation modeling. Fudan Univ. J. Med Sci. 2016, 43, 16–21. [Google Scholar]
- Leslie, E.; Cerin, E. Are perceptions of the local environment related to neighbourhood satisfaction and mental health in adults? Prev. Med. 2008, 47, 273–278. [Google Scholar] [CrossRef]
- Guitea, H.F.; Clark, C.; Ackrill, G. The Impact of the Physical and Urban Environment on Mental Well-Being. Public Health 2006, 120, 1117–1126. [Google Scholar] [CrossRef] [PubMed]
- Carlson, J.A.; Sallis, J.F.; Conway, T.L. Interactions between psychosocial and built environment factors in explaining older adults’ physical activity. Prev. Med. 2012, 54, 68–73. [Google Scholar] [CrossRef] [PubMed] [Green Version]
- Pacione, M. Urban environmental quality and human wellbeing—A social geographic perspective. Landsc. Urban Plan. 2003, 65, 19–30. [Google Scholar] [CrossRef]
- Koohsari, M.J.; Badland, H.; Mavoa, S.; Villanueva, K.; Francis, J.; Hooper, P.; Owen, N.; Giles-Corti, B. Are Public Open Space Attributes Associated with Walking and Depression. Cities 2018, 74, 119–125. [Google Scholar] [CrossRef]
- Sturm, R.; Cohen, D.A. Suburban Sprawl and Physical and Mental health. Public Health 2004, 118, 488–496. [Google Scholar] [CrossRef]
- Nutsford, D.; Pearson, A.L.; Kingham, S. An ecological study investigating the association between access to urban green space and mental health. Public Health 2013, 127, 1005–1011. [Google Scholar] [CrossRef]
- Gandelman, N.; Piani, G.; Ferre, Z. Neighborhood Determinants of Quality of Life. Happiness Stud. 2012, 13, 547–563. [Google Scholar] [CrossRef]
- Chen, C.X.; Luo, W.J.; Kang, N. Study on the Impact of Residential Outdoor Environments on Mood in the Elderly in Guangzhou, China. Sustainability 2020, 10, 33–90. [Google Scholar] [CrossRef]
- Zhou, S.H.; He, J.M. Effects of spatial-temporal constraints of suburban residents on fitness activities to mental health in the context of rapid suburbanization: A case study in Guangzhou, China. Prog. Geogr. 2017, 36, 1229–1238. [Google Scholar]
- Chen, Z. Assessing the Impact of High-density High-heterogeneity Urban District Landscape on Psychological Health and Optimizing via Evidence-based Design. Landsc. Archit. 2018, 25, 106–111. [Google Scholar]
- Dong, Y.; Li, Z.; Dong, W. Relationship Between Green Space Perception of Communities and Residents’ Stress Level: A Case Study of 12 Communities in Harbin. Landsc. Archit. 2021, 28, 23–29. [Google Scholar]
- Grahn, P.; Stigsdotter, U.A.; Grahn, P. Landscape planning and stress. Urban For. Urban Green. 2003, 2, 1–18. [Google Scholar] [CrossRef] [Green Version]
- Lachowycz, K.; Jones, A.P. Towards a better understanding of the relationship between greenspace and health: Development of a theoretical framework. Landsc. Urban Plan. 2013, 118, 62–69. [Google Scholar] [CrossRef]
- Wu, Y.T.; Prina, A.M.; Jones, A.; Barnes, L.E.; Matthews, F.E.; Brayne, C.; CFAS, M. Micro-Scale Environment and Mental Health in Later Life: Results from the Cognitive Function and Aging Study II. J. Affect. Disord. 2017, 218, 359–364. [Google Scholar] [CrossRef] [Green Version]
- Weich, S.; Blanchard, M.; Prince, M.; Burton, E.; Erens, B.; Sproston, K. Mental health and the built environment: Cross-sectional survey of individual and contextual risk factors for depression. Br. J. Psychiatry J. Ment. Sci. 2002, 180, 428. [Google Scholar] [CrossRef]
- Araya, R.; Montgomery, A.; Rojas, G.; Fritsch, R.; Solis, J.; Signorelli, A.; Lewis, G. Common mental disorders and the built environment in santiago, chile. Br. J. Psychiatry 2007, 190, 394–401. [Google Scholar] [CrossRef]
- Suo, J.; Zhong, W. Study on the influence of residential environment on the activities of the elderly in existing residential areas—Taking Dalian as an example. S. Archit. Stage of publication (accepted).
- Pinquar, M.; Sorensen, S. Gender Differences in Self-Concept and Psychological Well-Being in Old Age: A Meta-Analysis. J. Gerontol. 2001, 56, 195. [Google Scholar] [CrossRef] [PubMed]
- Aldwin, C.M. Does age affect the stress and coping process? Implications of age differences in perceived control. J. Gerontol. 1991, 4, 174–180. [Google Scholar] [CrossRef] [PubMed]
- Buckner, J.C. The development of an instrument to measure neighborhood cohesion. Am. J. Community Psychol. 1988, 16, 771–791. [Google Scholar] [CrossRef]
- Dolan, P.; Peasgood, T.; White, M. Do we really know what makes us happy? A review of the economic literature on the factors associated with subjective well-being. J. Econ. Psychol. 2008, 29, 94–122. [Google Scholar] [CrossRef]
- Ewing, R.; Handy, S. Measuring the Unmeasurable: Urban Design Qualities Related to Walkability. J. Urban Des. 2009, 14, 65–84. [Google Scholar] [CrossRef]
- Evans, G.W. The built environment and mental health. J. Urban Health-Bull. N. Y. Acad. Med. 2003, 80, 536–555. [Google Scholar] [CrossRef]
- Blanchflower, D.G.; Oswald, A.J. Well-Being Over Time in Britain and the USA. Soc. Sci. Electron. Publ. 2004, 88, 1359–1386. [Google Scholar] [CrossRef] [Green Version]
- Abraham, A.; Sommerhalder, K.; Abel, T. Landscape and well-being: A scoping study on the health-promoting impact of outdoor environments. Int. J. Public Health 2010, 55, 59–69. [Google Scholar] [CrossRef] [Green Version]
- Dempsey, N. Does quality of the built environment affect social cohesion? Proceedings of the ICE. Urban Des. Plan. 2008, 161, 105–114. [Google Scholar]
- Xu, L.Q.; Meng, R.X.; Chen, Z. Fascinating Streets: The Impact of Building Facades and Green View. Landsc. Archit. 2017, 10, 27–33. [Google Scholar]
- Wandersman, A.; Nation, M. Urban neighborhoods and mental health: Psychological contributions to understanding toxicity, resilience, and interventions. Am. Psychol. 1998, 53, 647–656. [Google Scholar] [CrossRef]
- Farrell, S.J.; Aubry, T.; Coulombe, D. Neighborhoods and neighbors: Do they contribute to personal well-being? J. Community Psychol. 2004, 32, 9–25. [Google Scholar] [CrossRef]
- Sullivan, W.C.; Kuo, F.E.; Depooter, S.F. The fruit of urban nature vital neighborhood spaces. Environ. Behav. 2004, 36, 678–700. [Google Scholar] [CrossRef]
- Beyer, K.M.; Kaltenbach, A.; Szabo, A.; Bogar, S.; Nieto, F.J.; Malecki, K.M. Exposure to neighborhood green space and mental health: Evidence from the survey of the health of Wisconsin. Int. J. Environ. Res. Public Health 2014, 11, 34–53. [Google Scholar] [CrossRef] [Green Version]
- Pope, D.; Tisdall, R.; Middleton, J.; Verma, A.; van Ameijden, E.; Birt, C.; Macherianakis, A.; Bruce, N.G. Quality of and access to green space in relation to psychological distress: Results from a population-based cross-sectional study as part of the EURO-URHIS 2 project. Eur. J. Public Health 2015, 28, 39–42. [Google Scholar] [CrossRef] [Green Version]
- Gehl, J.A. changing street life in a changing society. Places A Q. J. Environ. Des. 1989, 6, 8–17. [Google Scholar]
- Smith, R.J.; Lehning, A.J.; Dunkle, R.E. Conceptualizing age-friendly community characteristics in a sample of urban elders: An exploratory factor analysis. J. Gerontol. Soc. Work 2013, 56, 90–111. [Google Scholar] [CrossRef] [Green Version]
- Vallée, J.; Cadot, E.; Roustit, C.; Parizot, I.; Chauvin, P. The Role of Daily Mobility in Mental Health Inequalities: The Interactive Influence of Activity Space and Neighbou rhood of Residence on Depression. Soc. Sci. Med. 2011, 73, 1133–1144. [Google Scholar] [CrossRef] [Green Version]
- Wong, M.; Yu, R.; Woo, J. Effects of perceived neighbourhood environments on self-rated health among community-dwelling older Chinese. Int. J. Environ. Res. Public Health 2017, 14, 614. [Google Scholar] [CrossRef]
- Fu, Q. Communal Space and Depression: A Structural-Equation Analysis of Relational and Psycho-Spatial Pathways. Health Place 2018, 53, 1–9. [Google Scholar] [CrossRef]
- Sugiyama, T.; Leslie, E.; Giles-Corti, B.; Owen, N. Associations of neighbourhood greenness with physical and mental health: Do walking, social coherence and local social interaction explain the relationships? J. Epidemiol. Community Health 2008, 62, 9–11. [Google Scholar] [CrossRef] [Green Version]
- Schinasi, L.H.; Benmarhnia, T.; Roos, A. Modification of the association between high ambient temperature and health by urban microclimate indicators: A systematic review and meta-analysis. Environ. Res. 2018, 161, 168–180. [Google Scholar] [CrossRef]
- Fan, Y.; Li, Z.B.; Dong, L. Connotation and renewal mode of architectural quality of existing residential areas in China. New Build. 2018, 2, 46–49. [Google Scholar]
- China Academy of Building Sciences Co., Ltd. Assessment Standard for Healthy Retrofitting of Existing Residential Area; China Construction Industry: Beijing, China, 2020; pp. 4–60. [Google Scholar]
- Aging in Times of the COVID-19 Pandemic: Avoiding Ageism and Fostering Intergenerational Solidarity. Available online: https://doi.org/10.1093/geronb/gbaa051 (accessed on 16 April 2020).
- Sabrina, C.; Francesca, G. Older People’s Lived Perspectives of Social Isolation during the First Wave of the COVID-19 Pandemic in Italy. Int. J. Environ. Res. Public Health 2021, 18, 11832. [Google Scholar]
- Tridib, B.; William, C.B. Beyond Neighborhood Units—Living Environment and Public Policy; Jiangsu Phoenix Science and Technology Press: Los Angeles, CA, USA, 2018; pp. 225–268. [Google Scholar]
- Bond, L.; Kearns, A.; Mason, P.; Tannahill, C.; Egan, M.; Whitely, E. Exploring the relationships between housing, neighbourhoods and mental wellbeing for residents of deprived areas. BMC Public Health 2012, 12, 48. [Google Scholar] [CrossRef] [Green Version]
- Dunstan, F.; Fone, D.L.; Glickman, M.; Palmer, S. Objectively Measured Residential Environment and Self-Reported Health: A Multilevel Analysis of UK Census Data. PLoS ONE 2013, 8, e69045. [Google Scholar] [CrossRef]
- Qiu, Y.Z.; Chen, H.S.; Li, Z.G. Exploring neighborhood environmental effects on mental health: A case study in Guangzhou, China. Prog. Geogr. 2019, 38, 283–295. [Google Scholar]
- Carrus, G.; Scopelliti, M.; Lafortezza, R. Go greener, feel better? The positive effects of biodiversity on the well-being of individuals visiting urban and peri-urban green areas. Landsc. Urban Plan. 2015, 134, 221–228. [Google Scholar] [CrossRef]
- Putrik, P.; Nanne, K.; Mujakovic, S. Living environment matters: Relationships between neighborhood characteristics and health of the residents in a Dutch municipality. J. Community Health 2015, 40, 47–56. [Google Scholar] [CrossRef] [PubMed]
- Gale, C.R.; Dennison, E.M.; Cooper, C.; Sayer, A.A. Neighbourhood environment and positive mental health in older people: The Hertfordshire Cohort Study. Health Place 2011, 17, 867–874. [Google Scholar] [CrossRef] [Green Version]


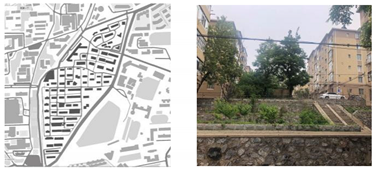
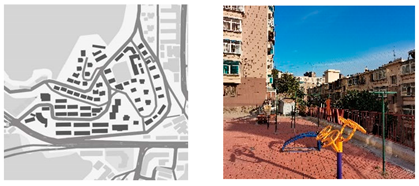
| X Community | J Community | ||||
|---|---|---|---|---|---|
 | 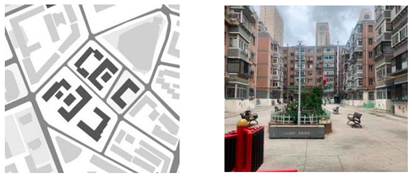 | ||||
| Construction year | Space type | Number of households | Construction year | Space type | Number of households |
| 1979–1988 | Flat-land Row Type | 672 | 1982–2000 | Flat-land Enclosed Type | 2797 |
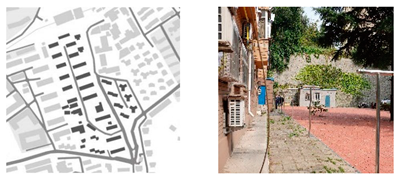
| W Community | S Community | ||||
 |  | ||||
| Construction year | Space type | Number of households | Construction year | Space type | Number of households |
| 1980–1989 | Slope Type | 984 | 1986–1987 | Mountainous Type | 3577 |
| Sample 1 | 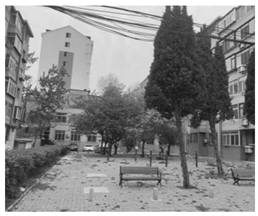 |  |
| Sample2 |  |  |
| Sample 3 |  |  |
| Index System | Influence Variable | Variable Level and Assignment | |
|---|---|---|---|
| The basic attributes of individual society | gender | 2 Categories (1 = male; 2 = female) | |
| age | 3 Levels (60–69 years old, 70–79 years old, over 80 years old) | ||
| education level | 5 Levels (primary school or below, junior high school, senior high school or vocational high school, Associate degree, Bachelor’s Degree) | ||
| Family annual income | 6 Levels (below 10,000, 10,000 to 30,000, 30,000 to 80,000, 80,000 to 120,000, 120,000 to 200,000, more than 200,000) | ||
| Housing area | 3 Levels (below 50 m2, 50–80 m2, above 80 m2) | ||
| Family structure | 4 Categories (living alone, with spouse, second generation, third generation) | ||
| Individual social relations | Physical condition | 5 levels (assign 1 = very bad~5 = Very good) | |
| Family relationships | 5 levels (assign 1 = very bad~5 = Very good) | ||
| neighborhood | 5 levels (assign 1 = very bad~5 = Very good) | ||
| Activity characteristics | Activity frequency | 4 levels (1–2 times, 3–4 times, 5–6 times, 7 times or more) | |
| Activity duration | 5 Levels (less than 0.5 h, 0.5–1 h, 1–2 h, 2–3 h, 3 h and above) | ||
| The activity type | Record the content of the activity, and count the number of types | ||
| Multiple quality variables in the residential environment | Functional Quality | Activity and Rest facilities | 5 levels (1 = very inconsistent~5 = very in conformity) |
| Environmental cleanliness | 5 levels (1 = very inconsistent~5 = very in conformity) | ||
| Spatial scale | 5 levels (1 = very inconsistent~5 = very in conformity) | ||
| Place Quality | Greening quality | 5 levels (1 = very inconsistent~5 = very in conformity) | |
| Vegetation type | 5 levels (1 = very inconsistent~5 = very in conformity) | ||
| Degree of sky openness | 5 levels (1 = very inconsistent~5 = very in conformity) | ||
| Spatial scale | 5 levels (1 = very inconsistent~5 = very in conformity) | ||
| Interface color | 5 levels (1 = very inconsistent~5 = very in conformity) | ||
| Comfort Quality | The wind environment | 5 levels (1 = very inconsistent~5 = very in conformity) | |
| Sunshine | 5 levels (1 = very inconsistent~5 = very in conformity) | ||
| Acoustic environment | 5 levels (1 = very inconsistent~5 = very in conformity) | ||
| emotion healthy | Emotional status | MUNSH Happiness Scale, a total of 24 questions, total score = PA-NA+PE-NE. Score range −24~+24 | |
| Characteristic | Category | N (%) |
|---|---|---|
| Sex | Male | 131 (42.8%) |
| Female | 175 (57.2%) | |
| Age | 60–69 | 108 (35.3%) |
| 70–79 | 138 (45.1%) | |
| ≥80 | 60 (19.6%) | |
| Education | Primary school or below | 62 (20.3%) |
| Junior high school | 69 (22.5%) | |
| High school or vocational high school | 132 (43.1%) | |
| Associate degree | 33 (10.8%) | |
| Bachelor’s Degree | 10 (3.3%) | |
| Family living structure | Living alone | 85 (27.8%) |
| With spouse | 156 (51.0%) | |
| Two generations | 49 (16.0%) | |
| Three generations | 16 (5.2%) | |
| Annual household income(RMB) | 10,000–30,000 | 46 (15.1%) |
| 30,000–80,000 | 161 (52.6%) | |
| 80,000–120,000 | 69 (22.5%) | |
| 120,000–200,000 | 24 (7.8%) | |
| ≥200,000 | 6 (2.0%) |
| Individual Situation of the Elderly | Residential Environment Type | Mean | Differences between Groups | |
|---|---|---|---|---|
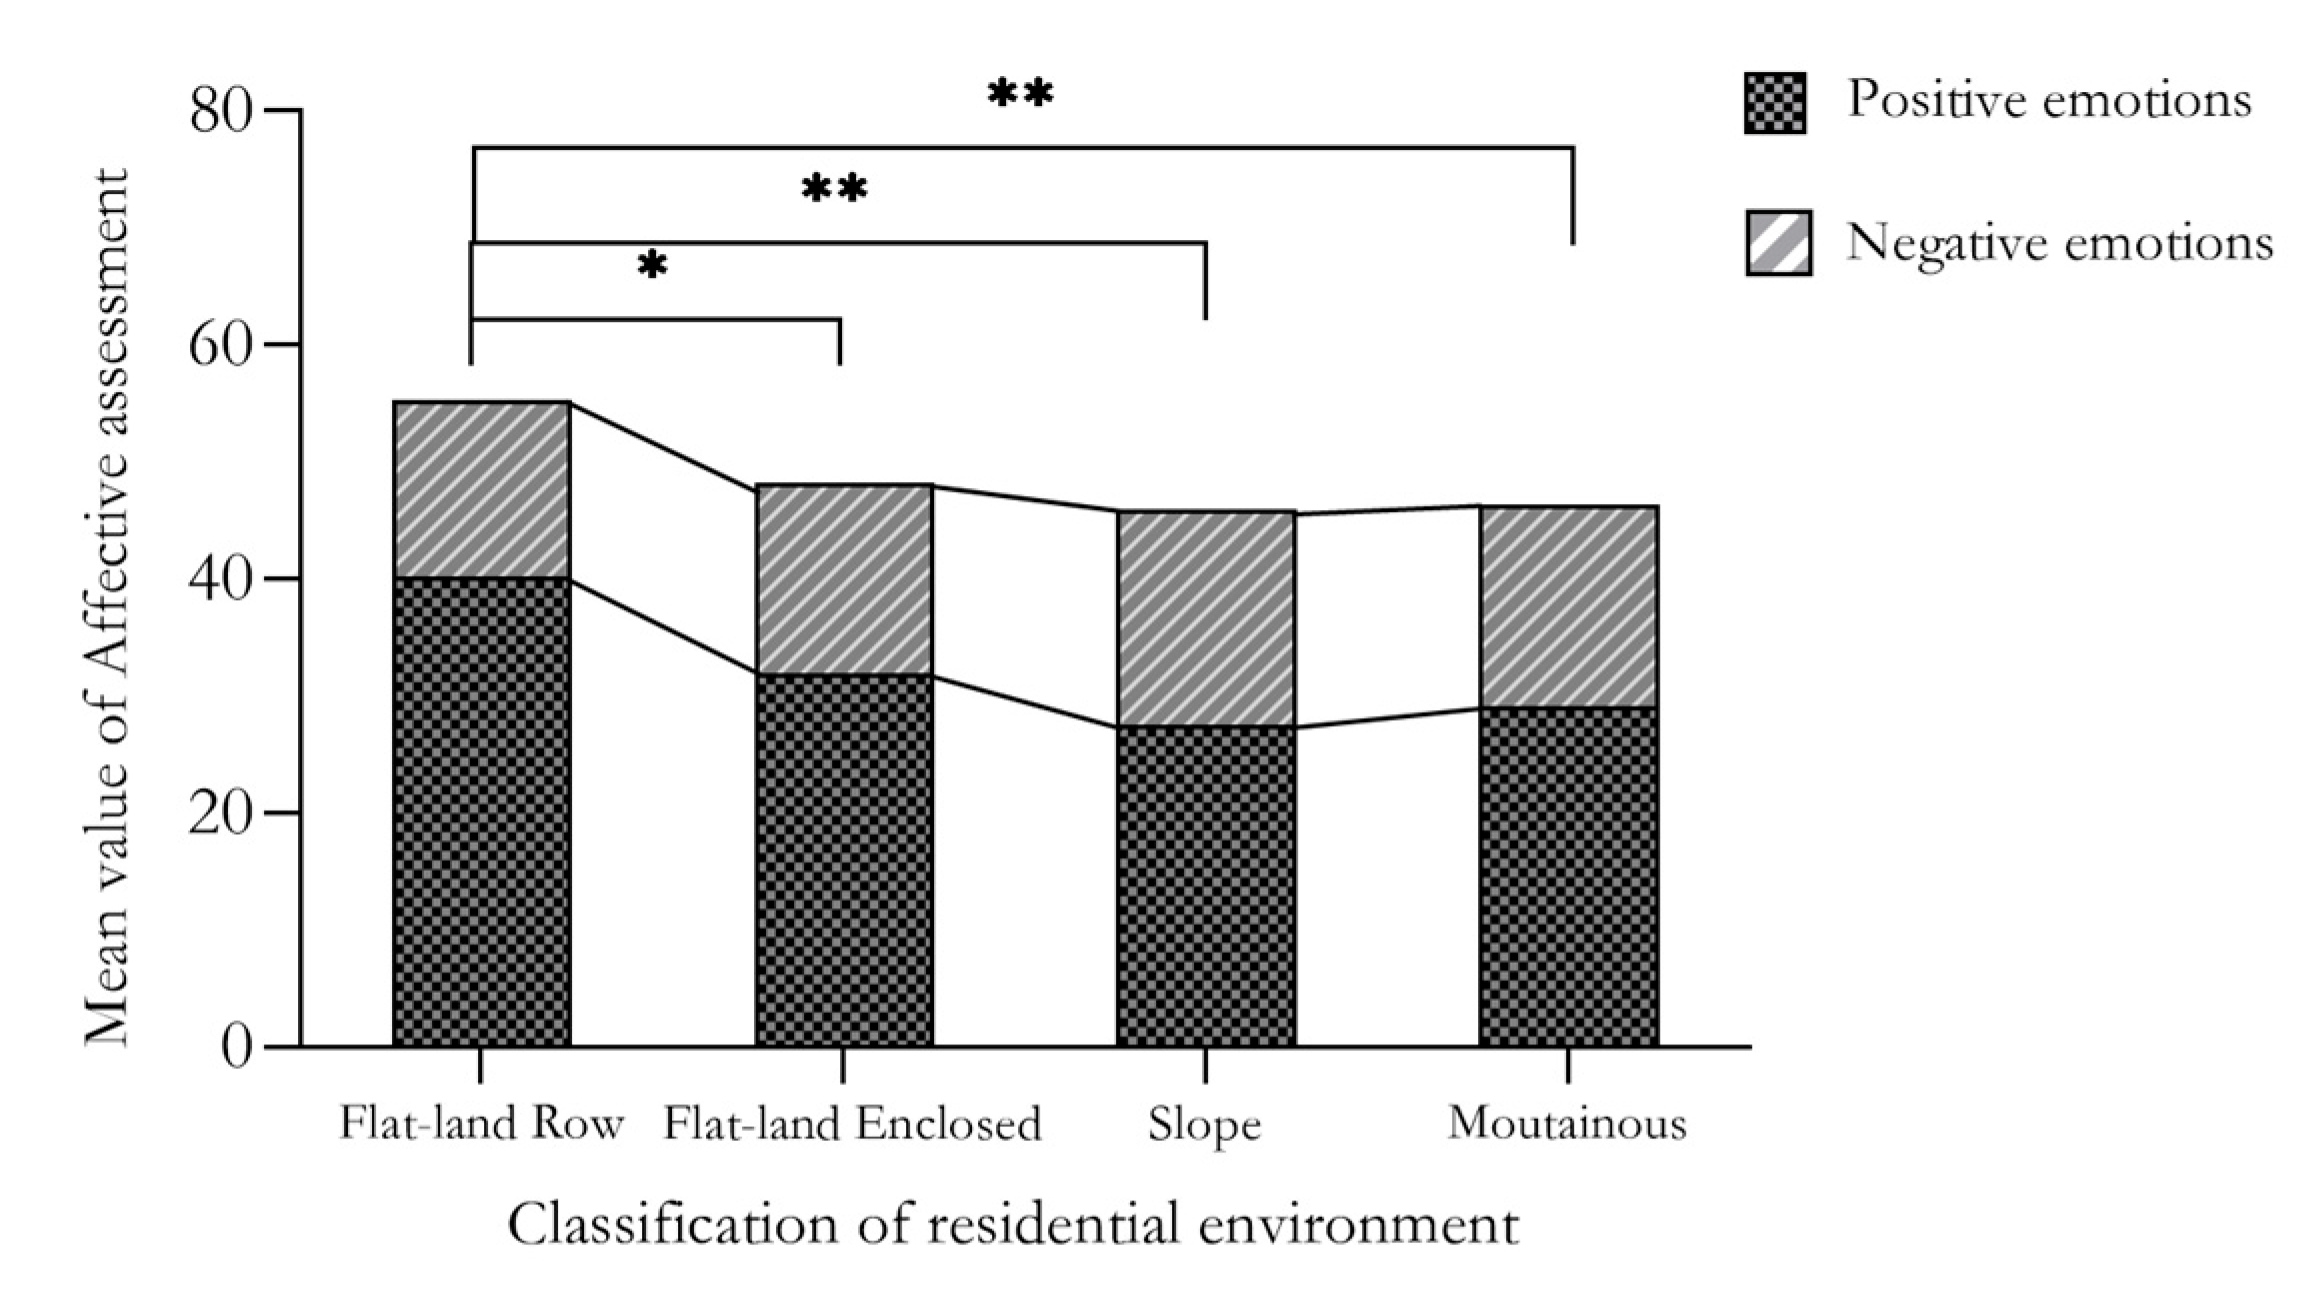
| Emotional state | Positive emotion | Flat-land in rows | 40.17 | 0.001 ** |
| Flat-land enclosed | 31.98 | |||
| Slope | 27.48 | |||
| Mountainous | 29.07 | |||
| Negative emotion | Flat-land in rows | 15.04 | 0.635 | |
| Flat-land enclosed | 16.28 | |||
| Slope | 18.43 | |||
| Mountainous | 17.20 | |||
| Activity characteristics | Activity frequency | Flat-land in rows | 3.31 | 0.016 * |
| Flat-land enclosed | 3.74 | |||
| Slope | 3.66 | |||
| Mountainous | 3.20 | |||
| Activity duration | Flat-land in rows | 3.15 | 0.022 * | |
| Flat-land enclosed | 2.89 | |||
| Slope | 3.15 | |||
| Mountainous | 2.68 | |||
| activity type | Flat-land in rows | 4.36 | 0.000 ** | |
| Flat-land enclosed | 4.39 | |||
| Slope | 2.58 | |||
| Mountainous | 2.17 | |||
| Residential Environment Type | Environmental Factor Index | Mean | Differences between Groups | Environmental Factor Index | Mean | Differences between Groups |
|---|---|---|---|---|---|---|
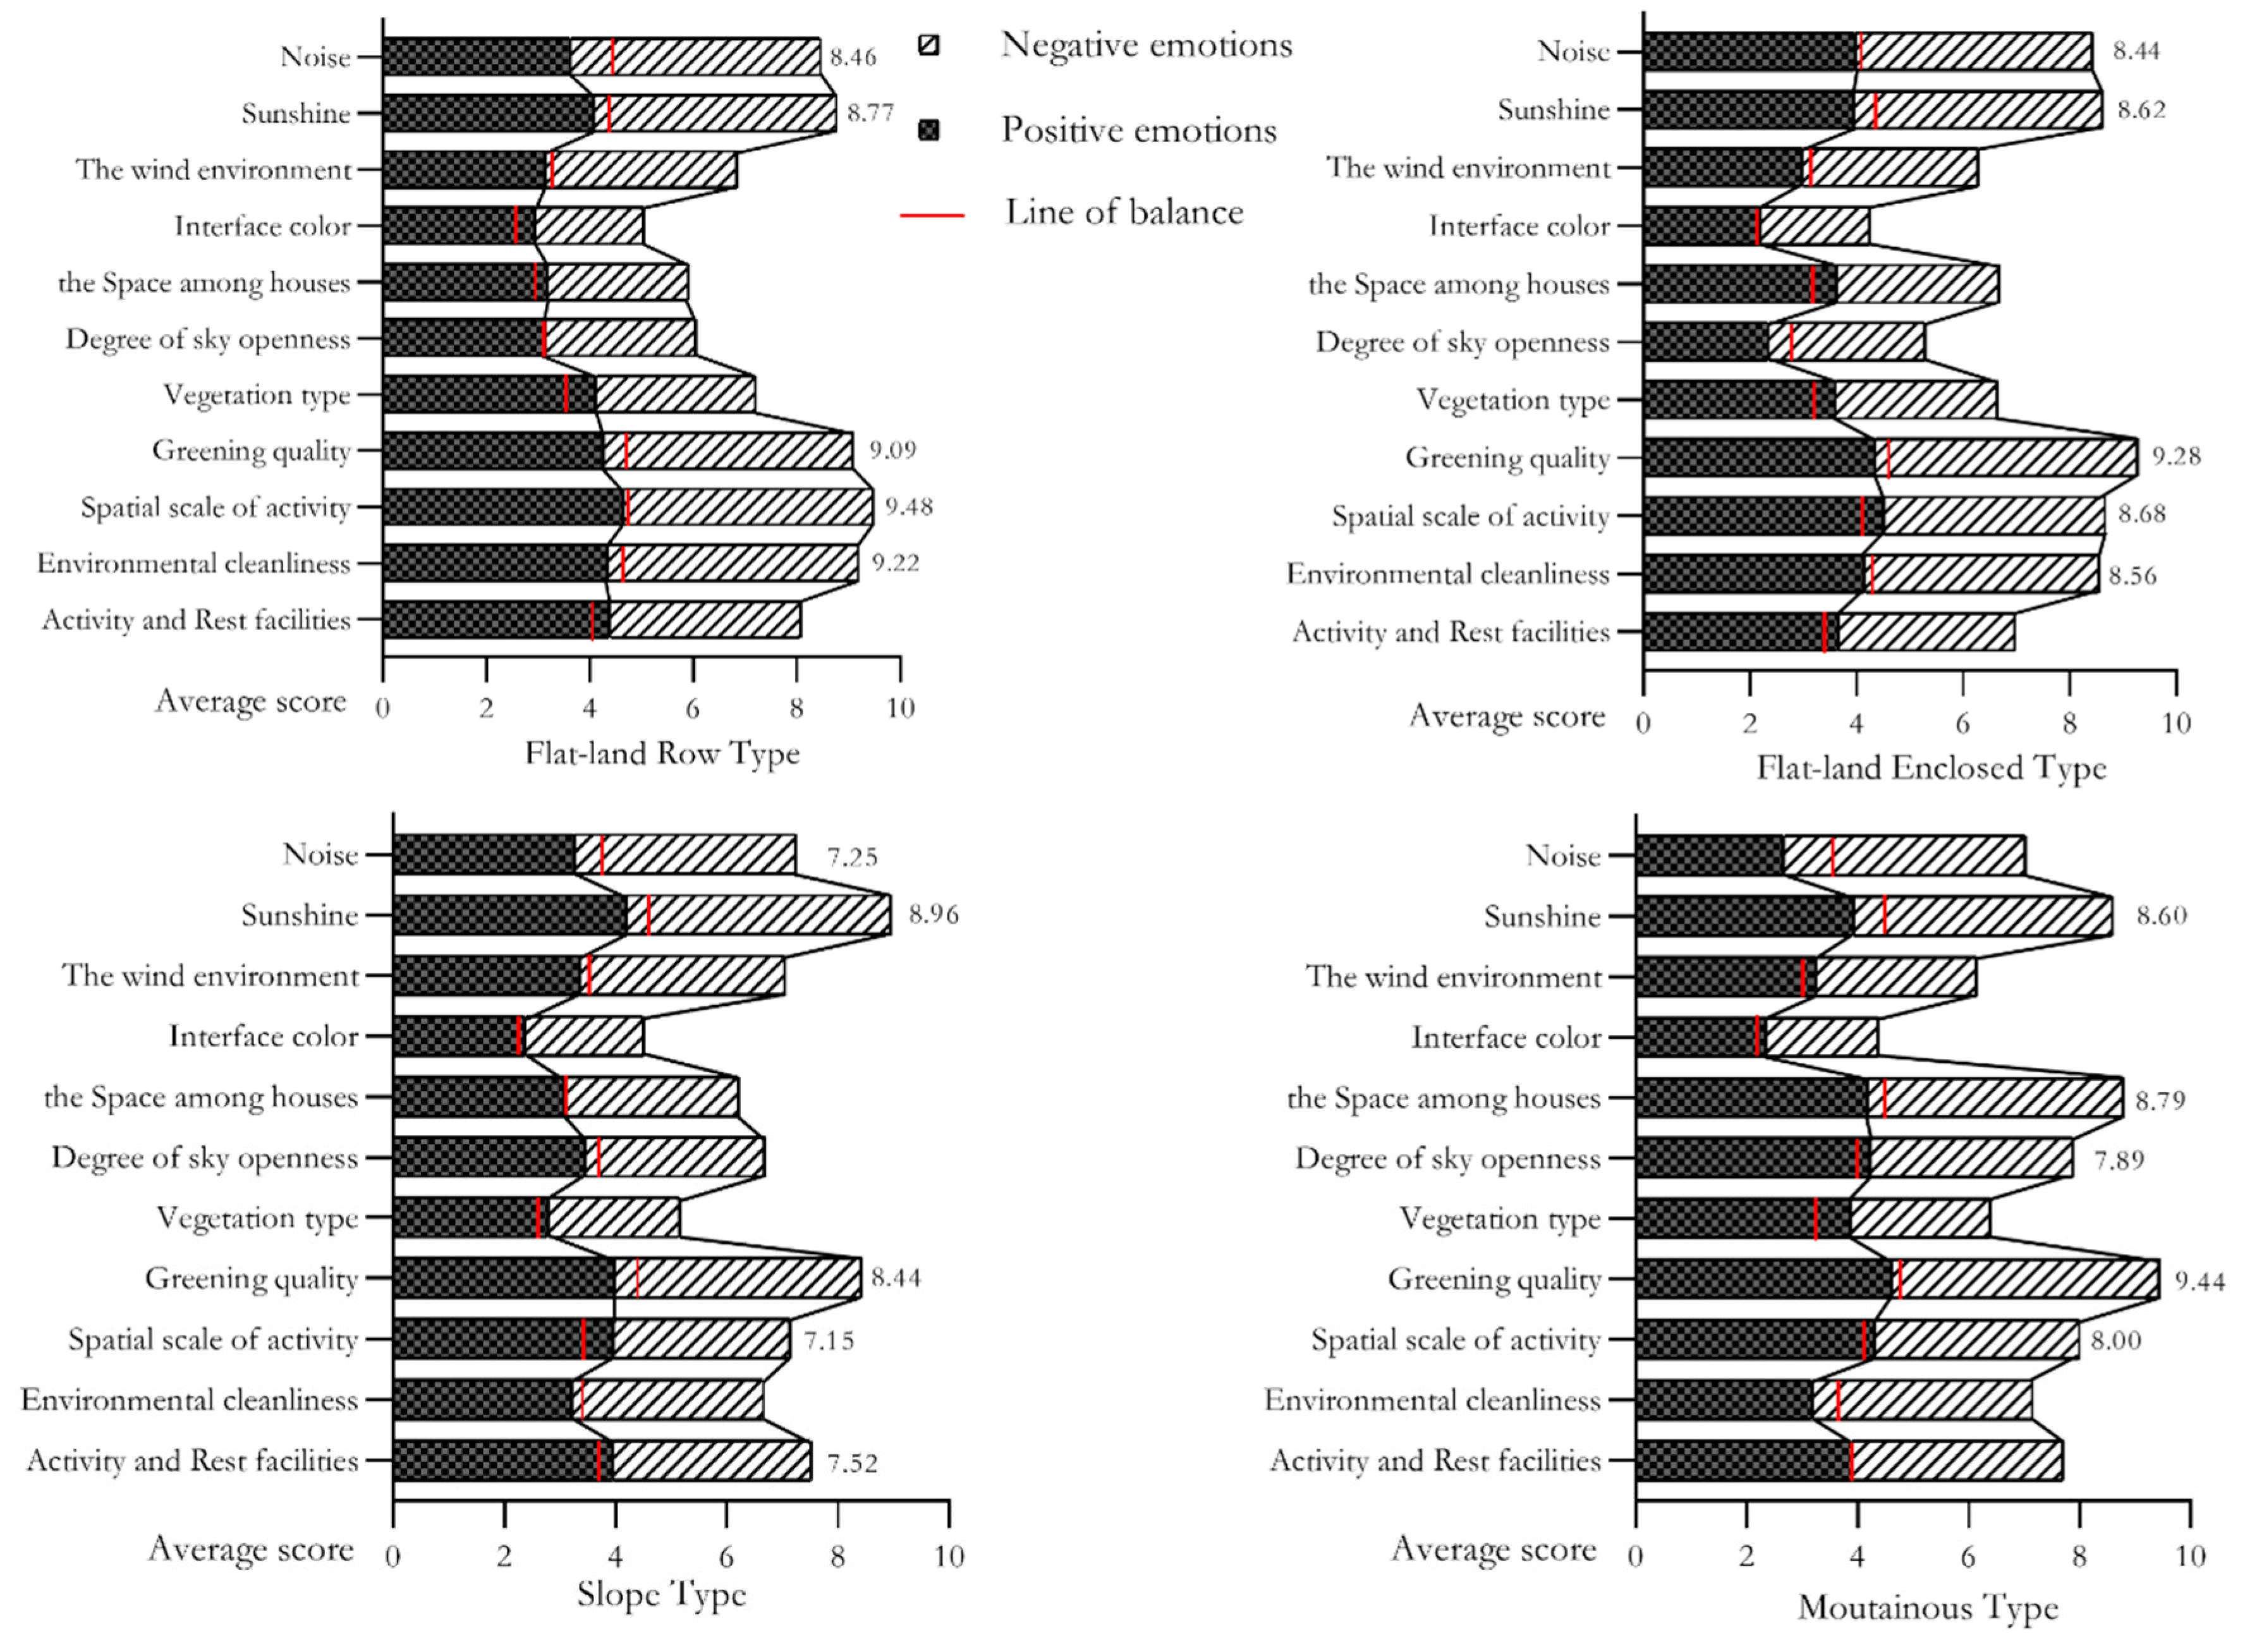
| Flat-land in rows | Activity and Rest facilities | 3.76 | 0.000 ** | Spatial scale | 4.56 | 0.000 ** |
| Flat-land enclosed | 4.64 | 3.04 | ||||
| Slope | 2.67 | 4.15 | ||||
| Mountainous | 2.19 | 3.23 | ||||
| Flat-land in rows | Environmental cleanliness | 4.28 | 0.000 ** | Interface color | 3.34 | 0.000 ** |
| Flat-land enclosed | 3.2 | 3.63 | ||||
| Slope | 3.48 | 4.10 | ||||
| Mountainous | 3.19 | 3.98 | ||||
| Flat-land in rows | Activity scale | 4.34 | 0.000 ** | Wind environment | 4.31 | 0.000 ** |
| Flat-land enclosed | 3.93 | 3.32 | ||||
| Slope | 3.10 | 4.23 | ||||
| Mountainous | 3.16 | 3.46 | ||||
| Flat-land in rows | Greening quality | 3.16 | 0.000 ** | Sunshine | 4.41 | 0.000 ** |
| Flat-land enclosed | 2.46 | 3.71 | ||||
| Slope | 3.36 | 4.11 | ||||
| Mountainous | 4.08 | 3.28 | ||||
| Flat-land in rows | Vegetation type | 2.98 | 0.000 ** | Acoustic environment | 3.85 | 0.000 ** |
| Flat-land enclosed | 2.43 | 3.07 | ||||
| Slope | 4.33 | 4.36 | ||||
| Mountainous | 4.56 | 4.25 | ||||
| Flat-land in rows | Degree of sky openness | 4.41 | 0.000 ** | |||
| Flat-land enclosed | 3.17 | |||||
| Slope | 3.93 | |||||
| Mountainous | 2.83 |
| Influence Factors | Flat-Land in Rows Type | Flat-Land Enclosed Type | Slope Type | Mountainous Type | ||||||||||
|---|---|---|---|---|---|---|---|---|---|---|---|---|---|---|
| Model Ia | Model IIa | Model IIIa | Model Ib | Model IIb | Model IIIb | Model Ic | Model IIc | Model IIIc | Model Id | Model IId | Model IIId | |||
| Basic information of individual society | gender | 0.086 | 0.011 | −0.061 | 0.051 | −0.133 | −0.754 | 0.040 | 0.014 | −0.049 | 0.078 | 0.052 | −0.055 | |
| age | 0.072 | 0.116 | 0.102 | 0.074 | −0.048 | 0.056 | −0.045 | −0.054 | −0.041 | −0.038 | 0.023 | −0.033 | ||
| education level | 0.158 | 0.128 | 0.067 | 0.172 * | 0.143 * | −0.171 | 0.009 | 0.035 | 0.070 | −0.083 | −0.012 | −0.037 | ||
| Family income | 0.314 ** | 0.006 | 0.014 | 0.291 ** | 0.180 * | −1.764 | 0.179 | 0.103 | 0.077 | 0.330 ** | 0.074 | −0.028 | ||
| Housing area | 0.078 | 0.084 | 0.077 | −0.001 | 0.122 | 0.380 | −0.115 | 0.182 * | −0.066 | 0.003 | −0.052 | −0.040 | ||
| Physical condition | 0.262 * | 0.125 | 0.098 | 0.321 ** | 0.207 ** | 1.443 | 0.317 ** | 0.237 * | −0.093 | 0.481 ** | 0.079 | 0.041 | ||
| Family structure | With spouse | 0.378 ** | 0.179 | 0.216 * | 0.258 ** | 0.204 ** | 0.247 ** | 0.293 ** | 0.247 ** | 0.204 * | 0.002 | 0.160 | 0.114 | |
| Two generations | 0.181 | 0.151 | 0.048 | 0.247 ** | 0.199 ** | 0.219 ** | 0.248 * | 0.239 ** | 0.116 | 0.173 * | 0.002 | 0.096 | ||
| Three generations | 0.113 | 0.138 | −0.036 | 0.049 | 0.080 | 0.048 | 0.072 | 0.123 | 0.083 | 0.009 | −0.055 | 0.073 | ||
| Living alone | 0 | 0 | 0 | 0 | 0 | 0 | 0 | 0 | 0 | 0 | 0 | 0 | ||
| Social and family relations | Family relationships | 0.108 | 0.099 | 0.077 | 0.125 | 0.074 | −0.464 | 0.330 ** | 0.255 * | 0.074 | 0.101 | 0.098 | −0.005 | |
| Neighborhood relationships | 0.024 | 0.003 | −0.030 | 0.032 | 0.005 | −0.326 | −0.150 | −0.095 | −0.100 | 0.029 | 0.022 | −0.008 | ||
| Activities Features | Activity frequency | 0.212 * | −0.046 | 0.920 ** | 0.215 ** | 0.245 * | 0.190 * | 0.183 | 0.027 | |||||
| Activity duration | 0.288 ** | 0.225 ** | −0.118 | 0.198 ** | 0.138 | 0.106 | 0.352 ** | 0.154 * | ||||||
| type of activity | 0.170 | 0.046 | −0.031 | 0.124 | 0.238 * | 0.100 | 0.257 ** | 0.257 ** | ||||||
| Environmental multi-quality elements | Activity and Rest facilities | −0.078 | 0.137 * | −0.027 | 0.160 * | |||||||||
| Environmental cleanliness | 0.075 | 0.084 | 0.269 * | −0.097 | ||||||||||
| Activity space area | 0.284 ** | 0.035 | 0.111 | 0.209 | ||||||||||
| Greening quality | 0.395 ** | 0.217 * | 0.196 * | 0.230 ** | ||||||||||
| Vegetation type | 0.138 | 0.094 | 0.149 | 0.103 | ||||||||||
| Degree of sky openness | −0.005 | −0.095 | 0.149 | 0.065 | ||||||||||
| Spatial scale | 0.065 | 0.173 | −0.017 | 0.204 * | ||||||||||
| Interface color | 0.150 | 0.024 | 0.002 | 0.092 | ||||||||||
| Wind environment | 0.094 | 0.002 | 0.083 | 0.088 | ||||||||||
| Sunshine | −0.130 | 0.018 | −0.083 | 0.229 * | ||||||||||
| Acoustic environment | 0.263 * | 0.225 ** | 0.233 ** | −0.070 | ||||||||||
| Adjusted R2 | 0.503 | 0.506 | 0.739 | 0.436 | 0.497 | 0.586 | 0.588 | 0.623 | 0.824 | 0.388 | 0.435 | 0.832 | ||
| F | 2.389 | 2.875 | 3.080 | 3.569 | 3.746 | 4.492 | 3.135 | 4.740 | 4.805 | 4.064 | 3.223 | 3.776 | ||
| Sig. | 0.000 ** | 0.000 ** | 0.000 ** | 0.000 ** | 0.000 ** | 0.000 ** | 0.000 ** | 0.000 ** | 0.001 ** | 0.000 ** | 0.000 ** | 0.000 ** | ||
Publisher’s Note: MDPI stays neutral with regard to jurisdictional claims in published maps and institutional affiliations. |
© 2021 by the authors. Licensee MDPI, Basel, Switzerland. This article is an open access article distributed under the terms and conditions of the Creative Commons Attribution (CC BY) license (https://creativecommons.org/licenses/by/4.0/).
Share and Cite
Zhong, W.; Suo, J.; Ren, X.; Li, G. The Influence of Emotional Health on the Activity Characteristics of the Elderly and the Selection of Environmental Quality Factors in Residential Areas. Int. J. Environ. Res. Public Health 2021, 18, 12618. https://doi.org/10.3390/ijerph182312618
Zhong W, Suo J, Ren X, Li G. The Influence of Emotional Health on the Activity Characteristics of the Elderly and the Selection of Environmental Quality Factors in Residential Areas. International Journal of Environmental Research and Public Health. 2021; 18(23):12618. https://doi.org/10.3390/ijerph182312618
Chicago/Turabian StyleZhong, Wen, Jian Suo, Xinxin Ren, and Guopeng Li. 2021. "The Influence of Emotional Health on the Activity Characteristics of the Elderly and the Selection of Environmental Quality Factors in Residential Areas" International Journal of Environmental Research and Public Health 18, no. 23: 12618. https://doi.org/10.3390/ijerph182312618
APA StyleZhong, W., Suo, J., Ren, X., & Li, G. (2021). The Influence of Emotional Health on the Activity Characteristics of the Elderly and the Selection of Environmental Quality Factors in Residential Areas. International Journal of Environmental Research and Public Health, 18(23), 12618. https://doi.org/10.3390/ijerph182312618