
Investigating the Effect of School Bus Stopping Process on Driver Behavior of Surrounding Vehicles Based on a Driving Simulator Experiment

Abstract
:1. Introduction
2. Methods
2.1. Participants
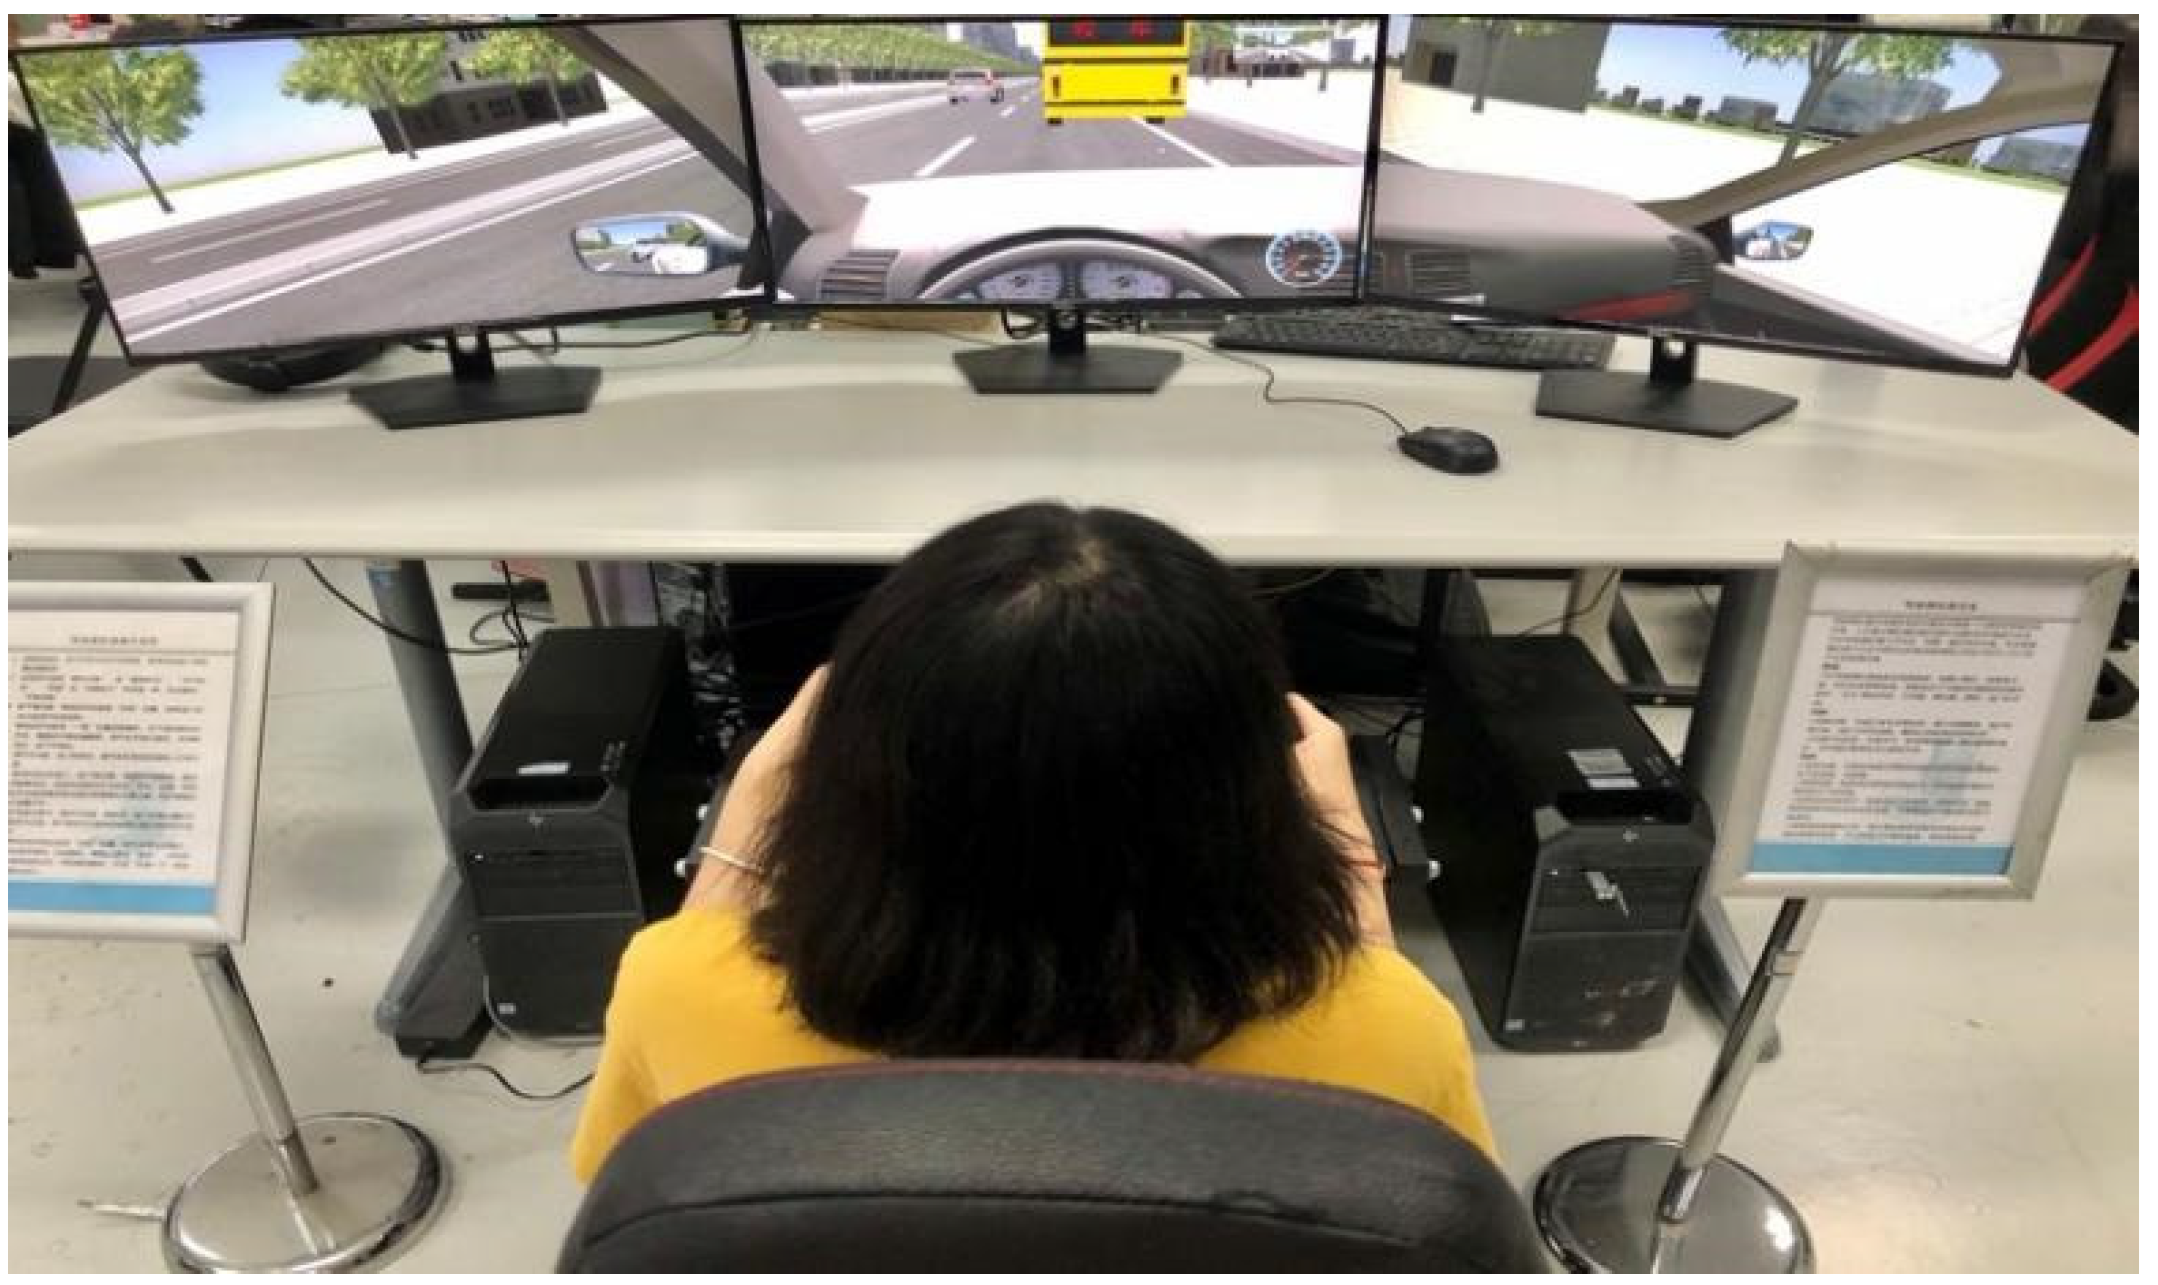
2.2. Apparatus
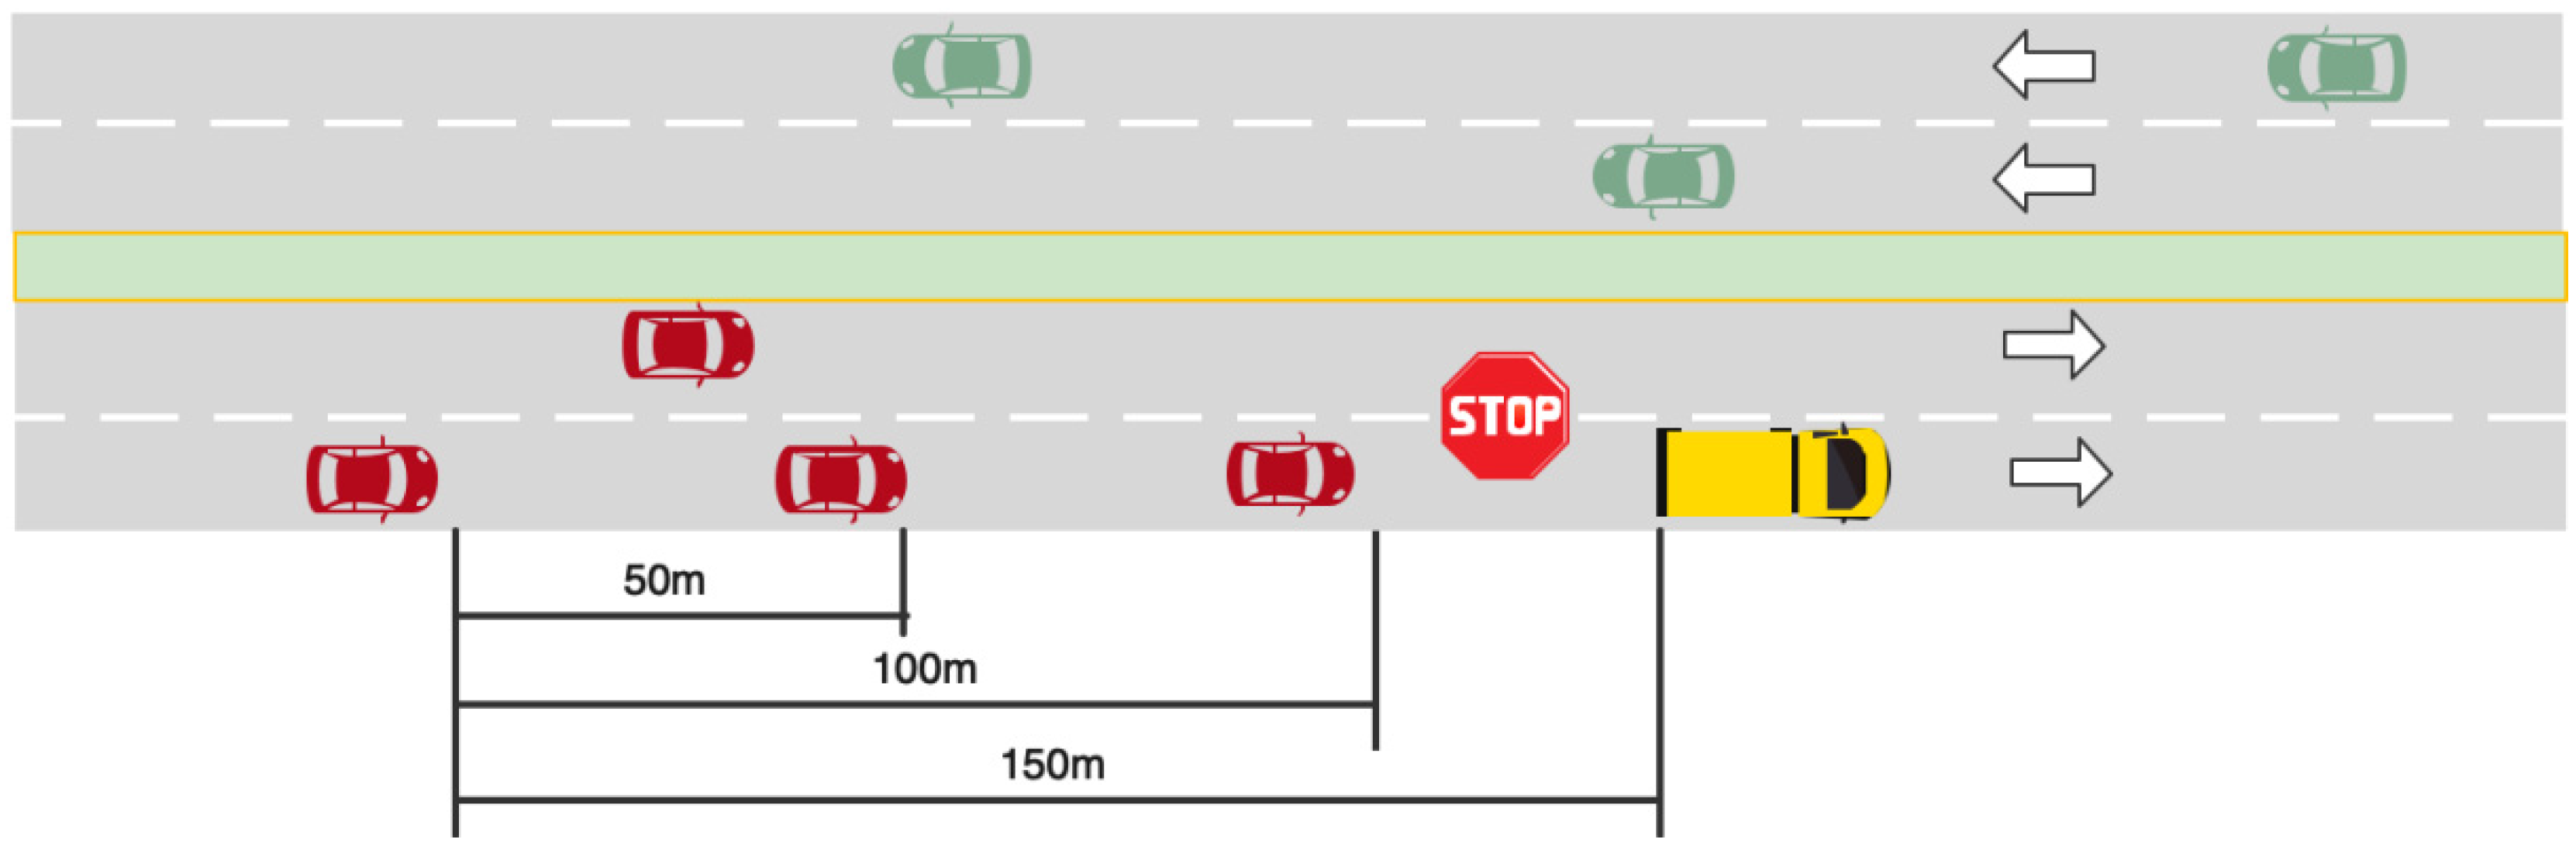
2.3. Scenario Design
2.4. Procedure
2.5. Dependent Variables
- Stop/Go decision (Stop = 0; Go = 1): This variable was defined as the driver’s decision of whether to stop or go after the school bus’s brake light comes on. If the driver continues driving after the school bus’s brake light comes on, Stop/Go decision = 1, and 0 otherwise.
- Acc/Dec state (Dec = 0; Acc = 1): This variable was defined as the overtaking state the drivers would take when approaching the school bus. For drivers who decide to continue going after the school bus’s brake light comes on, if the driver is accelerating when passing the school bus, the value of this variable is 1.
- Stop/Go bus state (Stop = 0; Go = 1): This variable was defined as the state of the school bus at the moment the vehicle passed the bus. Stop/Go bus state = 0 if the school bus is completely stationary while the test vehicle is passing the school bus.
- Mean speed: The average speed of the test vehicles within the whole duration of school bus stopping process (m/s).
- Max Long Acc: The maximum value of the longitudinal acceleration of the vehicle while traveling behind the school bus (m/s2).
- Max Long Dec: The maximum value of the longitudinal deceleration of the vehicle while traveling behind the school bus (m/s2).
- Max Lateral Acc: The maximum lateral acceleration of the vehicle while traveling behind the school bus (m/s2).
- Percentage of Following Times: The percentage of time that vehicles travel in the same lane as that of the school bus as a percentage of total time spent driving before overtaking the school bus (%).
2.6. Statistical Analysis
3. Results
3.1. Categorical Variables
3.2. Continuous Variables
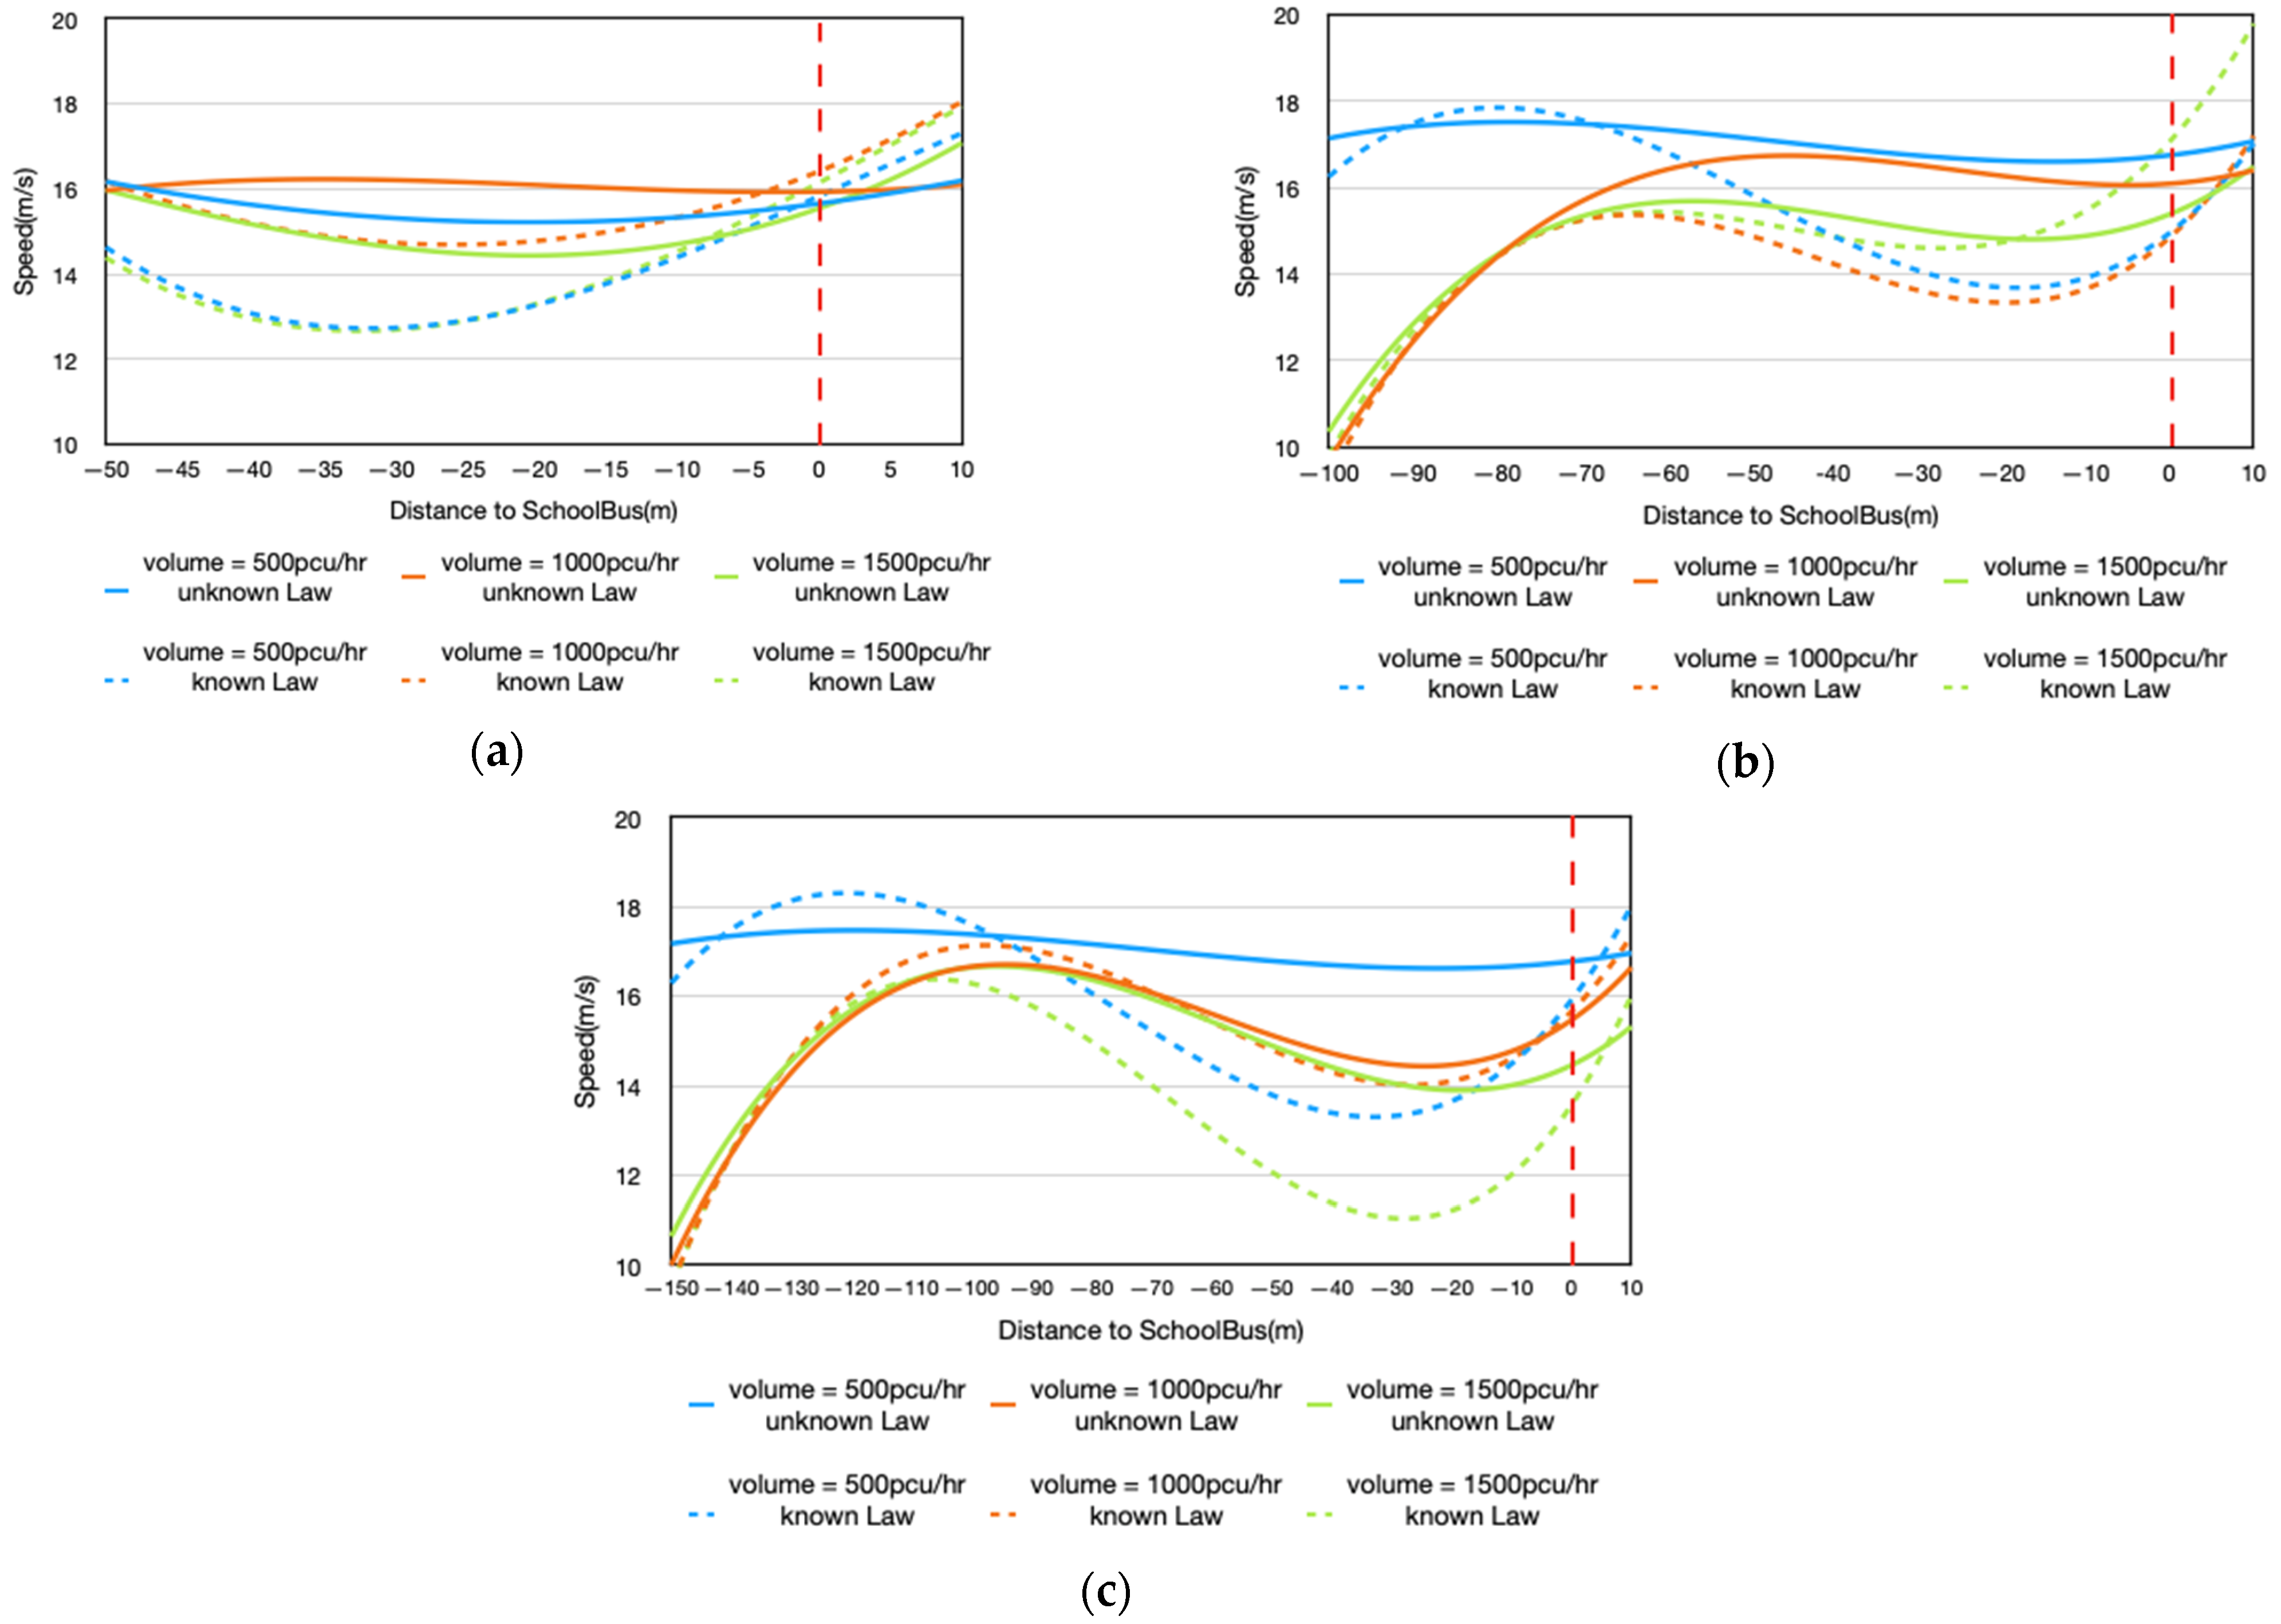
3.2.1. Mean Speed
3.2.2. Longitudinal Acceleration/Deceleration
3.2.3. Lateral Acceleration
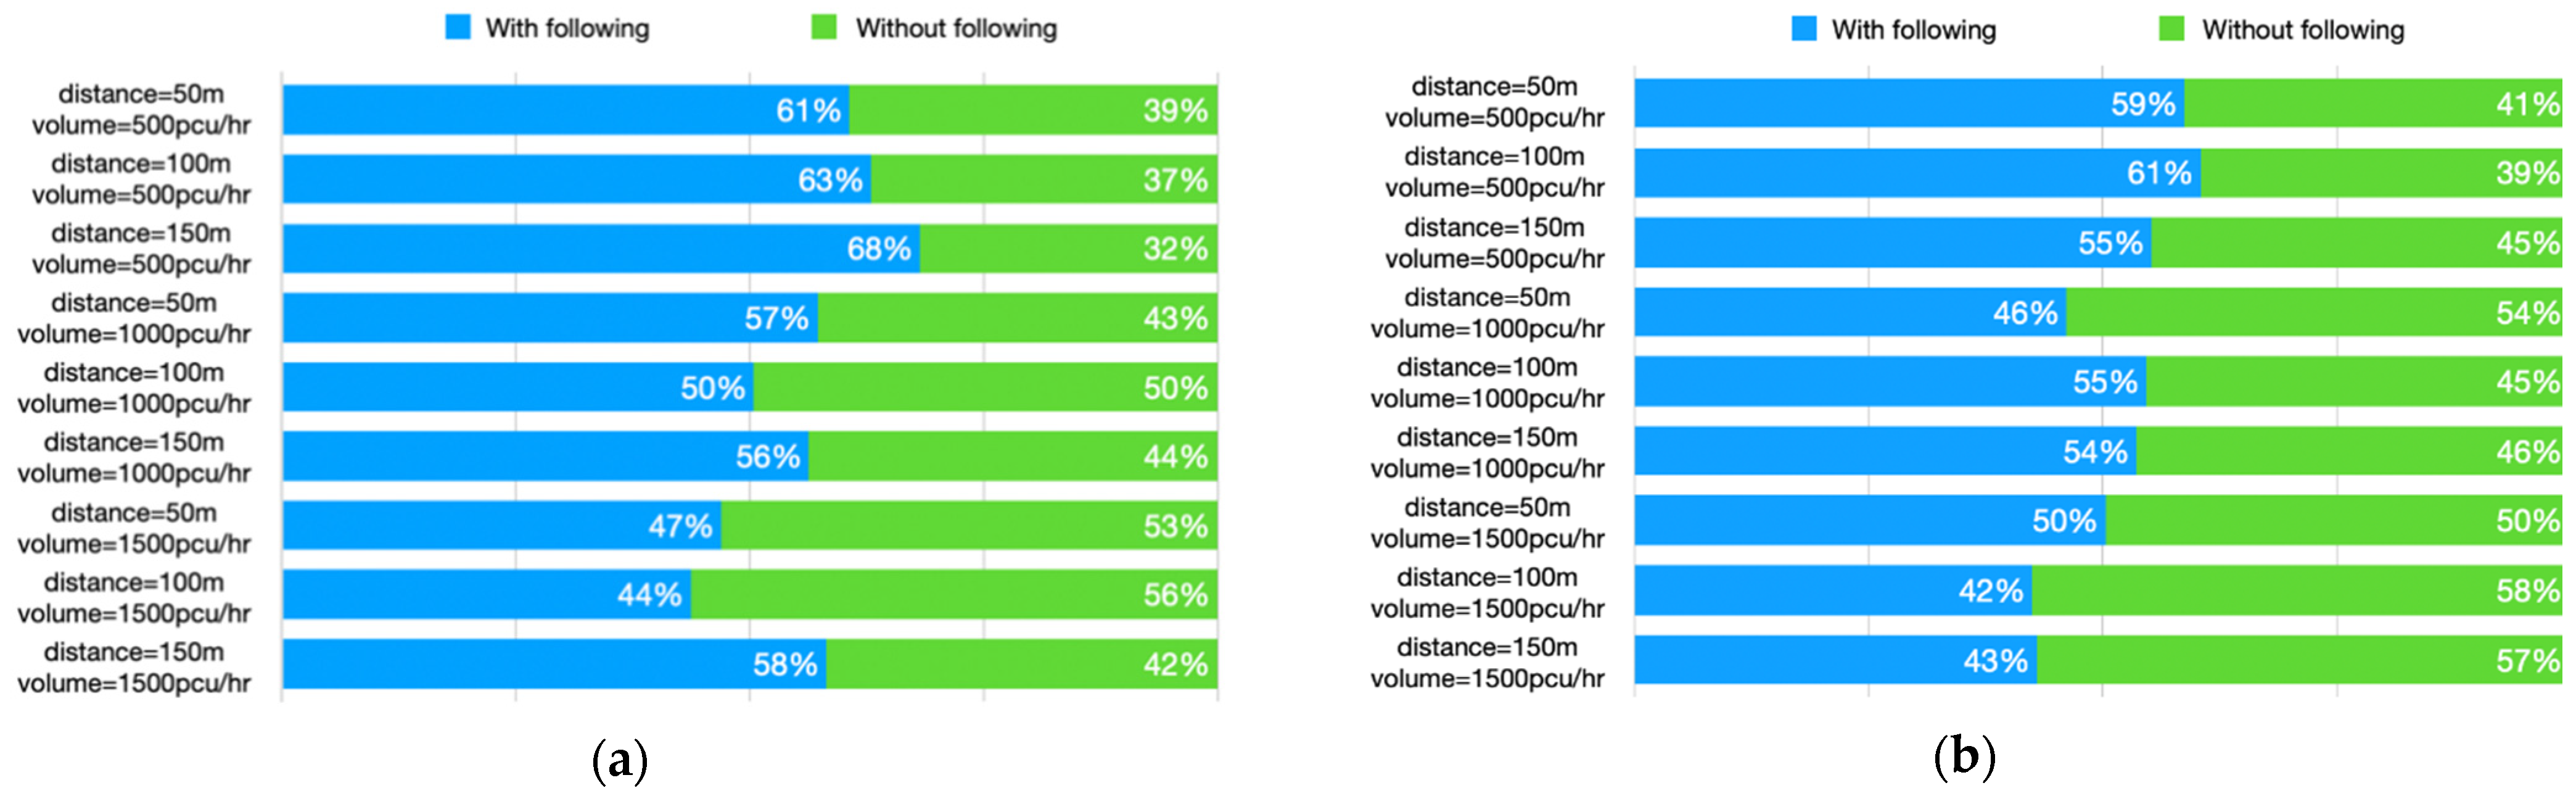
3.2.4. Percentage of Following Time
4. Discussion
5. Conclusions
Author Contributions
Funding
Institutional Review Board Statement
Informed Consent Statement
Data Availability Statement
Acknowledgments
Conflicts of Interest
References
- Hinch, J.; McCray, L.; Aloke, P.; Sullivan, L.; Willke, D.; Hott, C.; Elias, J. School Bus Safety: Crashworthiness Research; Research and Development at the National Highway Traffic Safety Administration: Washington, DC, USA, 2002.
- Zhenwu, P.; Junling, Z.; Runjia, H.; Lingzhi, Z. The Design and Research on School Bus Safety Monitoring and Management System. Comput. Telecommun. 2017, 12, 14–16. [Google Scholar]
- Lijun, P.; Ximei, L. Countermeasures for Normalization of School Bus Safety Operation Based on a Security Accident Perspective. J. Hunan Inst. Eng. (Soc. Sci. Ed.) 2019, 29, 7–10. [Google Scholar]
- Appachu, D.; Elias, A.M.; Stephens, B.; Wallace, C.E.; Gan, A. Identification of Critical Issues Involving School Bus Safety; National Technical Information Service: Gaineville, FL, USA, 1999.
- Donoughe, K.; Katz, B. Evaluation of fatal school bus related crashes and near-term crash mitigation strategies. Iatss Res. 2015, 38, 135–141. [Google Scholar] [CrossRef] [Green Version]
- School Bus Network. Available online: http://www.xiaoche001.com/xcxw (accessed on 17 December 2020).
- Li, Z.; Li, R.; Zhang, H.; Jiang, N.; Feng, G.; Qi, X. Development of a School Bus Restraint System Model and Its Application in the Evaluation of Designed Protective Strategies on Child Neck Injury in Front-End Crash. Int. J. Crashworth. 2020, 1–10. [Google Scholar] [CrossRef]
- Gunter, L.; Davis, J.; Abulhassan, Y.; Sesek, R.; Gallagher, S.; Schall, M. School Bus Rear Emergency Door Design Improvements to Increase Evacuation Flow. Saf. Sci. 2020, 121, 64–70. [Google Scholar] [CrossRef]
- Avilés-González, J.F.; Mora-Vargas, J.; Smith, N.R.; Cedillo-Campos, M.G. Artificial Intelligence and DOE: An Application to School Bus Routing Problems. Wirel. Netw. 2020, 26, 4975–4983. [Google Scholar] [CrossRef]
- Yaqub, R.; Lule, K. A System for Real-Time Notification of Student’s Pickup and Drop-off by School Buses. In Proceedings of the 2019 SoutheastCon, Huntsville, AL, USA, 11–14 April 2019. [Google Scholar]
- Ammar, K.; Jalmoud, M.; Boushehri, A.; Fakhro, K. A Real-Time School Bus Tracking and Monitoring System. In Proceedings of the 2019 IEEE 10th Annual Information Technology, Electronics and Mobile Communication Conference (IEMCON), Vancouver, BC, Canada, 17–19 October 2019. [Google Scholar] [CrossRef]
- Li, J.; Zuo, L. Comparative Analysis of School Bus Management Mode in China and America. In Proceedings of the International Conference on Financial, Management and Education Science, Beijing, China, 19–20 May 2012. [Google Scholar]
- Council, N. The Relative Risks of School Travel, Transportation Research Board; Transportation Research Board of the National Academies of Science: Washington, DC, USA, 2002. [Google Scholar]
- National Center for Safe Routes to School, Pedestrian and Bicycle Information Center. Selecting School Bus Stop Locations: A Guide for School Transportation Professionals; National Center for Safe Routes to School: Washington, DC, USA, 2010. [Google Scholar]
- Mcgeehan, J.; Annest, J.L.; Vajani, M.; Bull, M.J.; Agran, P.E.; Smith, G.A. School Bus-Related Injuries among Children and Teenagers in the United States, 2001–2003. Pediatrics 2006, 118, 1978–1984. [Google Scholar] [CrossRef]
- National Highway Traffic Safety Administration. Traffic Safety Facts: School Transportation-Related Crashes (2001–2010 Data); National Highway Traffic Safety Administration: Washington, DC, USA, 2012.
- Davey, J.; Wishart, D.; Freeman, J.; Watson, B. An application of the driver behaviour questionnaire in an Australian organisational fleet setting. Transp. Res. Part F Traffic Psychol. Behav. 2007, 10, 11–21. [Google Scholar] [CrossRef] [Green Version]
- Oz, B.; Ozkan, T.; Lajunen, T. Trip-focused organizational safety climate: Investigating the relationships with errors, violations and positive driver behaviours in professional driving. Transp. Res. Part F Traffic Psychol. Behav. 2014, 26, 361–369. [Google Scholar] [CrossRef]
- De Winter, J.C.F.; Dodou, D. The Driver Behaviour Questionnaire as a predictor of accidents: A meta-analysis. J. Saf. Res. 2010, 41, 463–470. [Google Scholar] [CrossRef]
- Atombo, C.; Wu, C.; Zhong, M.; Zhang, H. Investigating the motivational factors influencing drivers intentions to unsafe driving behaviours: Speeding and overtaking violations. Transp. Res. Part F Psychol. Behav. 2016, 43, 104–121. [Google Scholar] [CrossRef]
- Lee, S.E.; Simons-Morton, B.G.; Klauer, S.E.; Ouimet, M.C.; Dingus, T.A. Naturalistic Assessment of Novice Teenage Crash Experience. Accid. Anal. Prev. 2011, 43, 1472–1479. [Google Scholar] [CrossRef] [Green Version]
- Akaateba, M.A.; Amoh-Gyimah, R. Driver attitude towards traffic safety violations and risk taking behaviour in Kumasi: The gender and age dimension. Int. J. Traffic Transp. Eng. 2013, 3, 479–494. [Google Scholar] [CrossRef] [Green Version]
- Popken, A.; Krems, J.F. Drivers’ reliance on lane keeping assistance systems: Effects of different levels of assistance. In Proceedings of the European Conference on Human Centred Design for Intelligent Transport Systems, Lyon, France, 3 April 2008. [Google Scholar]
- Feng, F.; BaO, S.; Sayer, J.R.; Flannagan, C.; Manser, M.; Wunderlich, R. Can Vehicle Longitudinal Jerk Be Used to Identify Aggressive Drivers? An Examination Using Naturalistic Driving Data. Accid. Anal. Prev. 2017, 104, 125–136. [Google Scholar] [CrossRef]
- Prato, C.G.; Toledo, T.; Lotan, T.; Taubman-Ben-Ari, O. Modeling the Behavior of Novice Young Drivers during the First Year after Licensure. Accid. Anal. Prev. 2010, 42, 480–486. [Google Scholar] [CrossRef] [PubMed]
- Wu, Y.N.; Abdel-Aty, M.; Park, J.; Zhu, J. Effects of Connected-Vehicle Warning Systems on Rear-End Crash Avoidance Behavior Under Fog Conditions. Transp. Res. 2018, 95, 481–492. [Google Scholar] [CrossRef]
- Wu, Y.N.; Abdel-Aty, M.; Park, J.; Selby, R.M. Effects of Real-Time Warning Systems on Driving under Fog Conditions Using an Empirically Supported Speed Choice Modeling Framework. Transp. Res. Part C Emerg. Technol. 2018, 86, 97–110. [Google Scholar] [CrossRef]
- Brackstone, M.; Waterson, B.; Mcdonald, M. Determinants of Following Headway in Congested Traffic. Transp. Res. Part F Traffic Psychol. Behav. 2009, 12, 131–142. [Google Scholar] [CrossRef] [Green Version]
- Hamzeie, R.; Savolainen, P.T.; Gates, T.J. Driver Speed Selection and Crash Risk: Insights from the Naturalistic Driving Study. J. Saf. Res. 2017, 63, 187–194. [Google Scholar] [CrossRef]
- Zhang, Y.; Yan, X.; Li, X. Effect of warning message on driver’s stop/go decision and red-light-running behaviors under fog condition. Accid. Anal. Prev. 2021, 150, 105906. [Google Scholar] [CrossRef]
- Bener, A.; Crundall, D.; Haigney, D.; Bensiali, A.K.; Al-Falasi, A.S. Driving behaviour stress, error and violations on the road: A cross-cultural comparisons study. Adv. Transp. Stud. 2007, 12, 5–14. [Google Scholar]
- Koornstra, M.J. Risk-adaptation theory. Transp. Res. Part. F Psychol. Behav. 2009, 12, 77–90. [Google Scholar] [CrossRef]
- Summala, H. Towards Understanding Motivational and Emotional Factors in Driver Behaviour: Comfort through Satisficing; Springer: London, UK, 2007. [Google Scholar]
- Zuckerman, M. Sensation Seeking and Risky Behavior; American Psychological Association: Washington, DC, USA, 2007. [Google Scholar] [CrossRef]
- Fuller, R.; Hannigan, B.; Bates, H.; Gormley, M.; O’Dolan, C. Understanding inappropriate high speed: A qualitative analysis. Drivers 2008. [Google Scholar]
- Schmidt-Daffy, M.; Brandenburg, S.; Beliavski, A. Velocity, safety, or both? How do balance and strength of goal conflicts affect drivers’ behaviour, feelings and physiological responses? Accid. Anal. Prev. 2013, 55, 90–100. [Google Scholar] [CrossRef] [PubMed]
- Simons-Morton, B.; Lerner, N.; Singer, J. The observed effects of teenage passengers on the risky driving behavior of teenage drivers. Accid. Anal. Prev. 2005, 37, 973–982. [Google Scholar] [CrossRef] [PubMed]
- Sm, A.; Ra, A.; Ajk, A.; Sc, B. The role of drivers’ social interactions in their driving behavior: Empirical evidence and implications for car-following and traffic flow. Transp. Res. Part F Traffic Psychol. Behav. 2021, 80, 203–217. [Google Scholar]


| Law | IDCTS (m) | Volume (pcu/h) | Stop/Go Decision | Acc/Dec State | Stop/Go Bus State | Total | |||||||||
|---|---|---|---|---|---|---|---|---|---|---|---|---|---|---|---|
| Stop | Go | Acc | Dec | Stop | Go | ||||||||||
| N | % | N | % | N | % | N | % | N | % | N | % | N | |||
| unknown | 50 | 500 | 0 | 0.0 | 37 | 100.0 | 16 | 43.2 | 21 | 56.8 | 19 | 51.4 | 18 | 48.6 | 37 |
| unknown | 50 | 1000 | 1 | 2.7 | 36 | 97.3 | 20 | 55.6 | 16 | 44.4 | 18 | 50.0 | 18 | 50.0 | 37 |
| unknown | 50 | 1500 | 0 | 0.0 | 37 | 100.0 | 19 | 51.4 | 18 | 48.6 | 31 | 83.8 | 6 | 16.2 | 37 |
| unknown | 100 | 500 | 0 | 0.0 | 37 | 100.0 | 19 | 51.4 | 18 | 48.6 | 13 | 35.1 | 24 | 64.9 | 37 |
| unknown | 100 | 1000 | 0 | 0.0 | 37 | 100.0 | 14 | 37.8 | 23 | 62.2 | 17 | 45.9 | 20 | 54.1 | 37 |
| unknown | 100 | 1500 | 0 | 0.0 | 37 | 100.0 | 22 | 59.5 | 15 | 40.5 | 25 | 67.6 | 12 | 32.4 | 37 |
| unknown | 150 | 500 | 1 | 2.7 | 36 | 97.3 | 23 | 63.0 | 13 | 36.1 | 23 | 63.9 | 13 | 36.1 | 37 |
| unknown | 150 | 1000 | 0 | 0.0 | 37 | 100.0 | 21 | 56.8 | 16 | 43.2 | 17 | 45.9 | 20 | 54.1 | 37 |
| unknown | 150 | 1500 | 2 | 5.4 | 35 | 94.6 | 17 | 48.6 | 18 | 51.4 | 28 | 80.0 | 7 | 20.0 | 37 |
| known | 50 | 500 | 0 | 0.0 | 37 | 100.0 | 24 | 64.9 | 13 | 35.1 | 22 | 59.5 | 15 | 40.5 | 37 |
| known | 50 | 1000 | 4 | 10.8 | 33 | 89.2 | 22 | 66.7 | 11 | 33.3 | 25 | 75.8 | 8 | 24.2 | 37 |
| known | 50 | 1500 | 9 | 24.3 | 28 | 75.7 | 21 | 75.0 | 7 | 25.0 | 25 | 89.3 | 3 | 10.7 | 37 |
| known | 100 | 500 | 2 | 5.4 | 35 | 94.6 | 22 | 62.9 | 13 | 37.1 | 16 | 45.7 | 19 | 54.3 | 37 |
| known | 100 | 1000 | 3 | 8.1 | 34 | 91.9 | 24 | 70.6 | 10 | 29.4 | 18 | 52.9 | 16 | 47.1 | 37 |
| known | 100 | 1500 | 9 | 24.3 | 28 | 75.7 | 16 | 57.1 | 12 | 42.9 | 18 | 64.3 | 10 | 35.7 | 37 |
| known | 150 | 500 | 1 | 2.7 | 36 | 97.3 | 29 | 80.6 | 7 | 19.4 | 20 | 55.6 | 16 | 44.4 | 37 |
| known | 150 | 1000 | 2 | 5.4 | 35 | 94.6 | 23 | 65.7 | 12 | 34.3 | 19 | 54.3 | 16 | 45.7 | 37 |
| known | 150 | 1500 | 10 | 27.0 | 27 | 73.0 | 14 | 51.9 | 13 | 48.1 | 18 | 66.7 | 9 | 33.3 | 37 |
| Factors | Mean Speed (m/s) | Max Long Acc (m/s2) | Max Long Dec (m/s2) | Max Lateral Acc (m/s2) | Percentage of Following Times (%) | |||||||
|---|---|---|---|---|---|---|---|---|---|---|---|---|
| Traffic Flow | IDCTS | Law | Mean | S.D. | Mean | S.D. | Mean | S.D. | Mean | S.D. | Mean | S.D. |
| 500 (pcu/h) | 50 (m) | unknown | 13.46 1 | 1.97 | 2.62 | 1.43 | 2.00 | 1.97 | 2.04 | 1.70 | 0.11 | 0.17 |
| known | 13.45 1 | 2.18 | 3.29 | 0.78 | 4.73 | 3.63 | 1.61 | 2.06 | 0.24 | 0.31 | ||
| 100 (m) | unknown | 15.02 1 | 1.81 | 2.74 | 1.45 | 2.49 | 2.49 | 1.60 | 1.48 | 0.63 | 0.23 | |
| known | 14.45 1 | 1.57 | 3.30 | 0.92 | 4.79 | 3.39 | 1.61 | 1.50 | 0.61 | 0.23 | ||
| 150 (m) | unknown | 15.27 1 | 2.36 | 2.71 | 1.47 | 1.94 | 1.86 | 1.78 | 1.81 | 0.68 | 0.22 | |
| known | 14.54 1 | 2.50 | 3.70 | 0.50 | 5.02 | 3.45 | 0.83 | 0.85 | 0.55 | 0.23 | ||
| 1000 (pcu/h) | 50 (m) | unknown | 14.05 1 | 2.09 | 2.52 | 1.45 | 2.14 | 2.49 | 1.45 | 1.07 | 0.57 | 0.25 |
| known | 13.82 1 | 2.13 | 3.14 | 1.35 | 4.25 | 3.32 | 2.65 | 2.61 | 0.46 | 0.23 | ||
| 100 (m) | unknown | 13.90 1 | 1.81 | 2.79 | 1.50 | 2.30 | 2.44 | 2.18 | 2.49 | 0.50 | 0.25 | |
| known | 13.01 1 | 2.16 | 4.11 | 0.31 | 5.16 | 3.24 | 2.82 | 3.34 | 0.55 | 0.25 | ||
| 150 (m) | unknown | 14.20 1 | 2.76 | 2.85 | 1.42 | 2.86 | 2.73 | 1.84 | 1.87 | 0.56 | 0.25 | |
| known | 14.13 1 | 2.65 | 3.02 | 1.26 | 4.95 | 3.34 | 1.31 | 1.18 | 0.54 | 0.22 | ||
| 1500 (pcu/h) | 50 (m) | unknown | 13.43 1 | 1.91 | 2.66 | 1.30 | 2.63 | 2.54 | 2.43 | 2.39 | 0.47 | 0.27 |
| known | 12.78 1 | 2.83 | 3.71 | 0.58 | 4.79 | 3.57 | 1.22 | 1.25 | 0.50 | 0.24 | ||
| 100 (m) | unknown | 13.71 1 | 2.15 | 4.00 | 0.46 | 3.32 | 3.20 | 2.02 | 1.68 | 0.44 | 0.23 | |
| known | 13.91 1 | 2.16 | 3.79 | 0.56 | 5.31 | 3.41 | 1.39 | 1.31 | 0.42 | 0.19 | ||
| 150 (m) | unknown | 14.03 1 | 2.33 | 3.63 | 0.62 | 3.62 | 2.86 | 1.11 | 0.81 | 0.58 | 0.21 | |
| known | 13.46 1 | 2.91 | 3.01 | 1.36 | 5.36 | 3.04 | 0.96 | 0.85 | 0.43 | 0.22 | ||
| Factors | B | S.E. | Wald | df | Sig. | Exp (B) | 95% C.I. for EXP (B) | |
|---|---|---|---|---|---|---|---|---|
| Lower | Upper | |||||||
| Stop/Go decision | ||||||||
| Law (reference level: unknown) | ||||||||
| known | −2.500 | 0.536 | 21.788 | 1 | 0.000 | 0.82 | 0.029 | 0.235 |
| IDCTS (reference level: 50 m) | 22.957 | 2 | 0.000 | |||||
| 100 m | −2.242 | 0.549 | 16.681 | 1 | 0.000 | 0.106 | 0.036 | 0.312 |
| 150 m | −1.277 | 0.389 | 10.762 | 1 | 0.001 | 0.279 | 0.130 | 0.598 |
| Constant | −1.129 | 0.217 | 27.070 | 1 | 0.000 | 0.323 | ||
| Acc/Dec state | ||||||||
| Law (reference level: unknown) | ||||||||
| known | −0.609 | 0.166 | 13.480 | 1 | 0.000 | 0.544 | 0.393 | 0.753 |
| Stop/Go bus state | ||||||||
| Gender (reference level: female) | ||||||||
| male | −0.484 | 0.175 | 7.678 | 1 | 0.006 | 0.616 | 0.437 | 0.868 |
| Volume (reference level: 500 pcu/h) | 11.592 | 2 | 0.003 | |||||
| 1000 (pcu/h) | −0.304 | 0.212 | 2.064 | 1 | 0.151 | 0.738 | 0.488 | 1.117 |
| 1500 (pcu/h) | 0.405 | 0.206 | 3.869 | 1 | 0.049 | 1.499 | 1.001 | 2.243 |
| IDCTS (reference level: 50 m) | 28.247 | 2 | 0.000 | |||||
| 100 m | 1.084 | 0.219 | 24.408 | 1 | 0.000 | 2.957 | 1.924 | 4.547 |
| 150 m | 1.001 | 0.221 | 20.574 | 1 | 0.000 | 2.721 | 1.766 | 4.194 |
| Constant | −0.995 | 0.220 | 20.550 | 1 | 0.000 | 0.370 | ||
| Factors | df | F | Sig. | η2 | |
|---|---|---|---|---|---|
| Mean Speed (m/s) | Law | 1 | 5.887 | 0.016 | 0.009 |
| Volume | 2 | 8.179 | 0.000 | 0.025 | |
| IDCTS | 2 | 5.868 | 0.003 | 0.018 | |
| Law * Volume | 2 | 0.011 | 0.990 | 0.000 | |
| Law * IDCTS | 2 | 0.192 | 0.825 | 0.001 | |
| Volume * IDCTS | 4 | 3.434 | 0.009 | 0.021 | |
| Law * Volume * IDCTS | 4 | 1.107 | 0.352 | 0.007 | |
| Max Long Acc (m/s2) | Law | 1 | 33.532 | 0.000 | 0.049 |
| Volume | 2 | 9.360 | 0.000 | 0.028 | |
| IDCTS | 2 | 9.813 | 0.000 | 0.029 | |
| Law * Volume | 2 | 6.128 | 0.002 | 0.019 | |
| Law * IDCTS | 2 | 4.035 | 0.018 | 0.012 | |
| Volume * IDCTS | 4 | 2.993 | 0.018 | 0.018 | |
| Law * Volume * IDCTS | 4 | 6.394 | 0.000 | 0.038 | |
| Max Long Dec (m/s2) | Law | 1 | 98.030 | 0.000 | 0.131 |
| Volume | 2 | 3.743 | 0.024 | 0.011 | |
| Distance | 2 | 2.738 | 0.065 | 0.008 | |
| Law * Volume | 2 | 0.717 | 0.489 | 0.002 | |
| Law * IDCTS | 2 | 0.039 | 0.962 | 0.000 | |
| Volume * IDCTS | 4 | 0.459 | 0.766 | 0.003 | |
| Law * Volume * IDCTS | 4 | 0.402 | 0.807 | 0.002 | |
| Max Lateral Acc (m/s2) | Law | 1 | 0.216 | 0.643 | 0.000 |
| Volume | 2 | 2.550 | 0.079 | 0.009 | |
| IDCTS | 2 | 10.992 | 0.000 | 0.038 | |
| Law * Volume | 2 | 6.878 | 0.001 | 0.024 | |
| Law * IDCTS | 2 | 2.157 | 0.117 | 0.008 | |
| Volume * IDCTS | 4 | 0.421 | 0.793 | 0.003 | |
| Law * Volume * IDCTS | 4 | 3.249 | 0.012 | 0.023 | |
| Percentage of Following Times (%) | law | 1 | 5.070 | 0.025 | 0.009 |
| Volume | 2 | 15.864 | 0.000 | 0.054 | |
| IDCTS | 2 | 1.010 | 0.365 | 0.004 | |
| Law * Volume | 2 | 0.150 | 0.861 | 0.001 | |
| Law * IDCTS | 2 | 2.480 | 0.085 | 0.009 | |
| Volume * IDCTS | 4 | 0.610 | 0.655 | 0.004 | |
| Law * Volume * IDCTS | 4 | 1.539 | 0.190 | 0.011 | |
| Factors | Mean Difference | Std. Error | Sig. |
|---|---|---|---|
| Mean Speed (m/s) | |||
| IDCTS 100 m (Volume 500 pcu/h) and IDCTS 100 m (Volume 1000 pcu/h) | 1.277 * | 0.373 | 0.002 |
| IDCTS 150 m (Volume 500 pcu/h) and IDCTS 100 m (Volume 1500 pcu/h) | 1.321 * | 0.373 | 0.001 |
| Volume 500 pcu/h (IDCTS 50 m) and Volume 500 pcu/h (IDCTS 100 m) | −1.275 * | 0.373 | 0.002 |
| Volume 500 pcu/h (IDCTS 50 m) and Volume 500 pcu/h (IDCTS 150 m) | −1.447 * | 0.373 | 0.000 |
| Max Long Acc (m/s2) | |||
| Know law and IDCTS 100 m (Volume 500 pcu/h) and IDCTS 100 m (Volume 1000 pcu/h) | −0.809 * | 0.261 | 0.006 |
| Know law and Volume 1000 pcu/h (IDCTS 50 m) and Volume 1000 pcu/h (IDCTS 100 m) | −0.967 * | 0.216 | 0.001 |
| Know law and Volume 1000 pcu/h (IDCTS 100 m) and Volume 1000 pcu/h (IDCTS 150 m) | 1.090 * | 0.216 | 0.000 |
| Know law and Volume 1500 pcu/h (IDCTS 100 m) and Volume 1500 pcu/h (IDCTS 150 m) | 0.781 * | 0.261 | 0.009 |
| Max Lateral Acc (m/s2) | |||
| Know law and IDCTS 50 m (Volume 500 pcu/h) and IDCTS 50 m (Volume 1000 pcu/h) | −0.327 | 0.150 | 0.090 |
| Know law and IDCTS 50 m (Volume 1000 pcu/h) and IDCTS 50 m (Volume 1500 pcu/h) | 0.474 * | 0.152 | 0.006 |
| Know law and Volume 1000 pcu/h (IDCTS 50 m) and Volume 1000 pcu/h (IDCTS 150 m) | 0.483 * | 0.145 | 0.003 |
| Know law and Volume 1000 pcu/h (IDCTS 100 m) and Volume 1000 pcu/h (IDCTS 150 m) | −0.509 * | 0.148 | 0.002 |
Publisher’s Note: MDPI stays neutral with regard to jurisdictional claims in published maps and institutional affiliations. |
© 2021 by the authors. Licensee MDPI, Basel, Switzerland. This article is an open access article distributed under the terms and conditions of the Creative Commons Attribution (CC BY) license (https://creativecommons.org/licenses/by/4.0/).
Share and Cite
Chen, Y.; Guo, Y.; Gu, X.; Zhou, Y.; Tong, Y.; Cao, B. Investigating the Effect of School Bus Stopping Process on Driver Behavior of Surrounding Vehicles Based on a Driving Simulator Experiment. Int. J. Environ. Res. Public Health 2021, 18, 12538. https://doi.org/10.3390/ijerph182312538
Chen Y, Guo Y, Gu X, Zhou Y, Tong Y, Cao B. Investigating the Effect of School Bus Stopping Process on Driver Behavior of Surrounding Vehicles Based on a Driving Simulator Experiment. International Journal of Environmental Research and Public Health. 2021; 18(23):12538. https://doi.org/10.3390/ijerph182312538
Chicago/Turabian StyleChen, Yanyan, Yinjia Guo, Xin Gu, Yuntong Zhou, Yao Tong, and Bingxin Cao. 2021. "Investigating the Effect of School Bus Stopping Process on Driver Behavior of Surrounding Vehicles Based on a Driving Simulator Experiment" International Journal of Environmental Research and Public Health 18, no. 23: 12538. https://doi.org/10.3390/ijerph182312538
APA StyleChen, Y., Guo, Y., Gu, X., Zhou, Y., Tong, Y., & Cao, B. (2021). Investigating the Effect of School Bus Stopping Process on Driver Behavior of Surrounding Vehicles Based on a Driving Simulator Experiment. International Journal of Environmental Research and Public Health, 18(23), 12538. https://doi.org/10.3390/ijerph182312538