
Understanding Loneliness in Adolescence: A Test of Competing Hypotheses on the Interplay of Extraversion and Neuroticism


Abstract
1. Introduction
1.1. Personality and Loneliness in Adolescence
1.2. Going beyond Linear Main Effects of Extraversion and Neuroticism
1.2.1. Monotonous but Non-Linear Effects of Extraversion and Neuroticism
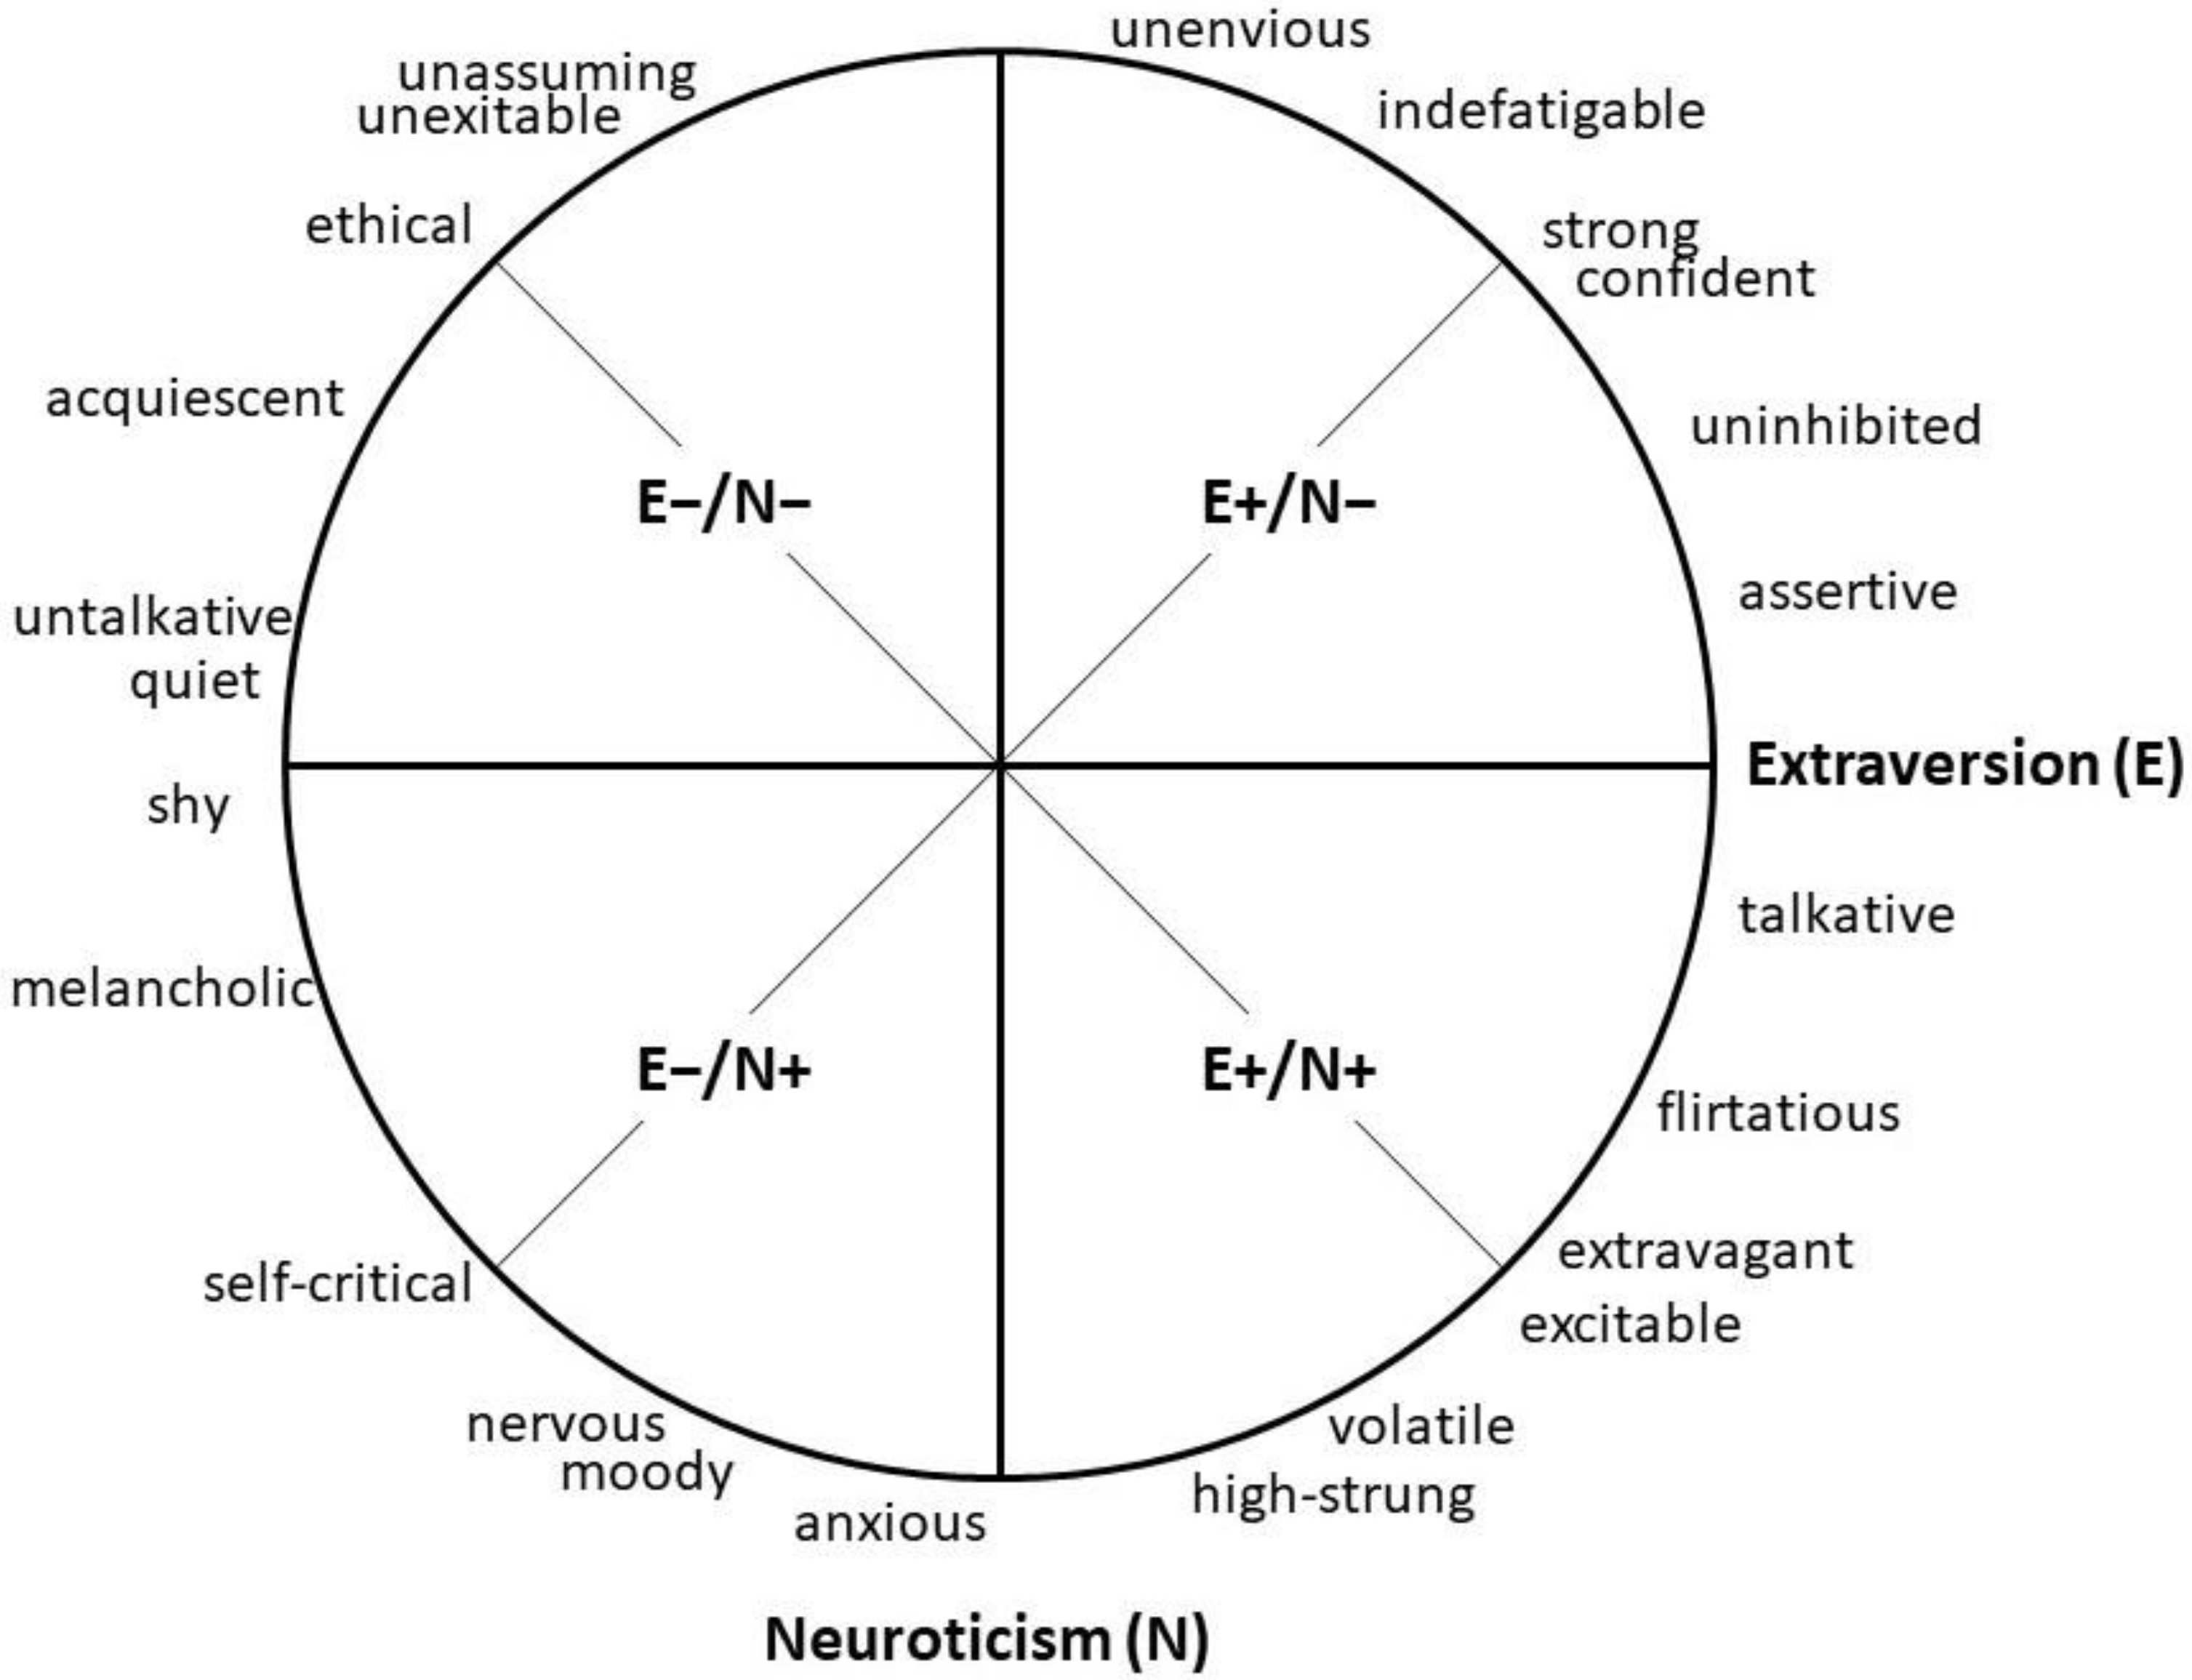
1.2.2. Interaction Effects between Extraversion and Neuroticism
1.3. The Current Study
2. Method
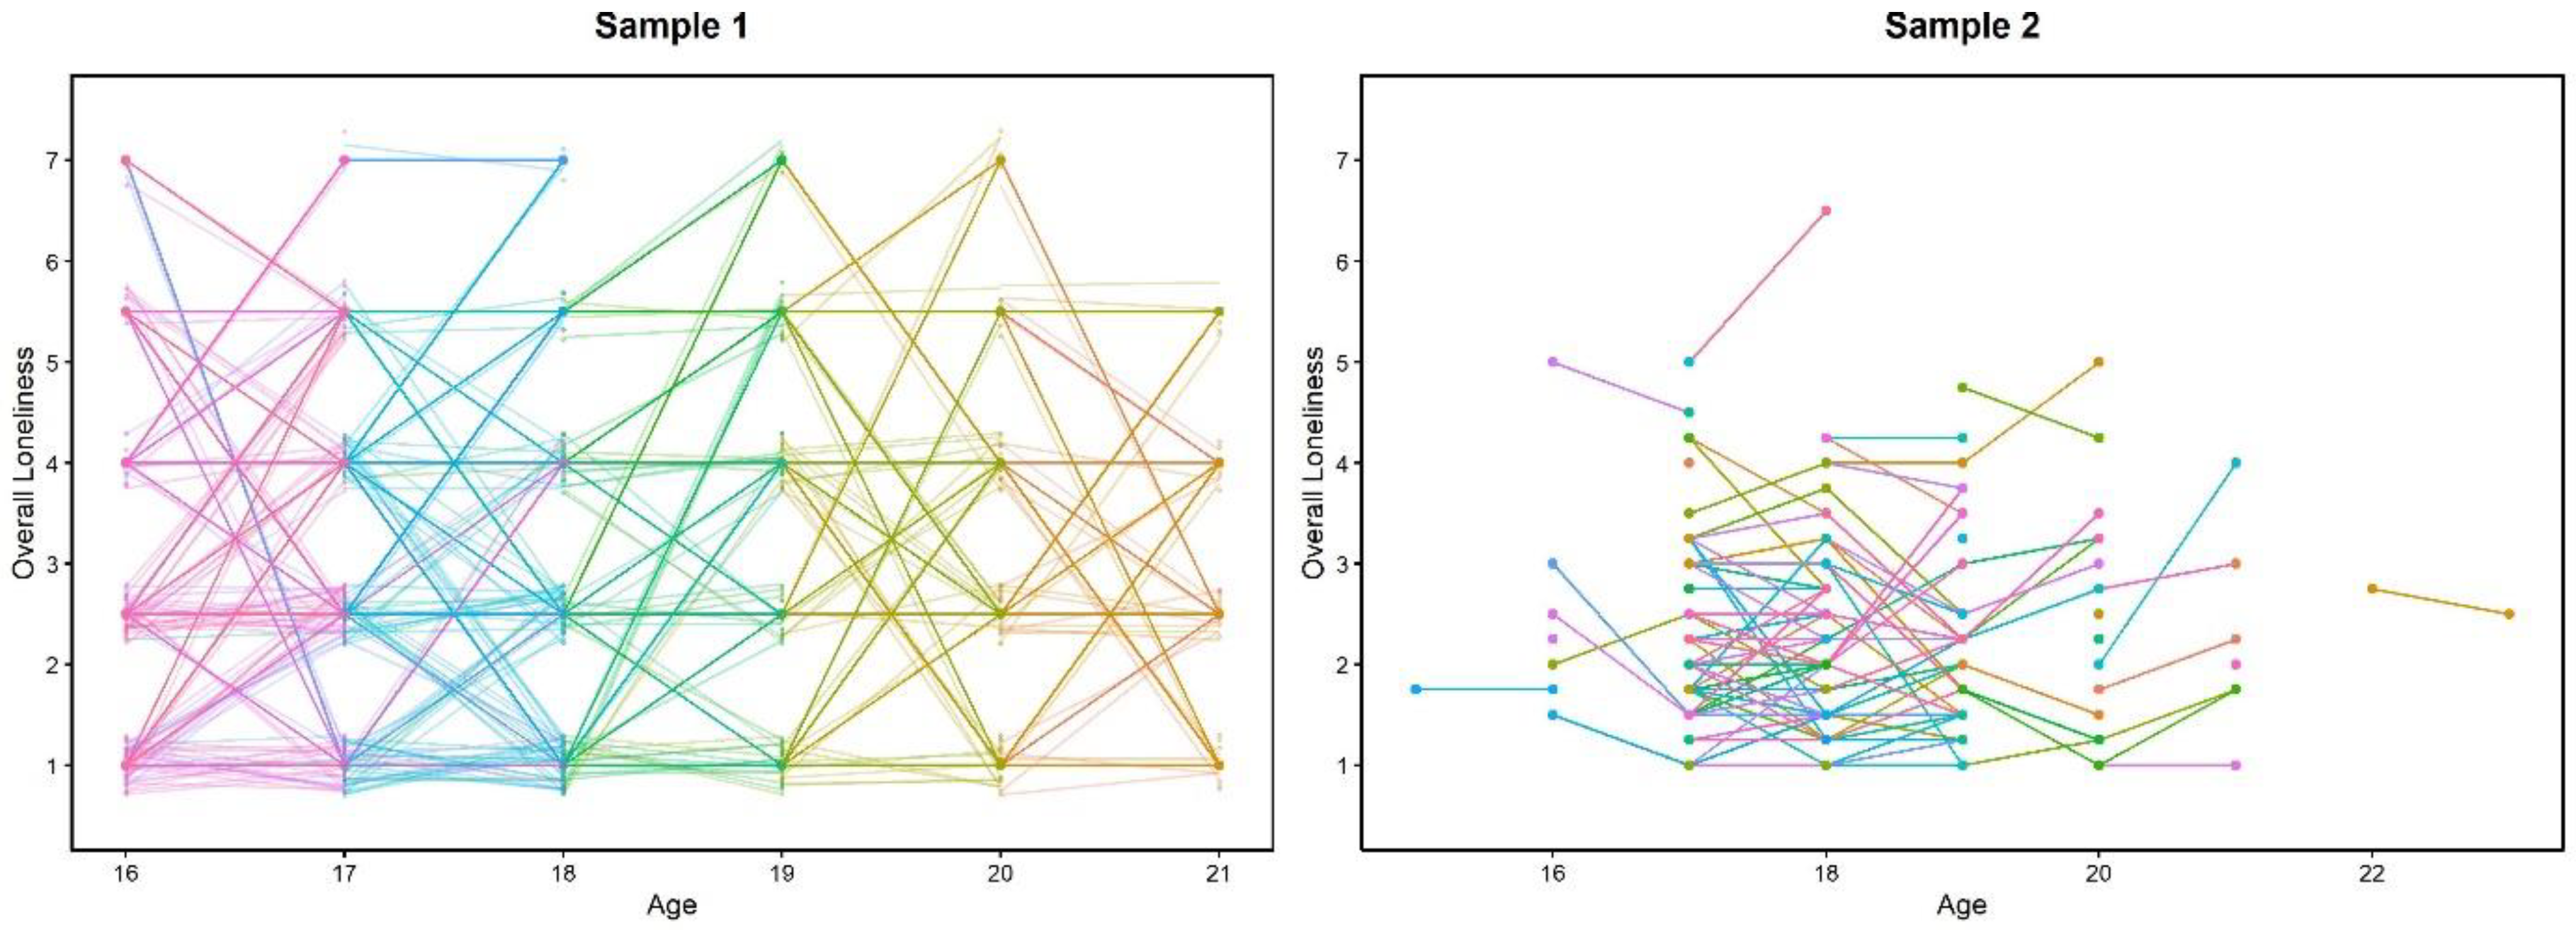
2.1. Participants
2.2. Procedure and Measures
2.2.1. Personality Traits
2.2.2. Loneliness
2.3. Data Analysis
2.3.1. Extension of the Initial Model Set
2.3.2. Test of Competing Hypotheses
3. Results
3.1. Descriptive Statistics
3.2. Predicting Loneliness from the Interplay of Extraversion and Neuroticism: Model Comparison Analyses
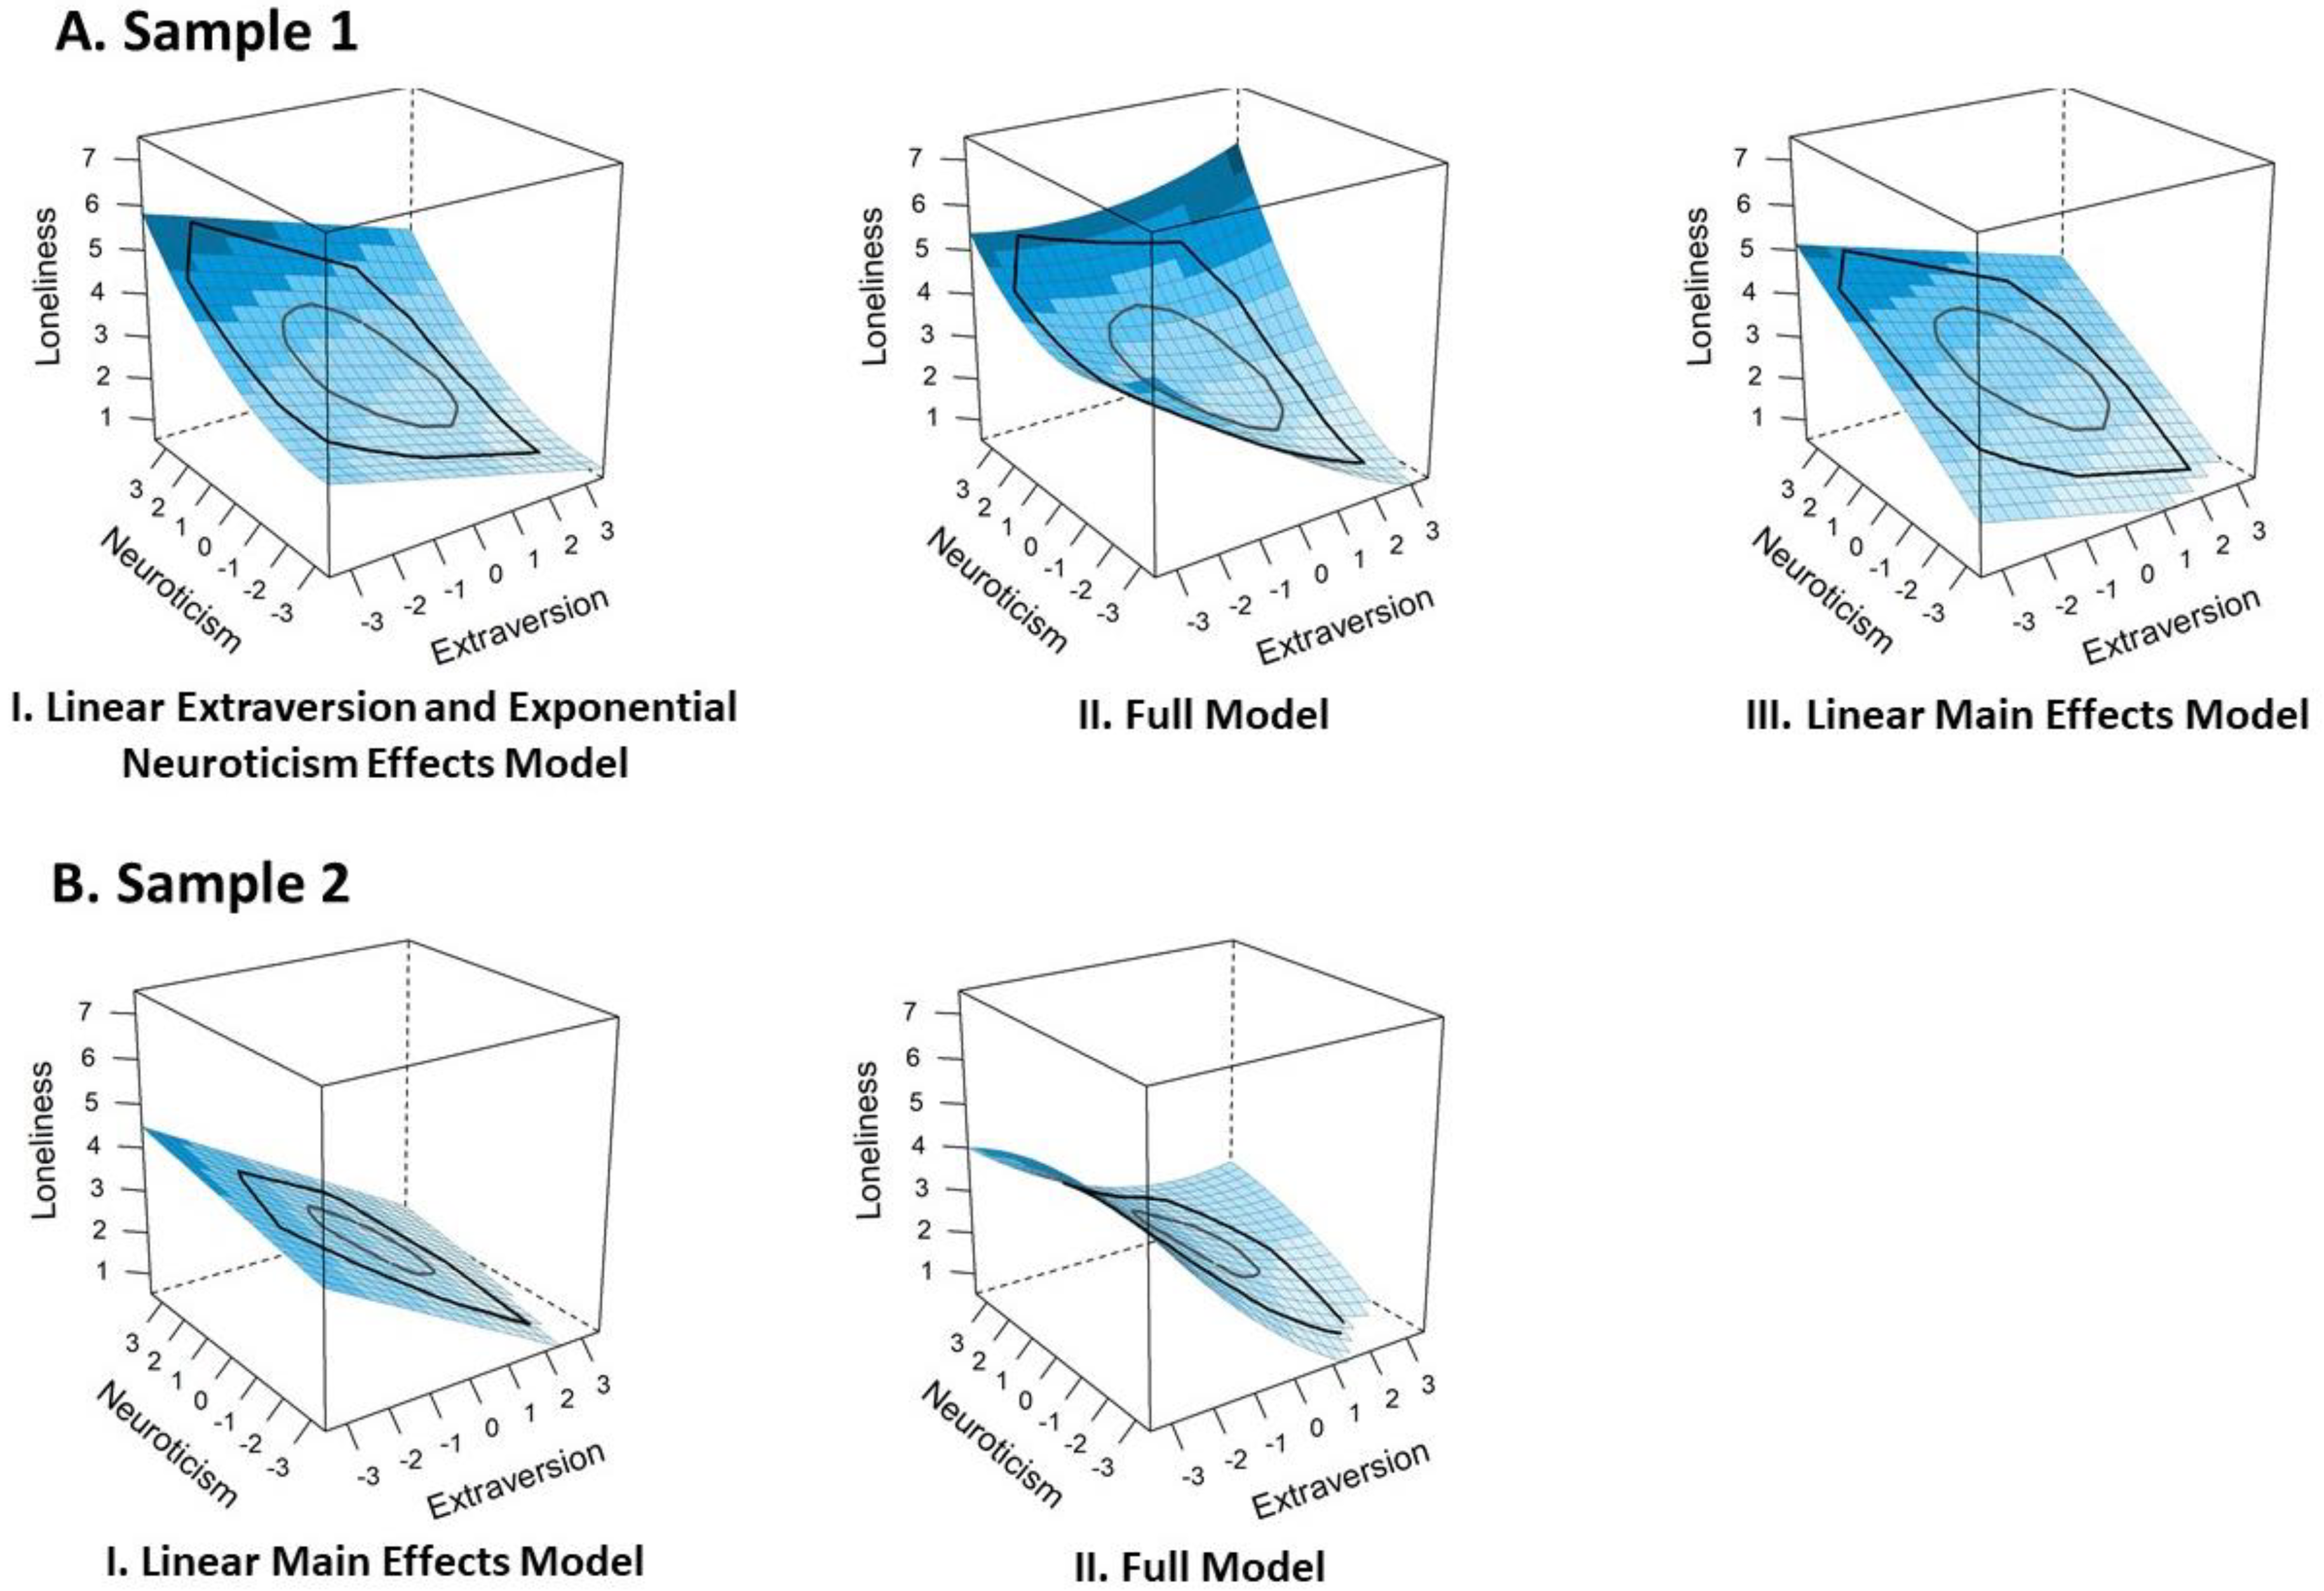
3.2.1. Cross-Sectional Analyses
Overall Loneliness
Emotional and Social Loneliness
Summary of Cross-Sectional Results
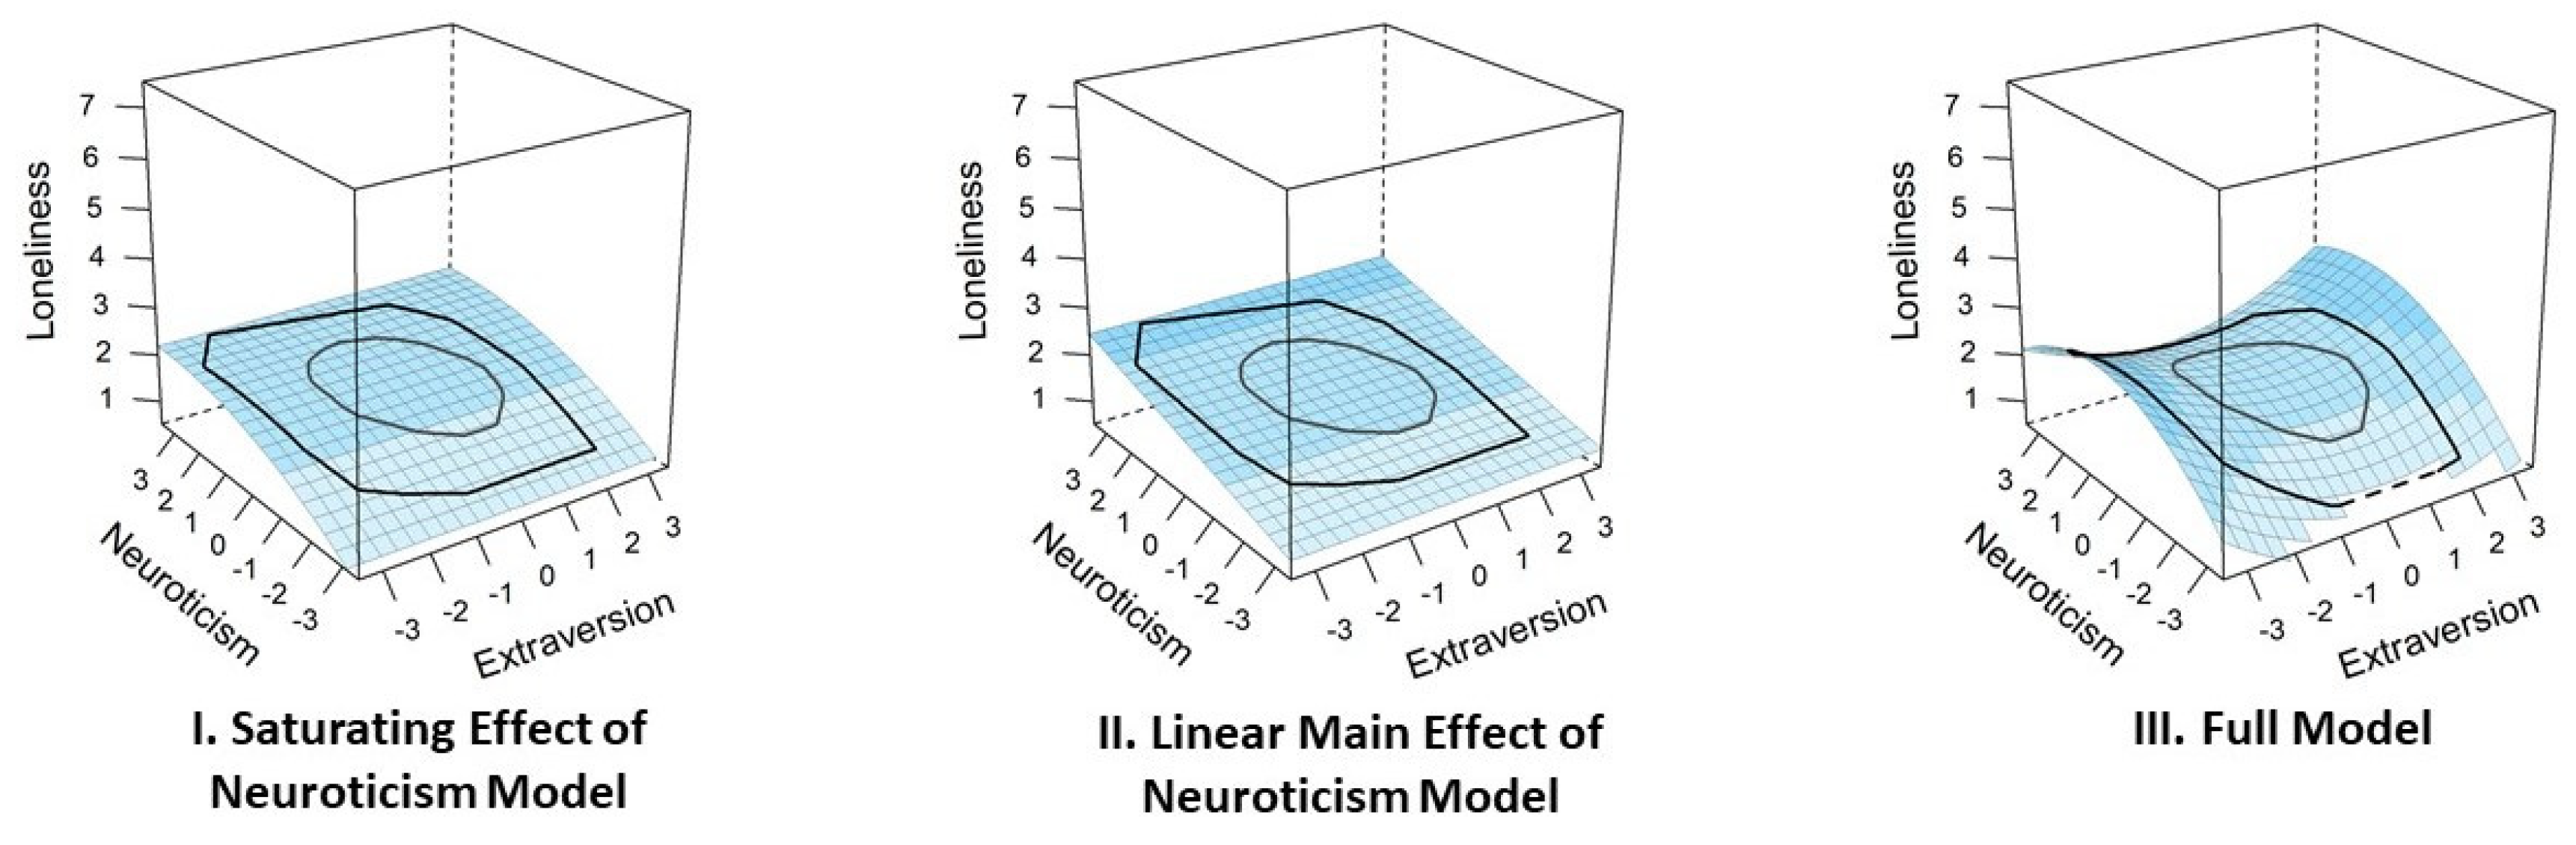
3.2.2. Longitudinal Analyses
4. Discussion
4.1. The Distinct Roles of Extraversion and Neuroticism
4.2. There Is More: Tentative Support for Non-Linear and Interaction Effects
4.2.1. Stronger Effects at One End of the Scale: Saturating Extraversion and Exponential Neuroticism Effects
4.2.2. Mutual Dependence: Positive Interactions between Extraversion and Neuroticism
4.3. Implications for Adolescent Development
4.4. Limitations
5. Conclusions
Author Contributions
Funding
Institutional Review Board Statement
Informed Consent Statement
Data Availability Statement
Conflicts of Interest
Appendix A

| Nr. | Hypothesis | Model Name: Corresponding Model Constraints Imposed on the Coefficients of the Full Second−Order Polynomial Model Ln = b0 + b1En + b2Nn + b3En2 + b4EnNn + b5Nn2 | Figure |
|---|---|---|---|
| 1 | Null Model: b1= b2 = b3 = b4 = b5 = 0 | ||
| 2 | Full Model: No constraints | ||
| Linear main effects | |||
| 3 | Lower extraversion and higher neuroticism are linearly related to higher loneliness | Linear Main Effects Model: b1 < 0, b2 > 0,b3 = b4 = b5 = 0 | 2a |
| 4 | Lower extraversion is linearly related to higher loneliness; no effect of neuroticism | Linear Main Effect of Extraversion Model: b1 < 0, b2 = b3 = b4 = b5 = 0 | |
| 5 | Higher neuroticism is linearly related to higher loneliness; no effect of extraversion | Linear Main Effect of Neuroticism Model: b2 > 0, b1 = b3 = b4 = b5 = 0 | |
| Monotonous but non−linear models | |||
| 6 | Higher extraversion relates to lower loneliness and this saturates; no effect of neuroticism | Saturating Effect of Extraversion Model: b3 > 0, −b1 > 2b3Emax, b2 = b4 = b5 = 0 | |
| 7 | Higher extraversion relates to lower loneliness and this effect is exponential; no effect of neuroticism | Exponential Effect of Extraversion Model: b3 < 0, −b1 > 2b3Emin, b2 = b4 = b5 = 0 | |
| 8 | Higher neuroticism relates to higher loneliness and this effect is exponential; no effect of extraversion | Exponential Effect of Neuroticism Model: b5 > 0, −b2 < 2b5Nmin, b1 = b3 = b4 = 0 | |
| 9 | Higher neuroticism relates to higher loneliness and this effect saturates; no effect of extraversion | Saturating Effect of Neuroticism Model: b5 < 0, −b2 < 2b5Nmax, b1 = b3 = b4 = 0 | |
| 10 | Lower extraversion and higher neuroticism are monotonously related to higher loneliness and the effect of extraversion saturates. | Saturating Extraversion and Linear Neuroticism Effects Model: b2 > 0, b3 > 0, −b1 > 2b3Emax,b4 = b5 = 0 | 2b |
| 11 | Lower extraversion and higher neuroticism are monotonously related to higher loneliness and the effect of extraversion is exponential. | Exponential Extraversion and Linear Neuroticism Effects Model: b2 > 0, b3 < 0, −b1 > 2b3Emin, b4 = b5 = 0 | |
| 12 | Lower extraversion and higher neuroticism are monotonously related to higher loneliness and the effect of neuroticism is exponential. | Linear Extraversion and Exponential Neuroticism Effects Model: b1 < 0, b5 > 0, −b2 < 2b5Nmin,b3 = b4 = 0 | 2c |
| 13 | Lower extraversion and higher neuroticism are monotonously related to higher loneliness and the effect of neuroticism saturates. | Linear Extraversion and Saturating Neuroticism Effects Model: b1 < 0, b5 < 0, −b2 < 2b5Nmax, b3 = b4 = 0 | |
| 14 | Lower extraversion and higher neuroticism are monotonously related to higher loneliness and the effect of extraversion saturates while the effect of neuroticism is exponential. | Saturating Extraversion and Exponential Neuroticism Effects Model: b3 > 0, b5 > 0, −b1 > 2b3Emax, −b2 < 2b5Nmin,b4 = 0 | 2d |
| 15 | Lower extraversion and higher neuroticism are monotonously related to higher loneliness and the effect of extraversion is exponential while the effect of neuroticism saturates. | Exponential Extraversion and Saturating Neuroticism Effects Model: b3 < 0, b5 < 0, −b1 > 2b3Emin, −b2 < 2b5Nmax, b4 = 0 | |
| 16 | Lower extraversion and higher neuroticism are monotonously related to higher loneliness and the effects of both traits saturate. | Saturating Effects of Extraversion and Neuroticism Model: b3 > 0, b5 < 0, −b1 > 2b3Emax, −b2 < 2b5Nmax, b4 = 0 | |
| 17 | Lower extraversion and higher neuroticism are monotonously related to high loneliness and the effects of both traits are exponential. | Exponential Effects of Extraversion and Neuroticism Model: b3 < 0, b5 > 0, −b1 > 2b3Emin, −b2 < 2b5Nmin, b4 = 0 | |
| Linear interactions (mutual dependence) | |||
| 18 | Lower extraversion and higher neuroticism are linearly associated with higher loneliness and both effects buffer each other. | Mutual Compensation Model: b4 < 0, b1 + b4Nmin < 0, b2 + b4Emax > 0,b3 = b5 = 0 | 2e |
| 19 | Lower extraversion and higher neuroticism are linearly associated with higher loneliness and both effects reinforce each other. | Optimal Constellation Model: b4 > 0, b1 + b4Nmax < 0, b2 + b4Emin > 0,b3 = b5 = 0 | 2f |

References
- De Jong Gierveld, J.; van Tilburg, T.; Dykstra, P.A. Loneliness and social isolation. In The Cambridge Handbook of Personal Relationships; Vangelisti, A.L., Perlman, D., Eds.; Cambridge University Press: Cambridge, UK, 2018; pp. 485–500. ISBN 978-1-108-67178-1. [Google Scholar]
- Hawkley, L.C.; Cacioppo, J.T. Loneliness Matters: A Theoretical and Empirical Review of Consequences and Mechanisms. Ann. Behav. Med. 2010, 40, 218–227. [Google Scholar] [CrossRef] [PubMed]
- Holt-Lunstad, J.; Smith, T.B.; Baker, M.; Harris, T.; Stephenson, D. Loneliness and Social Isolation as Risk Factors for Mortality: A Meta-Analytic Review. Perspect. Psychol. Sci. 2015, 10, 227–237. [Google Scholar] [CrossRef]
- Erikson, E.H. Identity and the Life Cycle; International Universities Press: New York, NY, USA, 1959. [Google Scholar]
- Rubin, K.H.; Bukowski, W.M.; Parker, J.G. Peer interactions, relationships, and groups. In Handbook of Child Psychology; Damon, W., Lerner, R.M., Eisenberg, N., Eds.; John Wiley & Sons, Inc.: Hoboken, NJ, USA, 2006; Volume 3, pp. 571–645. ISBN 978-0-470-14765-8. [Google Scholar]
- Heinrich, L.M.; Gullone, E. The Clinical Significance of Loneliness: A Literature Review. Clin. Psychol. Rev. 2006, 26, 695–718. [Google Scholar] [CrossRef] [PubMed]
- Laursen, B.; Hartl, A.C. Understanding Loneliness during Adolescence: Developmental Changes That Increase the Risk of Perceived Social Isolation. J. Adolesc. 2013, 36, 1261–1268. [Google Scholar] [CrossRef] [PubMed]
- Roberts, B.W.; Walton, K.E.; Viechtbauer, W. Patterns of Mean-Level Change in Personality Traits across the Life Course: A Meta-Analysis of Longitudinal Studies. Psychol. Bull. 2006, 132, 1–25. [Google Scholar] [CrossRef]
- Buecker, S.; Maes, M.; Denissen, J.J.A.; Luhmann, M. Loneliness and the Big Five Personality Traits: A Meta-Analysis. Eur. J. Personal. 2020, 34, 8–28. [Google Scholar] [CrossRef]
- Vanhalst, J.; Klimstra, T.A.; Luyckx, K.; Scholte, R.H.J.; Engels, R.C.M.E.; Goossens, L. The Interplay of Loneliness and Depressive Symptoms across Adolescence: Exploring the Role of Personality Traits. J. Youth Adolesc. 2012, 41, 776–787. [Google Scholar] [CrossRef]
- Hotard, S.R.; McFatter, R.M.; McWhirter, R.M.; Stegall, M.E. Interactive Effects of Extraversion, Neuroticism, and Social Relationships on Subjective Well-Being. J. Pers. Soc. Psychol. 1989, 57, 321–331. [Google Scholar] [CrossRef]
- Burnham, K.P.; Anderson, D.R. Model Selection and Multimodel Inference: A Practical Information-Theoretic Approach, 2nd ed.; Springer: New York, NY, USA, 2002; ISBN 978-0-387-95364-9. [Google Scholar]
- Humberg, S.; Dufner, M.; Schönbrodt, F.D.; Geukes, K.; Hutteman, R.; Küfner, A.C.P.; van Zalk, M.H.W.; Denissen, J.J.A.; Nestler, S.; Back, M.D. Is Accurate, Positive, or Inflated Self-Perception Most Advantageous for Psychological Adjustment? A Competitive Test of Key Hypotheses. J. Pers. Soc. Psychol. 2019, 116, 835–859. [Google Scholar] [CrossRef]
- Weiss, R.S. Loneliness: The Experience of Emotional and Social Isolation; Loneliness: The experience of emotional and social isolation; The MIT Press: Cambridge, MA, USA, 1973; pp. xxii, 236. [Google Scholar]
- Hofstee, W.K.; de Raad, B.; Goldberg, L.R. Integration of the Big Five and Circumplex Approaches to Trait Structure. J. Pers. Soc. Psychol. 1992, 63, 146–163. [Google Scholar] [CrossRef]
- Soto, C.J.; John, O.P. The next Big Five Inventory (BFI-2): Developing and Assessing a Hierarchical Model with 15 Facets to Enhance Bandwidth, Fidelity, and Predictive Power. J. Pers. Soc. Psychol. 2017, 113, 117–143. [Google Scholar] [CrossRef]
- Wagner, J.; Lüdtke, O.; Roberts, B.W.; Trautwein, U. Who Belongs to Me? Social Relationship and Personality Characteristics in the Transition to Young Adulthood. Eur. J. Personal. 2014, 28, 586–603. [Google Scholar] [CrossRef]
- Wieczorek, L.L.; Mueller, S.; Lüdtke, O.; Wagner, J. What Makes for a Pleasant Social Experience in Adolescence? The Role of Perceived Social Interaction Behavior in Associations between Personality Traits and Momentary Social Satisfaction. Eur. J. Personal. 2021, 1–22. [Google Scholar] [CrossRef]
- Asendorpf, J.B.; Aken, M.A.G.V. Personality–Relationship Transaction in Adolescence: Core versus Surface Personality Characteristics. J. Pers. 2003, 71, 629–666. [Google Scholar] [CrossRef]
- Van der Linden, D.; Scholte, R.H.J.; Cillessen, A.H.N.; Nijenhuis, J.; te Segers, E. Classroom Ratings of Likeability and Popularity Are Related to the Big Five and the General Factor of Personality. J. Res. Personal. 2010, 44, 669–672. [Google Scholar] [CrossRef]
- Deventer, J.; Wagner, J.; Lüdtke, O.; Trautwein, U. Are Personality Traits and Relationship Characteristics Reciprocally Related? Longitudinal Analyses of Codevelopment in the Transition out of High School and Beyond. J. Pers. Soc. Psychol. 2019, 116, 331–347. [Google Scholar] [CrossRef]
- Parker, P.D.; Lüdtke, O.; Trautwein, U.; Roberts, B.W. Personality and Relationship Quality during the Transition from High School to Early Adulthood. J. Pers. 2012, 80, 1061–1089. [Google Scholar] [CrossRef]
- Vanhalst, J.; Goossens, L.; Luyckx, K.; Scholte, R.H.J.; Engels, R.C.M.E. The Development of Loneliness from Mid- to Late Adolescence: Trajectory Classes, Personality Traits, and Psychosocial Functioning. J. Adolesc. 2013, 36, 1305–1312. [Google Scholar] [CrossRef] [PubMed]
- Russell, D.; Cutrona, C.E.; Rose, J.; Yurko, K. Social and Emotional Loneliness: An Examination of Weiss’s Typology of Loneliness. J. Pers. Soc. Psychol. 1984, 46, 1313–1321. [Google Scholar] [CrossRef] [PubMed]
- Von Soest, T.; Luhmann, M.; Gerstorf, D. The Development of Loneliness through Adolescence and Young Adulthood: Its Nature, Correlates, and Midlife Outcomes. Dev. Psychol. 2020, 56, 1919–1934. [Google Scholar] [CrossRef] [PubMed]
- Schermer, J.A.; Martin, N.G. A Behavior Genetic Analysis of Personality and Loneliness. J. Res. Personal. 2019, 78, 133–137. [Google Scholar] [CrossRef]
- Mund, M.; Neyer, F.J. The Winding Paths of the Lonesome Cowboy: Evidence for Mutual Influences between Personality, Subjective Health, and Loneliness. J. Pers. 2016, 84, 646–657. [Google Scholar] [CrossRef]
- Eysenck, H.J.; Eysenck, M.W. Personality and Individual Differences; Plenum: New York, NY, USA, 1985. [Google Scholar]
- Wiggins, J.S. Circumplex models of interpersonal behavior. In Review of Personality and Social Psychology; Wheeler, L., Ed.; Sage: Beverly Hills, CA, USA, 1980; Volume 1, pp. 265–294. [Google Scholar]
- Cheng, H.; Furnham, A. Personality, Peer Relations, and Self-Confidence as Predictors of Happiness and Loneliness. J. Adolesc. 2002, 25, 327–339. [Google Scholar] [CrossRef]
- Teppers, E.; Klimstra, T.A.; Damme, C.V.; Luyckx, K.; Vanhalst, J.; Goossens, L. Personality Traits, Loneliness, and Attitudes toward Aloneness in Adolescence. J. Soc. Pers. Relatsh. 2013, 30, 1045–1063. [Google Scholar] [CrossRef]
- Lynn, M.; Steel, P. National Differences in Subjective Well-Being: The Interactive Effects of Extraversion and Neuroticism. J. Happiness Stud. 2006, 7, 155–165. [Google Scholar] [CrossRef][Green Version]
- Morris, M.B.; Burns, G.N.; Periard, D.A.; Shoda, E.A. Extraversion–Emotional Stability Circumplex Traits and Subjective Well-Being. J. Happiness Stud. 2015, 16, 1509–1523. [Google Scholar] [CrossRef]
- Judge, T.A.; Erez, A. Interaction and Intersection: The Constellation of Emotional Stability and Extraversion in Predicting Performance. Pers. Psychol. 2007, 60, 573–596. [Google Scholar] [CrossRef]
- Center for Open Science Open Science Framework (OSF). Available online: https://osf.io/ (accessed on 23 September 2021).
- Brüderl, J.; Frister, R.; Hajek, K.; Herzig, M.; Lenke, R.; Schütze, P.; Schumann, N. Pairfam Data Manual, Release 11.0; Technical Report; LMU Munich: Munich, Germany, 2020. [Google Scholar]
- Huinink, J.; Brüderl, J.; Nauck, B.; Walper, S.; Castiglioni, L.; Feldhaus, M. Panel Analysis of Intimate Relationships and Family Dynamics (pairfam): Conceptual framework and design. ZfF—Z. Für Fam. J. Fam. Res. 2011, 23, 77–101. [Google Scholar] [CrossRef]
- Wagner, J.; Mueller, S.; Wieczorek, L.L. SELFIE—Personality and Self-Esteem in Everyday Life. Available online: osf.io/4gnz9 (accessed on 23 September 2021).
- R Core Team. R: A Language and Environment for Statistical Computing; R Foundation for Statistical Computing: Vienna, Austria, 2021. [Google Scholar]
- Rammstedt, B.; John, O.P. Kurzversion des Big Five Inventory (BFI-K). Diagnostica 2005, 51, 195–206. [Google Scholar] [CrossRef]
- Danner, D.; Rammstedt, B.; Bluemke, M.; Lechner, C.; Berres, S.; Knopf, T.; Soto, C.J.; John, O.P. Das Big Five Inventar 2: Validierung Eines Persönlichkeitsinventars Zur Erfassung von 5 Persönlichkeitsdomänen und 15 Facetten. Diagnostica 2019, 65, 121–132. [Google Scholar] [CrossRef]
- Russell, D.; Peplau, L.A.; Cutrona, C.E. The Revised UCLA Loneliness Scale: Concurrent and Discriminant Validity Evidence. J. Pers. Soc. Psychol. 1980, 39, 472–480. [Google Scholar] [CrossRef]
- Hawkley, L.C.; Browne, M.W.; Cacioppo, J.T. How Can I Connect with Thee? Let Me Count the Ways. Psychol. Sci. 2005, 16, 798–804. [Google Scholar] [CrossRef]
- Akaike, H. Information theory and an extension of the maximum likelihood principle. In Second International Symposium on Information Theory; Petrov, B.N., Csaki, F., Eds.; Akademiai Kiado: Budapest, Hungary, 1973; pp. 267–281. [Google Scholar]
- Hurvich, C.M.; Tsai, C.-L. Regression and Time Series Model Selection in Small Samples. Biometrika 1989, 76, 297–307. [Google Scholar] [CrossRef]
- Sugiura, N. Further Analysts of the Data by Akaike’ s Information Criterion and the Finite Corrections. Commun. Stat. Theory Methods 1978, 7, 13–26. [Google Scholar] [CrossRef]
- Edwards, J.R. Alternatives to difference scores: Polynomial regression analysis and response surface methodology. In Measuring and Analyzing Behavior in Organizations: Advances in Measurement and Data Analysis; Drasgow, F., Schmitt, N., Eds.; Jossey-Bass: San Francisco, CA, USA, 2002; pp. 350–400. ISBN 978-0-7879-5301-0. [Google Scholar]
- Fox, J. Applied Regression Analysis and Generalized Linear Models, 3rd ed.; Sage: Thousand Oaks, CA, USA, 2016; ISBN 978-1-4833-1088-6. [Google Scholar]
- Dochtermann, N.A.; Jenkins, S.H. Developing Multiple Hypotheses in Behavioral Ecology. Behav. Ecol. Sociobiol. 2011, 65, 37–45. [Google Scholar] [CrossRef]
- Little, T.D. Longitudinal Structural Equation Modeling; The Guilford Press: New York, NY, USA, 2013; ISBN 978-1-4625-1027-6. [Google Scholar]
- RStudio Team. RStudio: Integrated Development Environment for R; RStudio, PBC: Boston, MA, USA, 2021. [Google Scholar]
- Rosseel, Y. Lavaan: An R Package for Structural Equation Modeling. J. Stat. Softw. 2012, 48, 1–36. [Google Scholar] [CrossRef]
- Mazerolle, M.J. AICcmodavg: Model Selection and Multimodel Inference Based on (Q)AIC(c). 2020. Available online: https://cran.r-project.org/package=AICcmodavg (accessed on 5 July 2021).
- Arnold, T.W. Uninformative Parameters and Model Selection Using Akaike’s Information Criterion. J. Wildl. Manag. 2010, 74, 1175–1178. [Google Scholar] [CrossRef]
- Bollen, K.A.; Jackman, R.W. Regression Diagnostics: An Expository Treatment of Outliers and Influential Cases. Sociol. Methods Res. 1985, 13, 510–542. [Google Scholar] [CrossRef]
- Cohen, J.; Cohen, P.; West, S.G.; Aiken, L.S. Applied Multiple Regression/Correlation Analysis for the Behavioral Sciences, 3rd ed.; Erlbaum Publishers: Mahwah, NJ, USA, 2003. [Google Scholar]
- Schönbrodt, F.D.; Humberg, S. An R Package for Response Surface Analysis. 2020. Available online: https://cran.r-project.org/package=RSA (accessed on 5 July 2021).
- Humberg, S.; Nestler, S.; Back, M.D. Response Surface Analysis in Personality and Social Psychology: Checklist and Clarifications for the Case of Congruence Hypotheses. Soc. Psychol. Personal. Sci. 2019, 10, 409–419. [Google Scholar] [CrossRef]
- Mund, M.; Freuding, M.M.; Möbius, K.; Horn, N.; Neyer, F.J. The Stability and Change of Loneliness across the Life Span: A Meta-Analysis of Longitudinal Studies. Personal. Soc. Psychol. Rev. 2020, 24, 24–52. [Google Scholar] [CrossRef]
- Oberle, E.; Schonert-Reichl, K.A.; Thomson, K.C. Understanding the Link between Social and Emotional Well-Being and Peer Relations in Early Adolescence: Gender-Specific Predictors of Peer Acceptance. J. Youth Adolesc. 2010, 39, 1330–1342. [Google Scholar] [CrossRef]
- Brandt, N.D.; Lechner, C.M.; Tetzner, J.; Rammstedt, B. Personality, Cognitive Ability, and Academic Performance: Differential Associations across School Subjects and School Tracks. J. Pers. 2020, 88, 249–265. [Google Scholar] [CrossRef]
- Perlman, D.; Peplau, L.A. Toward a social psychology of loneliness. In Personal Relationships in Disorder; Gilmour, R., Duck, S., Eds.; Academic Press: London, UK, 1981. [Google Scholar]
- Masi, C.M.; Chen, H.-Y.; Hawkley, L.C.; Cacioppo, J.T. A Meta-Analysis of Interventions to Reduce Loneliness. Personal. Soc. Psychol. Rev. 2011, 15, 219–266. [Google Scholar] [CrossRef]
- Wright, A.G.C.; Hopwood, C.J.; Skodol, A.E.; Morey, L.C. Longitudinal Validation of General and Specific Structural Features of Personality Pathology. J. Abnorm. Psychol. 2016, 125, 1120–1134. [Google Scholar] [CrossRef]
- Hansell, N.K.; Wright, M.J.; Medland, S.E.; Davenport, T.A.; Wray, N.R.; Martin, N.G.; Hickie, I.B. Genetic Co-Morbidity between Neuroticism, Anxiety/Depression and Somatic Distress in a Population Sample of Adolescent and Young Adult Twins. Psychol. Med. 2012, 42, 1249–1260. [Google Scholar] [CrossRef] [PubMed]
- Lucas, R.E.; Diener, E. Personality and subjective well-being. In The Science of Well-Being: The Collected Works of Ed Diener; Social indicators research series; Springer Science & Business Media: New York, NY, USA, 2009; pp. 75–102. ISBN 978-90-481-2349-0. [Google Scholar]
- Ormel, J.; Wohlfarth, T. How Neuroticism, Long-Term Difficulties, and Life Situation Change Influence Psychological Distress: A Longitudinal Model. J. Pers. Soc. Psychol. 1991, 60, 744–755. [Google Scholar] [CrossRef]
- Edwards, J.R.; Berry, J.W. The Presence of Something or the Absence of Nothing: Increasing Theoretical Precision in Management Research. Organ. Res. Methods 2010, 13, 668–689. [Google Scholar] [CrossRef]
- Bartels, M.; Cacioppo, J.T.; Hudziak, J.J.; Boomsma, D.I. Genetic and Environmental Contributions to Stability in Loneliness throughout Childhood. Am. J. Med. Genet. B Neuropsychiatr. Genet. 2008, 147B, 385–391. [Google Scholar] [CrossRef]
- Bleidorn, W. Hitting the Road to Adulthood: Short-Term Personality Development during a Major Life Transition. Pers. Soc. Psychol. Bull. 2012, 38, 1594–1608. [Google Scholar] [CrossRef] [PubMed]
- Lenz, B. The Transition from Adolescence to Young Adulthood: A Theoretical Perspective. J. Sch. Nurs. 2001, 17, 300–306. [Google Scholar] [CrossRef]
- Lüdtke, O.; Roberts, B.W.; Trautwein, U.; Nagy, G. A Random Walk down University Avenue: Life Paths, Life Events, and Personality Trait Change at the Transition to University Life. J. Pers. Soc. Psychol. 2011, 101, 620–637. [Google Scholar] [CrossRef]
- Aquilino, W.S. Family relationships and support systems in emerging adulthood. In Emerging Adults in America: Coming of Age in the 21st Century; Arnett, J.J., Tanner, J.L., Eds.; American Psychological Association: Washington, DC, USA, 2006; pp. 193–217. ISBN 978-1-59147-329-9. [Google Scholar]
- Roberts, B.W.; Wood, D. Personality development in the context of the neo-socioanalytic model of personality. In Handbook of Personality Development; Mroczek, D.K., Little, T.D., Eds.; Lawrence Erlbaum Associates Publishers: Mahwah, NJ, USA, 2006; pp. 11–39. ISBN 978-0-8058-4716-1. [Google Scholar]
- Van Roekel, E.; Scholte, R.H.J.; Verhagen, M.; Goossens, L.; Engels, R.C.M.E. Loneliness in Adolescence: Gene × Environment Interactions Involving the Serotonin Transporter Gene. J. Child Psychol. Psychiatry 2010, 51, 747–754. [Google Scholar] [CrossRef] [PubMed]
- Geukens, F.; Maes, M.; Cillessen, A.H.N.; Colpin, H.; Van Leeuwen, K.; Verschueren, K.; Goossens, L. Spotting Loneliness at School: Associations between Self-Reports and Teacher and Peer Nominations. Int. J. Environ. Res. Public. Health 2021, 18, 971. [Google Scholar] [CrossRef] [PubMed]
- Podsakoff, P.M.; MacKenzie, S.B.; Lee, J.-Y.; Podsakoff, N.P. Common Method Biases in Behavioral Research: A Critical Review of the Literature and Recommended Remedies. J. Appl. Psychol. 2003, 88, 879–903. [Google Scholar] [CrossRef]
- Matthews, T.; Fisher, H.L.; Bryan, B.T.; Danese, A.; Moffitt, T.E.; Qualter, P.; Verity, L.; Arseneault, L. This Is What Loneliness Looks like: A Mixed-Methods Study of Loneliness in Adolescence and Young Adulthood. Int. J. Behav. Dev. 2021, 1–10. [Google Scholar] [CrossRef]
- Schmidt-Atzert, L.; Amelang, M. Grundlagen diagnostischer Verfahren. In Psychologische Diagnostik; Springer: Berlin/Heidelberg, Germany, 2012; pp. 35–174. ISBN 978-3-642-17000-3. [Google Scholar]


| Intercorrelations | |||||||||||||||
|---|---|---|---|---|---|---|---|---|---|---|---|---|---|---|---|
| T1 Variables | T2 Variables | ||||||||||||||
| MT1 | SDT1 | MT2 | SDT2 | d | αT1 | αT2 | E | N | L | L(e) | L(s) | L | L(e) | L(s) | |
| Sample 1 | |||||||||||||||
| E | 4.54 | 1.22 | 0.72 | −0.21 | |||||||||||
| N | 3.60 | 1.26 | 0.74 | −0.34 | 0.34 | ||||||||||
| L | 2.52 | 1.61 | 2.71 | 1.64 | 0.09 | -- | −0.32 | 0.45 | 0.47 | ||||||
| Sample 2 | |||||||||||||||
| E | 4.69 | 0.95 | 0.86 | −0.44 | −0.40 | −0.38 | |||||||||
| N | 3.87 | 1.07 | 0.88 | −0.31 | 0.15 | 0.19 | 0.07 | ||||||||
| L | 2.20 | 0.94 | 2.19 | 0.96 | 0.00 | 0.73 | 0.78 | −0.57 | 0.31 | 0.71 | |||||
| L(e) | 2.72 | 1.30 | 2.69 | 1.16 | −0.06 | 0.70 | 0.53 | −0.54 | 0.39 | 0.89 | 0.67 | 0.63 | |||
| L(s) | 1.68 | 0.93 | 1.70 | 1.01 | 0.08 | 0.86 | 0.91 | −0.41 | 0.09 | 0.78 | 0.41 | 0.57 | 0.40 | 0.63 | |
| b1 | b2 | b3 | b4 | b5 | K | LL | AICc | w | Adj. R2Model | Adj. R2Full Model | |
|---|---|---|---|---|---|---|---|---|---|---|---|
| Cross-sectional | |||||||||||
| Overall loneliness | |||||||||||
| Sample 1 | 0.237 | ||||||||||
| Linear Extraversion and Exponential Neuroticism Model | −0.26 | 0.47 | 0 | 0 | 0.07 | 5 | −608.42 | 1227.02 | 0.42 | 0.233 | |
| Full Model | −0.26 | 0.47 | 0.04 | 0.11 | 0.11 | 7 | −606.59 | 1227.51 | 0.33 | 0.237 | |
| Linear Main Effects Model | −0.25 | 0.49 | 0 | 0 | 0 | 4 | −609.98 | 1228.08 | 0.25 | 0.229 | |
| Sample 2 | 0.347 | ||||||||||
| Linear Main Effects Model | −0.52 | 0.13 | 0 | 0 | 0 | 4 | −271.22 | 550.61 | 0.66 | 0.342 | |
| Full Model | −0.51 | 0.13 | 0.07 | 0.07 | −0.04 | 7 | −268.88 | 552.25 | 0.29 | 0.347 | |
| Emotional loneliness | 0.335 | ||||||||||
| Linear Main Effects Model | −0.64 | 0.30 | 0 | 0 | 0 | 4 | −348.43 | 705.03 | 1 | 0.338 | |
| Social loneliness | 0.165 | ||||||||||
| Linear Main Effect of Extraversion Model | −0.40 | 0 | 0 | 0 | 0 | 3 | −296.95 | 600.00 | 0.84 | 0.161 | |
| Full Model | −0.39 | −0.03 | 0.08 | 0.08 | −0.03 | 7 | −294.44 | 603.36 | 0.16 | 0.165 | |
| Longitudinal | |||||||||||
| Overall loneliness (change) | 0.254 | ||||||||||
| Saturating Effect of Neuroticism Model | 0 | 0.26 | 0 | 0 | −0.04 | 5 | −499.99 | 1010.15 | 0.50 | 0.251 | |
| Linear Main Effect of Neuroticism Model | 0 | 0.23 | 0 | 0 | 0 | 4 | −501.51 | 1011.14 | 0.31 | 0.246 | |
| Full Model | −0.04 | 0.25 | 0.08 | 0.04 | −0.10 | 8 | −497.86 | 1012.14 | 0.19 | 0.254 |
Publisher’s Note: MDPI stays neutral with regard to jurisdictional claims in published maps and institutional affiliations. |
© 2021 by the authors. Licensee MDPI, Basel, Switzerland. This article is an open access article distributed under the terms and conditions of the Creative Commons Attribution (CC BY) license (https://creativecommons.org/licenses/by/4.0/).
Share and Cite
Wieczorek, L.L.; Humberg, S.; Gerstorf, D.; Wagner, J. Understanding Loneliness in Adolescence: A Test of Competing Hypotheses on the Interplay of Extraversion and Neuroticism. Int. J. Environ. Res. Public Health 2021, 18, 12412. https://doi.org/10.3390/ijerph182312412
Wieczorek LL, Humberg S, Gerstorf D, Wagner J. Understanding Loneliness in Adolescence: A Test of Competing Hypotheses on the Interplay of Extraversion and Neuroticism. International Journal of Environmental Research and Public Health. 2021; 18(23):12412. https://doi.org/10.3390/ijerph182312412
Chicago/Turabian StyleWieczorek, Larissa L., Sarah Humberg, Denis Gerstorf, and Jenny Wagner. 2021. "Understanding Loneliness in Adolescence: A Test of Competing Hypotheses on the Interplay of Extraversion and Neuroticism" International Journal of Environmental Research and Public Health 18, no. 23: 12412. https://doi.org/10.3390/ijerph182312412
APA StyleWieczorek, L. L., Humberg, S., Gerstorf, D., & Wagner, J. (2021). Understanding Loneliness in Adolescence: A Test of Competing Hypotheses on the Interplay of Extraversion and Neuroticism. International Journal of Environmental Research and Public Health, 18(23), 12412. https://doi.org/10.3390/ijerph182312412