Article

Elemental Composition of PM2.5 and PM10 and Health Risks Assessment in the Industrial Districts of Chelyabinsk, South Ural Region, Russia

by
Tatyana G. Krupnova
1,*,
Olga V. Rakova
1,
Kirill A. Bondarenko
1,
Artem F. Saifullin
1,
Darya A. Popova
1,
Sanja Potgieter-Vermaak
2,3 and
Ricardo H. M. Godoi
4
1
Institute of Natural Sciences and Mathematics, South Ural State University, 454080 Chelyabinsk, Russia
2
Ecology & Environment Research Centre, Department of Natural Science, Manchester Metropolitan University, Manchester M1 5GD, UK
3
Molecular Science Institute, University of the Witwatersrand, Johannesburg 2000, South Africa
4
Environmental Engineering Department, Federal University of Parana, Curitiba 80060-240, Brazil
*
Author to whom correspondence should be addressed.
Int. J. Environ. Res. Public Health 2021, 18(23), 12354; https://doi.org/10.3390/ijerph182312354
Submission received: 4 October 2021 / Revised: 15 November 2021 / Accepted: 19 November 2021 / Published: 24 November 2021
(This article belongs to the Section Environmental Earth Science and Medical Geology)

Abstract

:
Air pollution impacts all populations globally, indiscriminately and has site-specific variation and characteristics. Airborne particulate matter (PM) levels were monitored in a typical industrial Russian city, Chelyabinsk in three destinations, one characterized by high traffic volumes and two by industrial zone emissions. The mass concentration and trace metal content of PM2.5 and PM10 were obtained from samples collected during four distinct seasons of 2020. The mean 24-h PM10 ranged between 6 and 64 μg/m3. 24-h PM2.5 levels were reported from 5 to 56 μg/m3. About half of the 24-h PM10 and most of the PM2.5 values in Chelyabinsk were higher than the WHO recommendations. The mean PM2.5/PM10 ratio was measured at 0.85, indicative of anthropogenic input. To evaluate the Al, Fe, As, Cd, Co, Cr, Cu, Mn, Ni, Pb, and Zn concentration in PM2.5 and PM10, inductively coupled plasma mass spectrometry (ICP-MS) was used. Fe (337–732 ng/m3) was the most abundant component in PM2.5 and PM10 samples while Zn (77–206 ng/m3), Mn (10–96 ng/m3), and Pb (11–41 ng/m3) had the highest concentrations among trace elements. Total non-carcinogenic risks for children were found higher than 1, indicating possible health hazards. This study also presents that the carcinogenic risk for As, Cr, Co, Cd, Ni, and Pb were observed higher than the acceptable limit (1 × 10⁻⁶).

1. Introduction

Globally, an increasing awareness of air quality and air pollutants in general are fostered amongst populations due to media coverage, changing policies, new air quality standards, and disaster events such as the COVID-19 pandemic. As such, urban populations become increasingly aware of the impact that poor air quality has on their health and the environment [1]. Most countries have adopted air quality guidelines and in 2010, the Russian Federation approved the legislation for the maximum permissible concentrations of atmospheric particles with aerodynamic diameter < 2.5 μm (PM2.5) and <10 μm (PM10) (35 and 60 μg/m3 (24-h mean concentrations), 25 and 40 μg/m3 (annual mean concentrations), respectively) [2]. This evidently resulted in numerous monitoring stations across the country. It needs to be noted though, that the adopted guideline values are much higher than what has been recommended by the WHO, which recently changed to even lower levels of 15 and 45 μg/m3 (24-h mean concentrations), and 5 and 15 μg/m3 (annual mean concentrations), for PM10 and PM2.5, respectively [3].
The focus of this research is on a typical Russian industrial city, where urban air quality is further impacted by local industry. For example, it has been shown that mechanical engineering industries contributes up to 13% of ambient PM2.5, ferrous metallurgy up to 79% of PM2.5, and non-ferrous metallurgy up to 43% of PM2.5 [4]. Concentrations of PM2.5 and PM10 in the ambient air near industrial enterprises often exceed hygienic standards. This is most concerning as Russia currently reports an increase in industrial production. It is therefore not surprising that residents are worried about smog episodes driven by elevated particulate matter (PM) levels, especially in industrialized urban environments. If one considers the usual urban air pollution sources [5] in addition to industry emissions, it becomes evident that continuous site-specific air quality monitoring, source apportionment, and data analyses are of cardinal importance for residents’ well-being and health.
A potential way of source apportionment is to investigate the ratio of PM2.5 to PM10 (PM2.5/PM10) as it can provide information on the origin and production processes [6,7]. Not only does it inform as to the predominant size of the PM, but could be an indication if the PM is predominantly anthropogenic (higher ratio) or naturally occurring airborne particles (lower ratio) [8]. In addition, the PM2.5/PM10 ratio has been shown to provide useful information on local dusty processes in the atmosphere and types of PM pollution in a particular region [9,10,11,12,13,14]. Apart from mass concentrations, the PM collected from industrial city areas is enriched with trace elements (TEs) [15,16,17]. Due to the difference in chemistry that these particles will exhibit, it is important to analyze the chemical profile of PM on a site-specific basis, so as to predict potential health risks of the inhabitants.
As general continuous air quality monitoring is limited to the last decade in Russia, only a few studies [17] have been performed using one-year continuous PM data. Even fewer studies report the chemical profile and TEs in PM and atmospheric aerosol (Table S1). Mitigation strategies need to be informed by reliable long-term monitoring and analysis. For that reason, the main objectives of the study were (1) to identify the spatiotemporal variations in PM2.5, PM10, and PM2.5/PM10 in a typical industrial Russian city, Chelyabinsk; (2) determine the concentration of TEs in PM2.5 and PM10 collected in the Chelyabinsk urban area; (3) assess non-carcinogenic and carcinogenic health risks associated with the inhalation of PM.
To the authors’ knowledge, this is the first time that the spatiotemporal variation of the metal(loid) concentrations in PM2.5 and PM10 in a typical Russian industrial city has been investigated systematically (120 samples analyzed during four seasons and at three different stations) for a time period of one year.

2. Materials and Methods

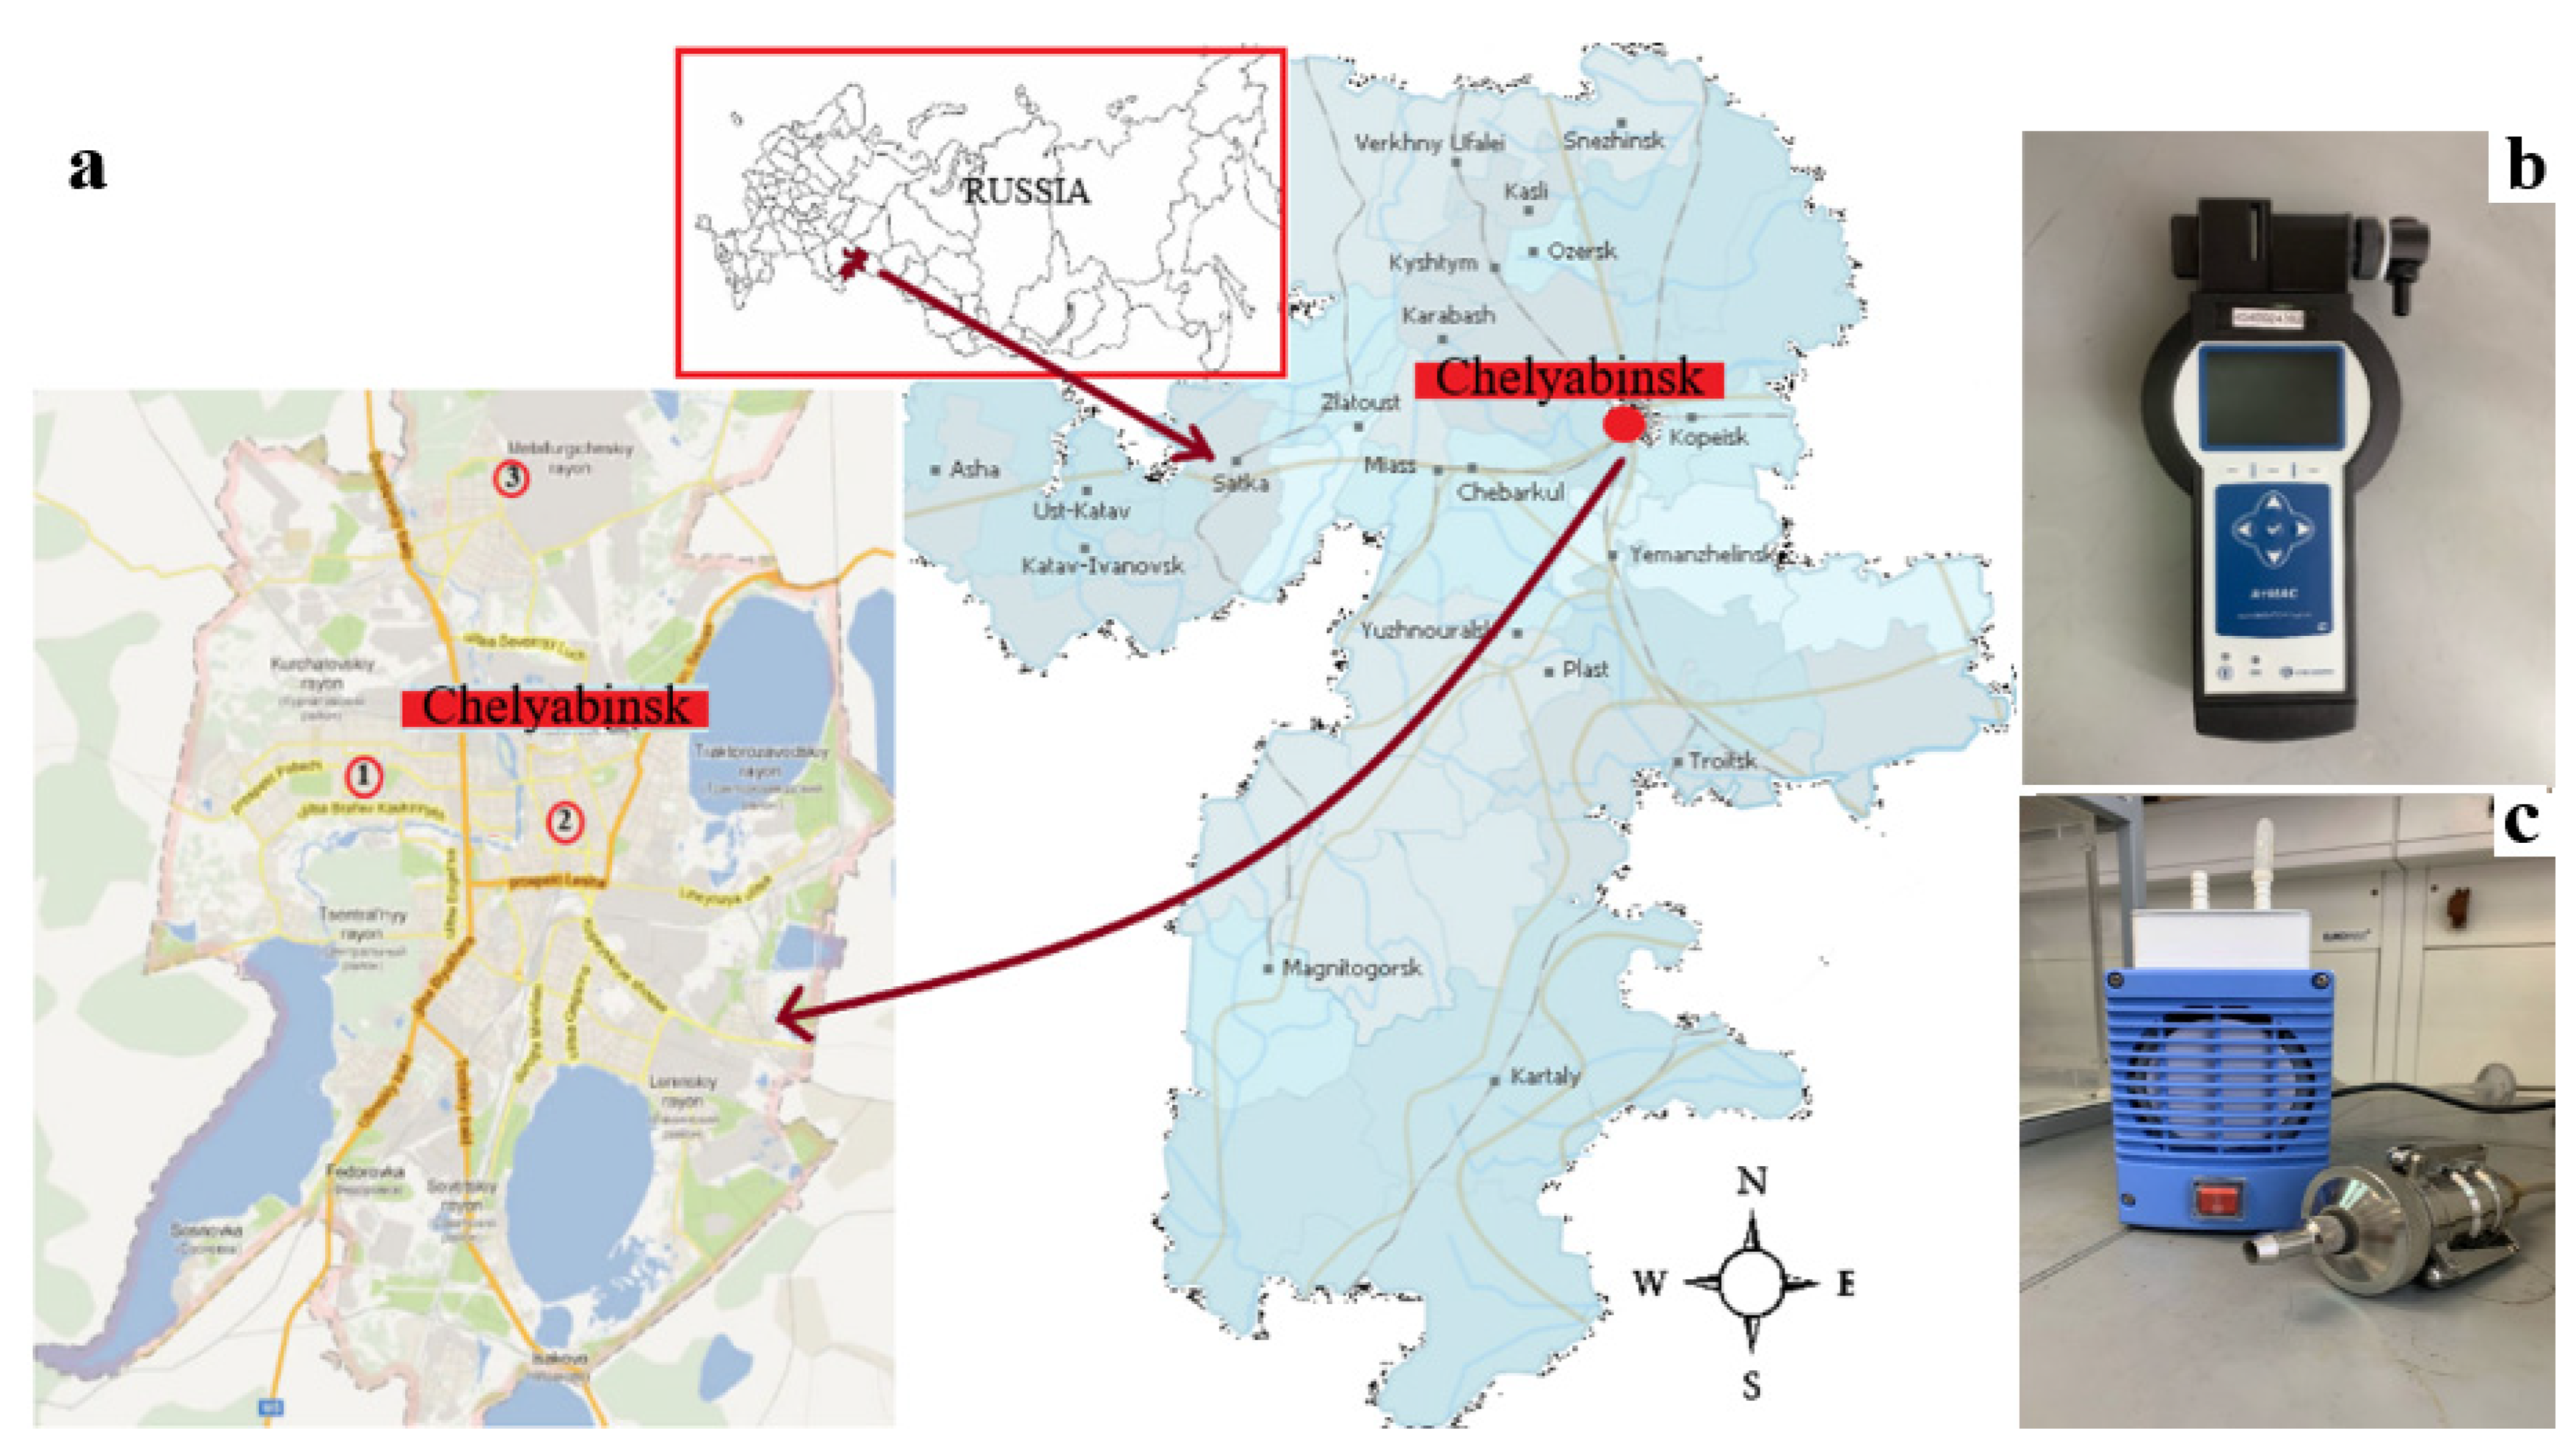
2.1. Study Area, Data and Samples Collection

The three sampling stations were located in urban residential areas in Chelyabinsk (55°09′14″ N, 61°25′44″ E, Elevation: 219 m) (Figure 1). Chelyabinsk is located on the eastern slope of the Southern Urals. The city has a humid continental climate. The average temperature in January is well below freezing point (−14 °C). Mid-summer temperatures are relatively cool (19 °C), while the annual average is a few degrees above freezing point at 3 °C, indicating a moderate climate for Russia. The population of Chelyabinsk during the last census (2010) was 1.130 million. The city has a land area of roughly 530 km2.
Chelyabinsk experiences heavy air pollution with about 120 days per year identified as high pollution days. The three most dangerous air pollutants in Chelyabinsk are formaldehyde, HF, and NO2 [5].
Station 1 was located near highways with heavy automotive traffic. Station 2 and Station 3 were industrial sites located near metallurgical plants. The Atmas device (NTM Protection, Moscow, Russia) measures PM2.5 and PM10 mass concentrations based on unipolar corona charging and electrostatic detection [18]. The analyzer consists of a 2.5 and 10 µm cutoff diameter impactors for PM2.5 and PM10 fractional measurements. Ground-based observations of hourly PM2.5 and PM10 mass concentrations were obtained from January 2020 to December 2020.
In addition, 72-h PM2.5 and PM10 samples were collected on polycarbonate filters (Sartorius, Göttingen, Germany) with diameter of 25 mm and a pore size of 0.4 µm using low volume 4 stage cascade impactor samplers (IKS-4, Ekaterinburg, Russia) operated at a flow rate of 16 L· min−1 at a height of 2 m. The following size 4 fractions could be collected: >10 µm, 10–5 µm, 5–2.5 µm, and <2.5 µm. The PM2.5 and PM10 samples were collected at each station for each of the four seasons in 2020 (12–30 January, 6–27 April, 9–25 July, and 5–30 October).

2.2. Sample Pretreatment and Chemical Composition Analyses

The loaded PM2.5 and PM10 filters were placed into a polytetrafluoroethylene (PTFE) digestion vessel for acid treatment (2 mL hydrofluoric acid and 6 mL nitric acid), then microwave digested (MWS 4 Speedwave, Berghof, Germany) for 2 h after the setup routine to analyze metal(loid) elements [19,20,21]. After digestion, the extracts were filtered using a blue ribbon filter (Whatman Grade 589/3 ashless filter paper), and distilled water was added such that the total volume was 25 mL. The major (Al and Fe) and trace elemental compositions (As, Cd, Co, Cr, Cu, Mn, Ni, Pb, and Zn) were analyzed using iCAP 7200 (Thermo Fisher, Waltham, MA, USA) Inductively Coupled Plasma Optical Emission Spectrometry (ICP-OES) and Perkin Elmer ELAN 9000 Inductively Coupled Plasma Mass Spectrometry (ICP-MS), respectively.
For quality control purposes the following certified reference materials were used: GSO 10413-2014 CO cespitose and podsolic srednesuglinisty soil (I BEND Rosselkhozakademiya’s VNIIA, Russia), GSO 7186-95 of loess soil (Bronnitsky geological and geochemical expedition Institute of Mineralogy, Geochemistry and Crystal Chemistry of Rare Elements, Russia), and GSO 3486-86 of aluminosilicate loose deposits (Vinogradov Institute of Geochemistry SB RAS, Russia). For quality assurance/quality control, 10 blank filters and standards were digested and analyzed as described above to serve as method blanks. For each element the limit of detection (LOD) has been estimated considering the standard deviation of 10 blank measurements (three times the standard deviation was used). The detection limits in ng/m3 on a 72 h measurement period and the recovery test results are presented in Table 1. The range of recovery efficiency was 87–119%. Reproducibility was tested by analyzing the same standard solution 10 times.

2.3. Exposure Assessment and Risk Calculation

The health impact from exposure to the elements in PM2.5 and PM10 is used in the US Environmental Protection Agency (USEPA) human health evaluation method [22]. There are three major exposure pathways to metal(loid)s: ingestion, inhalation, and dermal contact [19,23,24]. In the present study, we assessed the health risk from inhalation [25] according to USEPA standard [22,26]. The non-carcinogenic risk of nine elements As, Cd, Co, Cr, Cu, Mn, Ni, Pb, and Zn was estimated.
The average daily dose (ADDinh) (mg kg−1 day−1) for elements via inhalation was calculated as [27]:
A D D i n h = C · I n h R · E F · E D B W · A T ,
where the ADDinh is the average daily dose (mg kg−1 day−1) of exposure to elements through inhalation; C is the concentration of elements, (mg m−3); InhR is the inhalation rate of PM2.5; EF is exposure frequency; ED is exposure duration; BW is average body weight; AT is average time with ATnon-car. A detailed description of the values of exposure factors for children and adults applied to the Equation (1) is given in Table 2.
As some of the components differ between cities (countries) it is necessary to alter those values [32,33]. Unfortunately, we did not find information about body weight, for example.
The non-carcinogenic health risk of exposure to elements from PM2.5 in Chelyabinsk is determined as the hazard quotient (HQ i n h ) [29,30,31]:
H Q i n h = A D D i n h R f D .
In this equation, RfD is an estimation of maximum permissible risks to the human population through daily exposure with consideration of sensitive groups (children) during their lifetime.
To assess the cumulative potential non-carcinogenic effects posed by many contaminants, the total exposure hazard index, which is the summation of all the individual hazard quotient, was calculated the HQ i n h value of each target chemical was summed:
H I = H Q i n h 1 + H Q i n h 2 + + H Q i n h n
If HQ i n h or HI < 1, a population is located in a safe area, whereas potential non-carcinogenic effects would occur in case HQ i n h or HI > 1.
The CRA (carcinogenic risk assessment) for individual elements was calculated [29,30,31,32]:
L A D D i n h = C · I n h R · E F · E D B W · A T ,
C R A = L A D D i n h · C S F i n h ,
where AT is average time with ATcar and CSFinh is the slope factor.
Carcinogenic risk is the probability of an individual developing any form of cancer from lifetime exposure to carcinogenic hazards. The recommended level of CRA < 1 × 10⁻⁶ can be regarded as negligible, whereas CRA > 1 × 10⁻⁴ is likely to lead to health issues. The acceptable or tolerable risk for regulatory purposes ranges from 1 × 10⁻⁶ to 1 × 10⁻⁴ [29,30,31,32,33,34,35,36].
Arsenic, Cd, Co, Ni, and Pb were treated as potential carcinogenic contaminants, whereas the other elements were regarded as non-carcinogenic according to the classification groups defined by USEPA [26]. Chrome Cr(VI) is more toxic than Cr(III) and only Cr(VI) is considered as a carcinogen. Therefore, the CSFinh and RfD of Cr(VI) were assumed as for total Cr to assess the worst situation of Cr [37].

2.4. Scanning Electron Microscopy

SEM analysis was performed on a Jeol JSM-7001F Scanning Electron Microscopy Complex, 30 keV, EDS Oxford INCA X-max 80, WDS Oxford INCA WAVE, EBSD and HKL (JEOL Ltd., Tokyo, Japan), equipped with standard automated features such as autofocus/stigmator, auto gun, and auto contrast with multiple live image display. SEM-EDS is a non-destructive analytical method for surface elemental analysis, with a potential detection limit of 0.1–0.5 wt.% for most elements [38,39,40,41]. A thin layer of gold was deposited on the surface of each sample in order to achieve better conductivity and less electron charge.

3. Results and Discussion

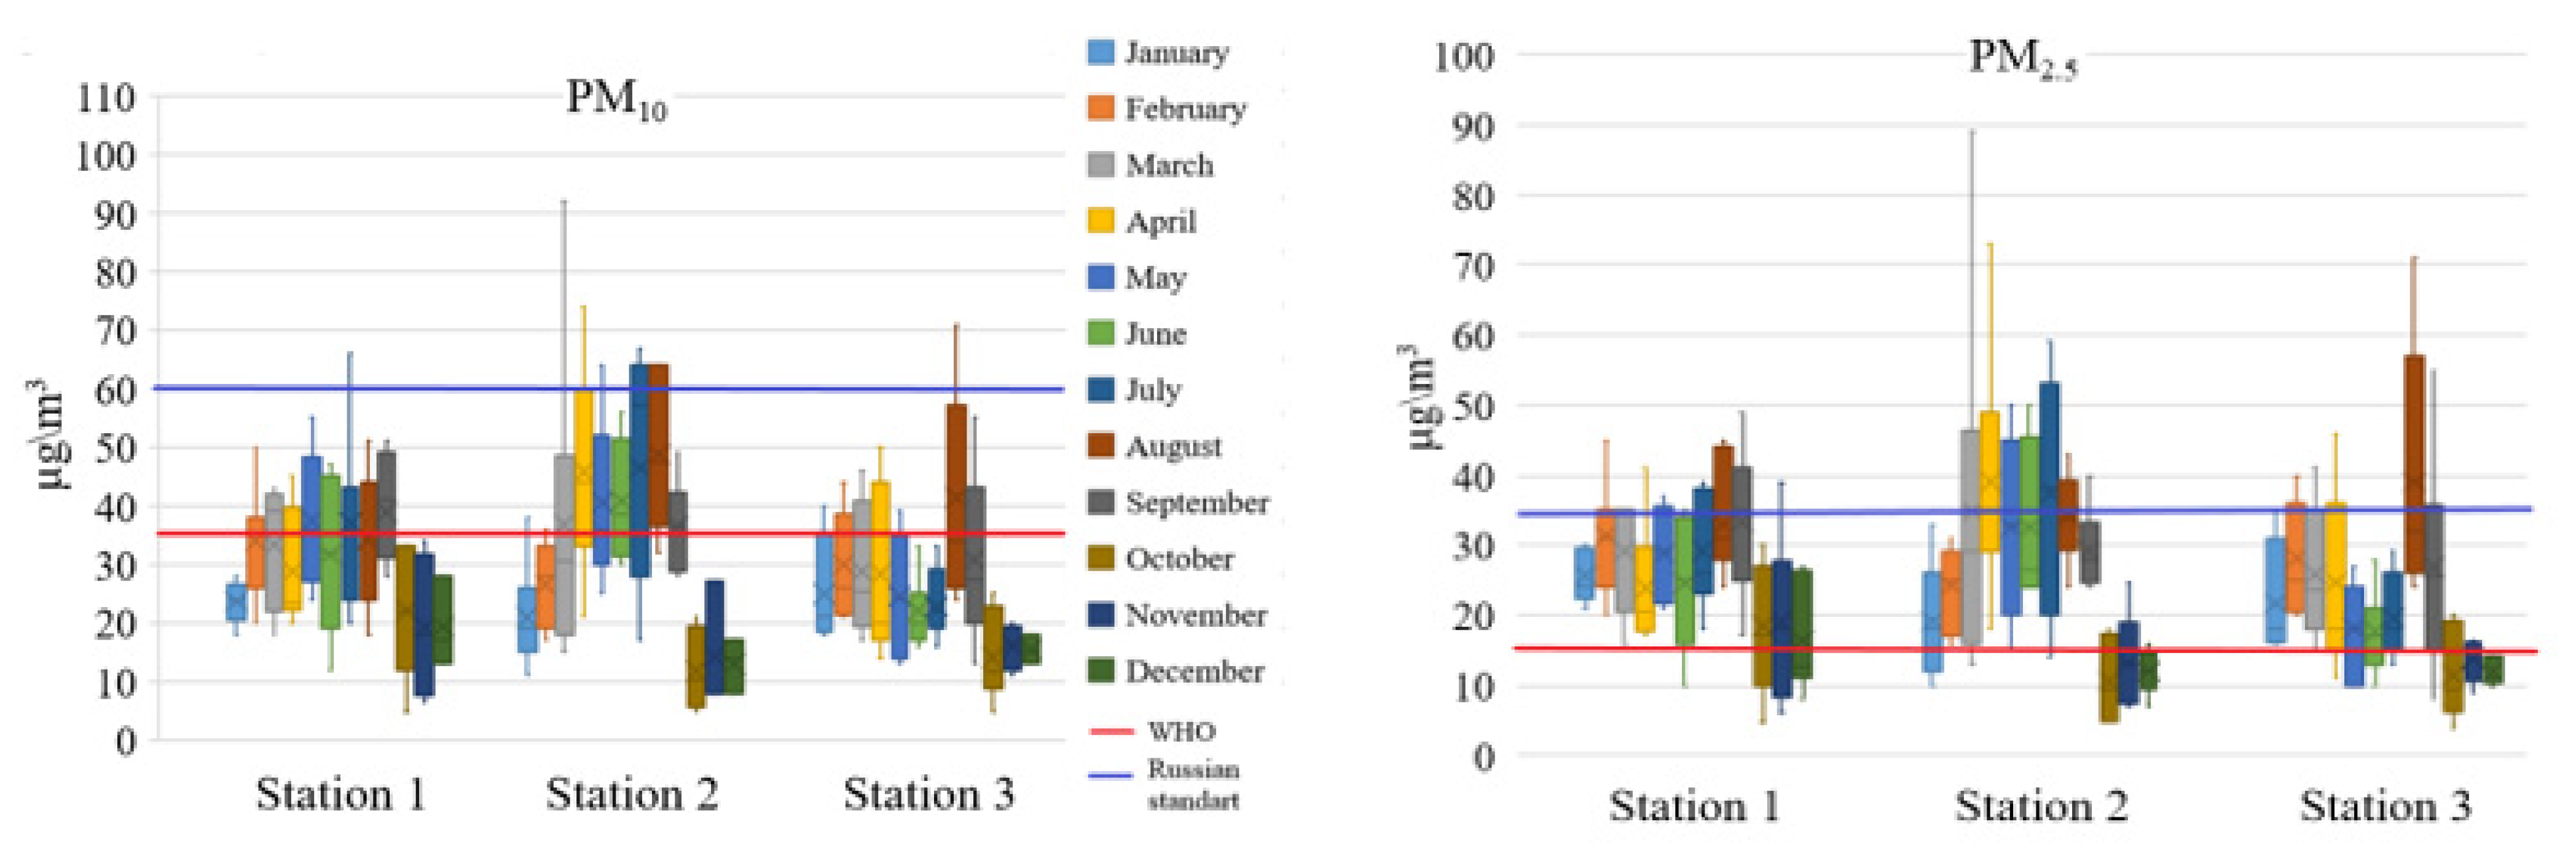
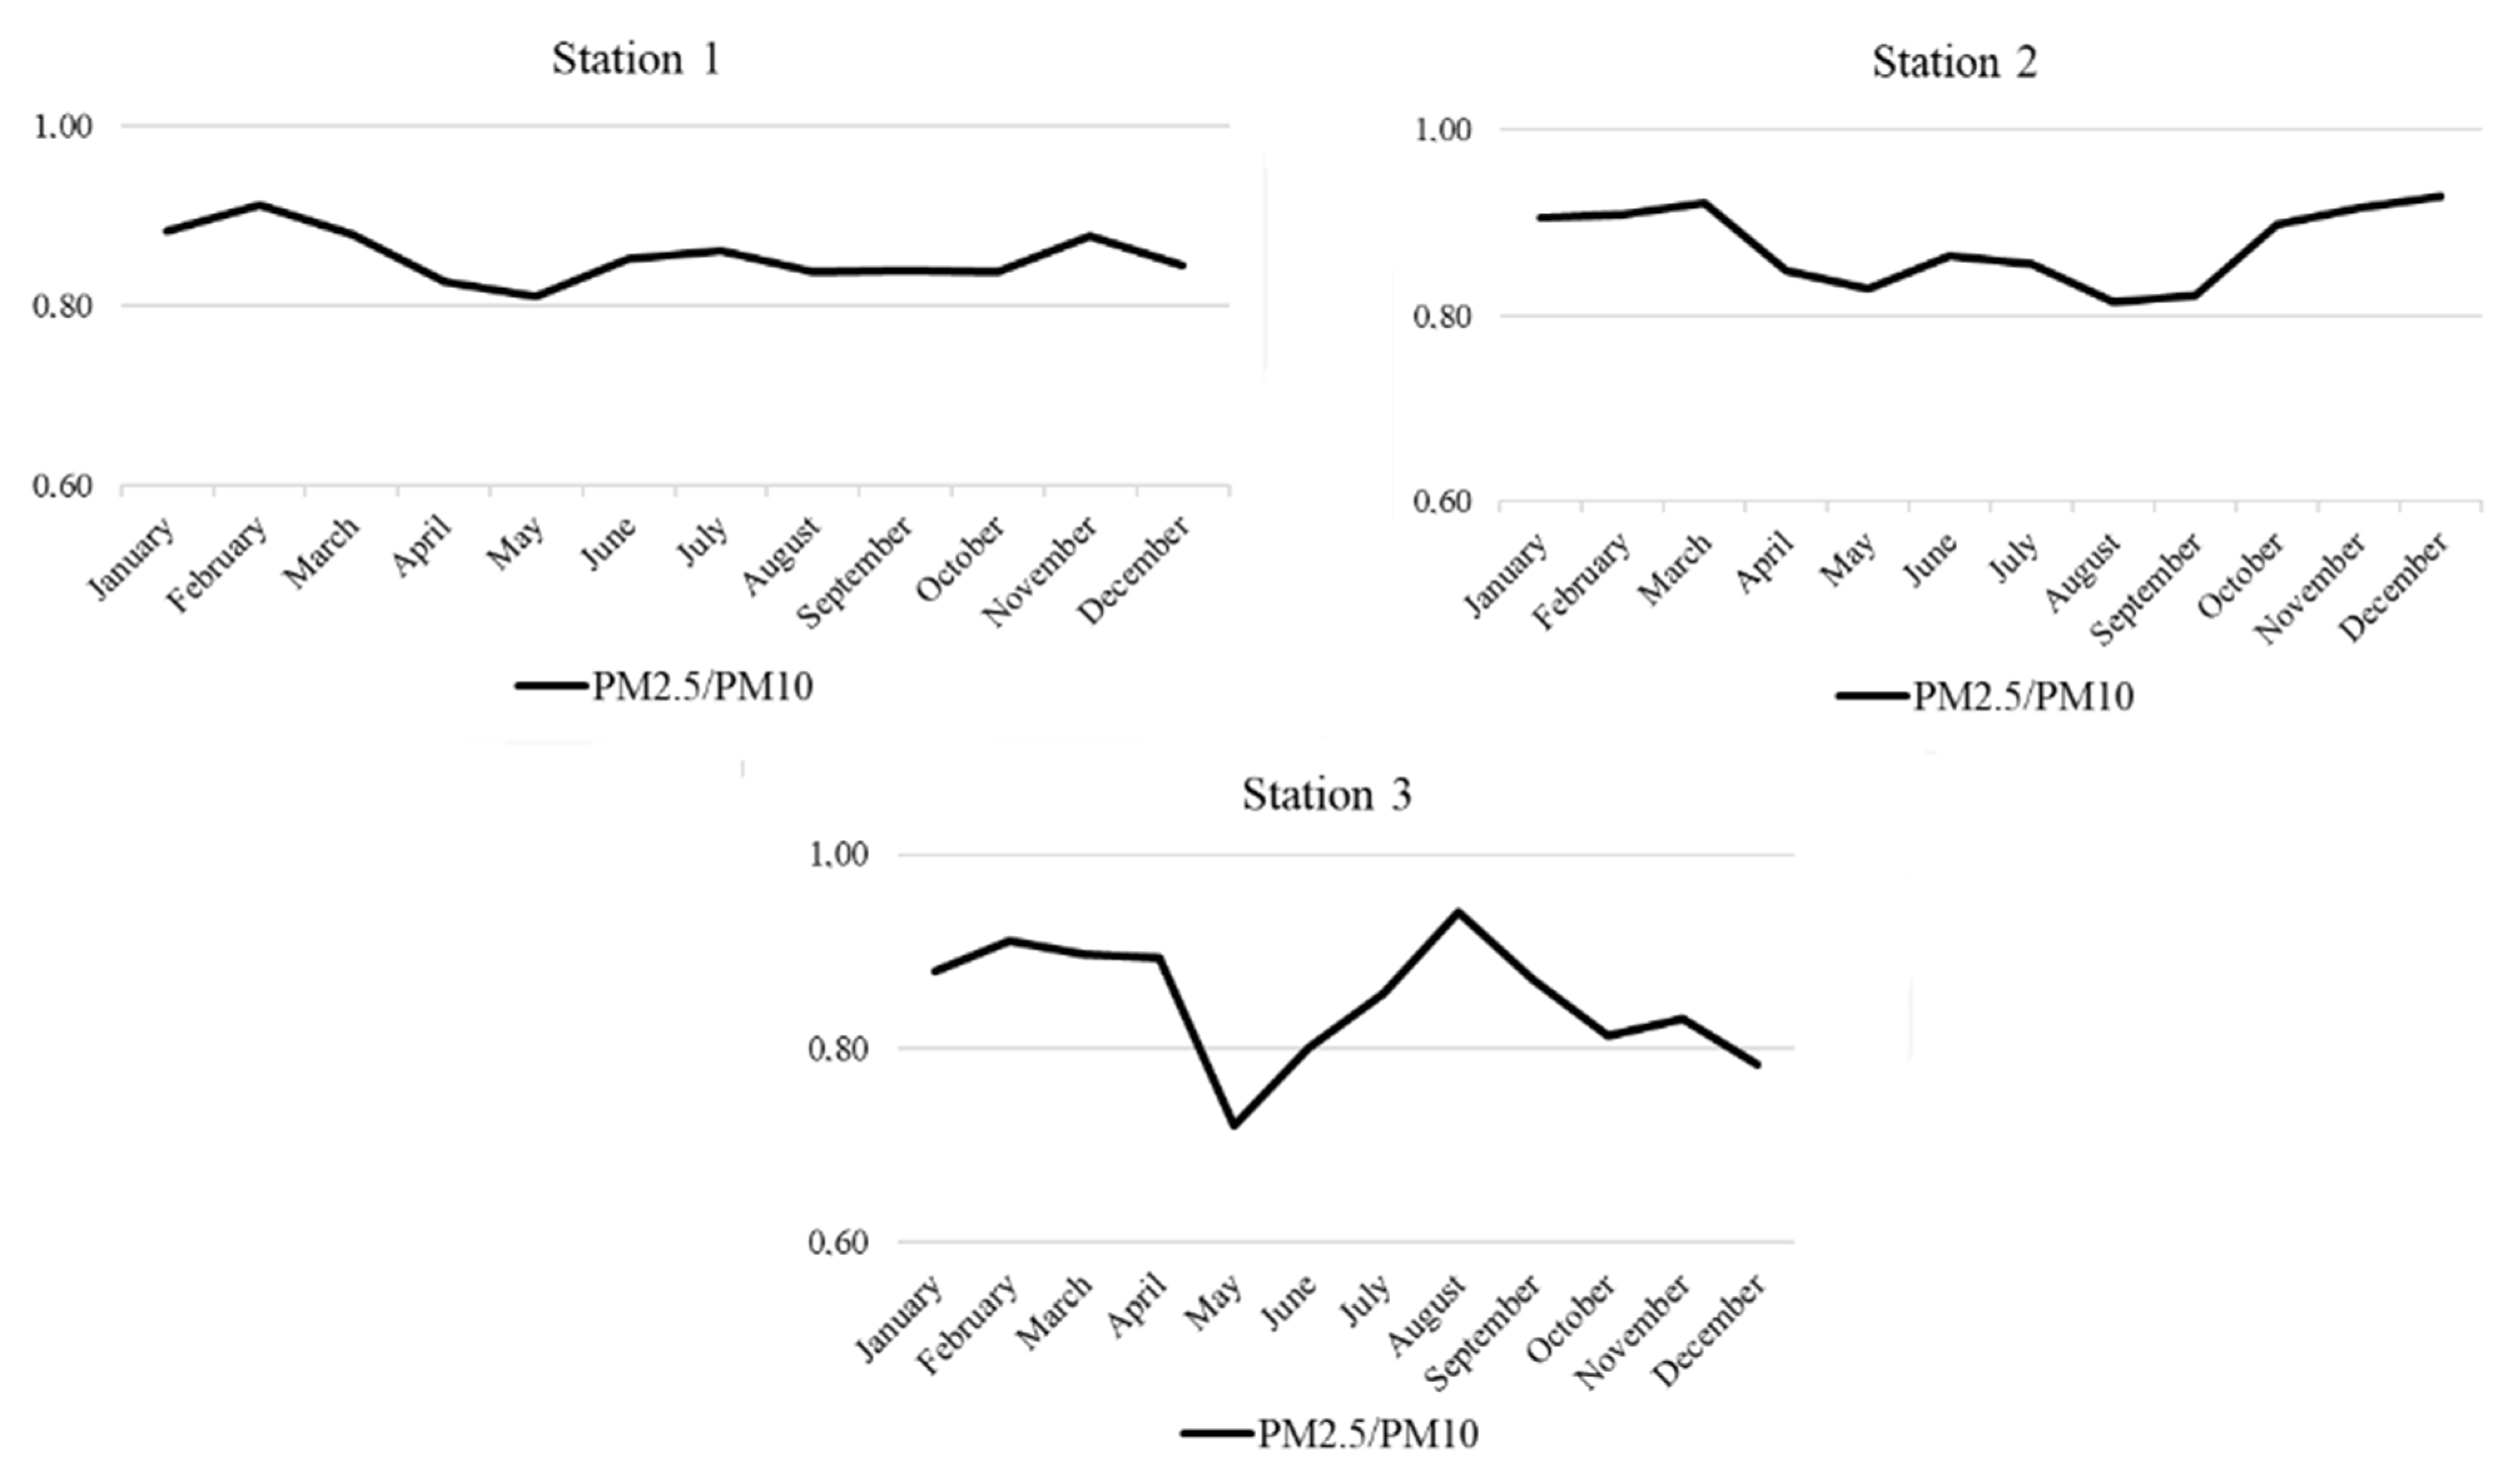
3.1. Pollution Characteristics of Atmospheric Particulate Matter

Figure 2 shows the 24-h means of recorded PM2.5 and PM10 levels for each month of 2020.
The mean PM10 ranged between 6 and 64 μg/m3. PM2.5 levels were reported from 5 to 56 μg/m3. About 3% of PM10 and 30% of PM2.5 values exceeded the Russian standard values (35 and 60 μg/m3, respectively) by 1.1 to 1.7 times. It should be noted that Russian standards differ from WHO recommended limits. The WHO guidelines state that annual average concentrations of PM2.5 and PM10 should not exceed 5 and 15 µg/m3, while 24-h average exposures should not exceed 15 and 45 µg/m3, respectively [3]. About half of the 24-h PM10 and most of the PM2.5 values in Chelyabinsk were higher than the WHO recommendations.
An increase of PM concentration during the spring-summer period is not surprising as it is generally the dry season how it can be seen in Figure S1a. What is interesting though, is that despite the increase in precipitation during August, the levels of PM10 and PM2.5 at Station 3 were quite high, pointing towards additional site sources during this time. Long-range transport from nearby forest fires may also have contributed to the mass concentrations during this period. More than 600 forest fires were registered in close vicinity of the Chelyabinsk region in the summer of 2020 [42]. Figure S2 shows that there is a significant difference in both the magnitude of the area in which fires were reported as well as the number of fires when compared to 2019. Usually, forest fires in the Urals begin in April and end in October, peaking in May (Figure S2, 2019). However, in 2020, forest fires in the Sverdlovsk region (located north of Chelyabinsk) raged throughout the summer, with a maximum in July. The prevailing wind directions in summer 2020 were north and northwest (Figure S2c). It gave possibility of the smoke plume fromforest fires in the Sverdlovsk region to influence on the PM concentrations. In addition, summer inversions occur often, and between 8 and 12 days are typical night-time inversion occurrences, all of which may contribute to increased PM mass concentrations [43,44]. There is the possibility of similar inversions during autumn and winter months, albeit less frequent, which could potentially also play a role in higher sporadic concentrations [43,44]. During the summer of 2020 there were 28 days with low wind speeds (less than 1 m per second) [45], which would further exacerbate pollution.
At all the stations, the PM2.5 and PM10 levels decreased substantially during the autumn-winter period starting from October. Chelyabinsk is one of the snowiest cities in the Russian Federation. The decrease of PM concentration in winter can partially be explained by the “wash-out” effect, as the first snowfall typically happens in October and are lasting throughout the winter [46,47,48]. Snow grains to moderate snow has been reported from January–March and October–December of 2020 (Figure S1b). The established snow cover prevents dusting of urban soils, as well as resuspension of dust from roads and sidewalks (see pictures of the city in winter in Figure S1). The variation in PM mass concentration levels at Station 1, situated furthest from industrial activities, could most probably be ascribed to changes in traffic flow and natural occurrences. It should be noted that traffic volume varied only slightly because this is a transport site in a residential area. On the other hand, the level of PM mass concentration at Stations 2 and 3, which is overall higher than at Station 1, is probably due to the industrial emission influence. Station 2 was located near a large slag dump of a metallurgical enterprise. Station 3 was located within the zone of industrial emissions of a metallurgical plant. The substantial increase in PM2.5 and PM10 levels from March to August at Station 2, compared to Stations 1 and 3, could be due to dust resuspension of the nearby slag dump caused by windy dry weather. During the autumn-winter period rains [46] and snow cover [47,48] significantly reduced dust episodes and the levels at Station 2 is comparable to that of Stations 1 and 3. The PM2.5 and PM10 concentrations observed during the spring-summer period of 2020 at Station 3 were substantially lower than at Station 2 and markedly lower than at Station 1. These lower levels correlate with the COVID-19 lockdown period during that time. On the other hand, the significant increase in both PM2.5 and PM10 during August correlated with an increase in plant production, after lockdown was lifted.
Figure 3 shows that the average PM2.5/PM10 ratio was 0.85, and the minimum and maximum ratio 0.70 and 0.95, respectively.
The average PM2.5/PM10 ratio obtained in Chelyabinsk was generally higher than reported for Asia (0.5) [9,14,49], China (0.62) [10,11,12], and in 20 European Cities (0.6) ([50] and references therein). Seasonal variation (often with a diurnal distribution) is also observed and differs according to meteorological conditions. For example, in Wuhan the ratio decreases from spring through summer and increases again from autumn through winter, while in Africa the opposite is observed. The data in Figure 3 shows a near constant ratio at Station 1, and a more prominent seasonal distribution for Station 2. This is indicative of constant sources of PM throughout the year, where differences in seasonal meteorological conditions could explain the fluctuations in ratios. On the other hand, the ratio at Station 3 did not stay constant and did not display the typical seasonal variation. This could be due to the lockdown period during which it is reasonable to assume that the PM2.5 levels would drop significantly as a result of a drop in vehicle emissions and the nearby steel production plant. It is also evident from Figure 2 that the PM2.5 levels during the lockdown months were substantially lower. This conclusion is further supported by the significant rise in the ratio during August–September when production at the plant increased. According to Statistics Department data [51], in May 2020 metallurgical production of the Chelyabinsk region decreased to 77.6% of the previous year’s production. After the slump in production during the May-June-July period, a gradual increase in August and September was observed, although still lower than the previous year. In fact, for September, the level of production was 90.2% and in November it exceeded the previous year’s production by 1.8%.
Table 3 presents the results of elemental composition of PM2.5 and PM10. The results reveal that Al (192–324 ng/m3) and Fe (337–732 ng/m3) concentrations constitute the major components. Both Al and Fe are normally assigned to crustal origin (natural sources) but could also be partially from anthropogenic origin, for example road dust resuspension (likely at all stations), slag dump dust (Station 2), and steel manufacturing plant emissions (Station 3 with nearly double the Fe concentration in the PM10 fraction). Zn (77–206 ng/m3), Mn (10–96 ng/m3), and Pb (11–41 ng/m3) had the highest concentration among the TEs, all of which could also be identified as potentially toxic elements and of anthropogenic origin [19]. There were no statistically significant season differences observed or a discernable difference between the two fractions, therefore the often observed enrichment of TEs in the smaller fraction was not evident in our data set. The Cd, As, Co, and Cr concentrations were quite low and near the detection limits at all monitoring stations.
Table 4 shows the concentrations found in Chelyabinsk compared to the data reported in other cities around the world. In general, the levels of the metals investigated in Asia are significantly higher than in our study. In fact, the data from our study compares surprisingly well with Brazil and European cities, apart from Zn which is substantially higher. The latter may be an indication of successful application of emission treatment processes, scrubbing the particulate matter released.

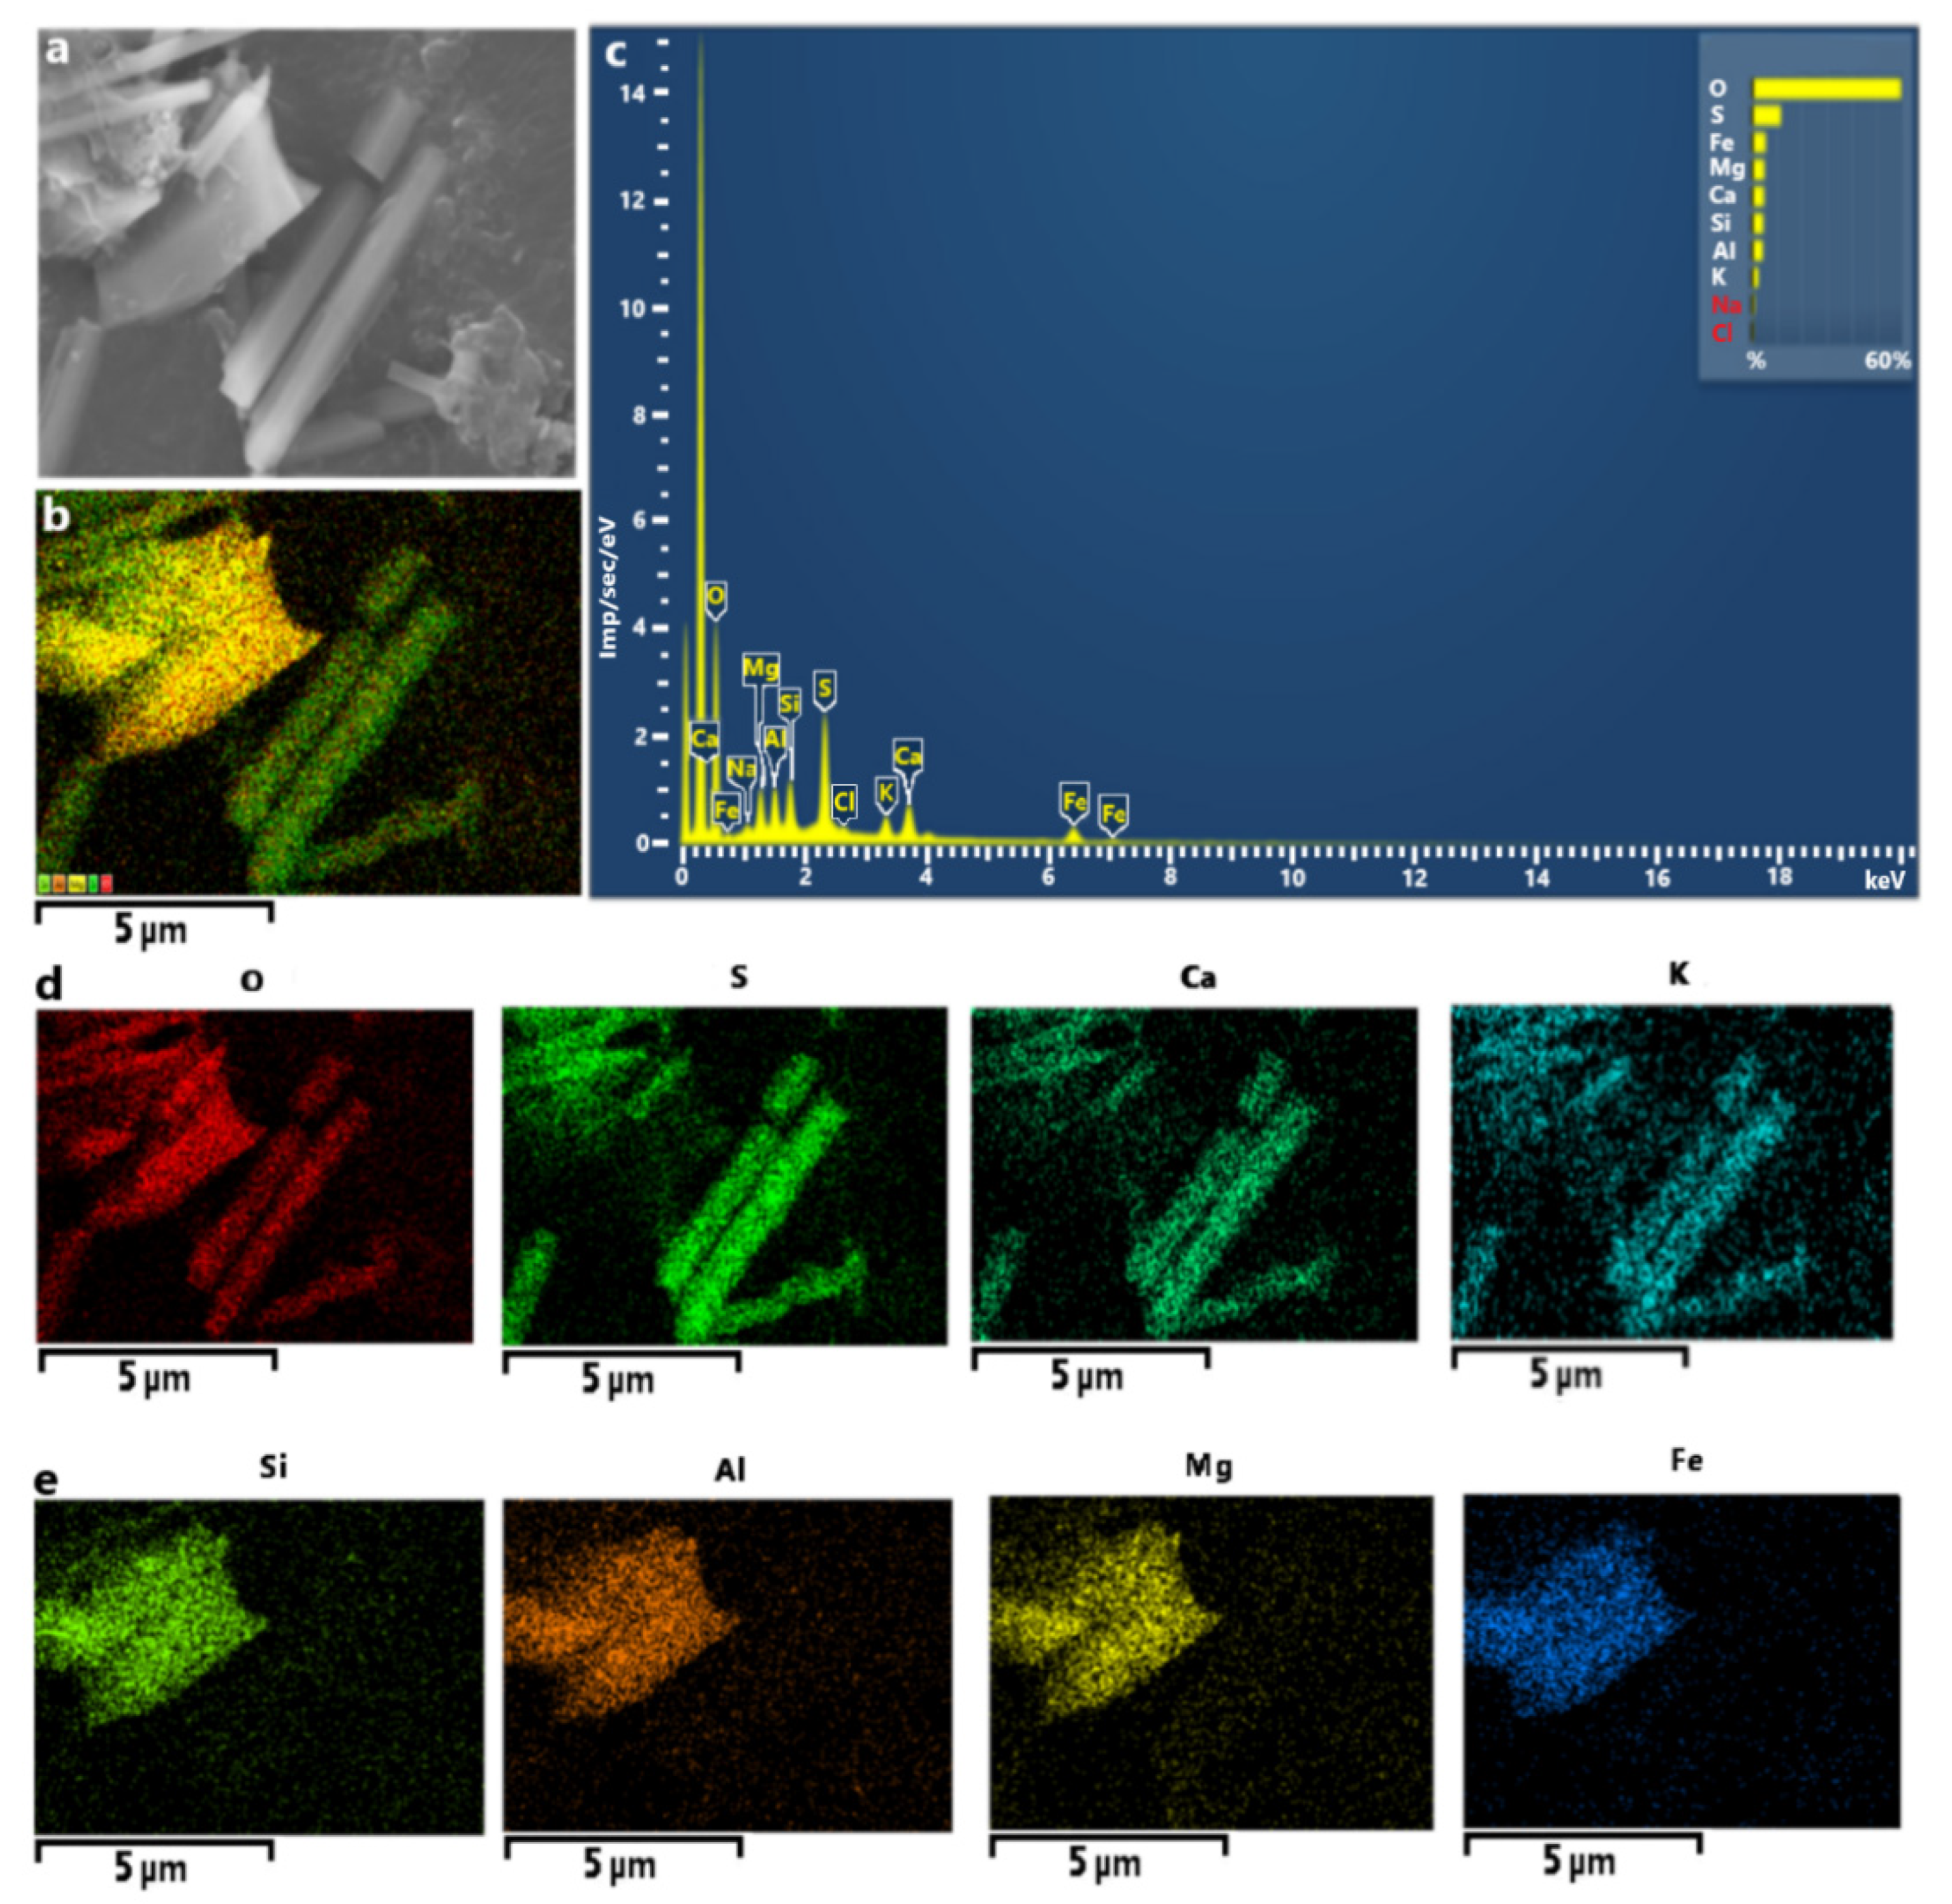
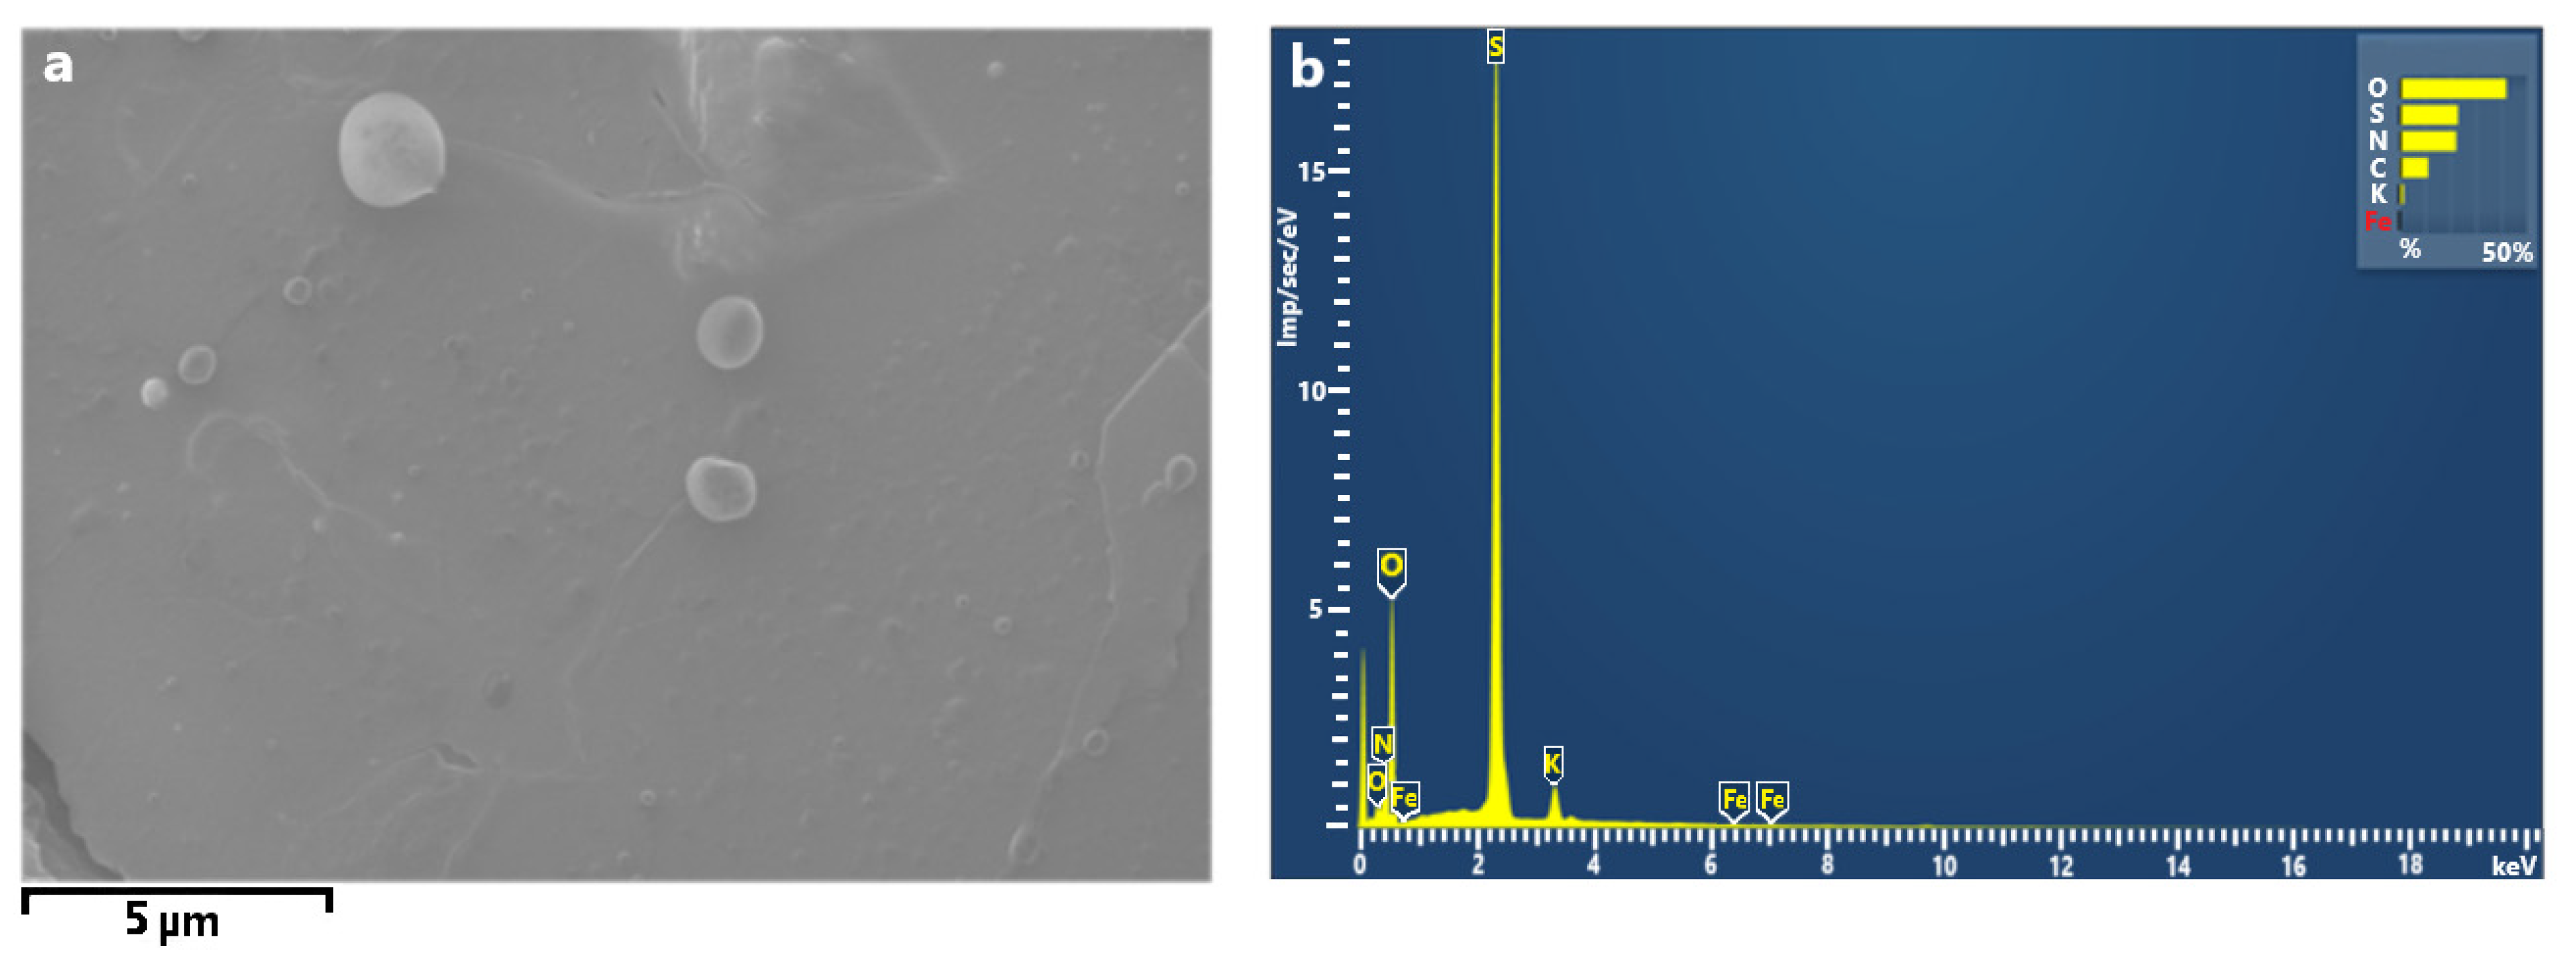
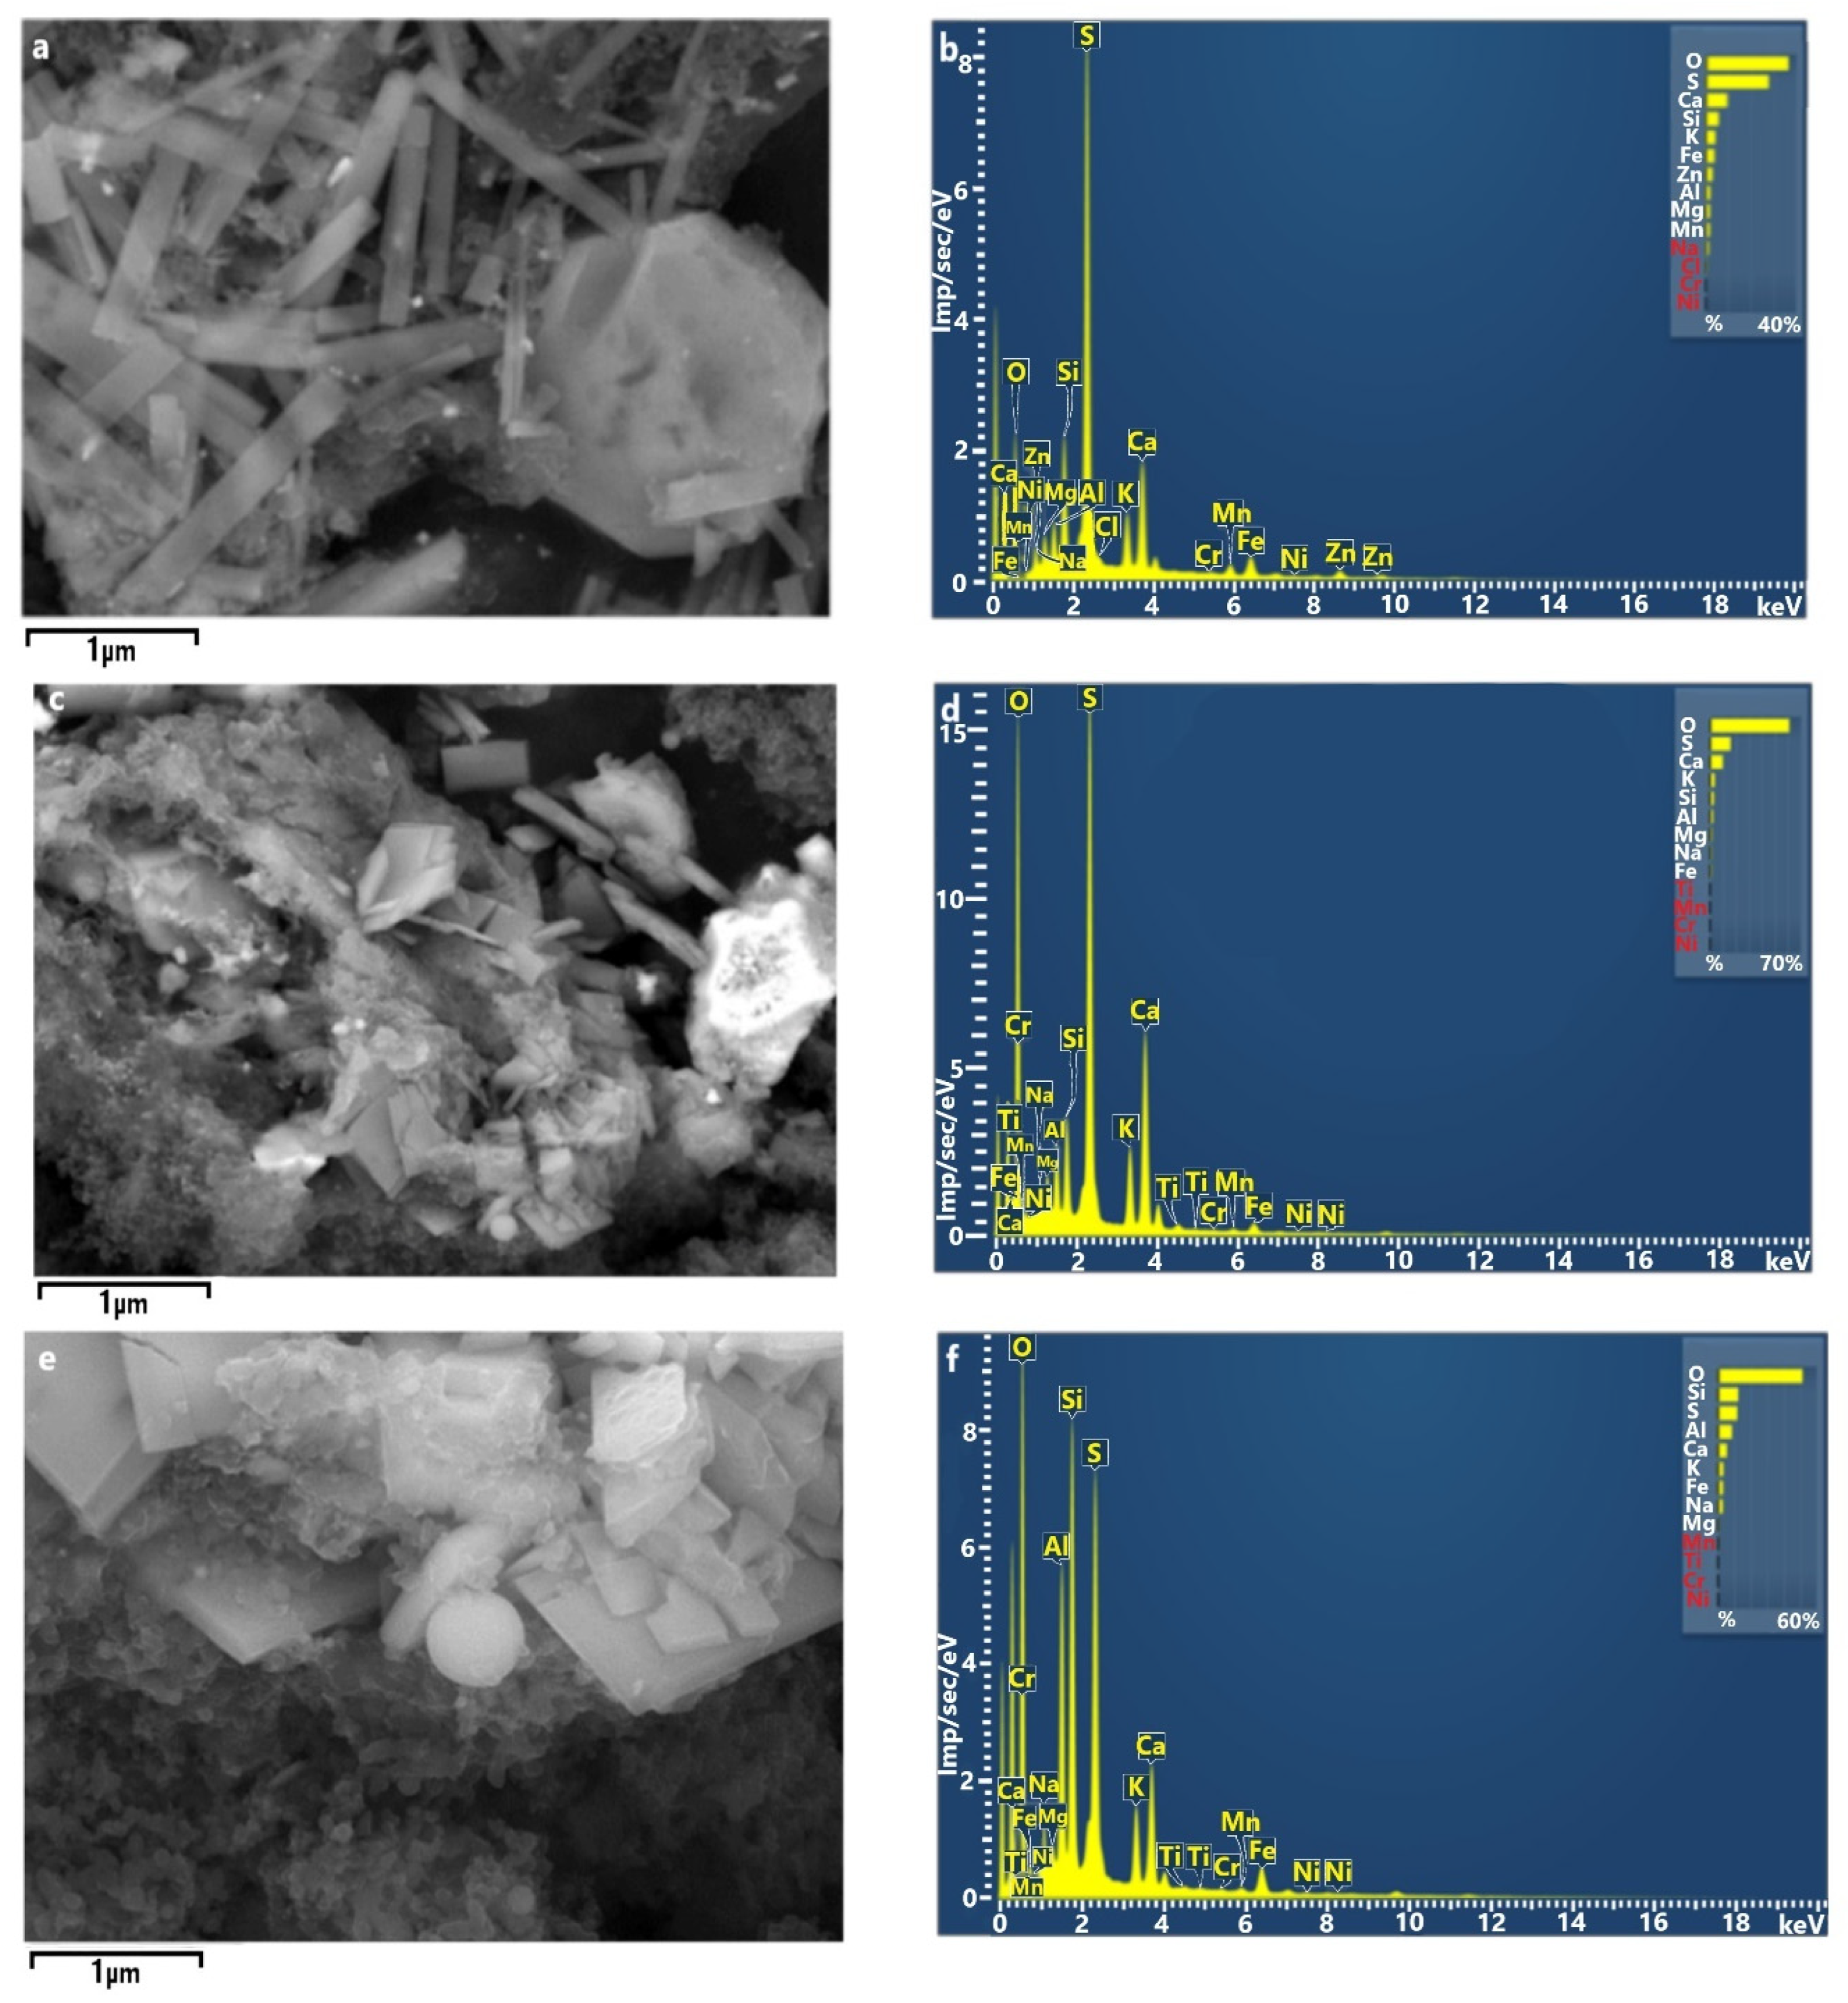
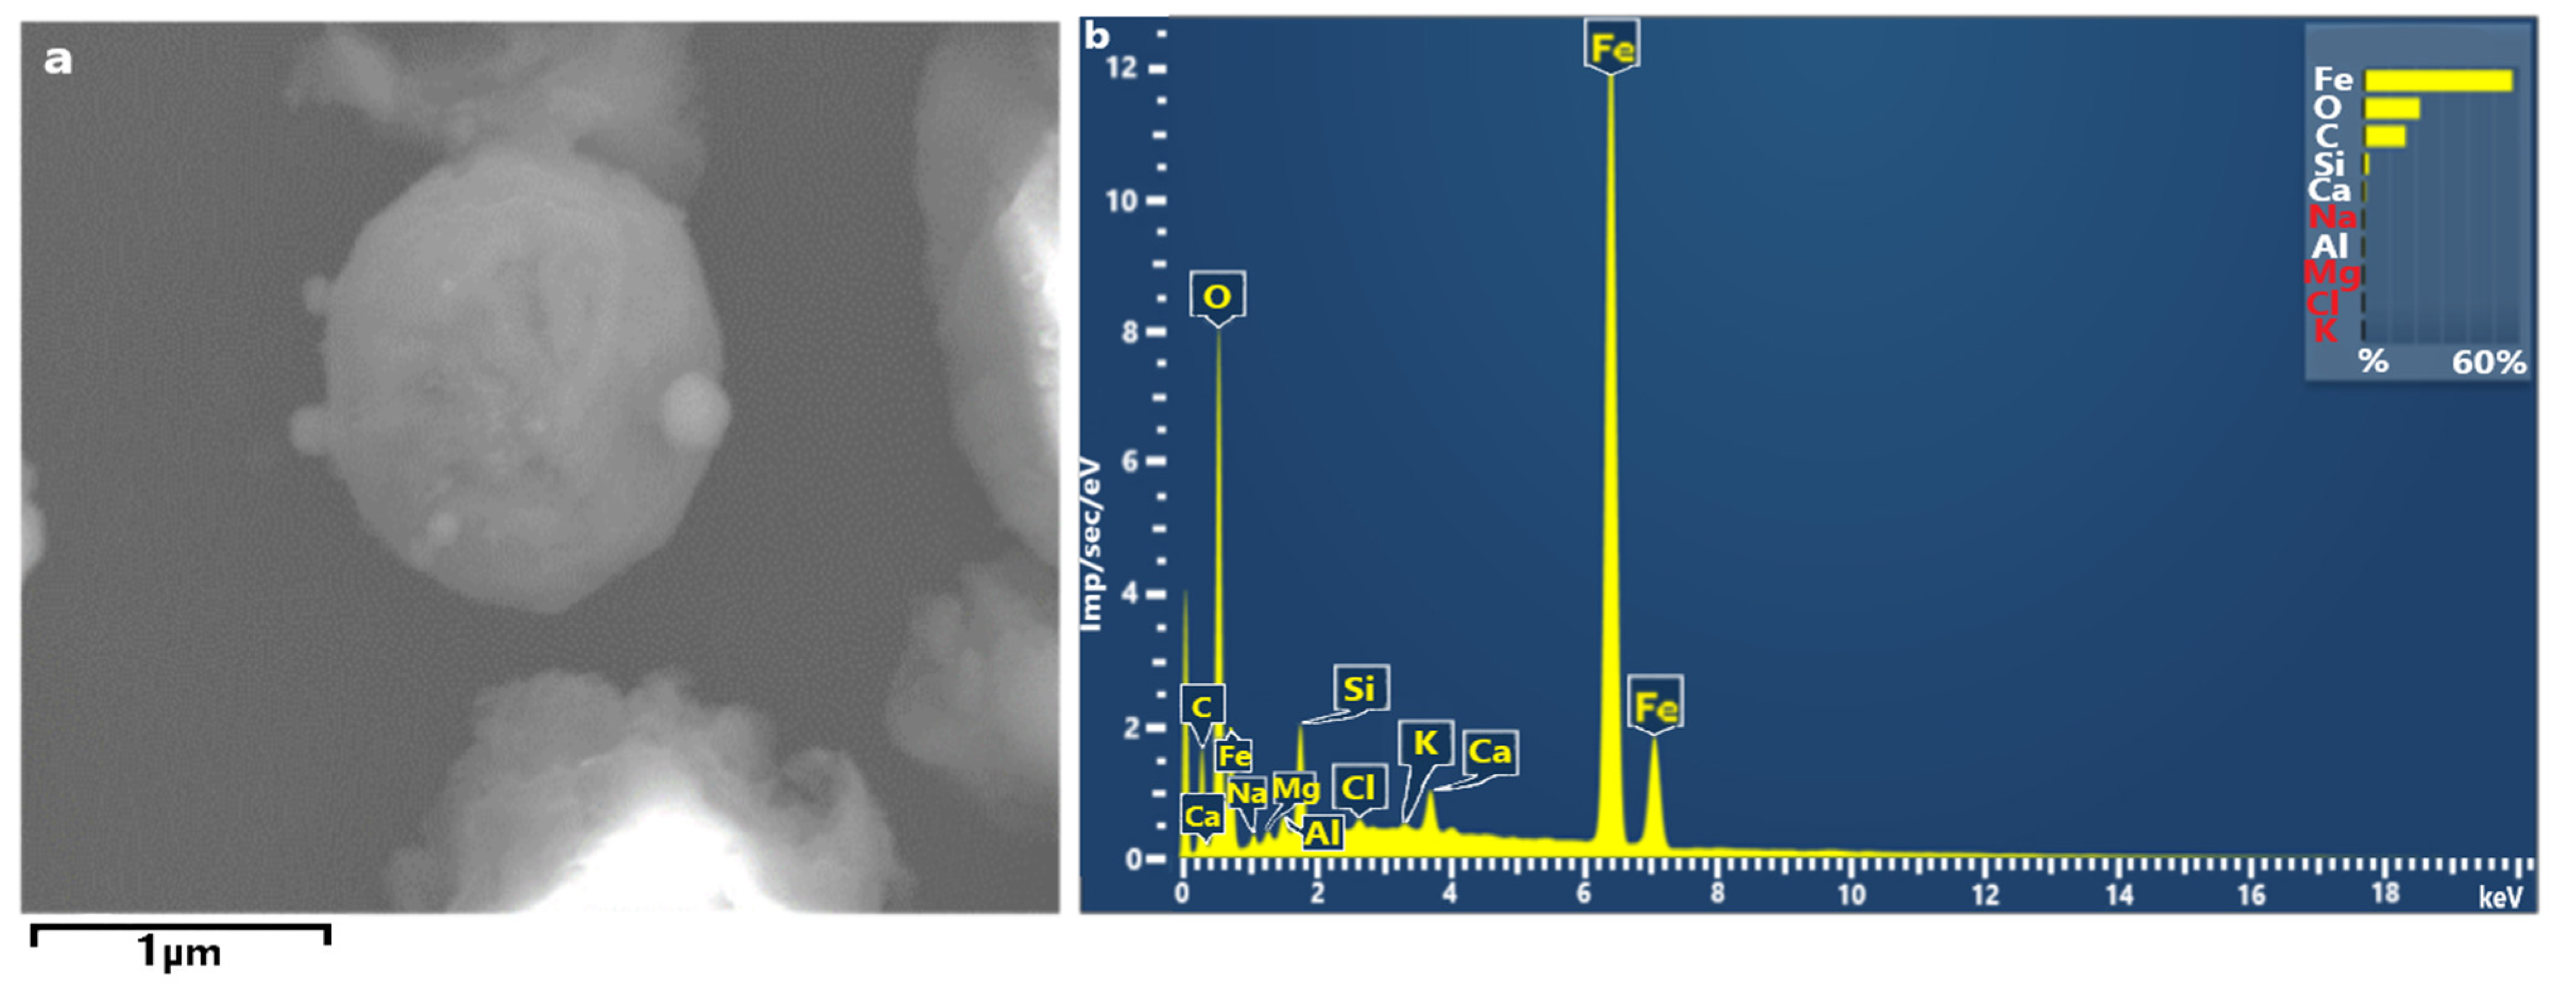
3.2. SEM-EDS Analysis

As the highest concentrations of TEs were observed in PM collected at Station 1, further investigation was performed, using SEM-EDS. Information about the shape and composition of single particles can provide some insight in potential pollution sources as well as the fate of these particles upon inhalation [41]. According to the characteristic SEM-EDS analysis, atmospheric particles collected in the winter of 2020 from the Chelyabinsk urban area (Station 1) contained 20 elements (Al, B, C, Ca, Cl, Cr, Cu, Fe, K, Mg, Mn, N, Na, Ni, O, Pb, S, Si, Ti, and Zn) with concentrations more than the detection limit (0.1 wt.%). The most abundant elements were Fe and Mg which were present in 80–100% of the particles. These particles could be natural occurring aluminosilicates, which is indeed indicated in Figure 4e. This is not surprising as Chelyabinsk stands on sedimentary rocks and granite, typical for the Urals, consisting of oxides Al2O3 (14–15%), SiO2 (70–72%), Fe2O3 (0.7–1.1%), and MgO (0.6–1.1%) [61].
Figure 5 shows the predominant morphologies of carbon-rich (C-rich) particles collected at Station 1. They were regular spherical and spheroidal shapes, with some presenting surface defects such as porosity. The particle size of this type varied in the range of 1–5 μm. These particles are observed in cities with high vehicular traffic density and could be associated with exhaust emissions from automobiles using gasoline or diesel combustibles, as well as fly ash originating from coal-fired power stations [62].
Station 1 had the largest number of sulfur-rich (S-rich) particles, with more than half of them containing more than 3% sulfur. Sulfate PM2.5 is commonly identified as markers of secondary aerosols related to long-distance transport [63,64,65,66,67]. The majority of the sulfate particles had one or more potentially toxic metal inclusions. Figure 6 shows typical rod-shaped, crystalline, and spherical particles. The size of metal-containing S-rich particles was about 1 µm. Most metal particles were classified as Fe-rich (e.g., hematite), Zn-rich (e.g., zinc sulfate and zinc oxide), Pb-rich (e.g., anglesite), Mn-, or Pb-rich, which were likely emitted from road traffic (exhaust and tire, brake, car body, or road surface abrasions) [68]. Station 1 had the highest traffic volume and one can conclude that source of the metals is mostly traffic-related. Metals such as Fe and Zn can be linked to the corrosion of car-body parts. Zn, and Pb can be mostly related to brake-pad erosion; Fe, Cu, Pb, and Zn from brake-disc wear. Road dust and roadside soil often contain metals, including Pb, Cu, Cd, and Zn, indicative of contamination by road traffic emissions and the abrasion of road surfaces. It has been shown that sulfates from aqueous SO2 (S(IV)) oxidation catalyzed by transition metals are an important atmospheric process during winter, an alternative to the photochemical pathway that is highly unlikely because of the ultralow O3 concentrations [68]. Metal catalysis can promote the conversion of SO2 to sulfates in fog droplets [69]. The internal mixing of metals and acidic constituents solubilize metals and modify metal inclusion shapes. The solubilization of metals in airborne particles can increase their toxicity in the particles [70].
Figure 7 shows spherical Fe-rich PM2.5 found at Stations 2 and 3. These particles consisted of iron oxide. They could be steel furnace dust emitted by the metallurgical enterprises which is dumped in numerous slag waste dumps in the Chelyabinsk urban area near Stations 2 and 3. Their size ranges between 0.5 and 2 μm and they present a peculiar morphology; they are characterized by perfect sphericity indicating their smelting iron origin or metallurgical activities in general.

3.3. Health Risk Assessment of Airborne Metal(loid)s

Exposure to PM2.5 bound metal(loid)s may pose serious carcinogenic or non-carcinogenic toxicity in humans depending on various factors such as exposure concentration, duration, and frequency. Health risk assessments of TEs through the inhalation pathway for both children and adult were determined, and the values of HQinh and HI are reported in Table 5.
It was observed that the non-carcinogenic risk for each individual TE was well below the safe level (HQinh = 1) for both groups (adults and children), except HQinh (Mn) value for children at Stations 2 and 3. It was higher than 1 for stations located near metallurgical plants. Exposure to all other TEs through inhalation was within safe limits for all stations. The HQinh of all studied TEs indicated a greater hazard to children than adults. Table 5 shows that HI values were lower than 1 for adults but risks for children were significant. The greatest danger was posed by metallurgical industrial PM emissions containing Mn.
Arsenic, Cr, Cd, Co, Ni, and Pb were considered as carcinogens. The CRA was determined for children and adults and reported in Table 6. The CRA values for Cr and As had higher carcinogenic potential in both populations. The carcinogenic risk of each TEs for both groups were in the range of <1 × 10⁻⁶. The total CRA of all TEs was slightly higher for adults than for children. At Station 1 it was 1.06 × 10⁻⁵ and 1.53 × 10⁻⁵ for children and adults, respectively. It shows the high carcinogenic potential in both populations.

4. Conclusions

In this study the PM2.5, PM10, the PM2.5/PM10 ratio, and the concentrations of major elements (Al and Fe) and TEs (As, Cd, Co, Cr, Cu, Mn, Ni, Pb, and Zn) in PM2.5 and PM10 were determined in an industrialized city, Chelyabinsk, Russia for the period January 2020–December 2020. The new WHO guideline values for 24-h PM mass concentrations were exceeded during all seasons for PM2.5, while the PM10 mass concentrations exceeded it about half the time. The PM levels were lowest in winter. Mass concentrations at Stations 2 and 3 are substantially higher than at Station 1 and could be ascribed to the nearby industrial emissions. The average fine particle ratio (PM2.5/PM10) was 0.8 on average for the recording period, indicating anthropogenic origin. The concentrations of major components in PM were Al (192–324 ng/m3) and Fe (337–732 ng/m3) while Zn (77–206 ng/m3), Mn (10–96 ng/m3), and Pb (11–41 ng/m3) had the highest concentrations among TEs.
SEM-EDS allowed us to provide information about the sources of PM and their potential toxic characteristics. Fe-rich metal particles were observed in industrial polluted stations. Fly ash and S-rich particles were ubiquitous at Station 1, characterized by heavy traffic flows. There is evidence of acid S-rich particles which seem to have solubilized metals from resuspended road dust.
PM2.5-producing industrial processes and transport may contribute to excess exposure of the two population groups (adults and children) to metals. Total non-carcinogenic risk values for children were more than 1 and on average 2.7 times higher than non-carcinogenic risk for adults. The common carcinogenic risk upon inhalation (considering As, Cr, Co, Cd, Ni, and Pb) were higher than 10−6 but less than 10−4 for children and adults. It was indicative of a medium cancer risk during their lifetime. The risk values for adults were slightly higher.
This study shows the importance of site-specific long-term monitoring in dynamic urban environments, such as industrialized cities. The contribution to PM levels form specific sources can be identified, facilitating mitigation steps. In addition, the human health risk can be determined. The latter can inform health professionals and residents, which will empower them to make informed lifestyle choices and diagnosis. The results suggest that measures to reduce air pollution should be implemented through the effective and efficient implementation of urban environment management planning to maintain acceptable urban air quality. The observed concentrations and profiles provide new insights into the sources and dispersion of different types of particle pollution illustrating the importance of adopting sustainable air quality strategies in urban planning of Russian cities.

Supplementary Materials

The following are available online at https://www.mdpi.com/article/10.3390/ijerph182312354/s1, Figure S1: Effect of snowfalls and snow cover on the decrease of air pollution in Chelyabinsk during winter comparing with summer 2020: relative humidity (a) and precipitation (b) in Chelyabinsk during 2020 according [11], Figure S2: Effect of forest fires on the air pollution in Chelyabinsk during summer 2020: number (a) and area of forest fires (b) on the Sverdlovsk region in 2020 compared with 2019 according to [12], wind rose in Chelyabinsk during June-August 2020 (c) according to [11], the map of studied area (d), Table S1: Summary of conducted studies in Russian Federation on metal(loid)s contamination of atmospheric aerosol.

Author Contributions

Conceptualization, S.P.-V., R.H.M.G. and T.G.K.; methodology, T.G.K. and O.V.R.; validation, T.G.K. and O.V.R.; investigation, T.G.K., O.V.R., K.A.B., D.A.P. and A.F.S.; resources, T.G.K. and O.V.R.; data curation, T.G.K. and O.V.R.; writing—original draft preparation, S.P.-V., R.H.M.G. and T.G.K.; writing—review and editing, S.P.-V. and R.H.M.G., visualization, K.A.B., D.A.P. and A.F.S.; supervision, S.P.-V. and R.H.M.G.; project administration, T.G.K. and O.V.R.; funding acquisition, T.G.K. All authors have read and agreed to the published version of the manuscript.

Funding

The research was funded by RFBR and Chelyabinsk Region, project number 20-45-740002 (PM2.5 and PM10 study) and by the Ministry of Science and Higher Education of the Russian Federation, government order FENU-2020-0022 (risk modelling).

Institutional Review Board Statement

Not applicable.

Informed Consent Statement

Not applicable.

Data Availability Statement

Data sharing is not applicable to this article.

Acknowledgments

The authors wish to thank Ekaterina Yudina for SEM measurements.

Conflicts of Interest

The authors declare no conflict of interest.

References

  1. Watson, A.Y.; Bates, R.R.; Kennedy, D. Biological disposition of airborne particles: Basic principles and application to vehicular emissions. In Air Pollution, the Automobile, and Public Health, Watson; Schlesinger, R.B., Ed.; National Academy Press: Washington, DC, USA, 1988; pp. 239–298. [Google Scholar]
  2. GN 2.1.6.2604-10. Hygienic Norms Supplement No. 8 to GN 2.1.6.1338-03. Maximum Permissible Concentrations (MPC) of Pollutants in Atmospheric air of Populated Areas. (Rus). 2010. Available online: https://legalacts.ru/doc/postanovlenie-glavnogo-gosudarstvennogo-sanitarnogo-vracha-rf-ot-19042010-n_1/ (accessed on 23 November 2021).
  3. WHO. Ambient (Outdoor) Air Pollution. 2021. Available online: https://www.who.int/news-room/fact-sheets/detail/ambient-(outdoor)-air-quality-and-health (accessed on 27 September 2021).
  4. Zagorodnov, S.Y.; May, I.V.; Kokoulina, A.A. Fine-disperse particles (PM2.5 and PM10) in atmospheric air of a large industrial region: Issues related to monitoring and standardIzstion of suspended particles in industrial emissions. Gig. Sanit. 2019, 98, 142–147. [Google Scholar] [CrossRef]
  5. Krupnova, T.G.; Rakova, O.V.; Plaksina, A.L.; Gavrilkina, S.V.; Baranov, E.O.; Abramyan, A.D. Short communication: Effect of urban greening and land use on air pollution in Chelyabinsk, Russia. Biodiversitas 2020, 21, 2716–2720. [Google Scholar] [CrossRef]
  6. Blanco-Becerra, L.C.; Gafaro-Rojas, A.I.; Rojas-Roa, N.Y. Influence of precipitation scavenging on the PM2.5/PM10 ratio at the Kennedy locality of Bogotá, Colombia. Rev. Fac. Ing. 2015, 76, 58–65. [Google Scholar] [CrossRef]
  7. Tiwari, J.N.; Tiwari, R.N.; Kim, K.S. Zero-dimensional, one-dimensional, two-dimensional and three-dimensional nanostructured materials for advanced electrochemical energy devices. Prog. Mater. Sci. 2012, 57, 724–803. [Google Scholar] [CrossRef]
  8. Xu, X.-P.; Zhang, X.-C.; Hu, S.-L.; Xu, J.-Y.; Xie, J.-F.; Liu, S.-Q.; Liu, L.; Huang, Y.-Z.; Guo, F.-M.; Yang, Y.; et al. Noninvasive ventilation in acute hypoxemic nonhypercapnic respiratory failure: A systematic review and meta-analysis. Crit. Care. Med. 2017, 45, 727–733. [Google Scholar] [CrossRef]
  9. Khoder, M.I.; Shamy, M.; Alghamdi, M.; Zhong, M. Source apportionment and elemental composition of PM2.5 and PM10 in Jeddah city, Saudi Arabia. Atmos. Pollut. Res. 2012, 3, 331–340. [Google Scholar] [CrossRef] [Green Version]
  10. Xu, G.; Jiao, L.; Zhang, B.; Zhao, S.; Yuan, M.; Gu, Y.; Liu, J.; Tang, X. Spatial and temporal variability of the PM2.5/PM10 ratio in Wuhan, Central China. Aerosol Air Qual. Res. 2017, 17, 741–751. Available online: https://aaqr.org/articles/aaqr-16-09-oa-0406 (accessed on 20 September 2021). [CrossRef] [Green Version]
  11. Zhou, X.Z.; Cao, Y.; Ma, L.; Wang, R. Concentrations, correlations and chemical species of PM2.5/PM10 based on published data in China: Potential implications for the revised particulate standard. Chemosphere 2016, 144, 518–526. [Google Scholar] [CrossRef]
  12. He, K.; Yang, F.; Ma, Y.; Zhang, Q.; Yao, X.H.; Chan, C.K.; Cadle, S.H.; Chan, T.; Mulawa, P.A. The characteristics of PM2.5 in Beijing, China. Atmos. Environ. 2001, 35, 4959–4970. [Google Scholar] [CrossRef]
  13. Parkhurst, W.J.; Tanner, R.L.; Weatherford, F.P.; Valente, R.J.; Meagher, J.F. Historic PM2.5/PM10 concentrations in the southeastern United States–Potential implications of the revised particulate matter standard. J. Air Waste Manag. Assoc. 1999, 49, 1060–1067. [Google Scholar] [CrossRef]
  14. Abuelgasim, A.; Farahat, A. Investigations on PM10, PM2.5, and their ratio over the emirate of Abu Dhabi, United Arab Emirates. Earth Syst. Environ. 2020, 4, 763–775. [Google Scholar] [CrossRef]
  15. Adamiec, E.; Jarosz-Krzeminska, E. Human health risk assessment associated with contaminants in the finest fraction of sidewalk dust collected in proximity to trafficked roads. Sci. Rep. 2019, 9, 16364. [Google Scholar] [CrossRef]
  16. De Oliveira, B.F.A.; Ignotti, E.; Artaxo, P.; do Nascimento Saldiva, P.H.; Junger, W.L.; Hacon, S. Risk assessment of PM2.5 to child residents in Brazilian Amazon region with biofuel production. Environ. Health 2012, 11, 64. [Google Scholar] [CrossRef] [PubMed] [Green Version]
  17. Baglaeva, E.M.; Sergeev, A.P.; Buevich, A.G.; Subbotina, I.E.; Shichkin, A.V. Particulate matter size distribution in air surface layer of Middle Ural and Arctic territories. Atmos. Pollut. Res. 2019, 10, 1220–1226. [Google Scholar] [CrossRef]
  18. Atmas Device. Available online: https://ntm.ru/products/150/8342 (accessed on 1 November 2021).
  19. Krupnova, T.G.; Rakova, O.V.; Gavrilkina, S.V.; Antoshkina, E.G.; Baranov, E.O.; Yakimova, O.N. Road dust trace elements contamination, sources, dispersed composition, and human health risk in Chelyabinsk, Russia. Chemosphere 2020, 261, 127799. [Google Scholar] [CrossRef] [PubMed]
  20. Shi, G.; Chen, Z.; Bi, C.; Wang, L.; Teng, J.; Li, Y.; Xu, S. A comparative study of health risk of potentially toxic metals in urban and suburban road dust in the most populated city of China. Atmos. Environ. 2011, 45, 764–771. [Google Scholar] [CrossRef]
  21. MohseniBandpi, A.; Eslami, A.; Shahsavani, F.; Khodagholi, A.; Alinejad, A. Physicochemical characterization of ambient PM2.5 in Tehran air and its potential cytotoxicity in human lung epithelial cells (A549). Sci. Total Environ. 2017, 293, 182–190. [Google Scholar] [CrossRef]
  22. USEPA—United States Environmental Protection Agency. Child-Specific Exposure Factors Handbook; National Center for Environmental Assessment: Washington, DC, USA, 2002; EPA/600/P-00/002B; Available online: https://clu-in.org/download/contamiantfocus/sediments/Child-Specific-EFH.pdf (accessed on 23 November 2021).
  23. Krupnova, T.G.; Rakova, O.V.; Mashkova, I.V.; Artyukov, E.V.; Vlasov, N.E. Health risk assessment of metal(loid)s exposure via indoor dust from urban area in Chelyabinsk, Russia. Int. J. GEOMATE 2019, 16, 1–7. Available online: https://www.geomatejournal.com/sites/default/files/articles/1-7-16501-Tatyana-March-2019-55g.pdf (accessed on 27 September 2021). [CrossRef]
  24. MohseniBandpi, A.; Eslami, A.; Ghaderpoori, M.; Shahsavani, A.; KhaniJeihooni, A.; Ghaderpoury, A.; Alinejad, A. Health risk assessment of heavy metals on PM2.5 in Tehran air, Iran. Data Brief 2018, 17, 347–355. [Google Scholar] [CrossRef] [PubMed]
  25. Ghasemi, F.F.; Dobaradaran, S.; Saeedi, R.; Nabipour, I.; Nazmara, S.; Vakil Abadi, D.R.; Arfaeinia, H.; Ramavandi, R.; Spitz, J.; Mohammadi, M.J.; et al. Levels and ecological and health risk assessment of PM2.5-bound heavy metals in the northern part of the Persian Gulf. Environ. Sci. Pollut. Res. 2020, 27, 5305–5313. [Google Scholar] [CrossRef] [PubMed]
  26. USEPA—United States Environmental Protection Agency. Supplemental Guidance for Developing Soil Screening Levels for SuperFund Sites. Office of Emergency and Remedial. Office of Emergency and Remedial Response U.S. Environmental Protection Agency Washington, DC 20460; 2002. Available online: https://semspub.epa.gov/work/HQ/175878.pdf (accessed on 19 September 2021).
  27. Zhou, W.; Liu, H.; Xiang, J.; Zheng, J.; Yao, R.; Liu, S.; Liu, T.; Zhang, J.; Zhan, C.; Xiao, W.; et al. Assessment of elemental components in atmospheric particulate matter from a typical mining city, central China: Size distribution, source characterization and health risk. Bull. Environ. Contam. Toxicol. 2020, 105, 941–950. [Google Scholar] [CrossRef] [PubMed]
  28. Meditsina. Guidelines Human Health Risk Assessment from Environmental Chemicalst; Federal Center of State Sanitary and Epidemiological Supervision of the Ministry of Health of the Russian Federation: Moscow, Russia, 2004. [Google Scholar]
  29. Shabbaj, I.I.; Alghamdi, M.A.; Shamy, M.; Hassan, S.K.; Alsharif, M.M.; Khoder, M.I. Risk assessment and implication of human exposure to road dust heavy metals in Jeddah, Saudi Arabia. Int. J. Environ. Res. Public Health 2018, 15, 36. [Google Scholar] [CrossRef] [PubMed] [Green Version]
  30. Lu, X.; Wang, L.; Lei, K.; Huang, J.; Zhai, Y. Contamination assessment of copper, lead, zinc, manganese and nickel in street dust of Baoji, NW China. J. Hazard. Mater. 2010, 173, 744–749. [Google Scholar] [CrossRef]
  31. Li, X.; Poon, C.-S.; Liu, P.S. Heavy metal contamination of urban soils and street dusts in Hong Kong. Appl. Geochem. 2011, 16, 1361–1368. [Google Scholar] [CrossRef]
  32. USEPA—United States Environmental Protection Agency. Risk Assessment Guidance for Superfund. Human Health Evaluation Manual (Part A). Office of Emergency and Remedial Response U.S. Environmental Protection Agency Washington, DC. 20450; 1989. Available online: https://www.epa.gov/sites/production/files/2015-09/documents/rags_a.pdf (accessed on 19 September 2021).
  33. USEPA—United States Environmental Protection Agency. Guidelines for Carcinogen Risk Assessment. Tables, Washington. 51 FR 33992–34003; 1986. Available online: https://www.epa.gov/sites/production/files/2014-05/documents/table1.pdf (accessed on 19 September 2021).
  34. Brown, A.; Barrett, J.E.S.; Robinson, H.; Potgieter-Vermaak, S. Risk assessment of exposure to particulate output of a demolition site. Environ. Geochem. Health 2015, 37, 675–687. [Google Scholar] [CrossRef]
  35. Potgieter-Vermaak, S.; Rotondo, G.; Novakovic, V.; Rollins, S.; van Grieken, R. Component-specific toxic concerns of the inhalable fraction of urban road dust. Environ. Geochem. Health 2012, 34, 689–696. [Google Scholar] [CrossRef]
  36. Yadav, I.S.; Devi, N.L.; Singh, V.K.; Li, J.; Zhang, G. Spatial distribution, source analysis, and health risk assessment of heavy metals contamination in house dust and surface soil from four major cities of Nepal. Chemosphere 2019, 218, 1100–1113. [Google Scholar] [CrossRef] [PubMed]
  37. Cheng, Z.; Chen, L.-J.; Li, H.-H.; Lin, Z.-B.; Yang, Y.Y.; Xu, X.-X.; Xian, J.-R.; Shao, J.-R.; Zhu, X.-M. Characteristics and health risk assessment of heavy metals exposure via household dust from an urban area in Chengdu, China. Sci. Total Environ. 2018, 619, 621–629. [Google Scholar] [CrossRef]
  38. Genga, A.; Baglivi, F.; Siciliano, M.; Siciliano, T.; Tepore, M.; Micocci, G.; Tortrella, C.; Aiello, D. SEM-EDS investigation on PM10 data collected in Central Italy: Principal component analysis and hierarchical cluster analysis. Chem. Cent. J. 2012, 6, S3. [Google Scholar] [CrossRef] [Green Version]
  39. Ramirez-Leal, R.; Valle-Martinez, M.; Cruz-Campas, M. Chemical and morphological study of PM10 analysed by SEM-EDS. OJAP 2014, 3, 121–129. [Google Scholar] [CrossRef] [Green Version]
  40. Fanizza, C.; De Berardis, B.; Ietto, F.; Soggiu, M.E.; Schirò, R.; Inglessis, M.; Ferdinandi, M.; Incoronato, F. Analysis of major pollutants and physico-chemical characteristics of PM2.5 at an urban site in Rome. Sci. Total Environ. 2018, 616, 1457–1468. [Google Scholar] [CrossRef] [PubMed]
  41. Longoria-Rodríguez, F.E.; González, L.T.; Mancilla, Y.; Acuña-Askar, K.; Arizpe-Zapata, J.A.; González, J.; Kharissova, O.V.; Mendoza, A. Sequential SEM-EDS, PLM, and MRS microanalysis of individual atmospheric particles: A useful tool for assigning emission sources. Toxics 2021, 9, 37. [Google Scholar] [CrossRef] [PubMed]
  42. The Main Department of Forests of the Chelyabinsk Region. 2021. Available online: https://priroda.gov74.ru/forest/activities/protecting/Lesnyepozhary.htm (accessed on 27 September 2021).
  43. Tunno, B.J.; Dalton, R.; Michanowicz, D.R.; Shmool, J.L.C.; Kinnee, E.; Tripathy, S.; Cambal, L.; Clougherty, J.E. Spatial patterning in PM2.5 constituents under an inversion-focused sampling design across an urban area of complex terrain. J. Exp. Sci. Environ. Epidemiol. 2016, 26, 385–396. [Google Scholar] [CrossRef] [PubMed] [Green Version]
  44. Katsoulis, B.D. Some meteorological aspects of air pollution in Athens, Greece. Meteorol. Atmos. Phys. 1998, 39, 203–212. [Google Scholar] [CrossRef]
  45. Chelyabinsk Hydrometeocenter. 2020. Available online: http://www.chelpogoda.ru/pages/244.php (accessed on 20 September 2021).
  46. Vlasov, D.V.; Eremina, I.D.; Shinkareva, G.L.; Chubarova, N.E.; Kasimov, N.S. Daily variations in wet deposition and washout rates of potentially toxic elements in Moscow during spring season research paper. GES J. 2021, 14, 219–233. [Google Scholar] [CrossRef]
  47. Krupnova, T.G.; Rakova, O.V.; Struchkova, G.P.; Tikhonova, S.A.; Kapitonova, T.A.; Gavrilkina, S.V.; Bulanova, A.V.; Yakimova, O.N. Insights into particle-bound metal(Loid)s in winter snow cover: Geochemical monitoring of the korkinsky coal mine area, south Ural region, Russia. Sustainability 2021, 13, 4596. [Google Scholar] [CrossRef]
  48. Tian, X.; Cui, K.; Sheu, H.-L.; Hsieh, Y.-K.; Yu, F. Effects of rain and snow on the air quality index, PM2.5 levels, and dry deposition flux of PCDD/Fs. Aerosol Air Qual. Res. 2021, 21, 210158. [Google Scholar] [CrossRef]
  49. Das, R.; Khezri, B.; Srivastava, B.; Datta, S.; Sikdar, P.K.; Webster, R.D.; Wang, X. Trace element composition of PM2. 5 and PM10 from Kolkata–a heavily polluted Indian metropolis. Atmos. Pollut. Res. 2015, 6, 742–750. [Google Scholar] [CrossRef]
  50. Adães, J.; Pires, J.C.M. Analysis and modelling of PM2.5 temporal and spatial behaviors in European cities. Sustainability 2019, 11, 6019. [Google Scholar] [CrossRef] [Green Version]
  51. Short-term Economic Indicators of the Chelyabinsk Region. Available online: https://chelstat.gks.ru/publication_collection/document/42359 (accessed on 2 November 2021).
  52. European Commission. Air Quality Standarts. Available online: https://ec.europa.eu/environment/air/quality/standards.htm (accessed on 2 October 2021).
  53. Agarwal, A.; Mangal, A.; Satsangi, A.; Lakhani, A.; Maharaj Kumari, K. Characterization, sources and health risk analysis of PM2.5 bound metals during foggy and non-foggy days in sub-urban atmosphere of Agra. Atmos. Res. 2017, 197, 121–131. [Google Scholar] [CrossRef]
  54. Li, H.; Wu, H.; Wang, Q.; Yang, M.; Li, F.; Sun, Y.; Qian, X.; Wang, J.; Wang, C. Chemical partitioning of fine particle-bound metals on haze–fog and non-haze–fog days in Nanjing, China and its contribution to human health risks. Atmos. Res. 2017, 183, 142–150. [Google Scholar] [CrossRef]
  55. Behera, S.N.; Sharma, M. Reconstructing primary and secondary components of PM2.5 composition for an Urban Atmosphere. Aerosol Sci. Technol. 2010, 44, 983–992. [Google Scholar] [CrossRef] [Green Version]
  56. Polezer, G.; Oliveira, A.; Potgieter-Vermaak, S.; Godoi, A.F.L.; de Souza, R.A.F.; Yamamoto, C.I.; Andreoli, R.V.; Medeiros, A.S.; Machado, C.M.D.; dos Santos, E.O.; et al. The influence that different urban development models has on PM2.5 elemental and bioaccessible. Sci. Rep. 2019, 9, 14846. [Google Scholar] [CrossRef]
  57. Wiseman, C.L.S.; Zereini, F. Characterizing metal(loid) solubility in airborne PM10, PM2.5 and PM1 in Frankfurt, Germany using simulated lung fluids. Atmos. Environ. 2014, 89, 282–289. [Google Scholar] [CrossRef]
  58. Contini, D.; Cesari, D.; Donateo, A.; Chirizzi, D.; Belosi, F. Characterization of PM10 And PM2.5 and their metals content in different typologies of sites in South-Eastern Italy. Atmosphere 2014, 5, 435–453. [Google Scholar] [CrossRef] [Green Version]
  59. Poulakis, E.; Theodosi, C.; Bressi, M.; Sciare, J.; Ghersi, V.; Mihalopoulos, N. Airborne mineral components and trace metals in Paris region: Spatial and temporal variability. Environ. Sci. Pollut. Res. 2015, 22, 14663–14672. [Google Scholar] [CrossRef] [PubMed]
  60. Theodosi, C.; Grivas, G.; Zarmpas, P.; Chaloulakou, A.; Mihalopoulos, N. Mass and chemical composition of size-segregated aerosols (PM1, PM2.5, PM10) over Athens, Greece: Local versus regional sources. Atmos. Chem. Phys. 2011, 11, 11895–11911. [Google Scholar] [CrossRef] [Green Version]
  61. Baranovsky, A.G. Analysis of the Variability of the Composition, Structure and Physical and Mechanical Properties of Eluvial Clay Soils and the Possibility of their Prediction: On the Example of Chelyabinsk. Ph.D. Thesis, MGSU, Moscow, Russia, 2017. [Google Scholar]
  62. González, L.T.; Longoria Rodríguez, F.E.; Sánchez-Domínguez, M.; Leyva-Porras, C.; Silva-Vidaurri, L.G.; Acuna-Askar, K.; Kharisov, B.I.; Villarreal Chiu, J.F.; Alfaro Barbosa, J.M. Chemical and morphological characterization of TSP and PM2.5 by SEM-EDS, XPS and XRD collected in the metropolitan area of Monterrey, Mexico. Atmos. Environ. 2016, 143, 249–260. [Google Scholar] [CrossRef]
  63. Cozzi, F.; Pellegrini, I.; Adami, G.; Reisenhofer, E.; Bovenzi, M.; Barbieri, P. Sulphur speciation of PM10 samples by XANES spectroscopy. Cent. Eur. J. Chem. 2009, 7, 395–401. [Google Scholar] [CrossRef] [Green Version]
  64. Cheng, X.; Huang, Y.; Zhang, S.-P.; Ni, S.-J.; Long, Z.-J. Characteristics, sources, and health risk assessment of trace elements in PM10 at an urban site in Chengdu, Southwest China. Aerosol Air Qual. Res. 2018, 18, 357–370. [Google Scholar] [CrossRef] [Green Version]
  65. Waked, A.; Favez, O.; Alleman, L.Y.; Piot, C.; Petit, J.-E.; Delaunay, T.; Verlinden, E.; Golly, B.; Besombes, J.-L.; Jaffrezo, J.-L.; et al. Source apportionment of PM10 in a north-western Europe regional urban background site (Lens, France) using positive matrix factorization and including primary biogenic emissions. Atmos. Chem. Phys. 2014, 14, 3325–3346. [Google Scholar] [CrossRef] [Green Version]
  66. Lin, M.; Chan, I.-N.; Chan, C.-Y.; Wang, X.-M.; Dong, H.-Y. Emerging air pollution issues in changing pearl river delta of south China. In The Impact of Air Pollution on Health, Economy, Environment and Agricultural Sources; Khallaf, M., Ed.; IntechOpen: London, UK, 2011; pp. 199–214. [Google Scholar]
  67. Shah, R.U.; Coggon, M.M.; Gkatzelis, G.I.; McDonald, B.C.; Tasoglou, A.; Huber, H.; Gilman, J.; Warneke, C.; Robinson, A.L.; Presto, A.A. Urban oxidation flow reactor measurements reveal significant secondary organic aerosol contributions from volatile emissions of emerging importance. Environ. Sci. Technol. 2020, 54, 714–725. [Google Scholar] [CrossRef] [PubMed]
  68. Penkała, M.; Ogrodnik, P.; Rogula-Kozłowska, W. Particulate matter from the road surface abrasion as a problem of non-exhaust emission control. Environments 2018, 5, 9. [Google Scholar] [CrossRef] [Green Version]
  69. Li, W.; Zhou, S.; Wang, X.; Xu, Z.; Yuan, C.; Yu, Y.; Zhang, Q.; Wang, W. Integrated evaluation of aerosols from regional brown hazes over northern China in winter: Concentrations, sources, transformation, and mixing states. J. Geophys. Res. 2001, 116, D09301. [Google Scholar] [CrossRef]
  70. Desboeufs, K.V.; Sofikitis, A.; Losno, R.; Colin, J.L.; Ausset, P. Dissolution and solubility of trace metals from natural and anthropogenic aerosol particulate matter. Chemosphere 2005, 58, 195–203. [Google Scholar] [CrossRef]
Figure 1. The area under study and the observation instruments used to record data. (a) Chelyabinsk (Russia) and the location of the three sampling stations. (b) Atmas (NTM Protection, Moscow, Russia) device, providing simultaneous measurement of the hourly data of PM2.5 and PM10. (c). The aerosol cascade impactor sampler.
Ijerph 18 12354 g001
Figure 2. 24-h PM10 and PM2.5 concentration measured in 2020 by the Atmas device.
Ijerph 18 12354 g002
Figure 3. PM2.5/PM10 ratio levels.
Ijerph 18 12354 g003
Figure 4. (a) SEM micrograph (magnification 500×), (b) chemical mapping of the most abundant elements, and (c) EDS spectrum of aggregate particles from the aluminosilicate group (d), maps rod-like particles consisting of K, Ca, S, and O that could be potassium and calcium sulfates (e), and plates consisting of Fe-Mg-enriched aluminosilicates.
Ijerph 18 12354 g004
Figure 5. C-rich particles, (a) SEM micrograph (magnification 500×) and (b) EDX spectrum.
Ijerph 18 12354 g005
Figure 6. SEM micrograph S-rich rod-shaped, crystalline, and spherical (magnification 5000×, 3000×, and 10,000×) particles (a,c,e, respectively) and their EDS spectrum (b,d,f, respectively).
Ijerph 18 12354 g006
Figure 7. (a) SEM micrograph Fe-rich particles (magnification 6000×) and (b) their EDS spectrum.
Ijerph 18 12354 g007
Table 1. Limits of detection and recovery rate for different elements.
LOD (ng/m3)Recovery (%)
Al0.197
As0.398
Cd0.5109
Co0.198
Cr1.187
Cu1.8110
Fe1.1105
Mn0.495
Ni1.489
Pb4.2119
Zn0.1107
LOD is limit of detection.
Table 2. Values of exposure factors for elemental doses for children and adults.
FactorUnitValueReferences
ChildrenAdults
EFdays/year350350[26,28,29]
EDyears624[22,26,28,29]
BWkg1570[22,26,28,29,30]
ATnon-carcdays365 × ED365 × ED[22,28,29,30]
ATcarcdays365 × 70365 × 70[26,28,29]
InhRm3/days7.612.8[22,26,28,29,31]
EF is exposure frequency; ED is exposure duration; BW is average body weight; ATnon-car and ATcarc are average times for non-carcinogens and for carcinogens, respectively; InhR is the inhalation rate.
Table 3. The annual average concentrations (ng/m3) of metal(loid)s in PM2.5 and PM10 at recording stations in Chelyabinsk.
PM2.5PM10
Metal(loid)Station 1
(n = 20)
Station 2
(n = 19)
Station 3
(n = 21)
Station 1
(n = 20)
Station 2
(n = 19)
Station 3
(n = 21)
Al192 ± 42303 ± 66268 ± 58324 ± 71319 ± 66324 ± 71
As9.2 ± 3.62.2 ± 0.91.4 ± 0.69.2 ± 3.96.1 ± 2.51.9 ± 0.8
Cd1.0 ± 0.40.7 ± 0.30.6 ± 0.21.0 ± 0.50.6 ± 0.30.7 ± 0.3
Co0.2 ± 0.10.4 ± 0.10.4 ± 0.10.2 ± 0.10.1 ± 0.10.4 ± 0.1
Cr2.5 ± 0.43.5 ± 0.63.0 ± 0.58.4 ±1.3 1.7 ± 0.33.6 ± 0.6
Cu11 ± 26.5 ± 1.15.7 ± 1.013 ±2 5.4 ± 0.88.0 ± 1
Fe417 ± 98693 ± 163651 ± 153337 ± 79474 ± 101732 ± 173
Mn21 ± 535 ± 930 ± 896 ± 2410 ± 338 ± 10
Ni3.4 ±1.01.5 ± 0.41.4 ± 0.43.2 ± 1.01.7 ± 0.51.6 ± 0.5
Pb27 ± 515 ± 311 ± 241 ± 924 ± 515 ± 3
Zn115 ± 19147 ± 25142 ± 21206 ± 3477 ± 12144 ± 24
Table 4. Comparison between metal(loid)s (ng/m3) and PM2.5 (μg/m3) concentrations at different sites in the world.
AreaPM2.5 (24-h Mean)AlAsCdCoCrCuFeMnNiPbZnRefs
Standard Limits 15 6 5 20 50 [3,52]
Agra (India) 131–189 1388–1688 17–35 22–26 3–4 309–354 190–210 3440–4290 58–82 61–67 320–670 319–758 [53]
Nanjing (China) 281 1662 * 28 * 8.4 * 1.6 * 42 * 137 * 1163 * 123 * 27 * 448 * 878 * [54]
Kanpur (India) 172 109 16 34 - 52 627 308 114 7 318 408 [55]
Chelyabinsk (Russia) 5–56 192–303 1.4–9.2 0.6–1.0 0.2–0.4 1.5–3.5 5.7–11 417–493 21–35 1.4–3.4 11–27 115–147 This study
Curitiba (Brazil) 9.2 * 1.7 * 2.2* 8.05 * 4.3 * [56]
Manaus (Brazil) 9.2 * 3.1 * 9.6* 12.1 * 19.9 * [56]
Frankfurt (Germany) 0.4–1.8 0.1–0.8 4.4–17 13–121 4.6–40 2.3–10 0.6–46 [57]
Salentum Peninsula (Italy) 6–92 1.7–207 0.1–13.5 0.1–31.3 0.9–416.9 0.1–8.4 0.2–30.4 0.9–65.7 2.1–154.1 [58]
Paris (France) 33 * 0.16 * 3.6 * 36 * 128 * 3.1 * 1.5 * 5.6 * 28 * [59]
Athens (Greece) 1 * 11 * 41 * 1024 * 19 * 11 * 16* [60]
* Mean values.
Table 5. The values of hazard quotient (HQinh) for children and adults in various stations.
TEChildrenAdults
Station 1Station 2Station 3Station 1Station 2Station 3
As1.49 × 10−23.55×10−32.26 × 10−35.35 × 10−31.28 × 10−30.82 × 10⁻³
Cd4.86 × 10−23.40 × 10−22.92 × 10−21.75 × 10−21.23 × 10−21.05 × 10⁻²
Co1.70 × 10−23.40 × 10−23.40 × 10−26.14 × 10−31.23 × 10−21.23 × 10⁻²
Cr4.25 × 10−25.95 × 10−25.09 × 10−21.53 × 10−22.15 × 10−21.84 × 10⁻²
Cu1.33 × 10−47.86 × 10−56.89 × 10−54.80 × 10−52.84 × 10−52.49 × 10⁻⁵
Mn0.711.191.020.260.430.37
Ni1.18 × 10−15.21 × 10−24.86 × 10−24.26 × 10−21.88 × 10−21.75 × 10⁻²
Pb6.56 × 10−23.64 × 10−22.67 × 10−22.37 × 10−21.32 × 10−20.97 × 10⁻²
Zn0.93 × 10−31.19 × 10−31.15 × 10−30.34 × 10−30.43 × 10−30.42 × 10⁻³
Hazard Index (HI)1.021.411.210.370.510.44
Table 6. The calculated values of carcinogenic risk for adults and children in the present study.
MetalsChildrenAdults
Station 1Station 2Station 3Station 1Station 2Station 3
As5.75 × 10−61.37 × 10−68.74 × 10−78.29 × 10−61.98 × 10−61.26 × 10⁻⁶
Cd2.62 × 10−71.84 × 10−71.57 × 10−73.79 × 10−72.65 × 10−72.27 × 10⁻⁷
Co8.16 × 10−81.63 × 10−71.63 × 10−71.18 × 10−72.36 × 10−72.36 × 10⁻⁷
Cr (VI)4.27 × 10−65.98 × 10−65.12 × 10−66.16 × 10−68.63 × 10−67.39 × 10−6
Ni1.68 × 10−77.43 × 10−86.94 × 10−82.43 × 10−71.07 × 10−71.00 × 10⁻⁷
Pb4.72 × 10−82.62 × 10−81.92 × 10−86.82 × 10−83.79 × 10−82.78 × 10⁻⁸
Total risk1.06 × 10−57.80 × 10−66.41 × 10−61.53 × 10−51.13 × 10−59.25 × 10⁻⁶
Publisher’s Note: MDPI stays neutral with regard to jurisdictional claims in published maps and institutional affiliations.

