
Identification of Groundwater Contamination in a Rapidly Urbanized Area on a Regional Scale: A New Approach of Multi-Hydrochemical Evidences


Abstract
:1. Introduction
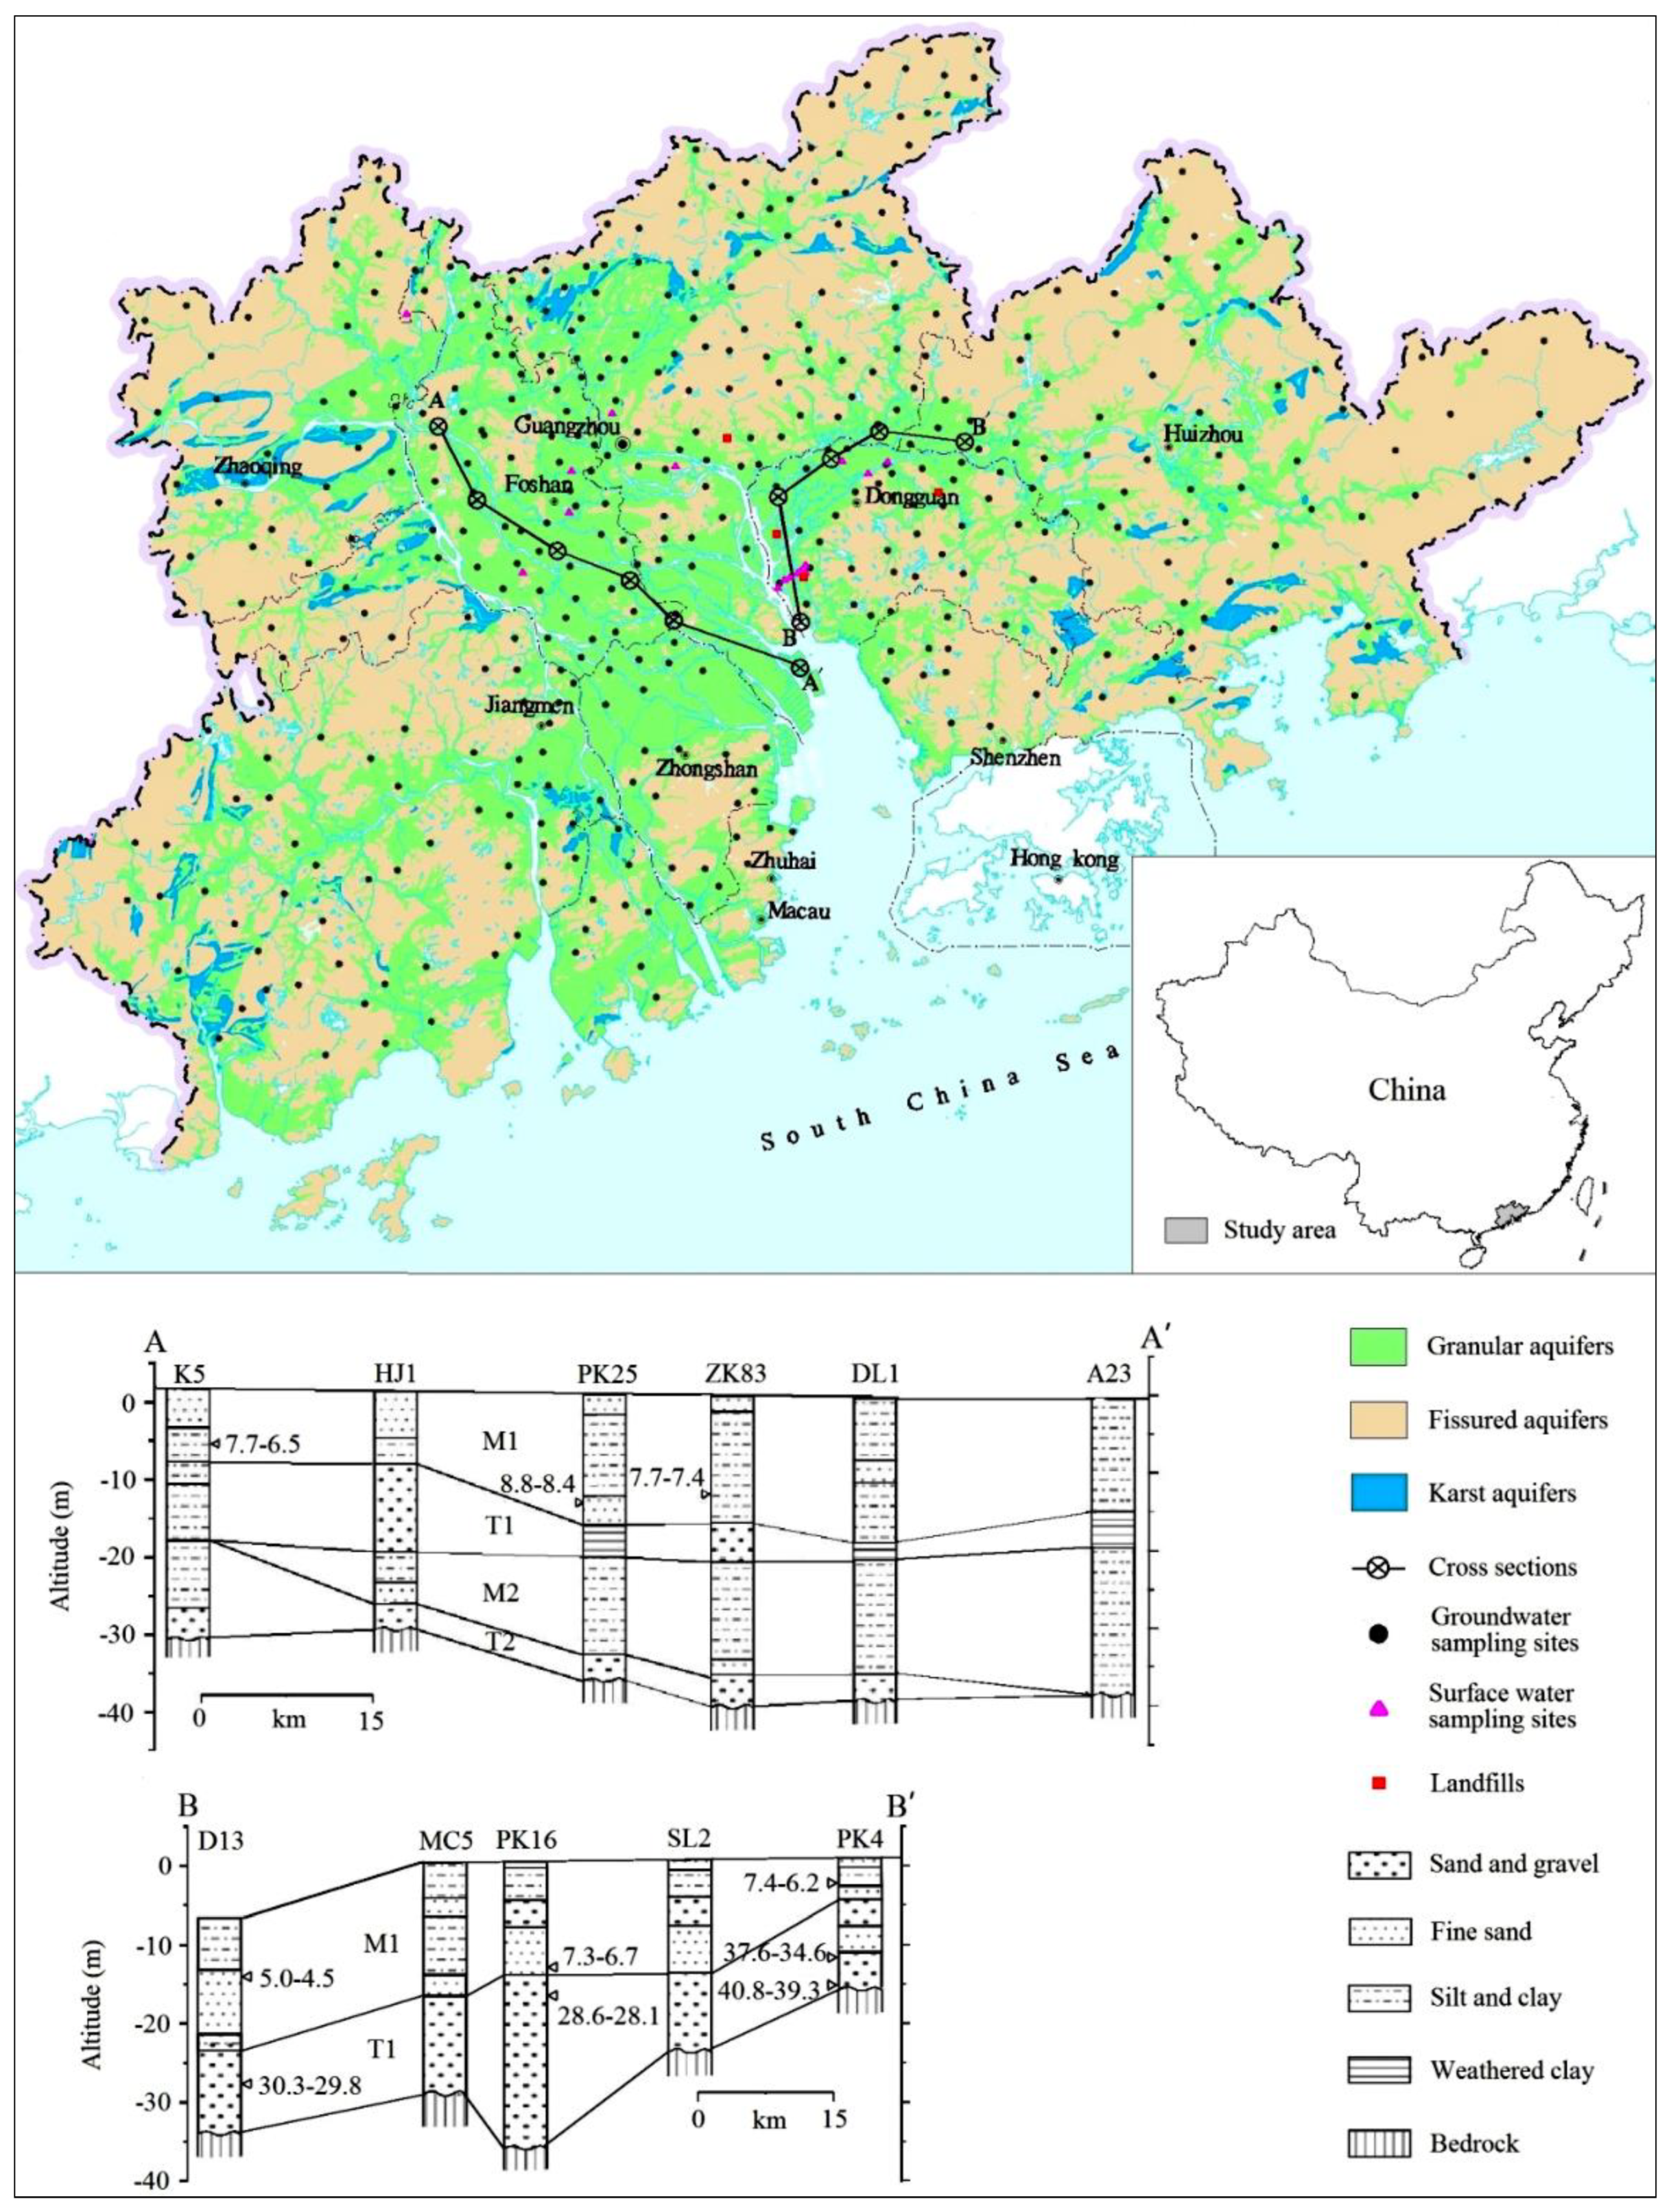
2. Study Area
2.1. Geographical Conditions
2.2. Geological and Hydrogeological Settings
2.3. Characteristics of Urbanization in the PRD
3. Materials and Methods
3.1. Sampling and Analytical Techniques
3.2. Socioeconomic Data
3.3. Hierarchical Cluster Analysis and Principal Component Analysis
4. Results and Discussion
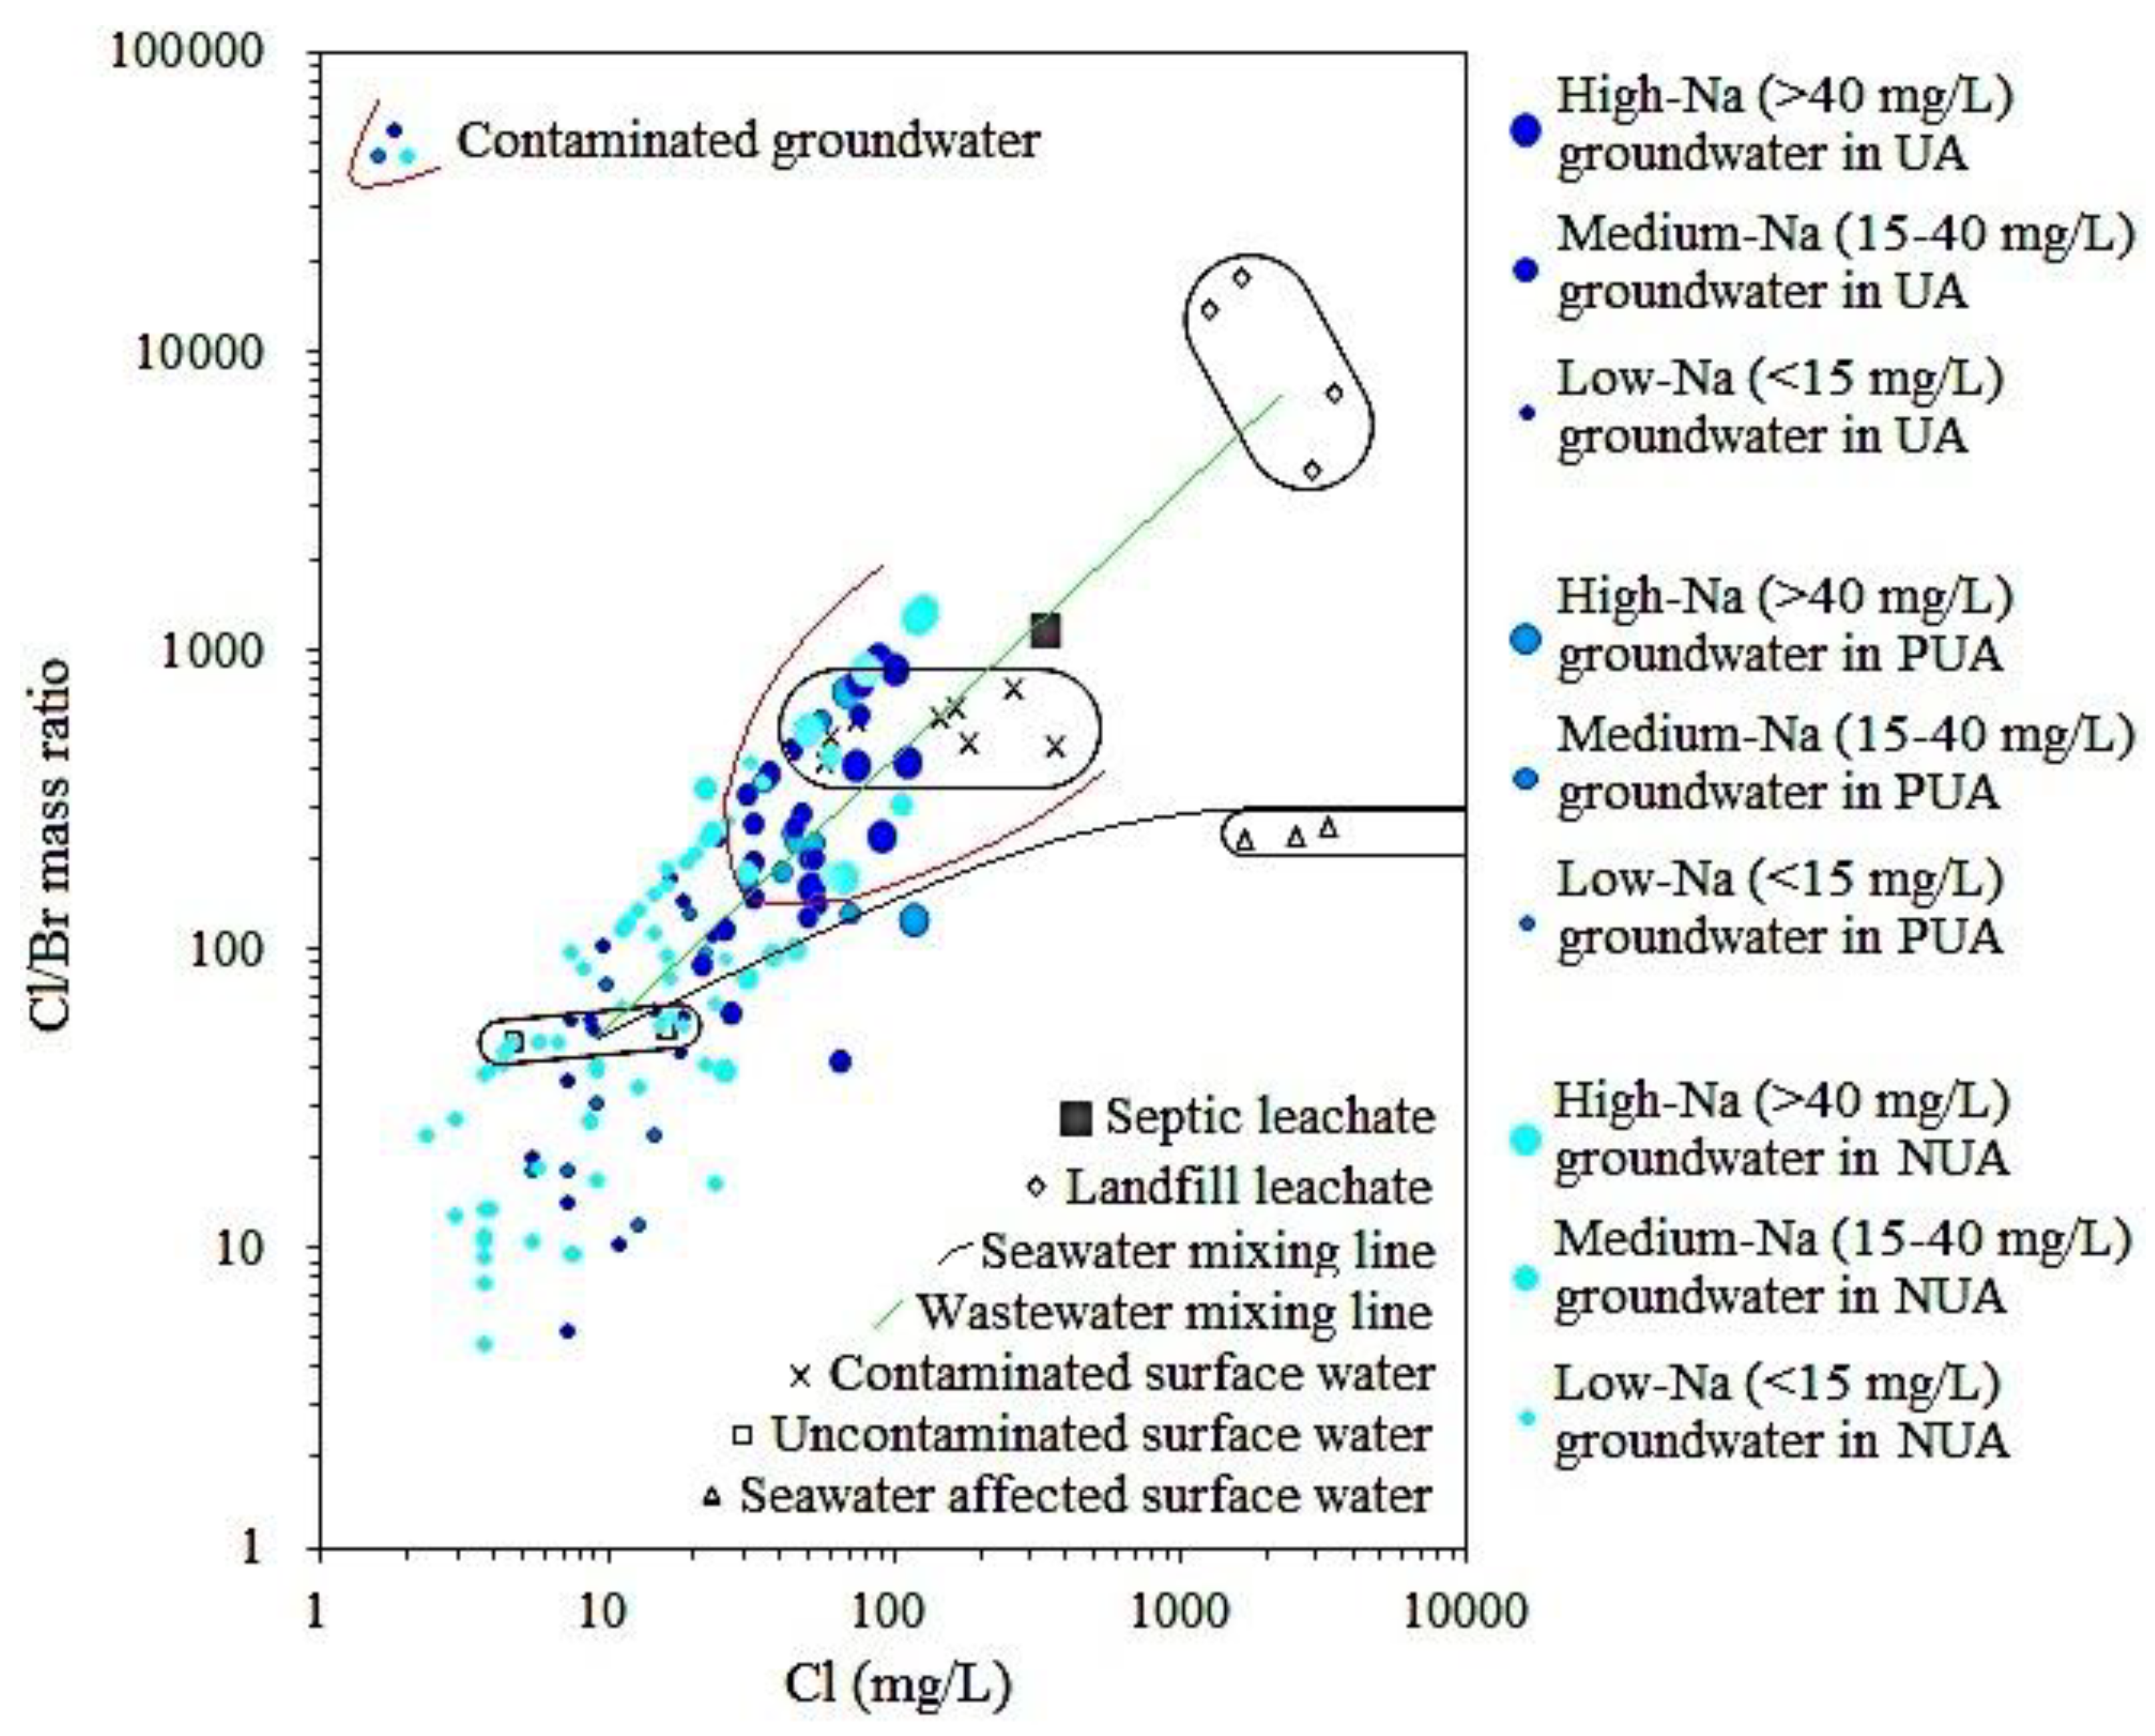
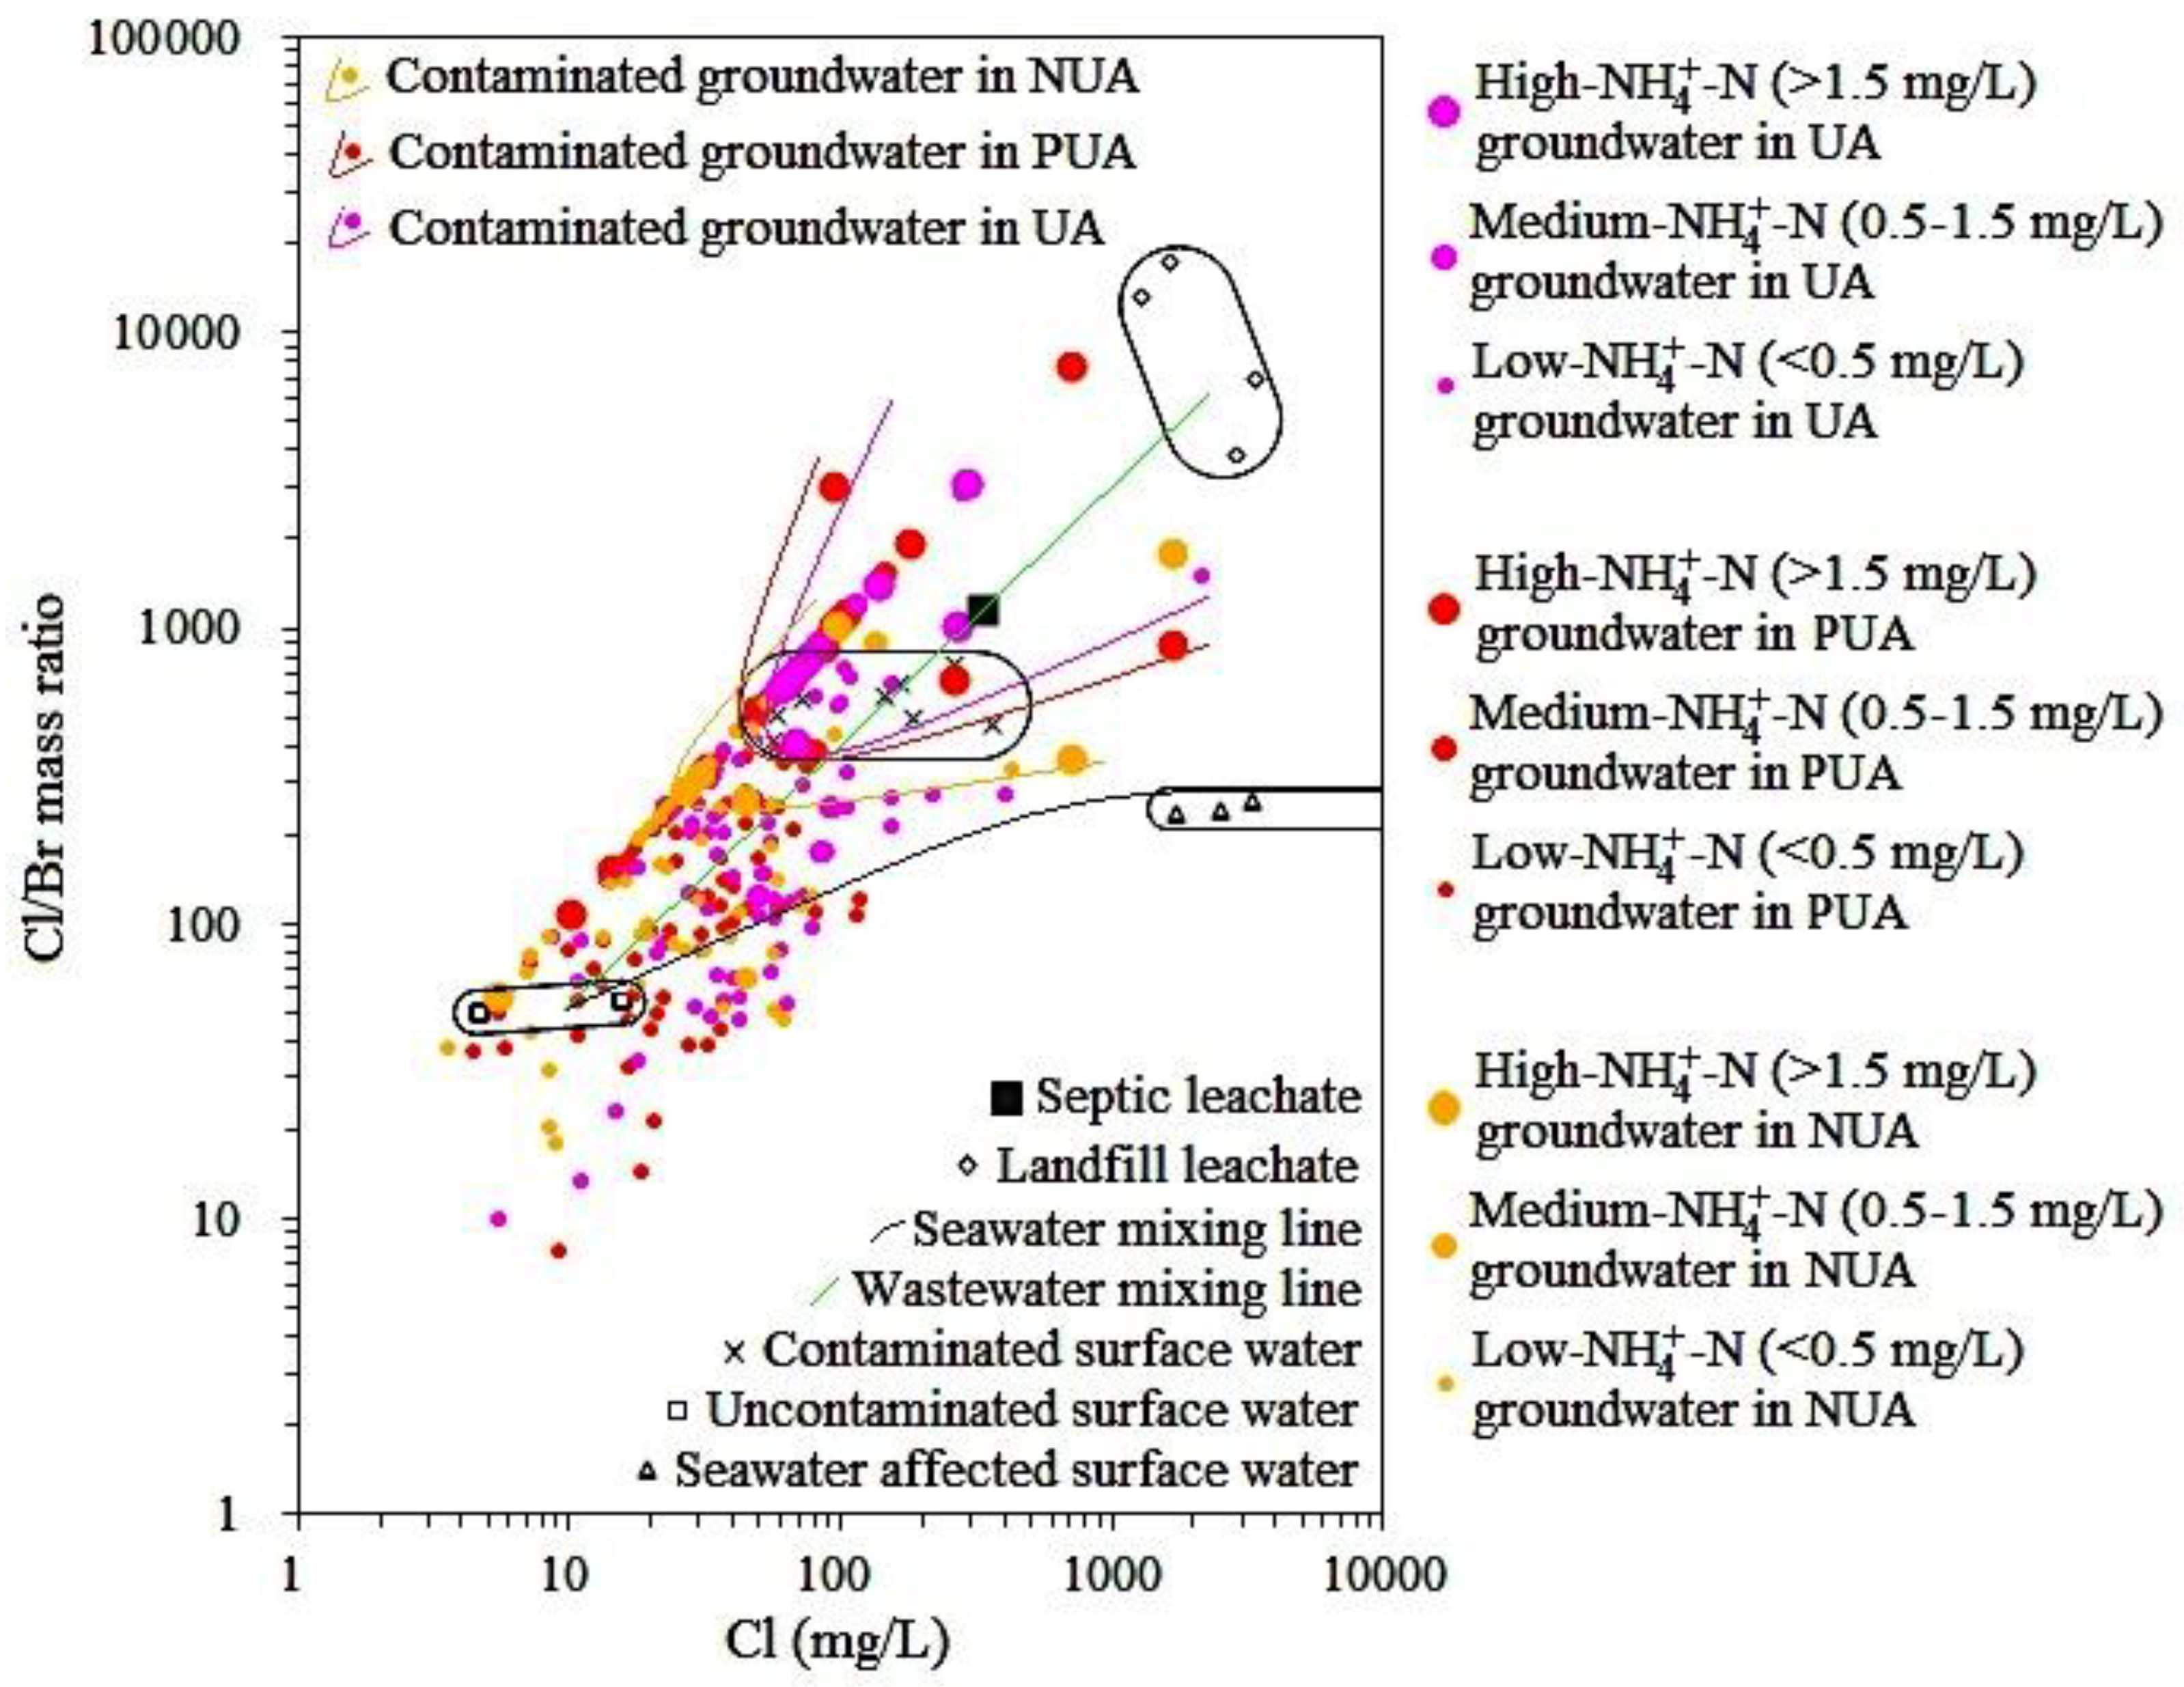
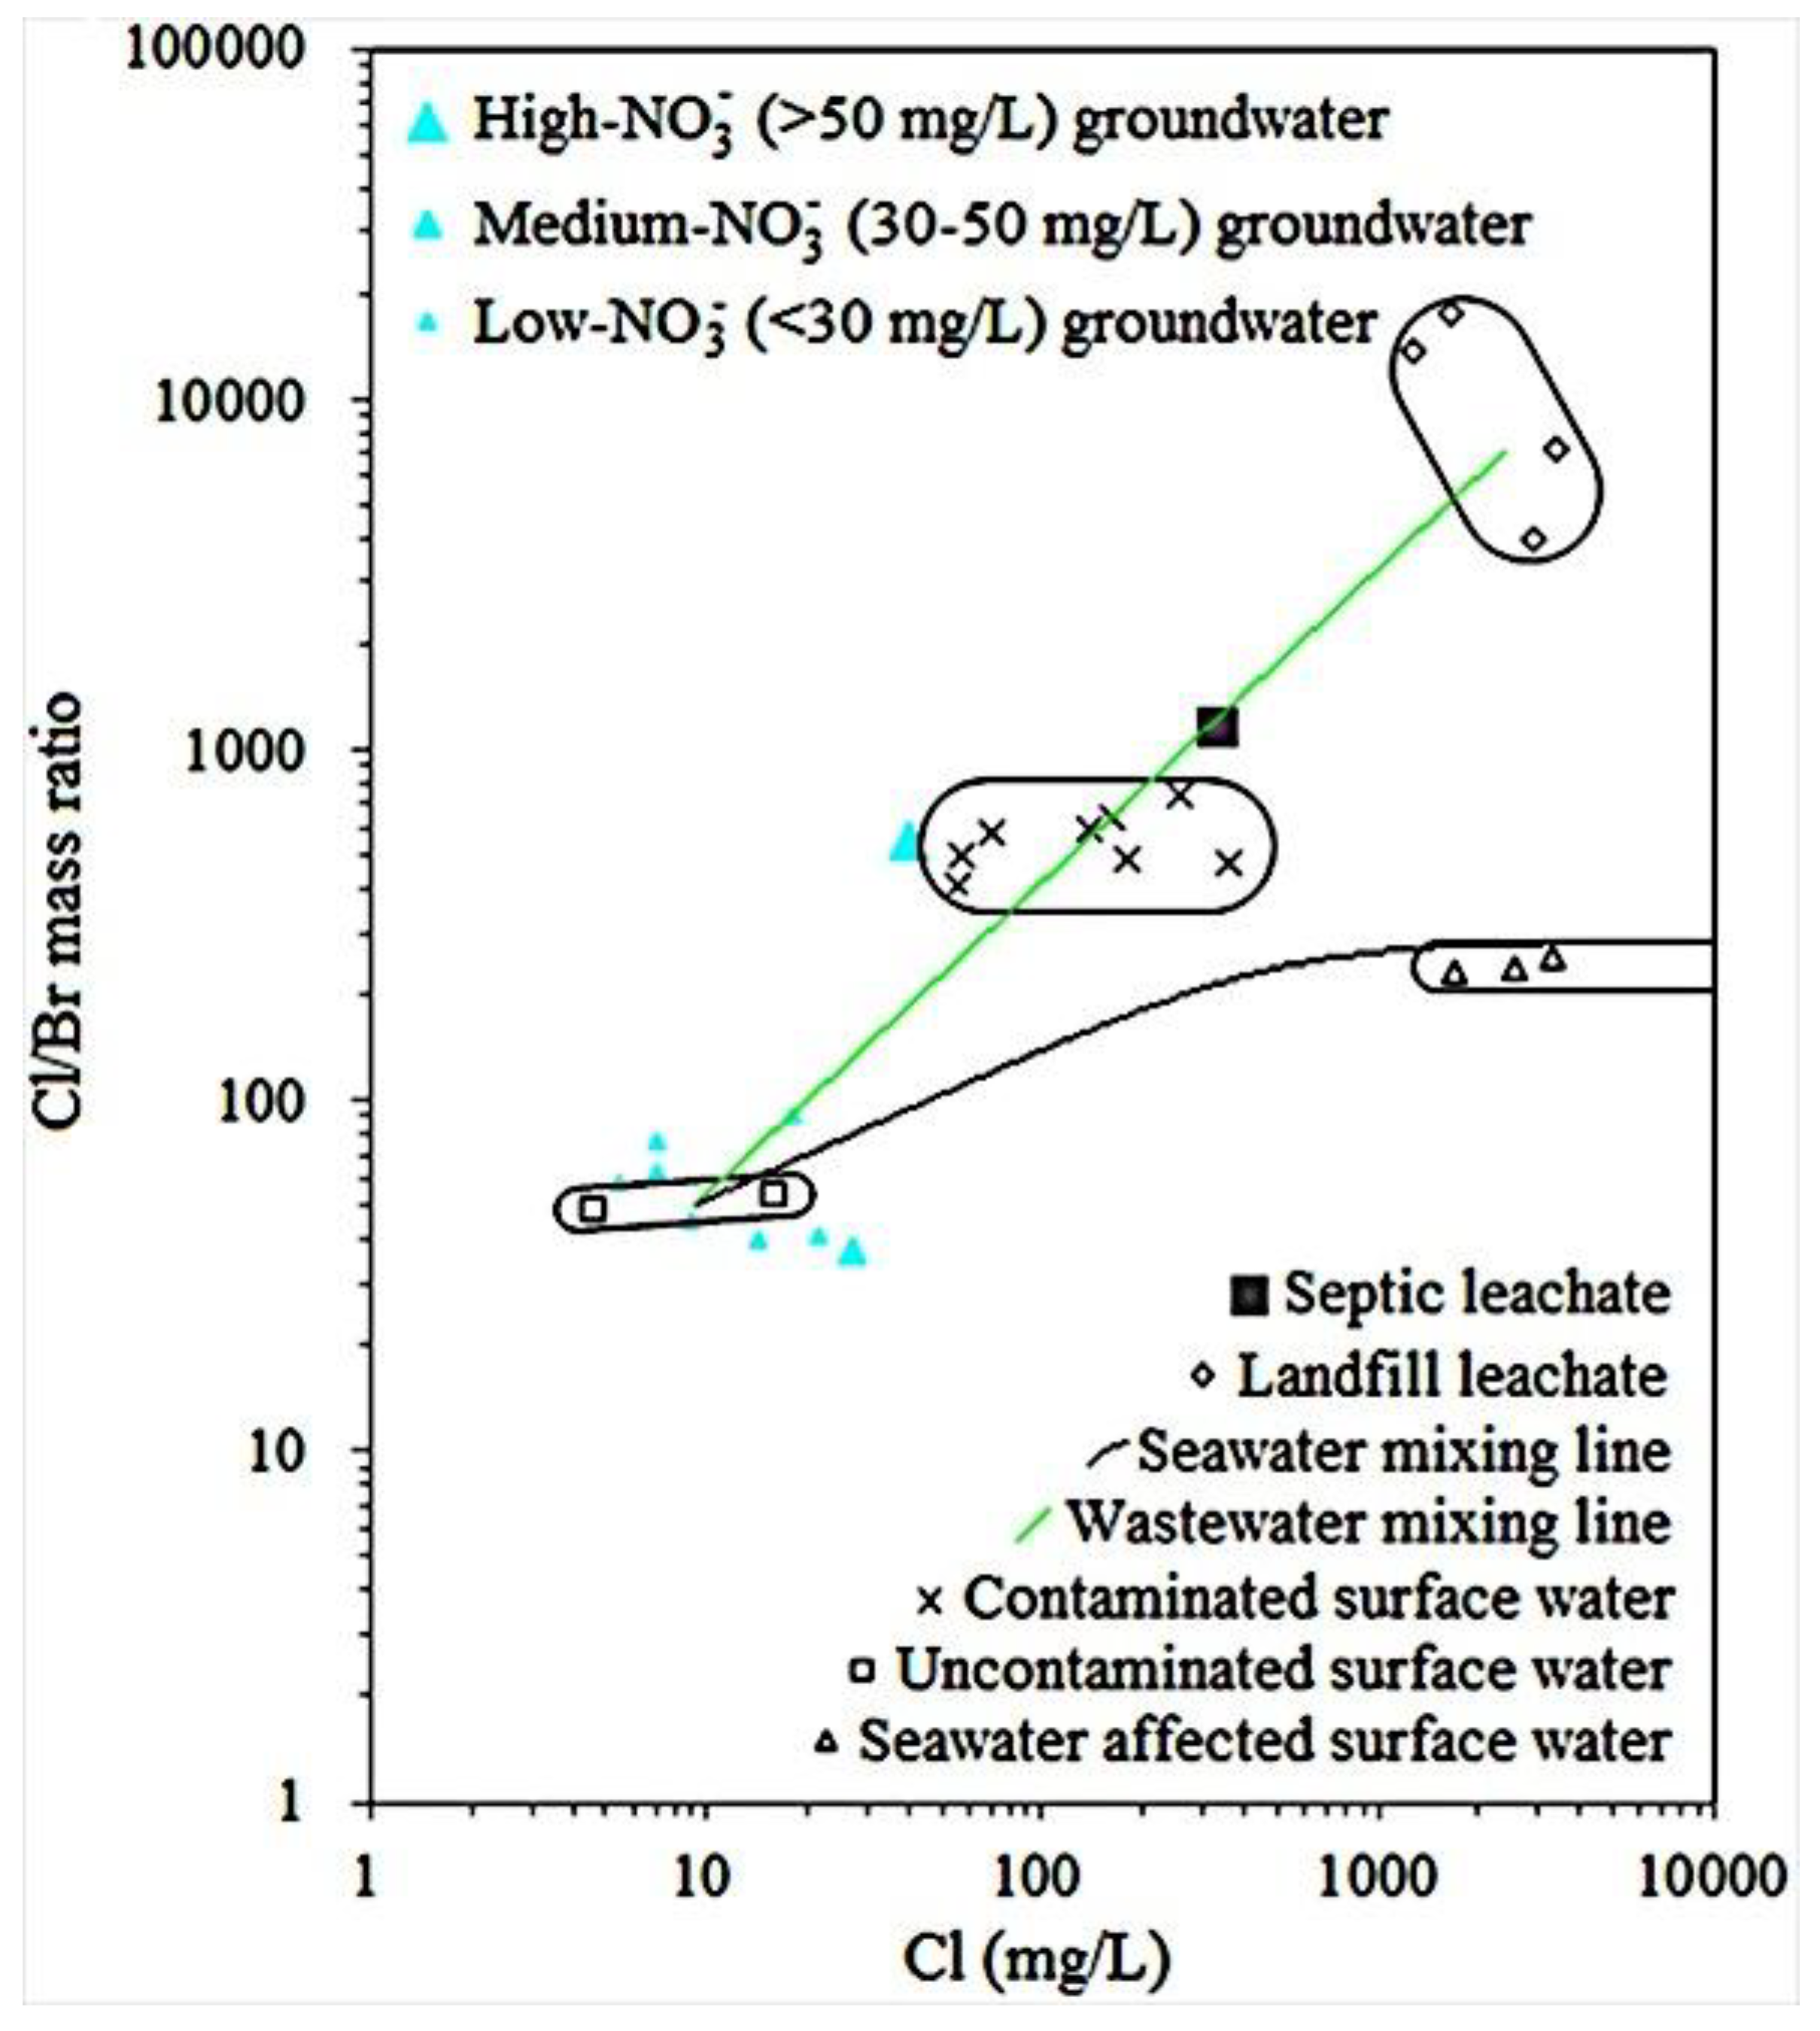
4.1. Identify Groundwater Contamination by the Cl/Br Mass Ratio
4.1.1. Cl/Br Mass Ratios and Hydrochemical Characteristics in Surface Waters and Landfill Leachate in the PRD
4.1.2. Cl/Br Mass Ratios and Hydrochemical Characteristics in Porous Aquifers in the PRD
4.1.3. Cl/Br Mass Ratios and Hydrochemical Characteristics in Fissured Aquifers in the PRD
4.1.4. Cl/Br Mass Ratios and Hydrochemical Characteristics in Karst Aquifers in the PRD
4.2. Identify Groundwater Contamination by High Levels of NO3−, Pb, PO43−, and Organic Contaminants
4.3. Identify Groundwater Contamination by the Occurrence of NO3 Facies
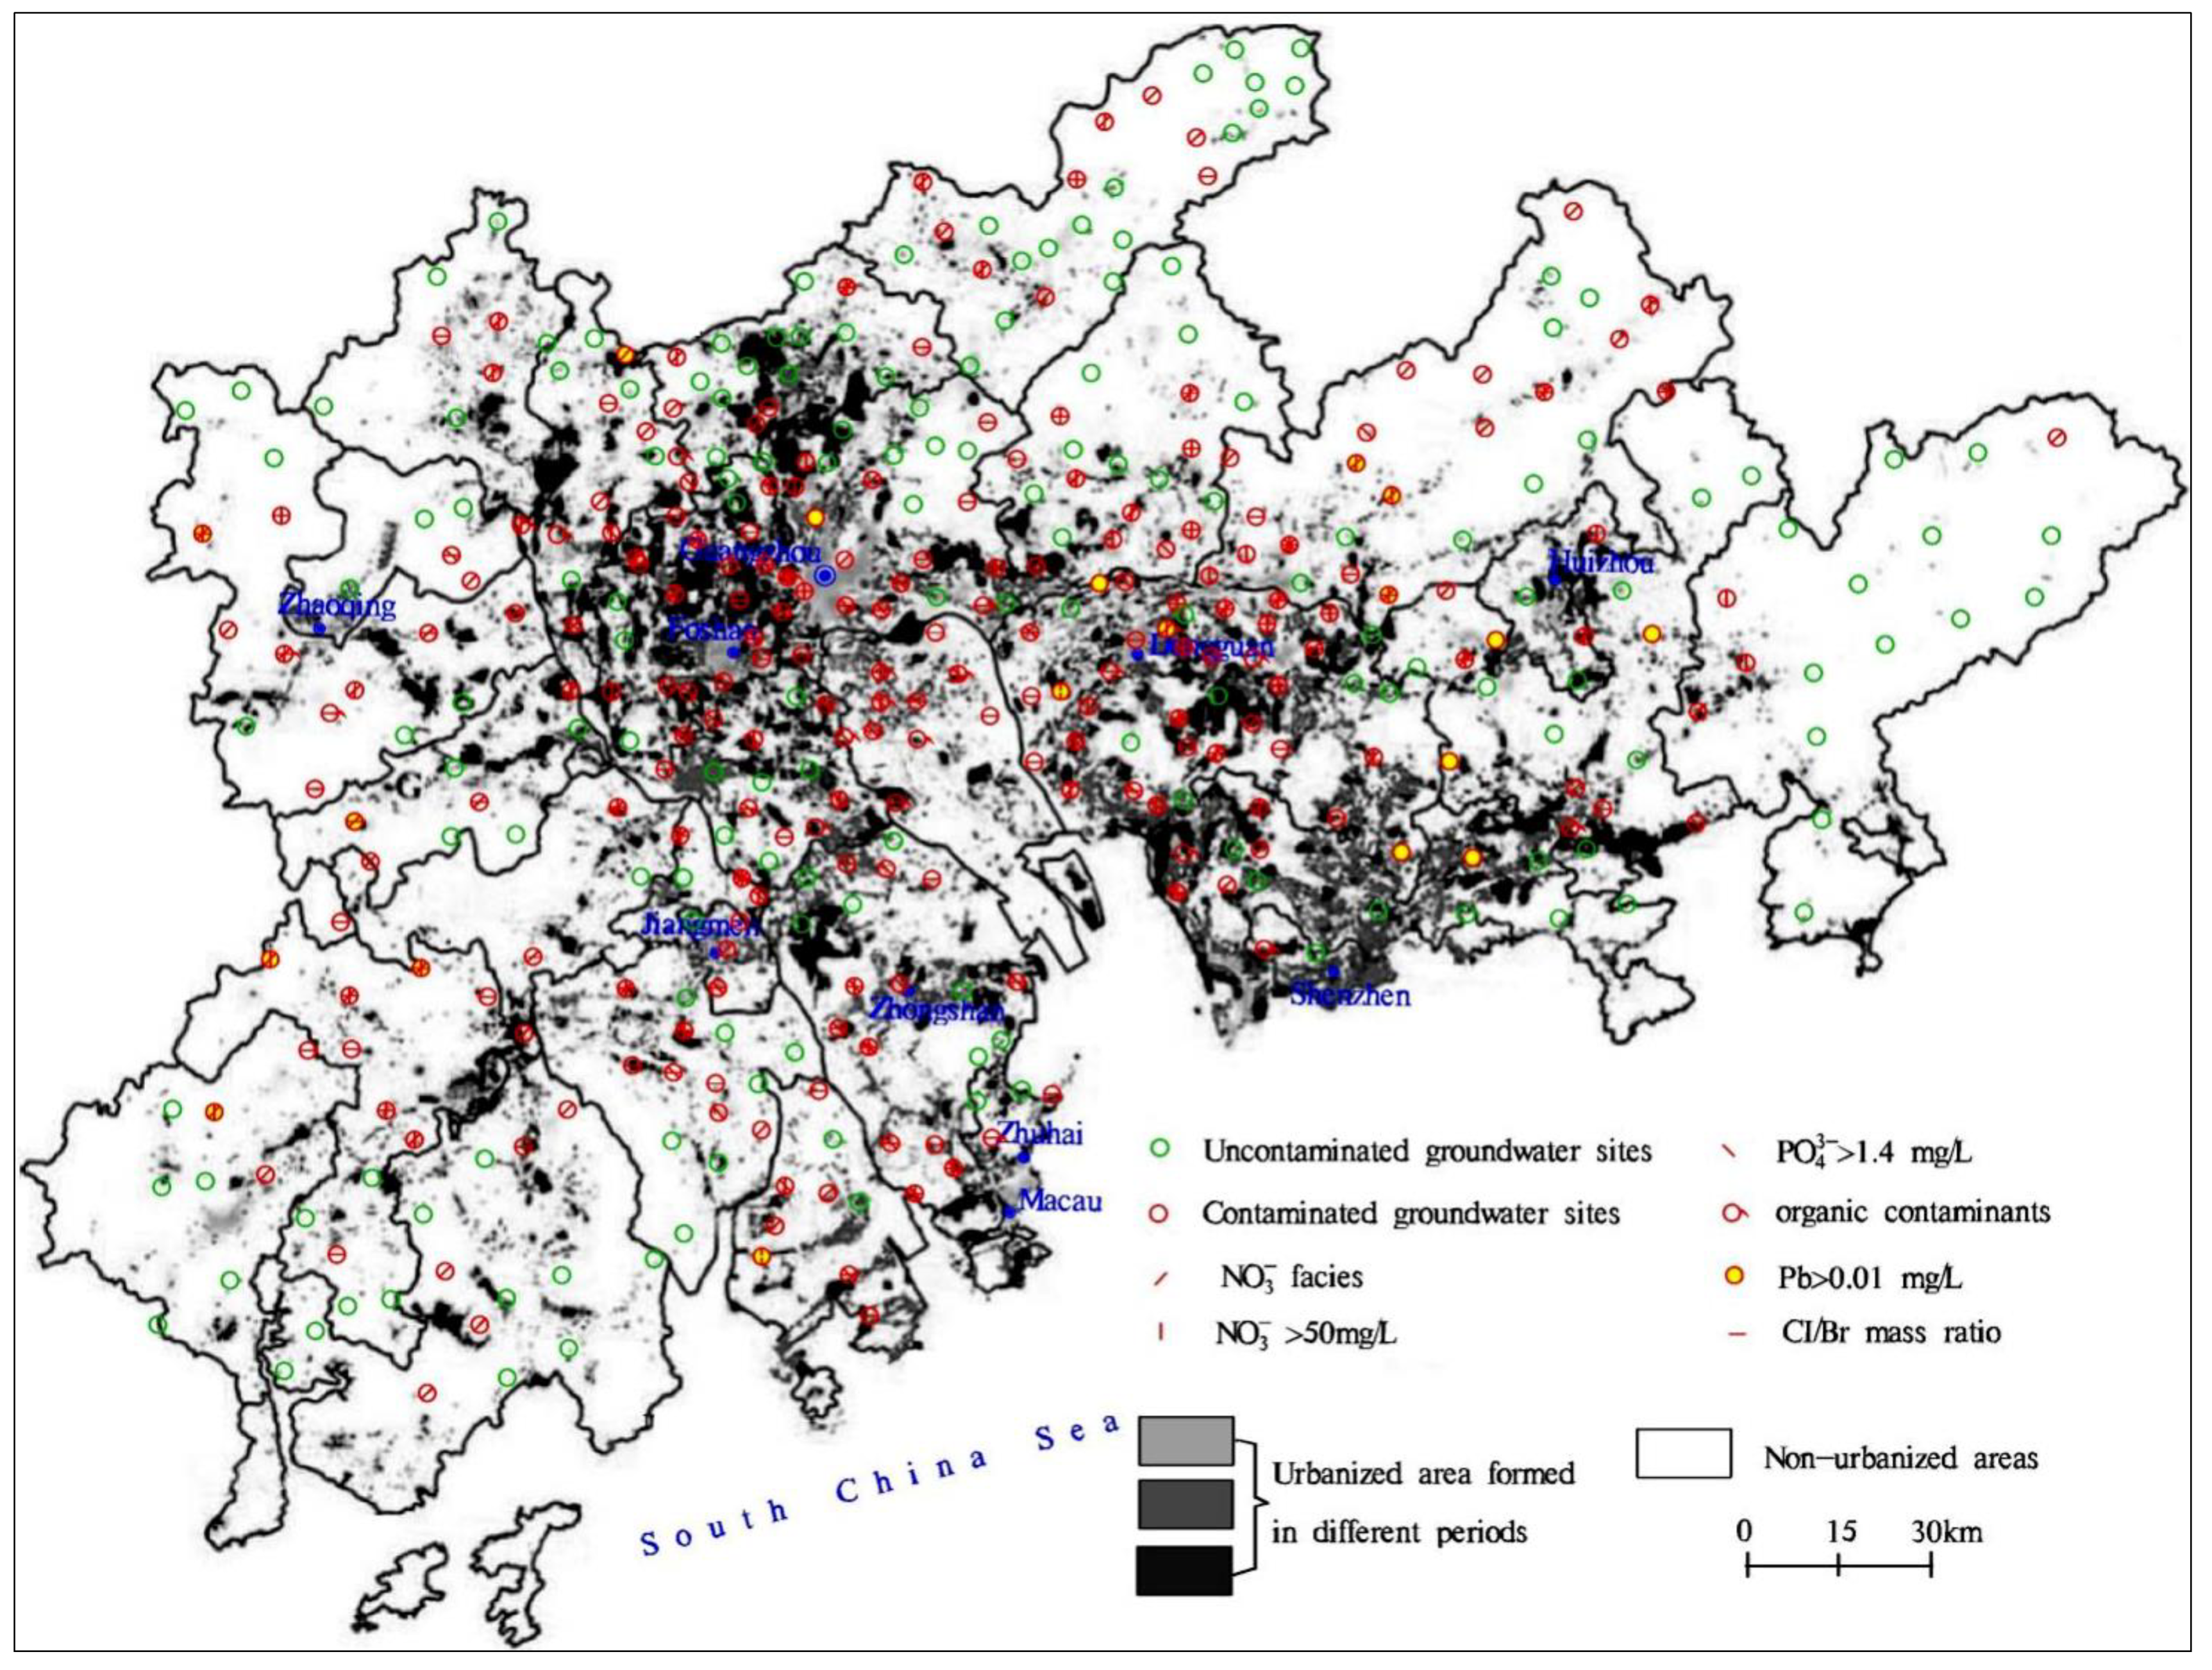
4.4. Spatial Distribution of Contaminated Groundwater in the PRD
4.5. Factors Controlling Groundwater Contamination in the PRD
5. Conclusions
Supplementary Materials
Author Contributions
Funding
Institutional Review Board Statement
Informed Consent Statement
Data Availability Statement
Conflicts of Interest
References
- Huang, G.; Sun, J.; Zhang, Y.; Chen, Z.; Liu, F. Impact of anthropogenic and natural processes on the evolution of groundwater chemistry in a rapidly urbanized coastal area, South China. Sci. Total Environ. 2013, 463–464, 209–221. [Google Scholar] [CrossRef] [PubMed]
- Zhang, F.; Huang, G.; Hou, Q.; Liu, C.; Zhang, Y.; Zhang, Q. Groundwater quality in the Pearl River Delta after the rapid expansion of industrialization and urbanization: Distributions, main impact indicators, and driving forces. J. Hydrol. 2019, 577, 124004. [Google Scholar] [CrossRef]
- Ye, Y.; Zhang, H.; Liu, K.; Wu, Q. Research on the influence of site factors on the expansion of construction land in the Pearl River Delta, China: By using GIS and remote sensing. Int. J. Appl. Earth Obs. 2013, 21, 366–373. [Google Scholar] [CrossRef]
- Huang, G.; Liu, C.; Zhang, Y.; Chen, Z. Groundwater is important for the geochemical cycling of phosphorus in rapidly urbanized areas: A case study in the Pearl River Delta. Environ. Pollut. 2020, 260, 114079. [Google Scholar] [CrossRef] [PubMed]
- Zhang, M.; Huang, G.; Liu, C.; Zhang, Y.; Chen, Z.; Wang, J. Distributions and origins of nitrate, nitrite, and ammonium in various aquifers in an urbanized coastal area, south China. J. Hydrol. 2020, 582, 124528. [Google Scholar] [CrossRef]
- Ducci, D.; Condesso de Melo, M.T.; Preziosi, E.; Sellerino, M.; Parrone, D.; Ribeiro, L. Combining natural background levels (NBLs) assessment with indicator kriging analysis to improve groundwater quality data interpretation and management. Sci. Total Environ. 2016, 569–570, 569–584. [Google Scholar] [CrossRef] [PubMed]
- Thomas, M.A. The effect of residential development on ground-water quality near Detroit, Michigan. J. Am. Water Resour. Assoc. 2000, 36, 1023–1038. [Google Scholar] [CrossRef]
- Guangdong Hydrogeological Second Team. Regional Hydrogeological Survey Report; Guangdong Hydrogeological Second Team: Guangzhou, China, 1981. [Google Scholar]
- Huang, G.; Liu, C.; Sun, J.; Zhang, M.; Jing, J.; Li, L. A regional scale investigation on factors controlling the groundwater chemistry of various aquifers in a rapidly urbanized area: A case study of the Pearl River Delta. Sci. Total Environ. 2018, 625, 510–518. [Google Scholar] [CrossRef] [PubMed]
- Huang, G.; Zhang, M.; Liu, C.; Li, L.; Chen, Z. Heavy metal(loid)s and organic contaminants in groundwater in the Pearl River Delta that has undergone three decades of urbanization and industrialization: Distributions, sources, and driving forces. Sci. Total Environ. 2018, 635, 913–925. [Google Scholar] [CrossRef] [PubMed]
- Huang, G.; Liu, C.; Li, L.; Zhang, F.; Chen, Z. Spatial distribution and origin of shallow groundwater iodide in a rapidly urbanized delta: A case study of the Pearl River Delta. J. Hydrol. 2020, 585, 124860. [Google Scholar] [CrossRef]
- Guangdong Province Statistical Bureau (GPSB). 2007 Statistical Yearbook of Guangdong Province; China Statistical Publisher House: Beijing, China, 2007.
- Zhang, B.; Song, X.F.; Zhang, Y.H.; Han, D.M.; Tang, C.Y.; Yu, Y.L.; Ma, Y. Hydrochemical characteristics and water quality assessment of surface water and groundwater in Songnen Plain, Northeast China. Water Res. 2012, 46, 2737–2748. [Google Scholar] [CrossRef]
- Huang, G.; Chen, Z.; Liu, F.; Sun, J.; Wang, J. Impact of human activity and natural processes on groundwater arsenic in an urbanized area (South China) using multivariate statistical techniques. Environ. Sci. Pollut. Res. 2014, 21, 13043–13054. [Google Scholar] [CrossRef]
- Hou, Q.; Zhang, Q.; Huang, G.; Liu, C.; Zhang, Y. Elevated manganese concentrations in shallow groundwater of various aquifers in a rapidly urbanized delta, south China. Sci. Total Environ. 2020, 701, 134777. [Google Scholar] [CrossRef] [PubMed]
- Katz, B.G.; Eberts, S.M.; Kauffman, L.J. Using Cl/Br ratios and other indicators to assess potential impacts on groundwater quality from septic systems: A review and examples from principal aquifers in the United States. J. Hydrol. 2011, 397, 151–166. [Google Scholar] [CrossRef]
- Panno, S.V.; Hackley, K.C.; Hwang, H.H.; Greenberg, S.E.; Krapac, I.G.; Landsberger, S.; O’Kelly, D.J. Characterization and identification of Na–Cl sources in ground water. Ground Water 2006, 44, 176–187. [Google Scholar] [CrossRef] [PubMed]
- Jiang, Y.J.; Wu, Y.X.; Groves, C.; Yuan, D.X.; Kambesis, P. Natural and anthropogenic factors affecting the groundwater quality in the Nandong karst underground river system in Yunan, China. J. Contam. Hydrol. 2009, 109, 49–61. [Google Scholar] [CrossRef] [PubMed]
- Parrone, D.; Ghergo, S.; Preziosi, E. A multi-method approach for the assessment of natural background levels in groundwater. Sci. Total Environ. 2019, 659, 884–894. [Google Scholar] [CrossRef] [PubMed]
- Piper, A.M. A graphic procedure in the geochemical interpretation of water analysis. Trans. Am. Geophys. Union 1944, 25, 914–923. [Google Scholar] [CrossRef]
- Sun, J.C.; Jing, J.H.; Huang, G.X.; Liu, J.T.; Chen, X.; Zhang, Y.X. Report on the Investigation and Assessment of Groundwater Contamination in the Pearl River Delta Area; The Institute of Hydrogeology and Environmental Geology, Chinese Academy of Geological Sciences: Shijiazhuang, China, 2009. [Google Scholar]
- Taufiq, A.; Effendi, A.J.; Iskandar, I.; Hosono, T.; Hutasoit, L.M. Controlling factors and driving mechanisms of nitrate contamination in groundwater system of Bandung Basin, Indonesia, deduced by combined use of stable isotope ratios, CFC age dating, and socioeconomic parameters. Water Res. 2019, 148, 292–305. [Google Scholar] [CrossRef]
- Zhang, Q.; Sun, J.; Liu, J.; Huang, G.; Lu, C.; Zhang, Y. Driving mechanism and sources of groundwater nitrate contamination in the rapidly urbanized region of south China. J. Contam. Hydrol. 2015, 182, 221–230. [Google Scholar] [CrossRef] [PubMed]
- World Health Organization. Guidelines for Drinking Water Quality, 4th ed.; World Health Organization: Geneva, Switzerland, 2011. [Google Scholar]
- Zhang, F.; Huang, G.; Hou, Q.; Liu, C.; Zhang, Y.; Zhang, Q. Groundwater quality in the Pearl River Delta after the rapid expansion of industrialization and urbanization: Distributions, main impact indicators, and driving forces. J. Hydrol. 2019, 577, 124004. [Google Scholar] [CrossRef]
- Huang, G.; Liu, C.; Zhang, Y.; Chen, Z. Groundwater is important for the geochemical cycling of phosphorus in rapidly urbanized areas: A case study in the Pearl River Delta. Environ. Pollut. 2020, 260, 114079. [Google Scholar] [CrossRef]
- Huang, G.; Zhang, M.; Liu, C.; Li, L.; Chen, Z. Heavy metal(loid)s and organic contaminants in groundwater in the Pearl River Delta that has undergone three decades of urbanization and industrialization: Distributions, sources, and driving forces. Total Environ. 2018, 635, 913–925. [Google Scholar]
- Huang, G.; Liu, C.; Sun, J.; Zhang, M.; Jing, J.; Li, L. A regional scale investigation on factors controlling the groundwater chemistry of various aquifers in a rapidly urbanized area: A case study of the Pearl River Delta. Sci. Total Environ. 2018, 625, 510–518. [Google Scholar]


| Items | PCs | ||
|---|---|---|---|
| PC1 | PC2 | PC3 | |
| GDP | 0.993 | −0.115 | −0.009 |
| PD | 0.985 | 0.133 | −0.038 |
| DSD | 0.982 | 0.035 | 0.149 |
| UR | 0.940 | 0.098 | −0.209 |
| IE | 0.850 | 0.393 | −0.089 |
| TVE | −0.016 | 0.894 | 0.343 |
| PCG | −0.039 | 0.870 | −0.351 |
| IWD | 0.412 | 0.859 | −0.125 |
| LO | −0.115 | −0.267 | 0.918 |
| AO | −0.268 | −0.001 | 0.899 |
| LD | −0.229 | −0.099 | −0.412 |
| Eigenvalue | 4.8 | 2.6 | 2.2 |
| Explained variance (%) | 44.0 | 23.4 | 19.6 |
| Cumulative % of variance | 44.0 | 67.3 | 86.9 |
Publisher’s Note: MDPI stays neutral with regard to jurisdictional claims in published maps and institutional affiliations. |
© 2021 by the authors. Licensee MDPI, Basel, Switzerland. This article is an open access article distributed under the terms and conditions of the Creative Commons Attribution (CC BY) license (https://creativecommons.org/licenses/by/4.0/).
Share and Cite
Bi, P.; Pei, L.; Huang, G.; Han, D.; Song, J. Identification of Groundwater Contamination in a Rapidly Urbanized Area on a Regional Scale: A New Approach of Multi-Hydrochemical Evidences. Int. J. Environ. Res. Public Health 2021, 18, 12143. https://doi.org/10.3390/ijerph182212143
Bi P, Pei L, Huang G, Han D, Song J. Identification of Groundwater Contamination in a Rapidly Urbanized Area on a Regional Scale: A New Approach of Multi-Hydrochemical Evidences. International Journal of Environmental Research and Public Health. 2021; 18(22):12143. https://doi.org/10.3390/ijerph182212143
Chicago/Turabian StyleBi, Pan, Lixin Pei, Guanxing Huang, Dongya Han, and Jiangmin Song. 2021. "Identification of Groundwater Contamination in a Rapidly Urbanized Area on a Regional Scale: A New Approach of Multi-Hydrochemical Evidences" International Journal of Environmental Research and Public Health 18, no. 22: 12143. https://doi.org/10.3390/ijerph182212143
APA StyleBi, P., Pei, L., Huang, G., Han, D., & Song, J. (2021). Identification of Groundwater Contamination in a Rapidly Urbanized Area on a Regional Scale: A New Approach of Multi-Hydrochemical Evidences. International Journal of Environmental Research and Public Health, 18(22), 12143. https://doi.org/10.3390/ijerph182212143