Article

Activated Carbon from Palm Date Seeds for CO2 Capture

by
Amira Alazmi
1,*,
Sabina A. Nicolae
2,
Pierpaolo Modugno
2,
Bashir E. Hasanov
3,
Maria M. Titirici
4 and
Pedro M. F. J. Costa
3
1
Department of Chemistry, University Colleges at Nairiyah, University of Hafr Albatin (UHB), Nairiyah 31981, Saudi Arabia
2
School of Engineering and Materials Science, Queen Mary University of London, London E1 4NS, UK
3
Physical Science and Engineering Division, King Abdullah University of Science and Technology (KAUST), Thuwal 23955-6900, Saudi Arabia
4
Department of Chemical Engineering, Imperial College London, London SW7 2AZ, UK
*
Author to whom correspondence should be addressed.
Int. J. Environ. Res. Public Health 2021, 18(22), 12142; https://doi.org/10.3390/ijerph182212142
Submission received: 11 October 2021 / Revised: 29 October 2021 / Accepted: 2 November 2021 / Published: 19 November 2021
(This article belongs to the Section Environmental Science and Engineering)

Abstract

:
The process of carbon dioxide capture and storage is seen as a critical strategy to mitigate the so-called greenhouse effect and the planetary climate changes associated with it. In this study, we investigated the CO2 adsorption capacity of various microporous carbon materials originating from palm date seeds (PDS) using green chemistry synthesis. The PDS was used as a precursor for the hydrochar and activated carbon (AC). Typically, by using the hydrothermal carbonization (HTC) process, we obtained a powder that was then subjected to an activation step using KOH, H3PO4 or CO2, thereby producing the activated HTC-PDS samples. Beyond their morphological and textural characteristics, we investigated the chemical composition and lattice ordering. Most PDS-derived powders have a high surface area (>1000 m2 g−1) and large micropore volume (>0.5 cm3 g−1). However, the defining characteristic for the maximal CO2 uptake (5.44 mmol g−1, by one of the alkaline activated samples) was the lattice restructuring that occurred. This work highlights the need to conduct structural and elemental analysis of carbon powders used as gas adsorbents and activated with chemicals that can produce graphite intercalation compounds.

1. Introduction

There is a pressing concern with the global warming and climate change occurring on our planet. For almost a century, the continuous combustion of fossil fuels has led to a measurable increase in the atmospheric concentration of carbon dioxide (CO2), a well-known greenhouse gas. In order to mitigate this issue, a number of strategies have been proposed, chief amongst which are CO2 capture technologies. Reversible gas adsorption (physisorption) is a mature field that relies on the appropriate selection of porous materials used as adsorbents to capture a particular gas [1,2,3,4,5]. In the case of CO2, a number of physical adsorbents have been investigated, such as activated carbon [6,7], mesoporous silica [8], zeolites [7,9], metal–organic frameworks [10] and fly ash [11]. Of these, high-surface-area powders of porous carbons present a number of notable advantages. In addition to the ease of synthesis and regeneration, they show remarkable chemical and thermal stability [12]. Sustainable porous carbon materials can be obtained from waste biomass through various carbonization and activation processes. A popular option is performing hydrothermal carbonization (HTC) followed by chemical activation with strong oxidisers [13,14].
In Saudi Arabia, palm trees are very abundant. With more than 23 million specimens, the aggregated production of palm date fruits in the Kingdom reached a staggering 1,078,300 metric tonnes in 2010, which is equivalent to 14.4% of the world’s production [15]. Regrettably, there is very little use for the seeds (or pits) of these fruits, which are commonly considered waste and mostly end up in landfills or incinerated. This poses a serious environmental challenge, as it is estimated that the palm date biomass waste amounts to almost one million metric tonnes per year in Saudi Arabia alone [16,17].
Recently, the utilisation of biomass waste to produce low-cost sorbents for CO2 capture has attracted significant attention [18]. With respect to palm date seeds (PDS), there is limited information on the application of this natural resource [19,20,21,22,23]. In fact, the natural structure, lignocellulose composition and low ash content of PDS makes it an excellent precursor for activated carbon [19]. In average, the mass of PDS is composed of cellulose (42%), hemicellulose (18%), sugar and other compounds (25%), lignin (11%) and ash (4%) [24].
In this work, we investigate the performance of activated carbons derived from palm date seeds for CO2 capture. To augment the PDS char porosity, endogenous palm date fruits (Phoenix dactylifera) were subjected to HTC followed by chemical activation. Three activation routes were explored: (1) gaseous oxidation, (2) alkaline wet impregnation and (3) acid wet impregnation.

2. Experiment

2.1. Preparation of the PDS Hydrochar

The pits of Phoenix dactylifera, also known as the date or palm date, were collected from farms near the city of Damman, Saudi Arabia. After cleaning, the palm date pits were pulverised and used as the biomass source for the production of porous carbon materials. In a typical synthesis, 5 g of the powdered pits was initially dispersed in 50 mL of deionised water. This mixture was transferred into a stainless-steel autoclave and heated at 200 °C for 48 h, resulting in the hydrothermal carbonization (HTC) of the palm date pit biomass. Upon cooling to room temperature, a dark-brown precipitate was separated by vacuum filtration, washed with deionised water (until the pH was neutralised) and dried at 100 °C overnight. Hereafter, this powder is denoted PDS hydrochar (or simply, HTC-PDS).

2.2. Activation of the PDS Hydrochar

Given the lack of porosity, the powdered PDS has low surface area making its hydrochar inappropriate for gas uptake studies [25,26,27,28]. Hence, post-carbonization steps were developed to augment the porosity. Three independent activation processes were studied. The first (1) was CO2 activation: typically, a certain mass of the PDS hydrochar was placed in a ceramic crucible, covered with the respective lid and placed in a tubular furnace under a CO2 flow rate of 50 cm3/min. The samples were heated to 900 °C at a rate of 5 °C/min and exposed to the oxidative gas stream for 3 h. The product was denoted HTC-PDS_CO2 activation. The second activation process (2) was an alkaline-medium chemical activation (with KOH): two different mass ratios of hydrochar:KOH were investigated, 1:1 and 1:2. Initially, a wet impregnation was performed by dispersing the PDS in a concentrated aqueous solution of KOH and stirring for about 2 h. After drying the KOH-impregnated PDS powder in an oven (overnight, 100 °C), a high-temperature treatment was carried out for 2 h (dwell time) under an inert atmosphere (N2, 99.995%, flow of 150 cm3/min) at 900 °C (with 5 °C/min of heating rate). The resulting char was cleaned with 6 M HCl and washed with deionised water to neutralise the pH. Finally, the KOH-activated carbon was dried in a vacuum oven at 100 °C for several hours. Hereafter, these samples are denoted HTC-PDS_KOH_x, where x corresponds to the relative mass of KOH (1 or 2). The third activation process (3) was an acid-medium chemical activation (with H3PO4): it followed the exact same procedure and mass ratios of the KOH activation with the exception of the oxidiser used. The powdered product is denoted HTC-PDS_H3PO4_x, where x corresponds to the relative mass of H3PO4.

2.3. Characterisation

The morphology and texture of the samples were analysed with a FEI Quanta3D scanning electron microscope (SEM) operated at 10 kV. The structure of the carbons was assessed through Raman spectroscopy using a WITec Alpha300RA spectrometer with an excitation wavelength of 488 nm. Elemental carbon, hydrogen, nitrogen, sulfur and oxygen were quantified in wt %, using a Flash2000 (CHNS/O) analyser (ThermoScientific, Waltham, MA, USA). Potassium was quantified through inductively coupled plasma optical emission spectroscopy (ICP-OES) in an Agilent 5110 with an asynchronous dual detector configuration and at wavelengths between 167 and 780 nm. The samples were prepared using a microwave-assisted acid digestion method (oxidisers: HNO3 and H2O2). The porosity of the powders was studied using N2 adsorption–desorption isotherms run at −196 °C in a Quantachrome Nova 4200e, Boynton Beach, FL 33426 USA. Prior to the adsorption, the samples were degassed overnight at 150 °C. This ensured the removal of inadvertently adsorbed molecular species. The mesopores specific surface area (SBET, where BET stands for Brunauer-Emmet-Teller), the micropores specific surface area (SDR, where DR stands for Dubinin-Radushkevich) and the total pore volume (PV) were determined from the N2 isotherms and followed the standards of the International Union of Pure and Applied Chemistry (IUPAC). The pore size distribution was obtained by fitting the N2 isotherms with models for slit pores, based on the quenched solid density functional theory (QS-DFT) and included in the Quantachrome NovaWin software version 11.03.

2.4. CO2 Adsorption

The CO2 adsorption capacity of the HTC-PDS powders was investigated in a Quantachrome Nova 4200e at 1 bar and 25 °C. Prior to the adsorption runs, the samples were first degassed overnight at 150 °C. The adsorption isotherms shown in this paper were taken after running at least three adsorption-desorption cycles. In between each cycle, the materials were degassed at 150 °C.
The adsorption capacity (Ca) was calculated using the formula:
C a = V o l u m e   o f   g a s   a d s o r b e d   ( c c g ) M o l a r   v o l u m e   ( c c m m o l )
For the volume of gas adsorbed, the maximum cm3 g−1 value registered in the N2 isotherms was considered. The Ca values are reported in millimoles (mmol) of adsorbed gas per gram of the HTC-PDS powder adsorbent.

3. Results and Discussion

In the literature, it is common that char activation is performed via a particular physical or chemical method. However, presenting CO2 adsorption studies without contextualizing the carbonaceous synthesis path may lead to less-than-optimal sorbent performances. In fact, it is well-known that the properties of carbon powders differ widely depending on their granular texture, graphitization degree and surface characteristics. All of these can be modified during the activation process and affect the sorption response.

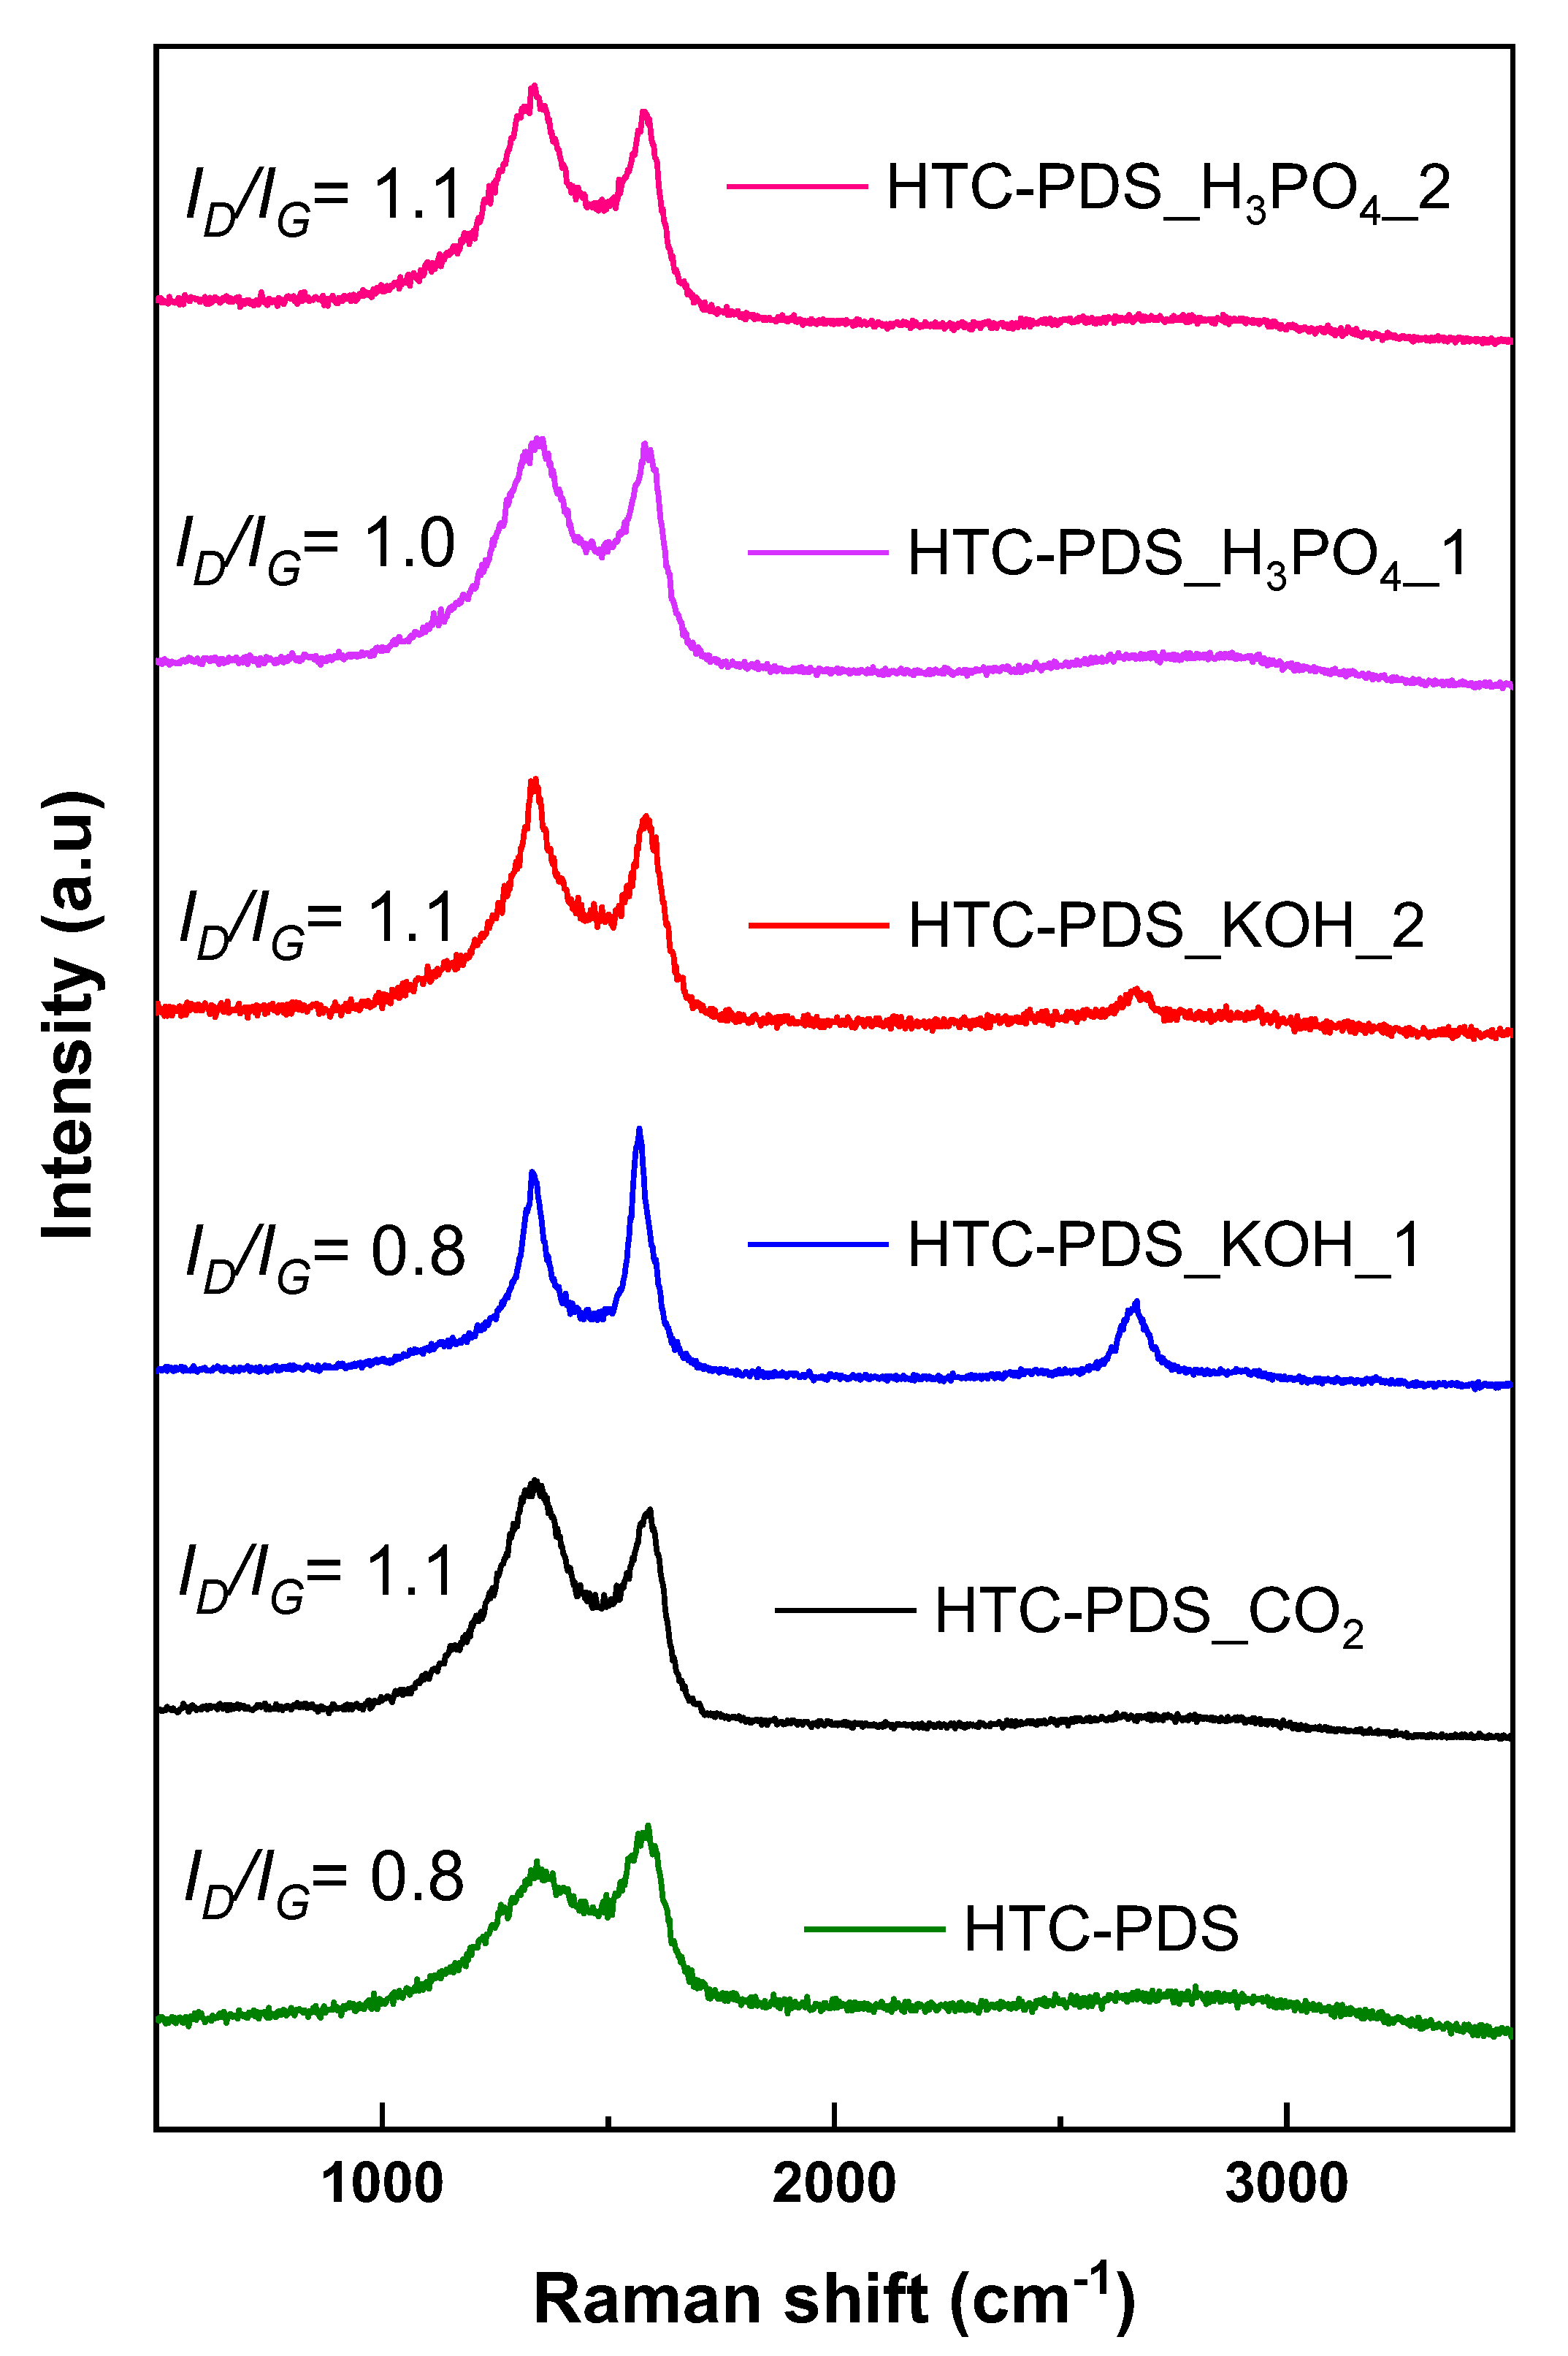
3.1. Characterization of the PDS Carbon Powders

Considering the above paragraph, and following the preparation of the five activated biomass-derived carbon powders, their structural and chemical characterization was performed. First, the morphology and texture of the samples were examined. Figure 1 shows representative SEM images of the hydrochar (before activation) and the activated samples, denoting how the different processes acted on the PDS. Initially, the carbonised date seeds showed a compact spherical shape without pores (Figure 1a). These particles had diameters ranging from 3 to 10 μm and were nucleated during the HTC process. Similar carbon microspheres, also produced by HTC, were previously reported using varied biomass sources [29,30,31]. As seen in Figure 1b, the physical activation using CO2 had no significant impact on the HTC-PDS particle shape and surface morphology. Conversely, the chemical activation with KOH (Figure 1c,d) caused a visible degradation of the surface as a result of the oxidation reaction. The higher hydroxide concentration (HTC-PDS_KOH_2) was particularly effective in introducing surface roughness but did not compromise the spherical shape of the particles. The analogous acid treatment had an outcome similar to that of the gas process (Figure 1e,f). No visible impact resulted on the particles’ shape and surface morphology.
Apart from the morphology, it is critical to understand how the carbon lattice is structured in these particulate powders. In this respect, Raman spectroscopy is a powerful analytical tool for studying the lattice structure of carbon materials. In Figure 2, the different spectra of the activated powders reflect some common features. First, the two characteristic bands of graphitic carbons were centred at 1338 cm1 (D band) and 1585 cm1 (G band) [32]. Throughout the samples, there were no meaningful shifts in the wavenumbers of these bands (Table S1), with the exception of HTC-PDS_KOH_1 (D band = 1329 cm1 and G band = 1564 cm1). Their intensity ratio (ID/IG) and band overlap were used to infer the density of lattice defects. Generally, the ratio increased slightly when a higher concentration of the oxidiser was used (on the KOH and H3PO4 samples). The band overlap was similar, apart from the sample HTC-PDS_KOH_1, where the separation was more visible, as its bands had reduced widths. Furthermore, both KOH-activated powders had a visible 2D peak at ca. 2658 cm−1. The Raman analysis confirmed that the CO2 and H3PO4 activations produced similar carbon materials (in regards to morphology and structure). By contrast, wet impregnation with the hydroxide leads to a better volumetric structural ordering (stacking of graphene layers), particularly for the sample HTC-PDS_KOH_1, where the 2D is quite noticeable. On the whole, the surface roughness and structural order differ in the two HTC-PDS_KOH samples, with the smoother surface HTC-PDS_KOH_1 showing a higher graphitization degree.
Apart from the morphological and structural features, it was important to understand the chemical composition of the activated HTC-PDS. The quantification of C, O, N and H is presented in Table 1 (in wt %), where the C/O ratios are included. The N and H mass fractions were relatively small for all samples, in particular for those exposed to alkaline wet impregnation. Remarkably, it was also the HTC-PDS_KOH powders that had the highest (HTC-PDS_KOH_1) and lowest (HTC-PDS_KOH_2) content of C; the same happened for the O mass fraction but in the inverse proportion. For that reason, the maximum C/O ratio of 7.7 was seen for HTC-PDS_KOH_1, whereas the minimum of this ratio (1.4) was observed in the HTC-PDS_KOH_2 sample. All other samples had mass fractions and C/O ratios that fell between these extremes. Therefore, the elemental analysis reveals that the KOH wet impregnation was the most efficient approach to promote the oxidation of the HTC-PDS carbon lattice, but its yield was highly dependent on the initial concentration of the (alkaline) oxidiser. The same was not observed for the acid treatment, where doubling the amount of H3PO4 did not change the final C/O ratio.
Overall, the elemental analysis results match well with the SEM and Raman data. The HTC-PDS_KOH_1 sample had the most ordered structure and this is consistent with a chemical profile that has the maximum C/O ratio. Contrastingly, the HTC-PDS_KOH_2 sample—with its spherical particles showing a roughed surface and fairly disordered carbon lattice—was logically the one with the highest oxygen mass fraction and minimal C/O ratio.

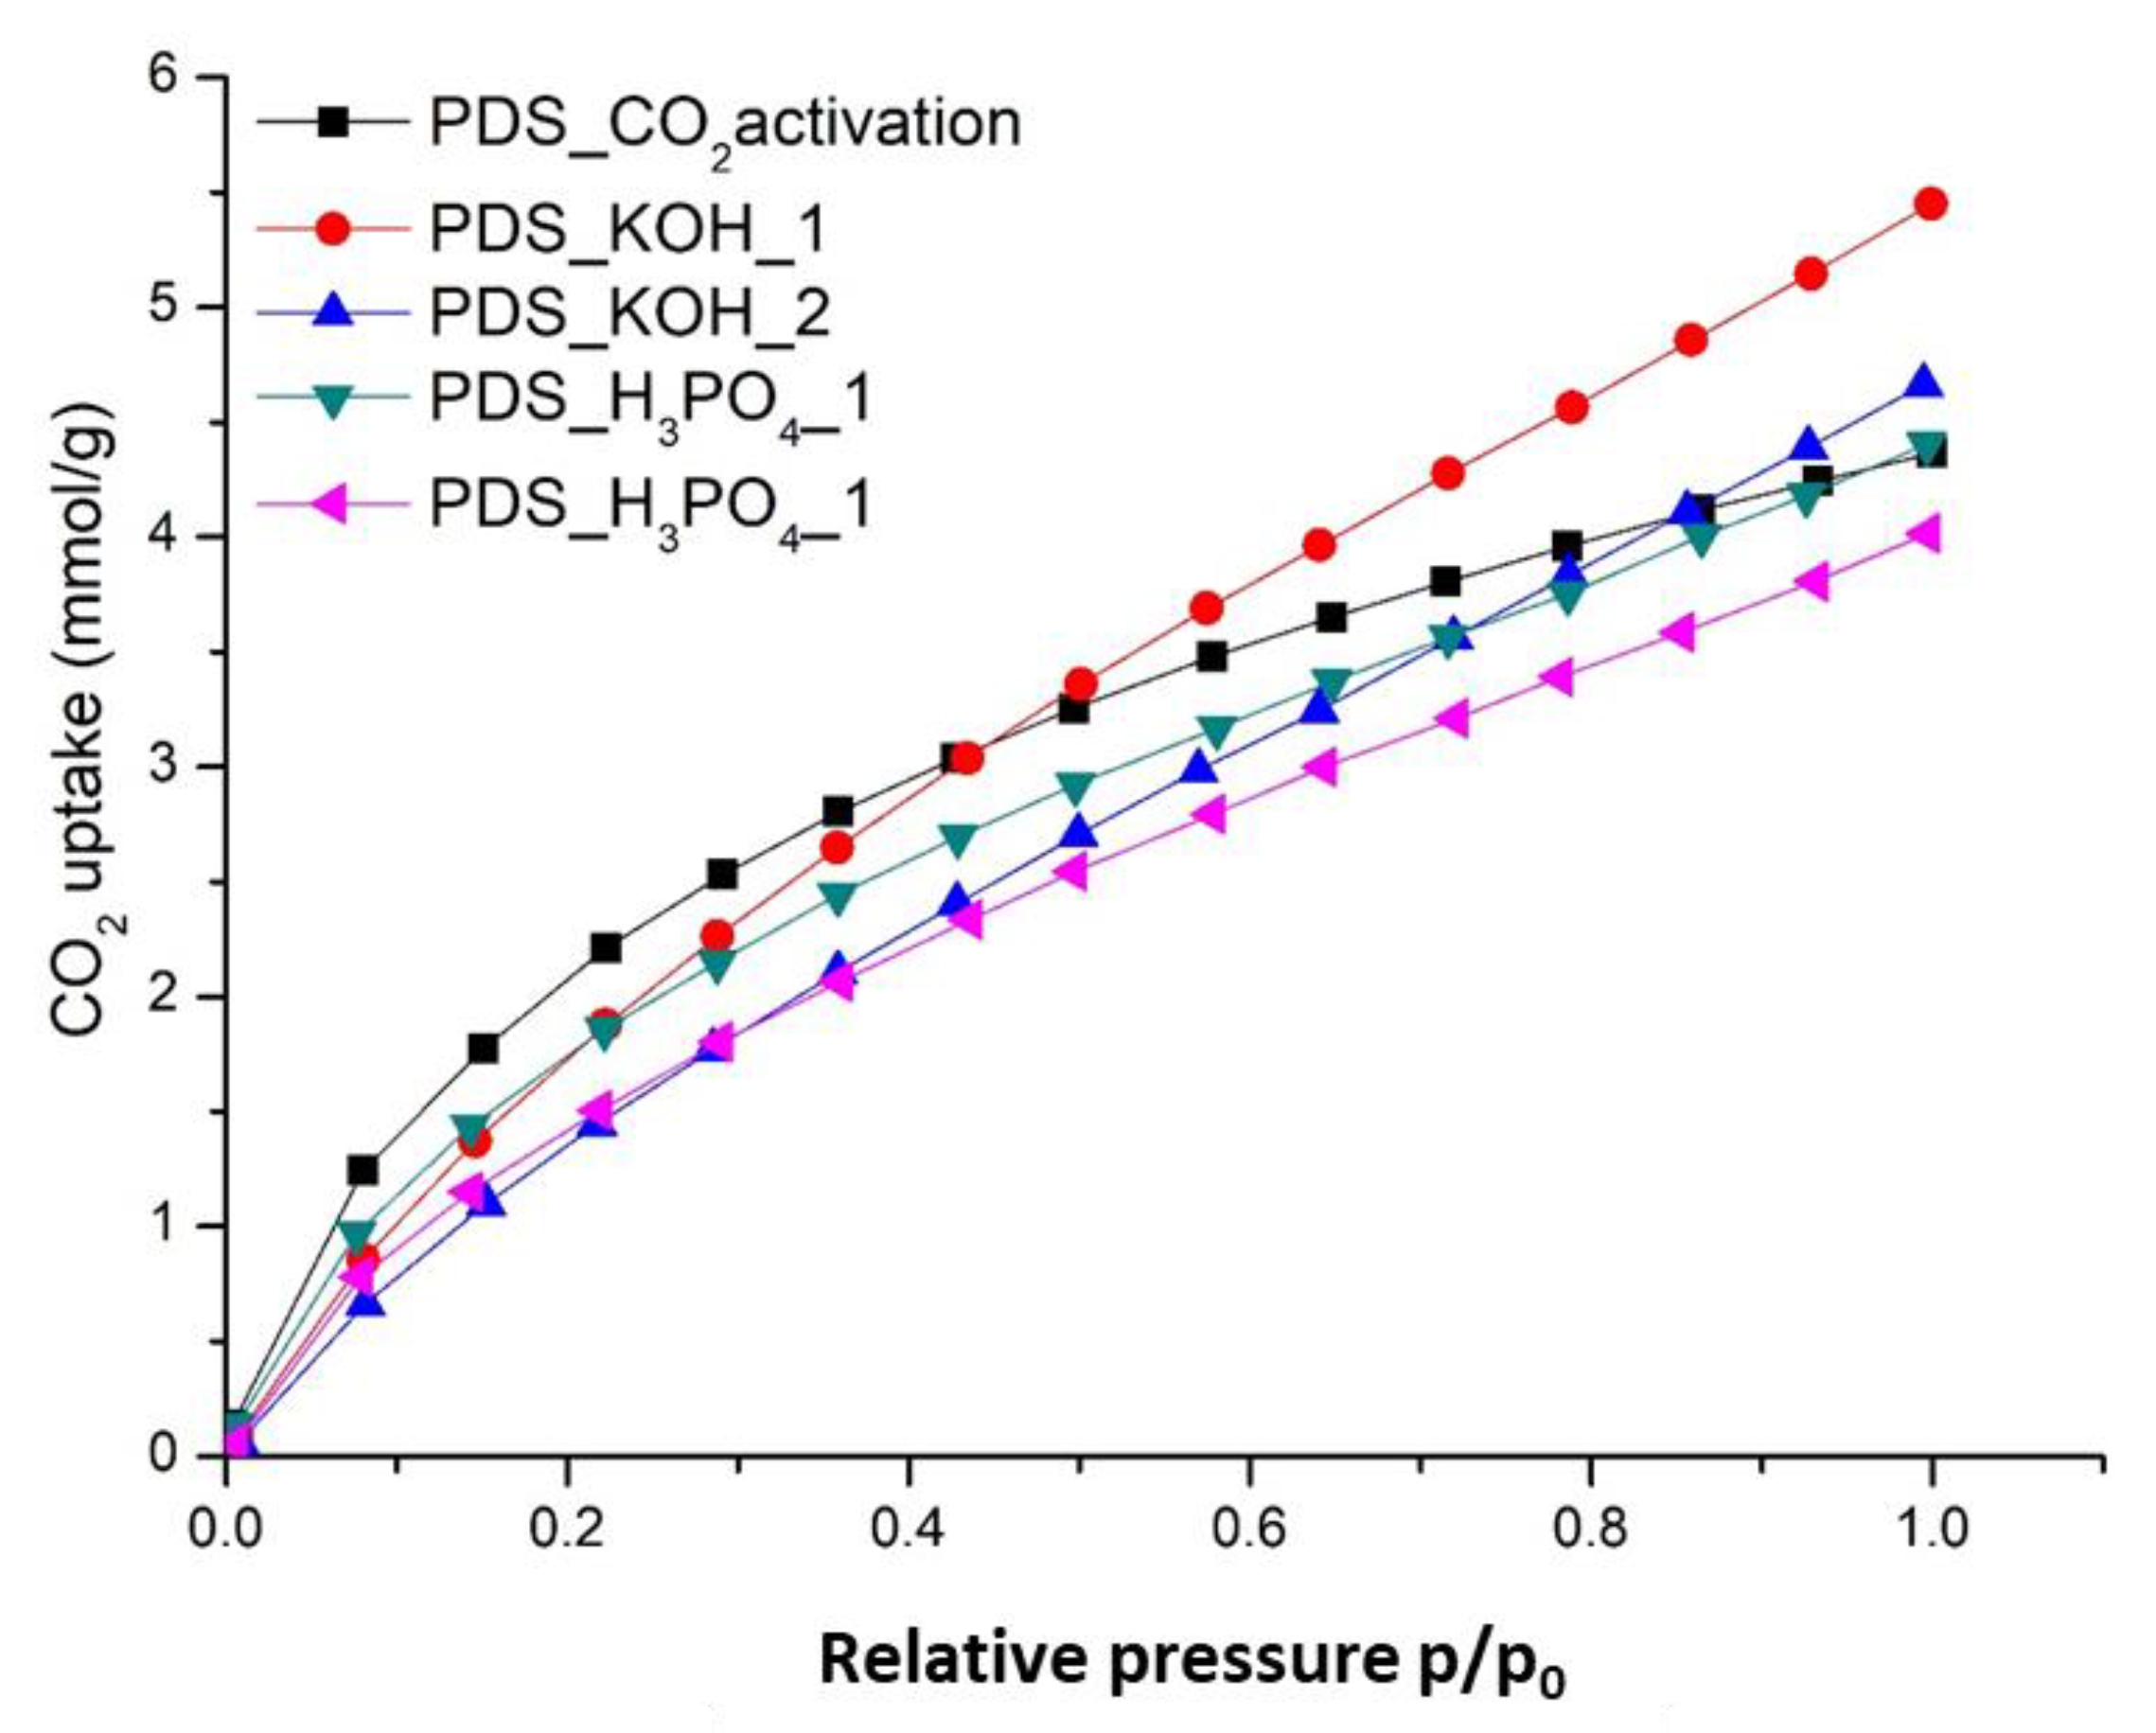
3.2. Porosity of the PDS Carbon Powders

The assessment of the porosity in activated carbon materials is key to understanding their capability to adsorb gases. In Figure 3, the nitrogen adsorption–desorption isotherms (taken at −196 °C) and the pore size distributions of the HTC-PDS (non-activated) of the various activated powders are shown. Whilst the parent HTC-PDS showed negligible N2 sorption, the main textural properties of the activated samples could be calculated and are summarised in Table 2. For comparison, the isotherms of the raw PDS powder are presented in Figure S1.
According to the IUPAC’s nomenclature, all the materials exhibited a type IV adsorption isotherm and a type H4 hysteresis loop in the relative pressure range of 0.4 to 1.0 (Figure 3a). Generally, a type IV isotherm is associated with a well-developed network of mesopores in a powdered material, whilst a type H4 hysteresis loop indicates the presence of slit-shaped mesopores (characteristic of graphitic carbons) [33,34]. It follows from the isotherms and Table 2, that the samples activated with KOH were clearly superior in terms of surface area and pore volume, with the HTC-PDS_KOH_2 sample having the best N2 adsorption performance. The analysis of the pore widths revealed that all the activated powders had a wide pore size distribution (PSD), although there was a common dominant interval between 3.5 nm and 5 nm (Figure 3b). Once again, the alkaline oxidation gave the best results. In fact, the HTC-PDS_KOH_2 sample stands out due to a profile that combined micropores (<2 nm) and mesopores that were slightly larger than those of the rest of the samples. An additional noteworthy result is that the CO2 activation was the least effective in inducing the porosity in the PDS hydrochar.
It has been observed that increasing the activator-to-hydrochar ratio can lead to notable increments in the surface area and pore volume (textural properties) [35]. In the specific case of HTC-PDS, this is attributed to the enhancement of the surface etching of the spherical carbon particles, which ultimately creates mesopores and a random network of these pores (in addition to microporosity) [36,37]. Here, this same action was observed, as the unique mesoporous structure of the HTC-PDS_KOH_2 sample contributed to its higher specific surface area and bimodal pore size distribution. In addition to porosity considerations, it is also possible that the aforementioned lattice defects and/or an O-rich surface chemistry assisted with physically retaining a higher volume of the analytical N2 gas (at −196 °C). Thus, in regards to the surface area and pore volume, the HTC-PDS_KOH_2 sample was clearly the dominant sample, as can be easily seen in the plot of Figure S2.

3.3. CO2 Adsorption Studies

The CO2 adsorption capacities of the activated HTC-PDS materials were measured by the adsorption isotherms at 25 °C under a maximum pressure of 1 bar, as shown in Figure 4. Interestingly, in the lower pressure interval (<0.4), the PDS_CO2 activation surpassed all other samples. In this regime, only the most exposed surfaces would be subjected to interaction with the greenhouse gas. As the pressure builds up, the HTC-PDS_KOH_1 started to stand out, eventually reaching a maximum value of 5.44 mmol g−1 at 1 bar (Figure 4 and Figure S3). Conversely, the HTC-PDS_H3PO4_2 sample provided a minimum of 4.00 mmol g−1. As for the other samples, they had similar uptake values in the high-pressure range (ca. 4.50 mmol g−1). Hence, within the set of samples investigated, there was a differentiation in the CO2 uptake that is not only correlated with the type of activation but also with the concentration of the oxidiser.

3.4. Discussion

The CO2 uptake of HTC-PDS was studied as a function of the activation approach and concentration of oxidiser. Whilst the morphology of the activated carbon particles was equal (all had a spherical shape), the chemical composition differed (viz. the C/O ratios in Table 1). Alongside, there were notable variations in the specific surface area, microporosity and total pore volume. Previously, some of us looked into the total adsorption capacity of CO2 using nanocarbons—specifically, platelets of oxidised graphite [34]. Then, it was concluded that the uptake was not only a function of the specific surface area, but also of the particles’ morphology and surface chemistry.
As described above, the best performance was achieved with the alkaline wet activation. The mechanism of KOH activation was explained by Wang and Kaskel [38], and can be summarised in three steps: (1) an etching (oxidation) of the atomic carbon lattice with the formation of vacancy clusters via redox reactions; (2) a structural disruption (porous structure development) due to high-pressure pockets originating from a build-up of H2O and CO2 vapors (these are redox reaction products); (3) if graphitic crystallites are present, an expansion of the basal planes via the intercalation of potassium cations and formation of slit-shaped extrinsic micropores.
In the present case, whilst the observed differences of surface area and pore volume were important, they do not explain the superiority of the HTC-PDS_KOH_1 sample. In regards to the textural properties, this sample was worse than the analogous HTC-PDS_KOH_2 (Figure S2). Two differences stand out between them: the C/O ratio and the “graphitization” degree. In both cases, the HTC-PDS_KOH_1 sample was clearly superior. The lower concentration of oxygen in this activated carbon powder is understandable, given that half of the KOH oxidiser was used for this sample. For this reason, the oxidiser was fully consumed and the extent of etching (as per step 1 above) was lower, leading to less pore development and allowing the carbon lattice to restructure more efficiently (i.e., carbonization at 900 °C and under a N2 stream). Ultimately, this resulted in the formation of graphitic crystallites in higher amount/size, as exhibited by the Raman spectrum of the HTC-PDS_KOH_1 sample. An immediate consequence of such superior crystalline order was the maximal production of the extrinsic pores mentioned in step 3. With more and better structured graphene layers, the probability of the intercalation of potassium increases. As it is unlikely that the alkali cation would be reduced, its intercalation would lead to a change in the local density of states (LDOS) of the graphene layers. In particular, an electronic depletion of the surface graphene would result in pockets of charge deficit. If so, it is logical that one of the oxygens in the linear CO2 molecule would anchor preferably to such a site, most likely one with a higher adsorption energy. Consequently, the CO2 molecule quadrupole moment would be altered, facilitating any further adsorption and contributing to a larger gas uptake. By contrast, the non-structured porous carbon in the HTC-PDS_KOH_2 sample did not permit such LDOS changes and hence its adsorption capacity was lower. Thus, despite its worse textural properties (surface area and pore volume), the HTC-PDS_KOH_1 sample was superior in the adsorption of CO2 due to the complementary effects of pore development and lattice restructuring. These improved adsorbate–adsorbent electronic interactions are more visible at higher pressures due to the sequential stacking of adsorbed gas on the acceptor-type graphene surfaces. To support this hypothesis, we measured the concentration of potassium in the parent HTC-PDS and the two HTC-PDS_KOH samples. As seen in Table 1, the presence of the alkali metal was considerably higher in the activated powders, even after the thorough post-activation washing steps (with HCl and water). Despite the HTC-PDS_KOH_2 having more KOH in its synthesis mass ratio (hydrochar: KOH, 1:2), it was the HTC-PDS_KOH_1 sample (with 1:1) that showed the highest content of K. This suggests the inclusion of potassium in the microspheres’ surface crystallites, with the additional potassium identified in the HTC-PDS_KOH_1 sample being located in the interstitial spaces (thus resulting in the formation of extrinsic lattice pores) [39].
Given the above, it is useful to compare our results with the literature of biomass-derived activated carbon adsorbents. Table 3 shows the performance of several of these materials (reported for room temperature and 1 bar). Whilst our HTC-PDS_KOH_1 powder had good textural properties, it is not truly outstanding. Still, its CO2 uptake was superior. It is difficult to pinpoint a reason for this. However, reading through the literature, the study of the lattice ordering is a critical point often overlooked. When it is discussed, it is not uncommon that the Raman spectra are dominated by the D-peak and there is an absence of the 2D peak [40]. Furthermore, for those studies using KOH (or other chemical agents), it is rare to see the study of elemental composition. That means that step 3 of the above mechanism is generally ignored or not discussed with proper supporting evidence. In this context, and given the information available, the crystallites with intercalated potassium cations could indeed contribute to the adsorption of CO2 through two mechanisms: (1) the co-intercalation of CO2 molecules and (2) a surface process akin to the formation of an electrostatic double-layer such as that seen in carbon-based supercapacitors [41].

4. Conclusions

Porous carbon materials from palm date seeds have been synthesised via HTC combined with physical or chemical activation. It is clear that, besides the activation route, selecting the appropriate activator ratio was critical to controlling the yield of the CO2 uptake in these samples. Overall, as a result of well-balanced and synergetic effects of chemical oxidation, pore development, lattice restructuring and potassium doping, the HTC-PDS_KOH_1 powder was optimised to adsorb CO2 at room temperature (5.44 mmol g−1, 25 °C, 1 bar). Finally, it is promising that the best performance was achieved for the sample activated with the smallest amount of the chemical agent, since this reinforces the sustainability credentials of the entire process.

Supplementary Materials

The following are available online at https://www.mdpi.com/article/10.3390/ijerph182212142/s1, Table S1: Additional Raman spectral data, along with the ID/IG (intensity ratio of D and G peaks), of the activated HTC-PDS materials, Figure S1: N2 sorption isotherms of the PDS powder (at −196 °C). Figure S2: Effect of the activating agents on the pore structure of the HTC-PDS materials. Figure S3: Comparison of maximum CO2 uptake (at 1 bar) for the different activated samples in Figure 4.

Author Contributions

Conceptualization, A.A. and S.A.N.; methodology, S.A.N. and P.M.; investigation, A.A., S.A.N., P.M. and B.E.H.; resources; writing—original draft preparation, A.A.; writing—review and editing, All authors; supervision, P.M.F.J.C. and M.M.T.; funding acquisition, A.A., P.M.F.J.C. and M.M.T. All authors have read and agreed to the published version of the manuscript.

Funding

This research was funded by University of Hafr Albatin, grant number 4507.

Institutional Review Board Statement

Not applicable.

Informed Consent Statement

Not applicable.

Data Availability Statement

Not applicable.

Acknowledgments

The authors extend their appreciation to the Deanship of Scientific Research, University of Hafr Al Batin for funding this work through the research project no. 4507. The KAUST is thanked for its continuous financial support (BAS/1/1346-01-01).

Conflicts of Interest

The authors declare no conflict of interest. The author Sabina Alexandra Nicolae is an employee of MDPI, however, she does not work for the journal IJERPH at the time of submission and publication.

References

  1. Siriwardane, R.V.; Shen, M.-S.; Fisher, E.P.; Poston, J.A. Adsorption of CO2 on Molecular Sieves and Activated Carbon. Energy Fuels 2001, 15, 279–284. [Google Scholar] [CrossRef]
  2. Lee, S.-Y.; Park, S.-J. Determination of the optimal pore size for improved CO2 adsorption in activated carbon fibers. J. Colloid Interface Sci. 2013, 389, 230–235. [Google Scholar] [CrossRef]
  3. Jadhav, P.D.; Chatti, R.V.; Biniwale, R.B.; Labhsetwar, N.K.; Devotta, S.; Rayalu, S.S. Monoethanol Amine Modified Zeolite 13X for CO2 Adsorption at Different Temperatures. Energy Fuels 2007, 21, 3555–3559. [Google Scholar] [CrossRef]
  4. Gray, M.L.; Soong, Y.; Champagne, K.J.; Pennline, H.; Baltrus, J.P.; Stevens, R.W.; Khatri, R.; Chuang, S.S.C.; Filburn, T. Improved immobilized carbon dioxide capture sorbents. Fuel Process. Technol. 2005, 86, 1449–1455. [Google Scholar] [CrossRef]
  5. Su, F.; Lu, C.; Cnen, W.; Bai, H.; Hwang, J.F. Capture of CO2 from flue gas via multiwalled carbon nanotubes. Sci. Total Environ. 2009, 407, 3017–3023. [Google Scholar] [CrossRef] [PubMed]
  6. Pellerano, M.; Pré, P.; Kacem, M.; Delebarre, A. CO2 capture by adsorption on activated carbons using pressure modulation. Energy Procedia 2009, 1, 647–653. [Google Scholar] [CrossRef] [Green Version]
  7. Lu, C.; Bai, H.; Wu, B.; Su, F.; Hwang, J.F. Comparative study of CO2 capture by carbon nanotubes, activated carbons, and zeolites. Energy Fuels 2008, 22, 3050–3056. [Google Scholar] [CrossRef]
  8. Serna-Guerrero, R.; Belmabkhout, Y.; Sayari, A. Further investigations of CO2 capture using triamine-grafted pore-expanded mesoporous silica. Chem. Eng. J. 2010, 158, 513–519. [Google Scholar] [CrossRef]
  9. Siriwardane, R.V.; Shen, M.-S.; Fisher, E.P.; Losch, J. Adsorption of CO2 on zeolites at moderate temperatures. Energy Fuels 2005, 19, 1153–1159. [Google Scholar] [CrossRef]
  10. Zhao, Z.; Li, Z.; Lin, Y. Adsorption and diffusion of carbon dioxide on metal−organic framework (MOF-5). Ind. Eng. Chem. Res. 2009, 48, 10015–10020. [Google Scholar] [CrossRef]
  11. Arenillas, A.; Smith, K.; Drage, T.; Snape, C. CO2 capture using some fly ash-derived carbon materials. Fuel 2005, 84, 2204–2210. [Google Scholar] [CrossRef]
  12. Lua, A.C.; Guo, J. Preparation and characterization of activated carbons from oil-palm stones for gas-phase adsorption. Colloids Surf. A Physicochem. Eng. Asp. 2001, 179, 151–162. [Google Scholar] [CrossRef]
  13. Guangzhi, Y.; Jinyu, Y.; Yuhua, Y.; Zhihong, T.; DengGuang, Y.; Junhe, Y. Preparation and CO2 adsorption properties of porous carbon from camphor leaves by hydrothermal carbonization and sequential potassium hydroxide activation. RSC Adv. 2017, 7, 4152–4160. [Google Scholar] [CrossRef] [Green Version]
  14. Islam, M.A.; Tan, I.A.W.; Benhouria, A.; Asif, M.; Hameed, B.H. Mesoporous and adsorptive properties of palm date seed activated carbon prepared via sequential hydrothermal carbonization and sodium hydroxide activation. Chem. Eng. J. 2015, 270, 187–195. [Google Scholar] [CrossRef]
  15. El-Habba, M.S.; Al-Mulhim, F. The competitiveness of the Saudi Arabian date palm: An analytical study. Afr. J. Agric. Res. 2013, 8, 5260–5267. [Google Scholar]
  16. Nasser, R.A.-S. An evaluation of the use of midribs from common date palm cultivars grown in Saudi Arabia for energy production. BioResources 2014, 9, 4343–4357. [Google Scholar] [CrossRef]
  17. Chandrasekaran, M.; Bahkali, A.H. Valorization of date palm (Phoenix dactylifera) fruit processing by-products and wastes using bioprocess technology–Review. Saudi J. Biol. Sci. 2013, 20, 105–120. [Google Scholar] [CrossRef] [Green Version]
  18. Plaza, M.G.; González, A.S.; Pevida, C.; Pis, J.J.; Rubiera, F. Valorisation of spent coffee grounds as CO2 adsorbents for postcombustion capture applications. Appl. Energy 2012, 99, 272–279. [Google Scholar] [CrossRef] [Green Version]
  19. Bouchelta, C.; Medjram, M.S.; Bertrand, O.; Bellat, J.-P. Preparation and characterization of activated carbon from date stones by physical activation with steam. J. Anal. Appl. Pyrolysis 2008, 82, 70–77. [Google Scholar] [CrossRef]
  20. Al-Muhtaseb, S.A.; El-Naas, M.H.; Abdallah, S. Removal of aluminum from aqueous solutions by adsorption on date-pit and BDH activated carbons. J. Hazard. Mater. 2008, 158, 300–307. [Google Scholar] [CrossRef] [PubMed]
  21. El Nemr, A.; Khaled, A.; Abdelwahab, O.; El-Sikaily, A. Treatment of wastewater containing toxic chromium using new activated carbon developed from date palm seed. J. Hazard. Mater. 2008, 152, 263–275. [Google Scholar] [CrossRef]
  22. Al-Ghouti, M.A.; Li, J.; Salamh, Y.; Al-Laqtah, N.; Walker, G.; Ahmad, M.N. Adsorption mechanisms of removing heavy metals and dyes from aqueous solution using date pits solid adsorbent. J. Hazard. Mater. 2010, 176, 510–520. [Google Scholar] [CrossRef] [PubMed]
  23. Bouchelta, C.; Medjram, M.S.; Zoubida, M.; Chekkat, F.A.; Ramdane, N.; Bellat, J.-P. Effects of pyrolysis conditions on the porous structure development of date pits activated carbon. J. Anal. Appl. Pyrolysis 2012, 94, 215–222. [Google Scholar] [CrossRef]
  24. Abed, I.; Paraschiv, M.; Loubar, K.; Zagrouba, F.; Tazerout, M. Thermogravimetric investigation and thermal conversion kinetics of typical North-Africa and middle-east lignocellulosic wastes. BioResources 2012, 7, 1120–1220. [Google Scholar]
  25. Zhu, X.; Liu, Y.; Qian, F.; Zhou, C.; Zhang, S.; Chen, J. Role of Hydrochar Properties on the Porosity of Hydrochar-based Porous Carbon for Their Sustainable Application. ACS Sustain. Chem. Eng. 2015, 3, 833–840. [Google Scholar] [CrossRef]
  26. Peng, N.; Gai, C.; Peng, C. Enhancing hydrogen-rich syngas production and energy recovery efficiency by integrating hydrothermal carbonization pretreatment with steam gasification. Energy 2020, 210, 118655. [Google Scholar] [CrossRef]
  27. Heidari, M.; Salaudeen, S.; Arku, P.; Acharya, B.; Tasnim, S.; Dutta, A. Development of a mathematical model for hydrothermal carbonization of biomass: Comparison of experimental measurements with model predictions. Energy 2021, 214, 119020. [Google Scholar] [CrossRef]
  28. Wu, K.; Zhang, X.; Yuan, Q.; Liu, R. Investigation of physico-chemical properties of hydrochar and composition of bio-oil from the hydrothermal treatment of dairy manure: Effect of type and usage volume of extractant. Waste Manag. 2020, 116, 157–165. [Google Scholar] [CrossRef] [PubMed]
  29. De, S.; Balu, A.M.; van der Waal, J.C.; Luque, R. Biomass-derived porous carbon materials: Synthesis and catalytic applications. ChemCatChem 2015, 7, 1608–1629. [Google Scholar] [CrossRef]
  30. Titirici, M.M.; Thomas, A.; Antonietti, M. Replication and coating of silica templates by hydrothermal carbonization. Adv. Funct. Mater. 2007, 17, 1010–1018. [Google Scholar] [CrossRef]
  31. Liu, J.; Yang, T.; Wang, D.-W.; Lu, G.Q.M.; Zhao, D.; Qiao, S.Z. A facile soft-template synthesis of mesoporous polymeric and carbonaceous nanospheres. Nat. Commun. 2013, 4, 1–7. [Google Scholar] [CrossRef]
  32. Chen, W.; Zhou, X.; Shi, S.; Thiphuong, N.; Chen, M. Synergistical enhancement of the electrochemical properties of lignin-based activated carbon using NH3·H2O dielectric barrier discharge plasma. RSC Adv. 2017, 7, 7392–7400. [Google Scholar] [CrossRef] [Green Version]
  33. Tsai, H.-M.; Yang, S.-J.; Ma, C.-C.M.; Xie, X. Preparation and electrochemical activities of iridium-decorated graphene as the electrode for all-vanadium redox flow batteries. Electrochim. Acta 2012, 77, 232–236. [Google Scholar] [CrossRef]
  34. Alazmi, A.; El Tall, O.; Hedhili, M.N.; Costa, P.M. The impact of surface chemistry and texture on the CO2 uptake capacity of graphene oxide. Inorg. Chim. Acta 2018, 482, 470–477. [Google Scholar] [CrossRef] [Green Version]
  35. Ghosh, S.; Barron, A.R. The effect of KOH concentration on chemical activation of porous carbon sorbents for carbon dioxide uptake and carbon dioxide–methane selectivity: The relative formation of micro-(<2 nm) versus meso-(>2 nm) porosity. Sustain. Energy Fuels 2017, 1, 806–813. [Google Scholar] [CrossRef]
  36. Yang, S.-Y.; Chang, K.-H.; Huang, Y.-L.; Lee, Y.-F.; Tien, H.-W.; Li, S.-M.; Lee, Y.-H.; Liu, C.-H.; Ma, C.-C.M.; Hu, C.-C. A powerful approach to fabricate nitrogen-doped graphene sheets with high specific surface area. Electrochem. Commun. 2012, 14, 39–42. [Google Scholar] [CrossRef]
  37. Islam, M.A.; Ahmed, M.J.; Khanday, W.A.; Asif, M.; Hameed, B.H. Mesoporous activated carbon prepared from NaOH activation of rattan (Lacosperma secundiflorum) hydrochar for methylene blue removal. Ecotoxicol. Environ. Saf. 2017, 138, 279–285. [Google Scholar] [CrossRef]
  38. Wang, J.; Kaskel, S. KOH activation of carbon-based materials for energy storage. J. Mater. Chem. 2012, 22, 23710–23725. [Google Scholar] [CrossRef]
  39. Xue, R.; Shen, Z. Formation of graphite-potassium intercalation compounds during activation of MCMB with KOH. Carbon 2003, 41, 1862–1864. [Google Scholar] [CrossRef]
  40. Serafin, J.; Baca, M.; Biegun, M.; Mijowska, E.; Kaleńczuk, R.J.; Sreńscek-Nazzal, J.; Michalkiewicz, B. Direct conversion of biomass to nanoporous activated biocarbons for high CO2 adsorption and supercapacitor applications. Appl. Surf. Sci. 2019, 497, 143722. [Google Scholar] [CrossRef]
  41. Qazvini, O.T.; Babarao, R.; Telfer, S.G. Selective capture of carbon dioxide from hydrocarbons using a metal-organic framework. Nat. Commun. 2021, 12, 1–8. [Google Scholar] [CrossRef] [PubMed]
  42. Ogungbenro, A.E.; Quang, D.V.; Al-Ali, K.A.; Vega, L.F.; Abu-Zahra, M.R. Physical synthesis and characterization of activated carbon from date seeds for CO2 capture. J. Environ. Chem. Eng. 2018, 6, 4245–4252. [Google Scholar] [CrossRef]
  43. González, A.; Plaza, M.; Rubiera, F.; Pevida, C. Sustainable biomass-based carbon adsorbents for post-combustion CO2 capture. Chem. Eng. J. 2013, 230, 456–465. [Google Scholar] [CrossRef] [Green Version]
  44. Su, W.; Wang, R.; Zhao, T. CO2-imprinted Sustainable Carbon Derived from Sunflower Heads for Highly Effective Capture of CO2 from Flue Gas. Aerosol Air Qual. Res. 2020, 20, 180–192. [Google Scholar] [CrossRef] [Green Version]
  45. Díez, N.; Álvarez, P.; Granda, M.; Blanco, C.; Santamaría, R.; Menéndez, R. CO2 adsorption capacity and kinetics in nitrogen-enriched activated carbon fibers prepared by different methods. Chem. Eng. J. 2015, 281, 704–712. [Google Scholar] [CrossRef] [Green Version]
Figure 1. SEM images of the (a) HTC-PDS and (bf) the corresponding activated materials.
Ijerph 18 12142 g001
Figure 2. Raman spectra for the HTC-PDS and the respective activated carbon materials.
Ijerph 18 12142 g002
Figure 3. (a) N2 sorption isotherms and (b) the pore size distributions of the HTC-PDS and respective activated materials. The measurements were performed at −196 °C with N2.
Ijerph 18 12142 g003
Figure 4. Pure component CO2 adsorption isotherms, measured at 25 °C and up to 1 bar, of the activated HTC-PDS powders.
Ijerph 18 12142 g004
Table 1. Elemental analysis of the parent HTC-PDS and the respective activated materials. n.a. = not available.
SampleElemental Composition (wt %)C/O RatioK
(ppm)
CNHO
HTC-PDS67.61.45.125.92.6586
HTC-PDS_CO2 activation81.11.71.415.85.1n.a.
HTC-PDS_KOH_187.80.60.311.37.78840
HTC-PDS_KOH_257.40.40.541.71.48415
HTC-PDS_H3PO4_169.41.42.027.22.5n.a.
HTC-PDS_H3PO4_270.21.32.026.52.6n.a.
Table 2. Textural properties of the HTC-PDS-activated materials. *μV = micropore volume.
SampleSBET (m2 g−1)SDR
(m2 g−1)
SDFT
(m2 g−1)
*μV
(cm3 g−1)
PV
(cm3 g−1)
HTC-PDS_CO28589499100.340.39
HTC-PDS_KOH_11906218918670.781.06
HTC-PDS_KOH_22335255221220.901.54
HTC-PDS_H3PO4_11218140312510.500.50
HTC-PDS_H3PO4_21439167410860.600.60
Table 3. The adsorbent performance of some activated porous carbon materials, generally derived from biomass, at 25 °C and maximum CO2 pressure of 1 bar. n.a. = not available. * MIP = molecularly imprinted polymers.
PrecursorActivation MethodBET Surface Area
(m2 g−1)
Pore Volume
(cm3 g−1)
Structure
(ID/IG)
CO2 Adsorption
(mmol g−1)
Ref.
Commercial activated carbon-6980.21n.a.2.18[42]
Palm date seeds (UAE)Physical activation (under CO2)7980.28n.a.3.20[42]
Olive stones/almond
shells
Physical activation (under CO2)11130.51n.a.1.02[43]
CO2–MIP *Chemical activation (KOH)--n.a.1.71[44]
Camphor leavesChemical activation (KOH)16330.98n.a.0.80[14]
Oil-based pitchChemical activation (KOH)17200.98n.a.1.90[45]
Activated biocarbonChemical activation (KOH)19681.140.61.67[40]
Palm date seeds (KSA)Chemical activation (KOH)19061.061.15.44This work
Publisher’s Note: MDPI stays neutral with regard to jurisdictional claims in published maps and institutional affiliations.

