
Use of the Species Sensitivity Distribution Approach to Derive Ecological Threshold of Toxicological Concern (eco-TTC) for Pesticides


Abstract
:1. Introduction
2. Materials and Methods
2.1. Selection of Data
- Original studies reporting HC5 values were published in peer-reviewed journals;
- The HC5 values reported in the studies passed the test of normality (e.g., Anderson-Darling goodness-of-fit test);
- The HC5 values were referred to the same toxicological endpoints (e.g., growth, mortality).
2.2. Toxicity Ratios
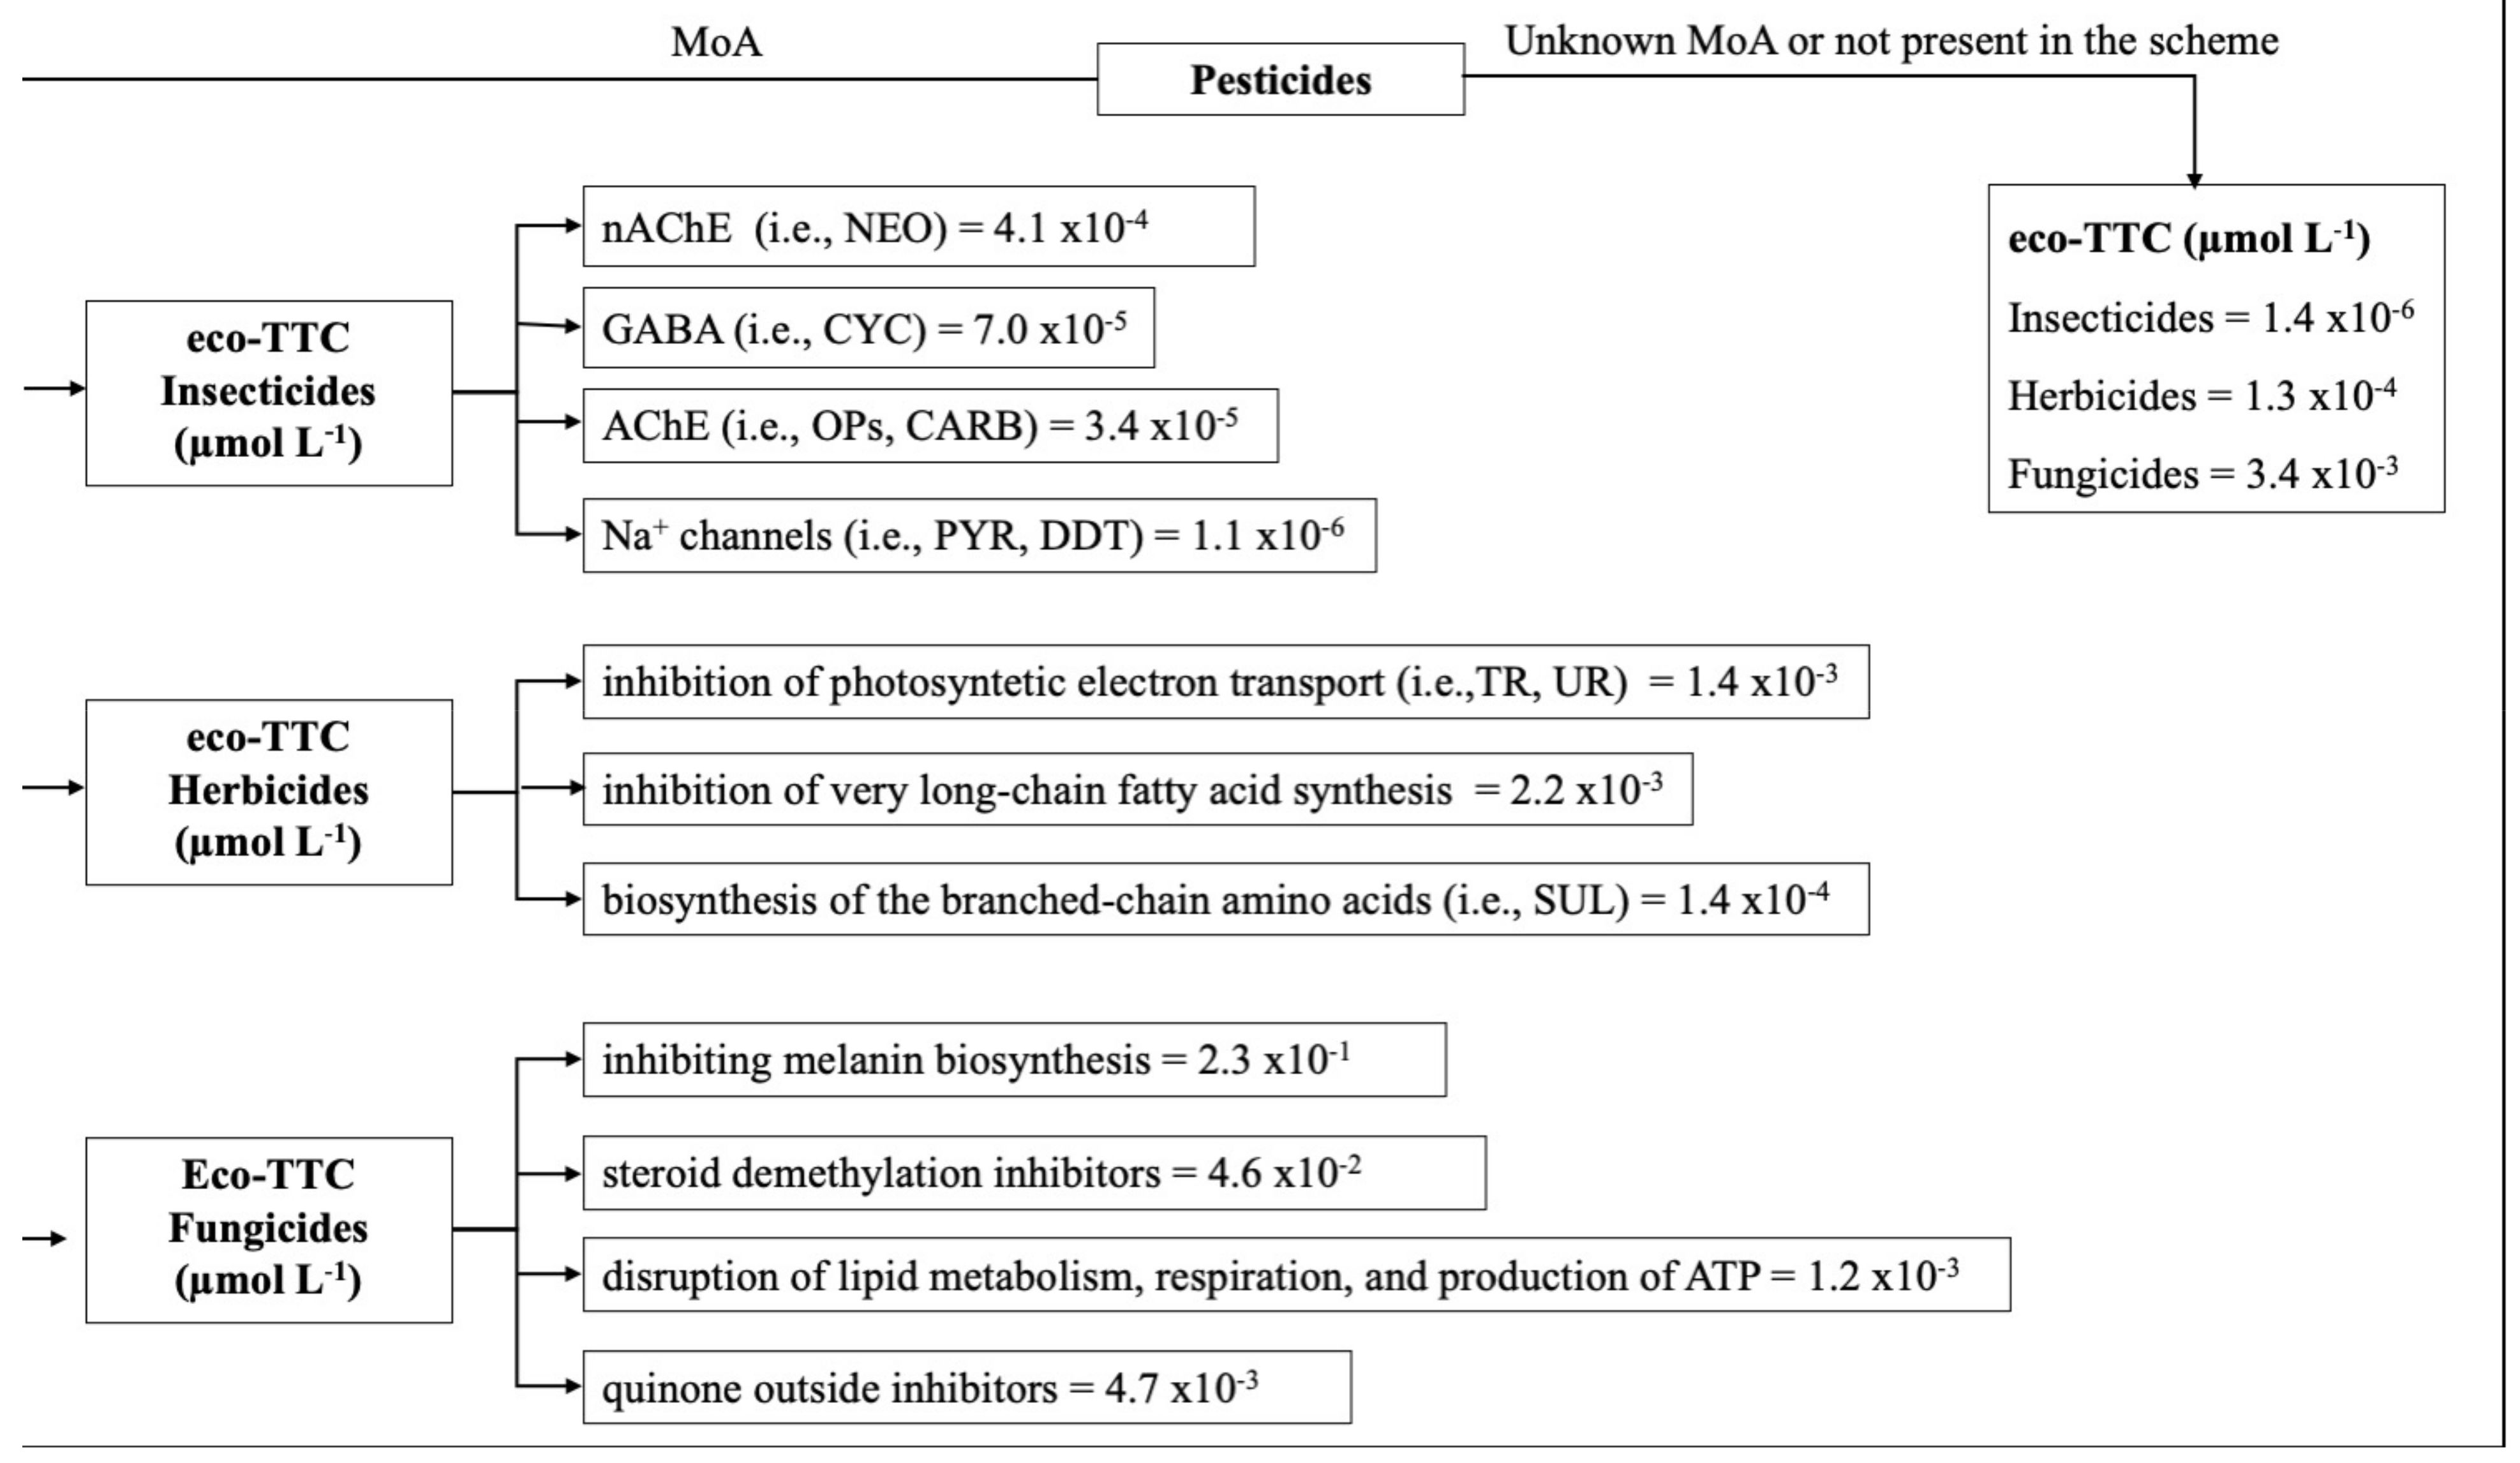
2.3. Ecological Threshold of Toxicological Concern (eco-TTC)
3. Results
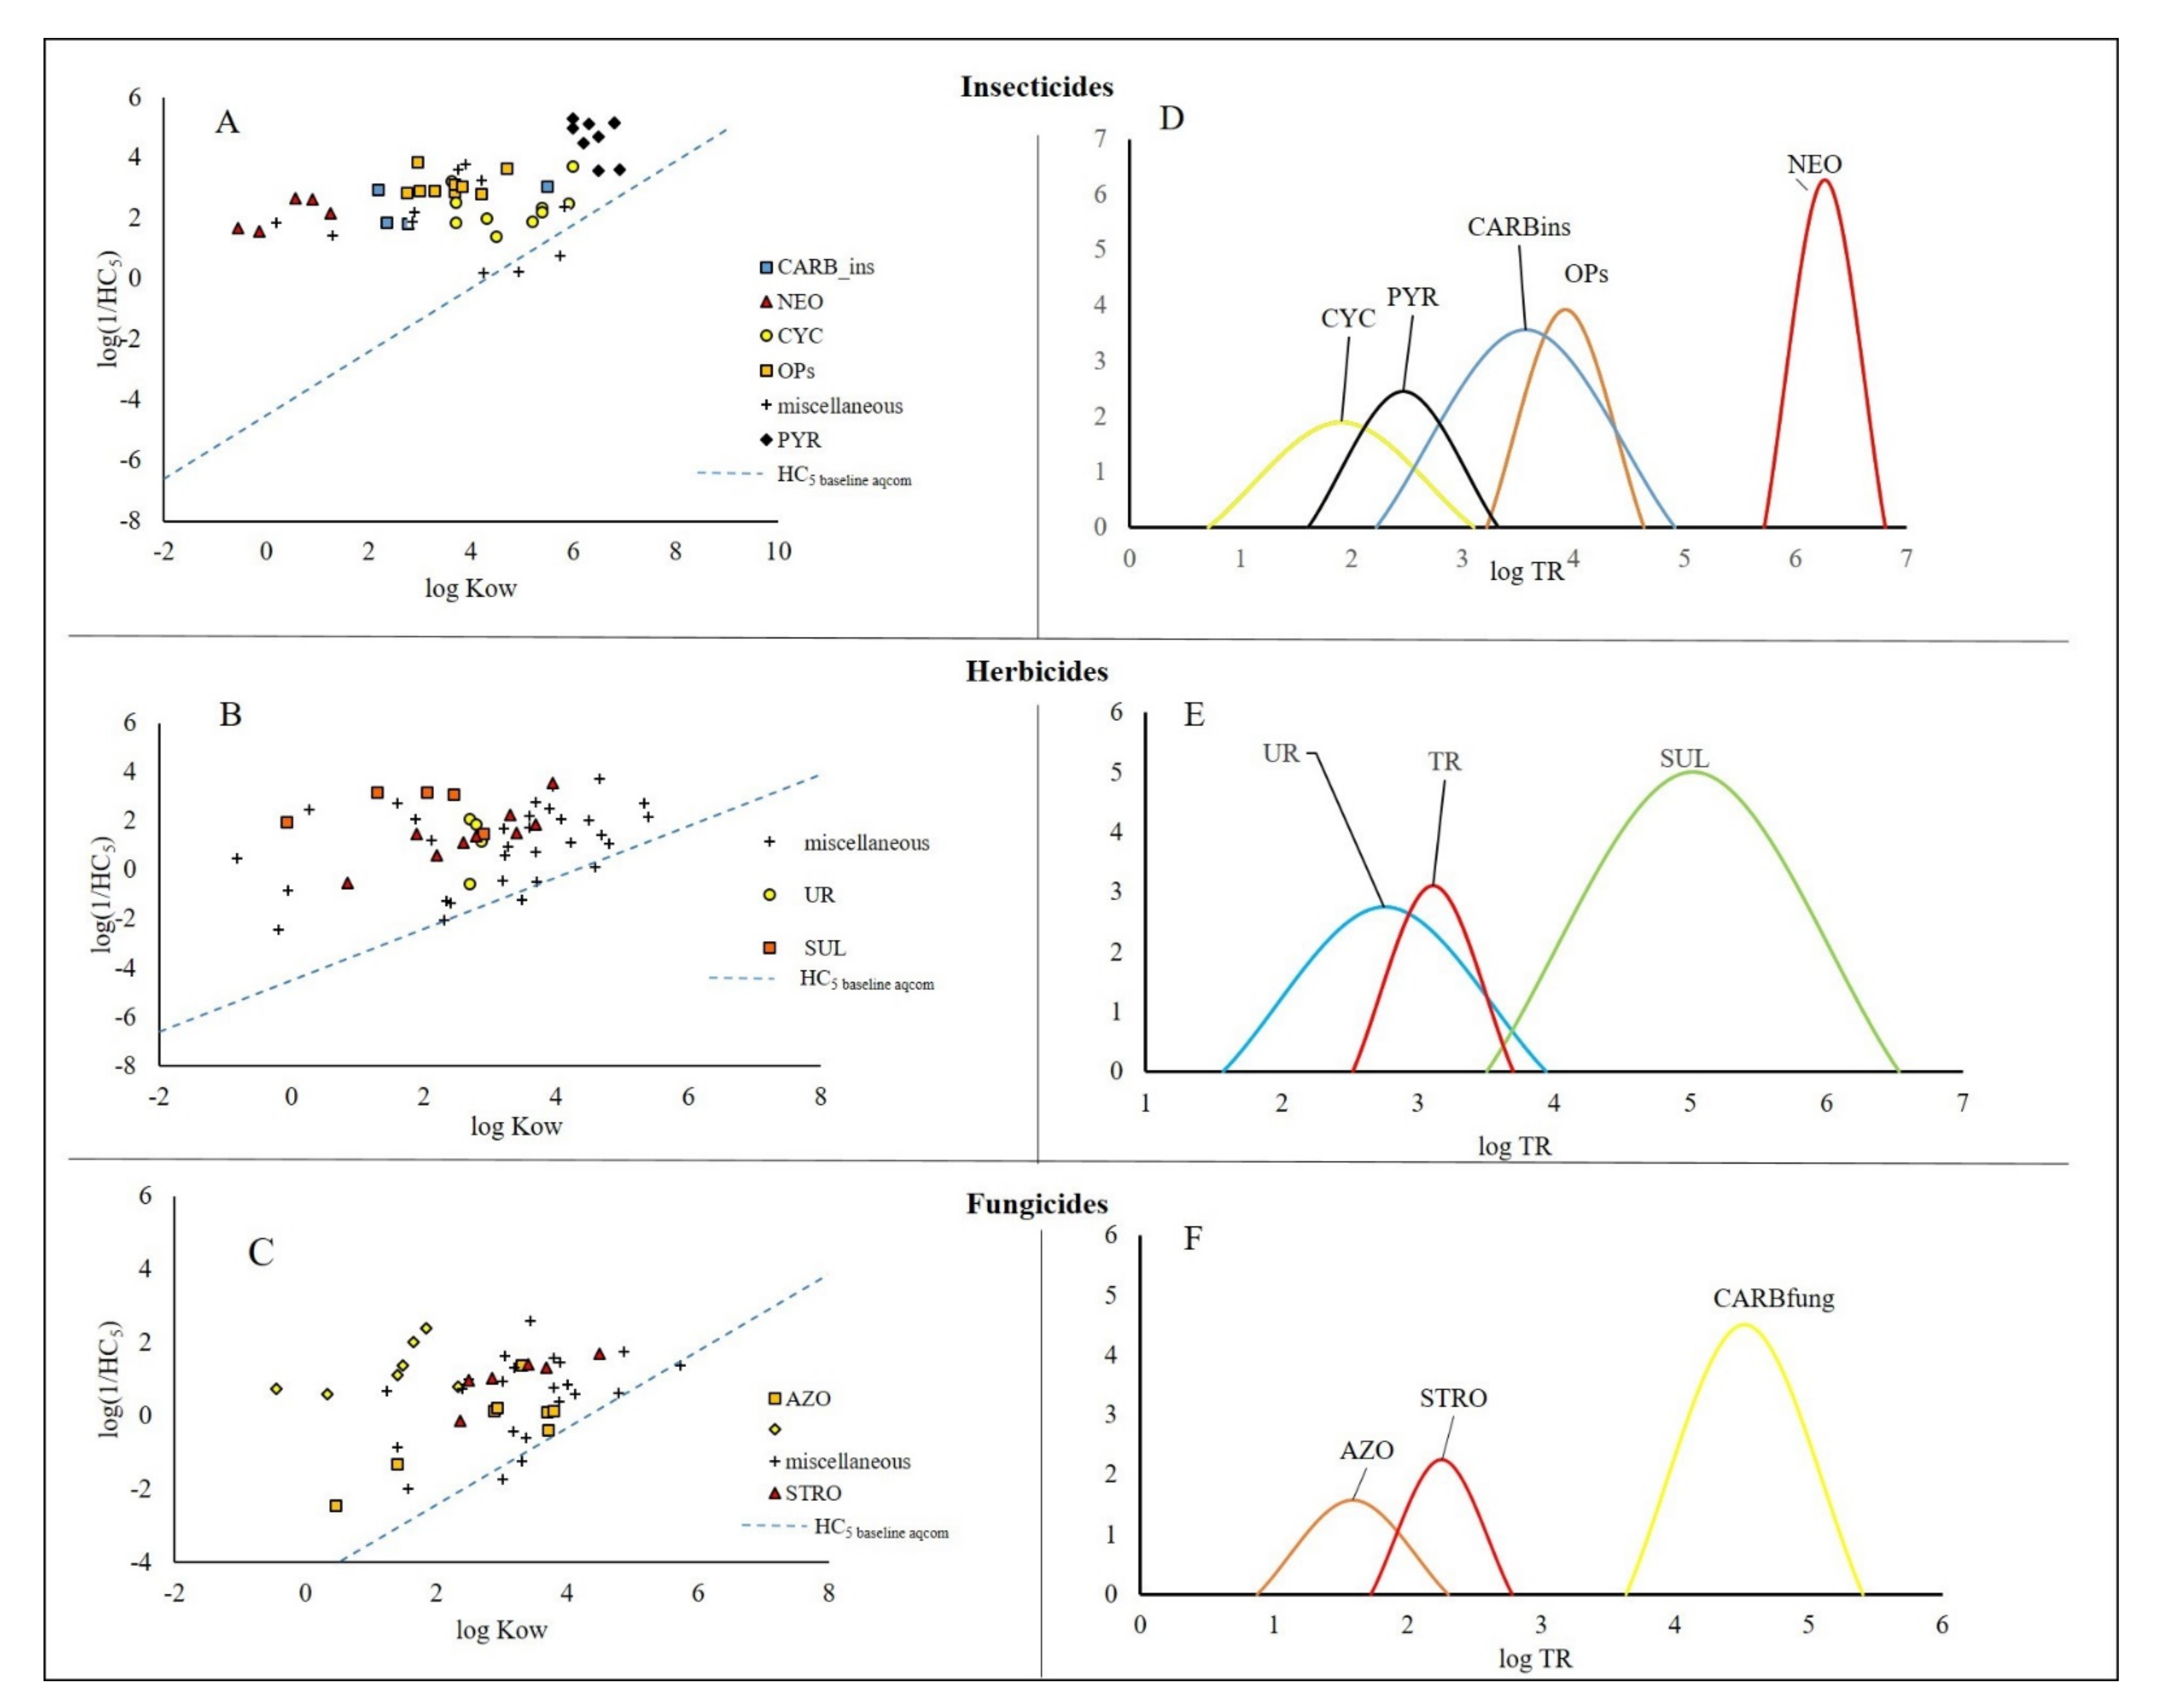
3.1. Insecticides
3.2. Herbicides
3.3. Fungicides
3.4. Effects of Pesticides on Aquatic Freshwater Communities in Relation to Their Specificity of Mode of Action (MoA)
3.5. Use of Available HC5 and Mechanism of Action for Risk Assessment and Management
4. Conclusions
Supplementary Materials
Author Contributions
Funding
Institutional Review Board Statement
Informed Consent Statement
Data Availability Statement
Conflicts of Interest
References
- Hoekstra, J.A.; Vaal, J.A.; Notenboom, J.; Slooff, W. Variation in the sensitivity of aquatic species to toxicants. Bull. Environ. Contam. Tox. 1994, 53, 98–105. [Google Scholar] [CrossRef] [PubMed]
- Notenboom, J.; Vaal, M.A.; Hoekstra, J.A. Using comparative ecotoxicology to develop quantitative species sensitivity relationships (QSSR). Environ. Sci. Pollut. Res. 1995, 2, 242–243. [Google Scholar] [CrossRef] [PubMed]
- Vaal, M.A.; van Leeuwen, C.J.; Hoekstra, J.A.; Hermens, J.L.M. Variation in sensitivity of aquatic species to toxicants: Practical consequences for effect assessment of chemical substances. Environ. Manag. 2000, 25, 415–423. [Google Scholar] [CrossRef]
- De Zwart, D. Observed regularities in SSDs for aquatic species. In Species Sensitivity Distributions in Ecotoxicology; Posthuma, L., Suter, G.W., II, Traas, T.P., Eds.; Lewis Publishers: Boca Raton, FL, USA, 2002; pp. 133–154. [Google Scholar]
- Van Straalen, N.M.; Denneman, C.A.J. Ecotoxicological evaluation of soil quality criteria. Ecotox. Environ. Safe 1989, 18, 241–251. [Google Scholar] [CrossRef]
- Wagner, C.; Løkke, H. Estimation of ecotoxicological protection levels from NOEC toxicity data. Water Res. 1991, 25, 1237–1242. [Google Scholar] [CrossRef]
- Jagoe, R.H.; Newman, M.C. Bootstrap estimation of community NOEC values. Ecotoxicology 1997, 6, 293–306. [Google Scholar] [CrossRef]
- Stephan, C.E. Use of species sensitivity distributions in the derivation of water quality criteria for aquatic life by the US Environmental Protection Agency. In Species Sensitivity Distributions in Ecotoxicology; Posthuma, L., Suter, G.W., II, Traas, T.P., Eds.; Lewis Publishers: Boca Raton, FL, USA, 2002; pp. 211–220. [Google Scholar]
- Van Straalen, N.M.; van Leeuwen, C.J. European history of species sensitivity distributions. In Species Sensitivity Distributions in Ecotoxicology; Posthuma, L., Suter, G.W., II, Traas, T.P., Eds.; Lewis Publishers: Boca Raton, FL, USA, 2002; pp. 19–34. [Google Scholar]
- Posthuma, L.; Suter, G.W.; Traas, T.P. Species-Sensitivity Distributions in Ecotoxicology; Lewis Publishers: Boca Raton, FL, USA, 2002. [Google Scholar]
- ECHA (European Chemical Agency). Guidance on Information Requirements and Chemical Safety Assessment. Chapter R.10: Characterisation of Dose [Concentration]-Response for Environment; European Chemicals Agency: Helsinki, Finland, 2008. [Google Scholar]
- Finizio, A.; Vighi, M. Predicted No Effect Concentration (PNEC). In Encyclopedia of Toxicology; Wexler, P., Ed.; Academic Press: Cambridge, MA, USA, 2014; Volume 3, pp. 1061–1065. [Google Scholar]
- Posthuma, L.; van Gils, J.; Zijp, M.C.; van de Meent, D.; de Zwart, D. Species sensitivity distributions for use in environmental protection, assessment, and management of aquatic ecosystems for 12386 chemicals. Environ. Toxicol. Chem. 2019, 8, 905–917. [Google Scholar] [CrossRef] [Green Version]
- Slooff, W.; Canton, J.H.; Hermens, J.L.M. Comparison of the susceptibility of 22 freshwater species to 15 chemical compounds. I. (Sub)acute toxicity tests. Aquat. Toxicol. 1983, 4, 113–128. [Google Scholar] [CrossRef]
- LeBlanc, G.A. Interspecies relationships in acute toxicity of chemicals to aquatic organisms. Environ. Toxicol. Chem. 1984, 3, 47–60. [Google Scholar] [CrossRef]
- Thurston, R.V.; Gilfoil, T.A.; Meyn, E.L.; Zajdel, R.K.; Aoki, T.I.; Veith, G.D. Comparative toxicity of ten organic chemicals to ten common aquatic species. Water Res. 1985, 19, 1145–1155. [Google Scholar] [CrossRef]
- Holcombe, G.W.; Phipps, G.L.; Sulaiman, A.H.; Hofman, A.D. Simultaneous multiple species testing: Acute toxicity of 13 chemicals to 12 diverse freshwater amphibian, fish, and invertebrate families. Arch. Environ. Contam. Tox. 1987, 16, 679–710. [Google Scholar] [CrossRef] [PubMed]
- Tremolada, P.; Finizio, A.; Villa, S.; Gaggi, C.; Vighi, M. Quantitative inter-specific chemical activity relationships of pesticides in the aquatic environment. Aquat. Toxicol. 2004, 67, 87–103. [Google Scholar] [CrossRef] [PubMed]
- Le Page, G.; Gunnarsson, L.; Trznadel, M.; Wedgwood, K.C.A.; Baudrot, V.; Snape, J.; Tyler, C.R. Variability in cyanobacteria sensitivity to antibiotics and implications for environmental risk assessment. Sci. Total Environ. 2019, 695, 133804. [Google Scholar] [CrossRef] [PubMed]
- Verhaar, H.J.M.; van Leeuwen, C.J.; Hermens, J.L.M. Classifying environmental pollutants. 1. Structure activity relationships for prediction of aquatic toxicity. Chemosphere 1992, 25, 471–491. [Google Scholar] [CrossRef]
- Veith, G.D.; Call, D.J.; Brooke, L.T. Structure-toxicity relationship for the fathead minnow Pimephales promelas: Narcotic industrial chemicals. Can. J. Fish. Aquat. Sci. 1983, 40, 743–748. [Google Scholar] [CrossRef]
- Kienzler, A.; Barron, M.G.; Belanger, S.E.; Beasley, A. Embry, M.R. Mode of action (MOA) assignment classifications for ecotoxicology: An evaluation of approaches. Environ. Sci. Technol. 2017, 51, 10203–10211. [Google Scholar] [CrossRef] [Green Version]
- Kienzler, A.; Connors, K.A.; Bonnell, M.; Barron, M.G.; Beasley, A.; Inglis, C.G.; Norberg-King, T.J.; Martin, T.; Sanderson, H.; Vallotton, N.; et al. Mode of Action Classifications in the EnviroTox Database: Development and Implementation of a Consensus MOA Classification. Environ. Toxicol. Chem. 2019, 38, 2294–2304. [Google Scholar] [CrossRef] [Green Version]
- Finizio, A.; Di Nica, V.; Rizzi, C.; Villa, S. A quantitative structure-activity relationships approach to predict the toxicity of narcotic compounds to aquatic communities. Ecotox. Environ. Saf. 2020, 190, 110068. [Google Scholar] [CrossRef] [PubMed]
- Gutsell, S.; Hodges, G.; Marshall, S.; Roberts, J. Ecotoxicological thresholds—Practical applications in an industrial inventory. Environ. Toxicol. Chem. 2015, 34, 935–942. [Google Scholar] [CrossRef]
- Belanger, S.E.; Sanderson, H.; Embry, M.R.; Coady, K.; De Zwart, D.; Farr, B.A.; Gutsell, S.; Halder, M.; Sternberg, R.; Wilson, P. It is time to develop ecological thresholds of toxicological concern to assist environmental hazard assessment. Environ. Toxicol. Chem. 2015, 34, 2864–2869. [Google Scholar] [CrossRef]
- Barron, M.G.; Otter, R.R.; Connors, K.A.; Kienzler, A.; Embry, M.R. Ecological thresholds of toxicological concern: A review. Front. Toxicol. 2021, 3, 1–7. [Google Scholar] [CrossRef]
- EC (European Commission). Technical Guidance for Deriving Environmental Quality Standards; Guidance Document No. 27. Updated Version; EU Publications: Brussels, Belgium, 2018; p. 197. [Google Scholar]
- Casida, J.E. Pest toxicology: The primary mechanisms of pesticide action. Chem. Res. Toxicol. 2009, 22, 609–619. [Google Scholar] [CrossRef] [PubMed]
- Ferrario, C.; Parolini, M.; De Felice, B.; Villa, S.; Finizio, A. Linking sub-individual and supra-individual effects in Daphnia magna exposed to sub-lethal concentration of chlorpyrifos. Environ. Pollut. 2018, 235, 411–418. [Google Scholar] [CrossRef] [PubMed]
- Villa, S.; Di Nica, V.; Pescatore, T.; Bellamoli, F.; Miari, F.; Finizio, A.; Lencioni, V. Comparison of the behavioural effects of pharmaceuticals and pesticides on Diamesa zernyi larvae (Chironomidae). Environ. Pollut. 2018, 238, 130–139. [Google Scholar] [CrossRef] [PubMed]
- Soderlund, D.M. Toxicology and Mode of Action of Pyrethroid Insecticides. In Hayes’ Handbook of Pesticide Toxicology, 3rd ed.; Krieger, R., Ed.; Academic Press: Cambridge, MA, USA, 2010; pp. 1665–1686. [Google Scholar]
- Jones, O.T.; Lee, A.G. Interactions of hexachlorocyclohexanes with lipid bilayers. Biochim. Biophys. Acta 1985, 812, 731–739. [Google Scholar] [CrossRef]
- Antunes-Madeira, M.C.; Madeira, V.M.C. Membrane fluidity as affected by organochlorine insecticide DDT. Biochim. Biophys. Acta 1990, 861, 159–165. [Google Scholar] [CrossRef]
- Gabbianelli, R.; Falcioni, G.; Nasuti, C.; Cantalamessa, F. Cypermethrin induced plasma membrane perturbation on erythrocytes from rats: Reduction of fluidity in the hydrophobic core and in glutathione peroxidase activity. Toxicology 2002, 175, 91–101. [Google Scholar] [CrossRef]
- Nasuti, C.; Cantalamessa, F.; Falcioni, G.; Gabbianelli, R. Different effects of type I and type II pyrethroids on erythrocyte plasma membrane properties and enzymatic activity in rats. Toxicology 2003, 191, 233–244. [Google Scholar] [CrossRef]
- Fukuto, T.R. Mechanism of action of organophosphorus and carbamate insecticides. Environ. Health Perspect. 1990, 87, 245–254. [Google Scholar] [CrossRef] [PubMed]
- Taillebois, E.; Cartereau, A.; Jones, A.K.; Thany, S.H. Neonicotinoid insecticides mode of action on insect nicotinic acetylcholine receptors using binding studies. Pestic. Biochem. Phys. 2018, 151, 59–66. [Google Scholar] [CrossRef] [Green Version]
- Tomizawa, M.; Casida, J.E. Eonicotinoid insecticide toxicology: Mechanisms of selective action. Annu. Rev. Pharmacol. 2005, 45, 247–268. [Google Scholar] [CrossRef] [PubMed] [Green Version]
- Brown, H.M. Mode of action, crop selectivity, and soil relations of the sulfonylurea herbicides. Pestic. Sci. 1990, 29, 263–281. [Google Scholar] [CrossRef]
- Balba, H. Review of strobilurin fungicide chemicals. J. Environ. Sci. Health B 2007, 42, 441–451. [Google Scholar] [CrossRef] [PubMed]
- Thind, T.S.; Hollomon, D.W. Thiocarbamate fungicides: Reliable tools in resistance management and future outlook. Pestic. Manag. Sci. 2018, 74, 1547–1551. [Google Scholar] [CrossRef]
- Daum, G.; Lees, N.D.; Bard, M.; Dickson, R. Biochemistry, cell biology and molecular biology of lipids of Saccharomyces cerevisiae. Yeast 1998, 14, 1471–1510. [Google Scholar] [CrossRef]
- Kroes, R.; Galli, C.; Schilter, B.; Tran, L.A.; Walzer, R.; Wuertzen, G. Threshold of toxicological concern for chemical substances present in the diet: A practical tool for assessing the need for toxicity testing. Food Chem. Toxicol. 2000, 38, 255–312. [Google Scholar] [CrossRef]
- Connors, K.A.; Beasley, A.; Barron, M.G.; Belanger, S.E.; Bonnell, M.; Brill, J.L.; de Zwart, D.; Kienzler, A.; Krailler, J.; Otter, R.; et al. Creation of a curated aquatic toxicology database: Envirotox. Environ. Toxicol. Chem. 2019, 38, 1062–1073. [Google Scholar] [CrossRef] [Green Version]
- De Wolf, W.; Siebel-Sauer, A.; Lecloux, A.; Koch, V.; Holt, M.; Feijtel, T.; Comber, M.; Boeije, G. Mode of action and aquatic exposure thresholds of no concern. Environ. Toxicol. Chem. 2005, 24, 479–485. [Google Scholar] [CrossRef]
- Tolls, J.; Müller, M.; Willing, A.; Steber, J. A new concept for the environmental risk assessment of poorly water soluble compounds and its application to consumer products. Integr. Environ. Assess. 2009, 5, 374–378. [Google Scholar] [CrossRef]
- Williams, E.S.; Berninger, J.P.; Brooks, B.W. Application of chemical toxicity distributions to ecotoxicology data requirements under REACH. Environ. Toxicol. Chem. 2009, 30, 1943–1954. [Google Scholar] [CrossRef]
- He, J.; He, H.; Yan, Z.; Gao, F.; Zheng, X.; Fan, J.; Wang, Y. Comparative analysis of freshwater species sensitivity distributions and ecotoxicity for priority pesticides: Implications for water quality criteria. Ecotox. Environ. Saf. 2019, 176, 119–124. [Google Scholar] [CrossRef] [PubMed]
- Rämö, R.A.; van den Brink, P.J.; Ruepert, C.; Castillo, L.E.; Gunnarsson, J.S. Environmental risk assessment of pesticides in the River Madre de Dios, Costa Rica using PERPEST, SSD, and msPAF models. Environ. Sci. Pollut. Res. 2018, 25, 13254–13269. [Google Scholar] [CrossRef] [PubMed] [Green Version]
- Caquet, T.; Roucaute, M.; Mazzella, N.; Delmas, F.; Madigou, C.; Farcy, E.; Burgeot, T.; Allenou, J.P.; Gabellec, R. Risk assessment of herbicides and booster biocides along estuarine continuums in the Bay of Vilaine area (Brittany, France). Environ. Sci. Pollut. Res. 2013, 20, 651–666. [Google Scholar] [CrossRef] [PubMed]
- Carvalho, R.N.; Marinov, D.; Loos, R.; Napierska, D.; Chirico, N.; Lettieri, T. Monitoring-Based Exercise: Second Review of the Priority Substances List under the Water Framework Directive; Joint Research Centre: Ispra, Italy, 2016. [Google Scholar]

| Class | Mechanism of Action | Log TR |
|---|---|---|
| I | Non-polar narcotics | −0.5 < log TR < 0.5 |
| II | Polar narcotics | 0.5 < log TR < 1.5 |
| III | Reactive chemicals | 1.5 < log TR < 2.5 |
| IV | Specifically acting chemicals | 2.5 < log TR < 4 |
| V | Highly specifically acting chemicals | log TR > 4 |
| Categories | Chemical Class | Nr of Comp. | HC5min (µmol L−1) | HC5max (µmol L−1) | HC5median (µmol L−1) | HC5 95th perc (µmol L−1) |
|---|---|---|---|---|---|---|
| insecticides | - | 48 | 4.6 × 10⁻⁶ (cyfluthrin) | 6.2 × 10⁻¹ (tebufenozide) | 1.4 × 10⁻³ | 6.9 × 10⁻⁶ |
| CARBins | 4 | 8.4 × 10⁻⁴ (carbosulphan) | 1.4 × 10⁻² (fenobucarb) | 7.2 × 10⁻³ | 8.7 × 10⁻⁴ | |
| NEO | 5 | 2.0 × 10⁻³ (imidacloprid) | 2.4 × 10⁻² (thiamethoxam) | 6.3 × 10⁻³ | 2.0 × 10⁻³ | |
| CYC | 10 | 1.8 × 10⁻⁴ (endrin) | 3.7 × 10⁻² (chlordecone) | 5.0 × 10⁻³ | 3.5 × 10⁻⁴ | |
| OPs | 9 | 9.7 × 10⁻⁵ (chlorpyrifos) | 1.5 × 10⁻³ (fenthion) | 1.1 × 10⁻³ | 1.6 × 10⁻⁴ | |
| PYR | 9 | 4.6 × 10⁻⁶ (cyfluthrin) | 2.4 × 10⁻⁴ (permethrin) | 1.8 × 10⁻⁵ | 5.3 × 10⁻⁶ | |
| miscellaneus | 11 | - | - | - | - | |
| herbicides | - | 41 | 1.9 × 10⁻⁴ (pentoxazone) | 1.0 × 10² (pyriminobac-CH3) | 3.3 × 10⁻² | 6.6 × 10⁻⁴ |
| TR | 7 | 5.4 × 10⁻³ (prometryn) | 2.6 × 10⁻¹ (simazine) | 3.5 × 10⁻² | 7.9 × 10⁻³ | |
| SUL | 4 | 6.6 × 10⁻⁴ (cyclosulphamuron) | 3.3 × 10⁻² (propyrisulphuron) | 5.9 × 10⁻³ | 6.9 × 10⁻⁴ | |
| UR | 5 | 8.1 × 10⁻³ (diuron) | 3.7 (daimuron) | 6.7 × 10⁻² | 9.8 × 10⁻³ | |
| miscellaneous | 25 | - | - | - | - | |
| fungicides | - | 40 | 4.2 × 10⁻³ (thiram) | 2.9 × 10² (hydroxyisoxazole) | 1.6 × 10⁻¹ | 1.7 × 10⁻² |
| AZ | 8 | 4.2 × 10⁻² (epoxiconazole) | 2.9 × 10² (hydroxyisoxazole) | 7.7 × 10⁻¹ | 2.3 × 10⁻¹ | |
| CARBfung | 7 | 4.2 × 10⁻³ (thiram) | 1.8 × 10⁻¹ (maneb) | 1.1 × 10⁻¹ | 5.9 × 10⁻³ | |
| STRO | 5 | 2.0 × 10⁻² (trifloxystrobin) | 1.0 × 10⁻¹ (azoxystrobin) | 7.1 × 10⁻² | 2.3 × 10⁻² | |
| miscellaneous | 20 | - | - | - | - |
| Mechanism of Action | Chemical | HC5 (µg L−1) | Reference | HC5 (µmol L−1) | eco-TTC Calculated | eco-TTC (Mechanisms of Action Class) |
|---|---|---|---|---|---|---|
| AChE inhibitors | Insecticides | |||||
| chlorfenvinphos | 1.1 × 10⁻¹ | [49] | 3.1 × 10⁻⁴ | 6.2 × 10⁻⁵ | 3.4 × 10⁻⁵ | |
| dipterex | 2.2 × 10⁻¹ | [49] | 7.6 × 10⁻⁴ | 1.5 × 10⁻⁴ | ||
| ethoprophos (nematocide) | 3.1 | [50] | 1.3 × 10⁻² | 2.6 × 10⁻³ | ||
| fenamiphos | 8.2 × 10⁻¹ | [50] | 2.7 × 10⁻³ | 5.4 × 10⁻⁴ | ||
| terbufos | 1.0 × 10⁻¹ | [50] | 3.5 × 10⁻⁴ | 6.9 × 10⁻⁵ | ||
| Herbicides | ||||||
| Inhibition of very long-chain fatty acid synthesis | acetochlor | 1.1 × 101 | [50] | 4.1 × 10⁻² | 2.0 × 10⁻³ | 2.2 × 10⁻³ |
| alachlor | 2.7 | [51] | 1.0 × 10⁻² | 3.0 × 10⁻² | ||
| Inhibition of very long-chain fatty acid synthesis | chlorotoluron | 3.2 × 101 | [52] | 1.5 × 10⁻¹ | 8.2 × 10⁻³ | |
| ametryn | 2.3 × 10⁻¹ | [50] | 1.0 × 10⁻³ | 2.0 × 10⁻⁴ | ||
| Fungicides | ||||||
| Steroid demethylation inhibitors | difeconazole | 1.0 × 10 2 | [50] | 2.5 × 10⁻¹ | 5.0 × 10⁻² | 4.6 × 10⁻² |
Publisher’s Note: MDPI stays neutral with regard to jurisdictional claims in published maps and institutional affiliations. |
© 2021 by the authors. Licensee MDPI, Basel, Switzerland. This article is an open access article distributed under the terms and conditions of the Creative Commons Attribution (CC BY) license (https://creativecommons.org/licenses/by/4.0/).
Share and Cite
Rizzi, C.; Villa, S.; Cuzzeri, A.S.; Finizio, A. Use of the Species Sensitivity Distribution Approach to Derive Ecological Threshold of Toxicological Concern (eco-TTC) for Pesticides. Int. J. Environ. Res. Public Health 2021, 18, 12078. https://doi.org/10.3390/ijerph182212078
Rizzi C, Villa S, Cuzzeri AS, Finizio A. Use of the Species Sensitivity Distribution Approach to Derive Ecological Threshold of Toxicological Concern (eco-TTC) for Pesticides. International Journal of Environmental Research and Public Health. 2021; 18(22):12078. https://doi.org/10.3390/ijerph182212078
Chicago/Turabian StyleRizzi, Cristiana, Sara Villa, Alessandro Sergio Cuzzeri, and Antonio Finizio. 2021. "Use of the Species Sensitivity Distribution Approach to Derive Ecological Threshold of Toxicological Concern (eco-TTC) for Pesticides" International Journal of Environmental Research and Public Health 18, no. 22: 12078. https://doi.org/10.3390/ijerph182212078
APA StyleRizzi, C., Villa, S., Cuzzeri, A. S., & Finizio, A. (2021). Use of the Species Sensitivity Distribution Approach to Derive Ecological Threshold of Toxicological Concern (eco-TTC) for Pesticides. International Journal of Environmental Research and Public Health, 18(22), 12078. https://doi.org/10.3390/ijerph182212078