
The Feasibility of Information-Entropy-Based Behavioral Analysis for Detecting Environmental Barriers


Abstract
:1. Introduction
2. Materials and Methods
2.1. Hypothesis
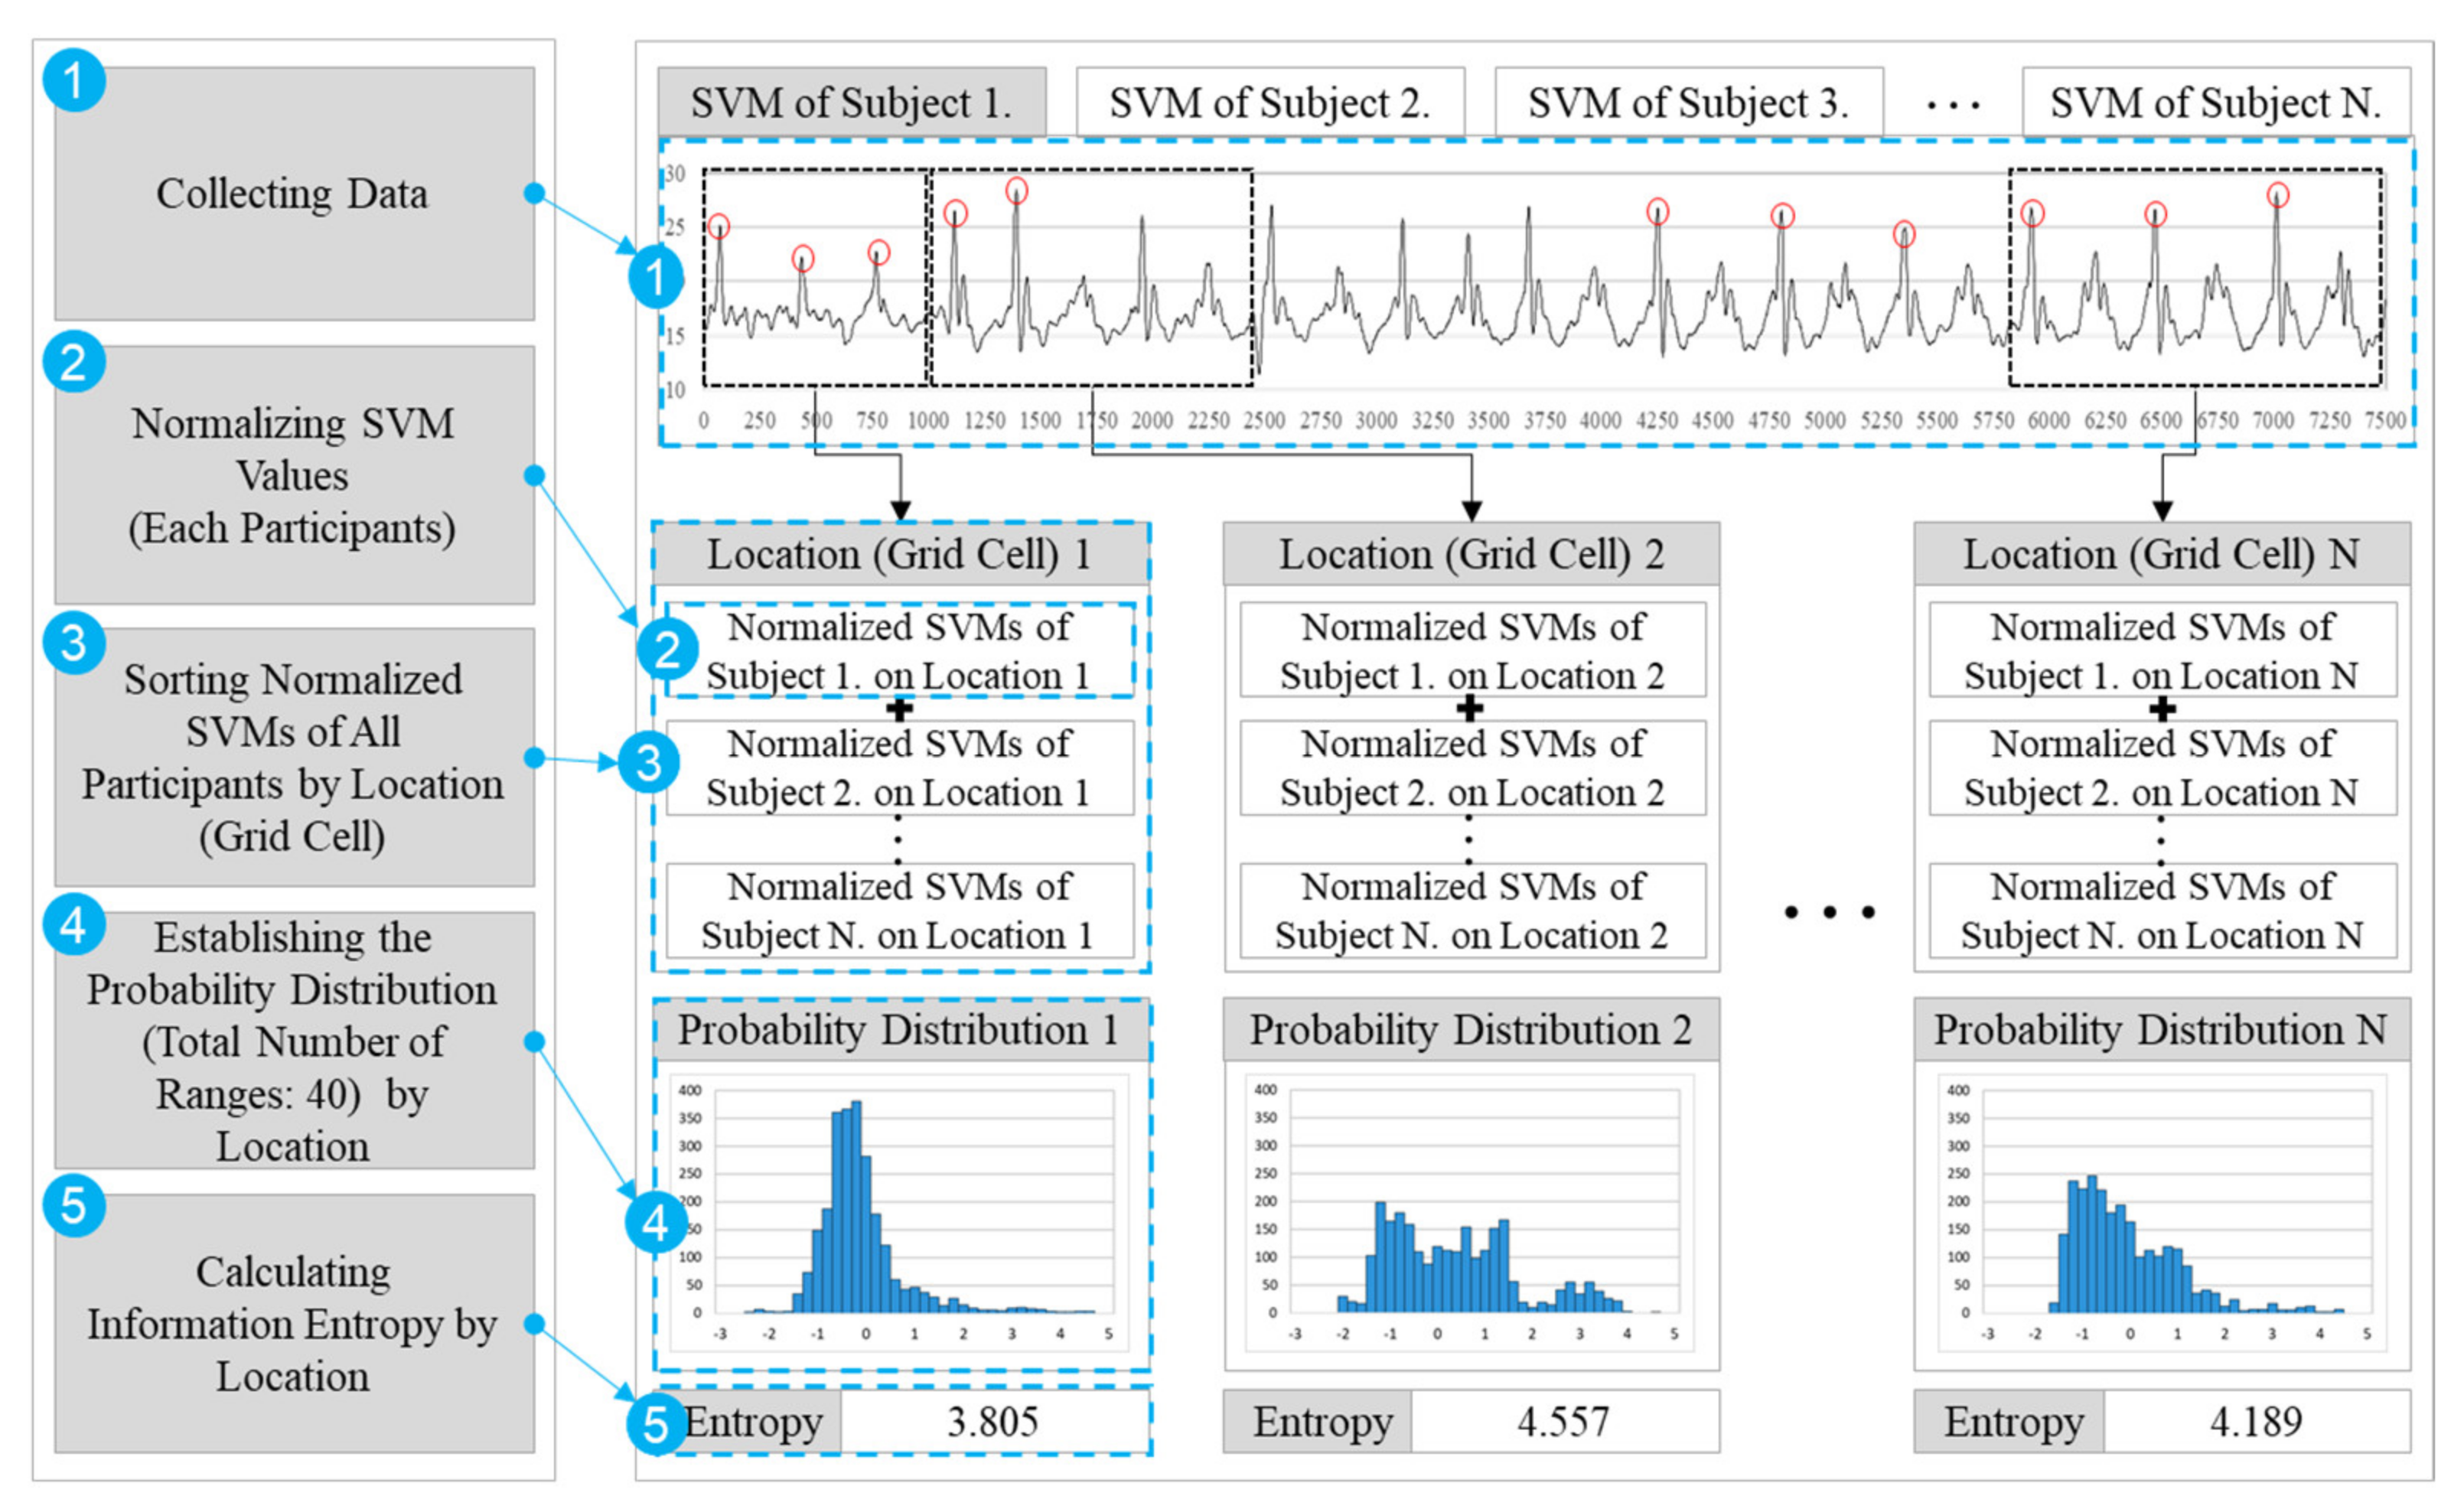
2.2. Development of Entropy-Based Abnormality Assessment Method
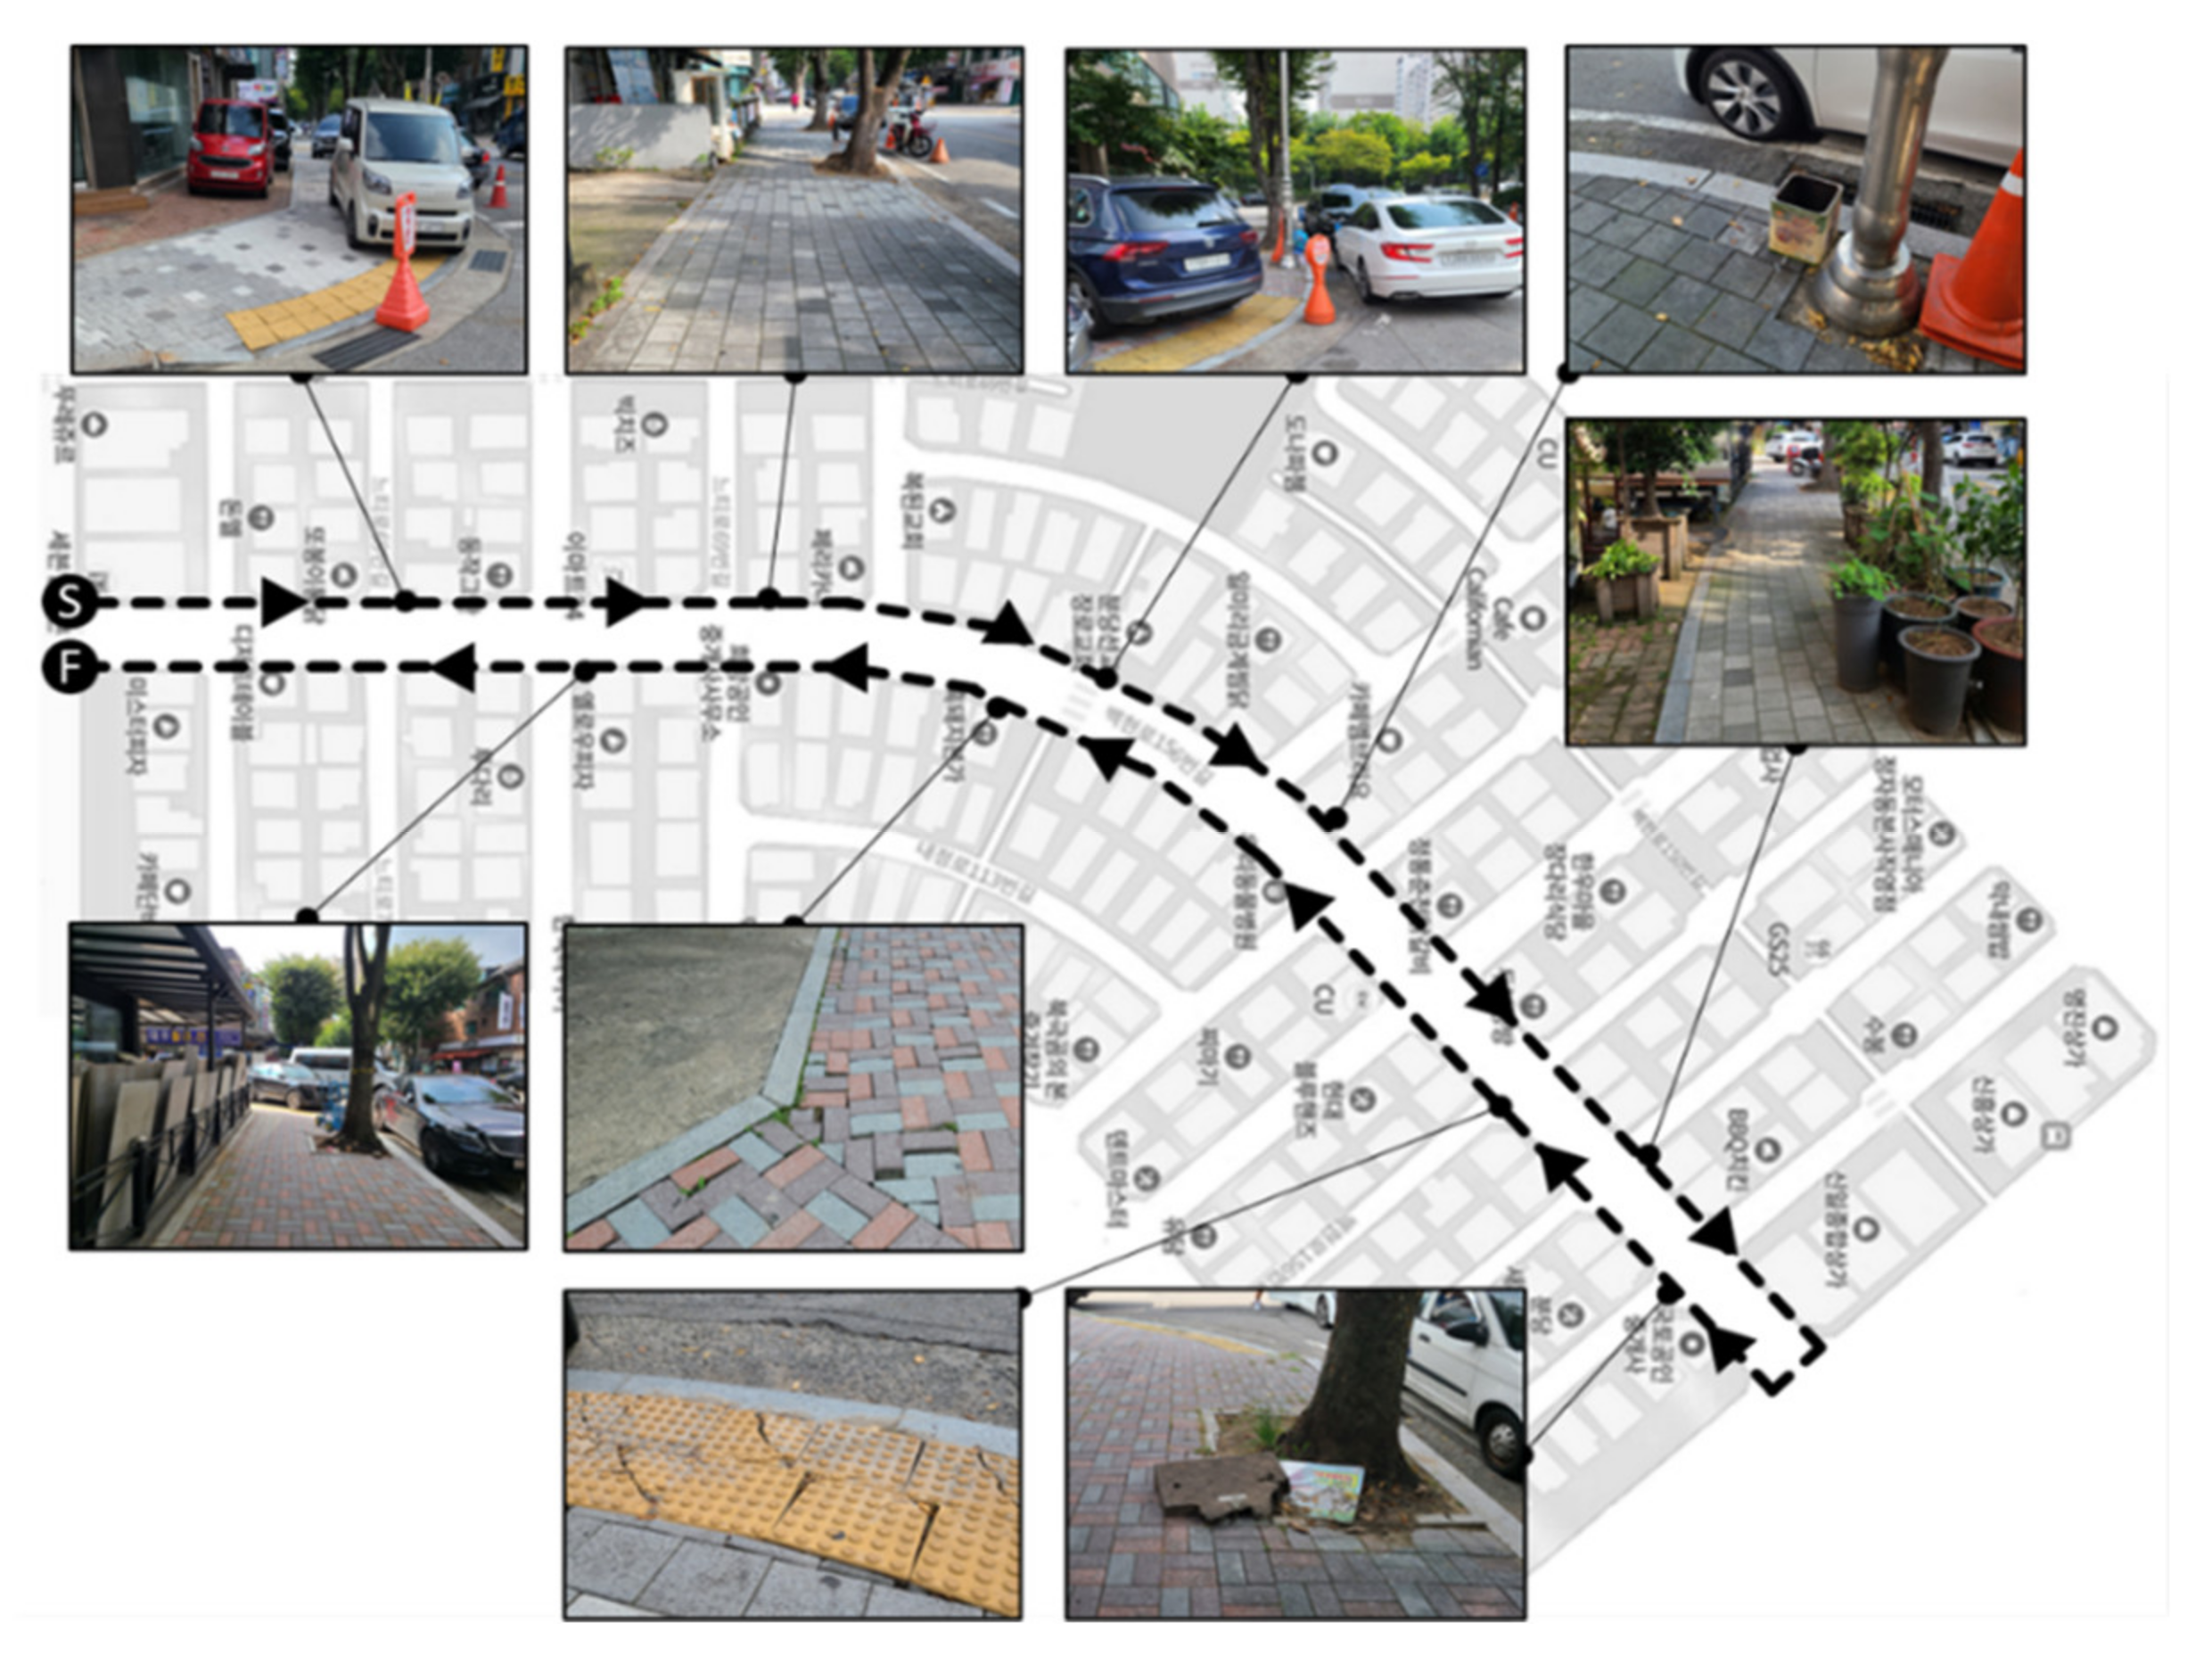
2.3. Experiment Design
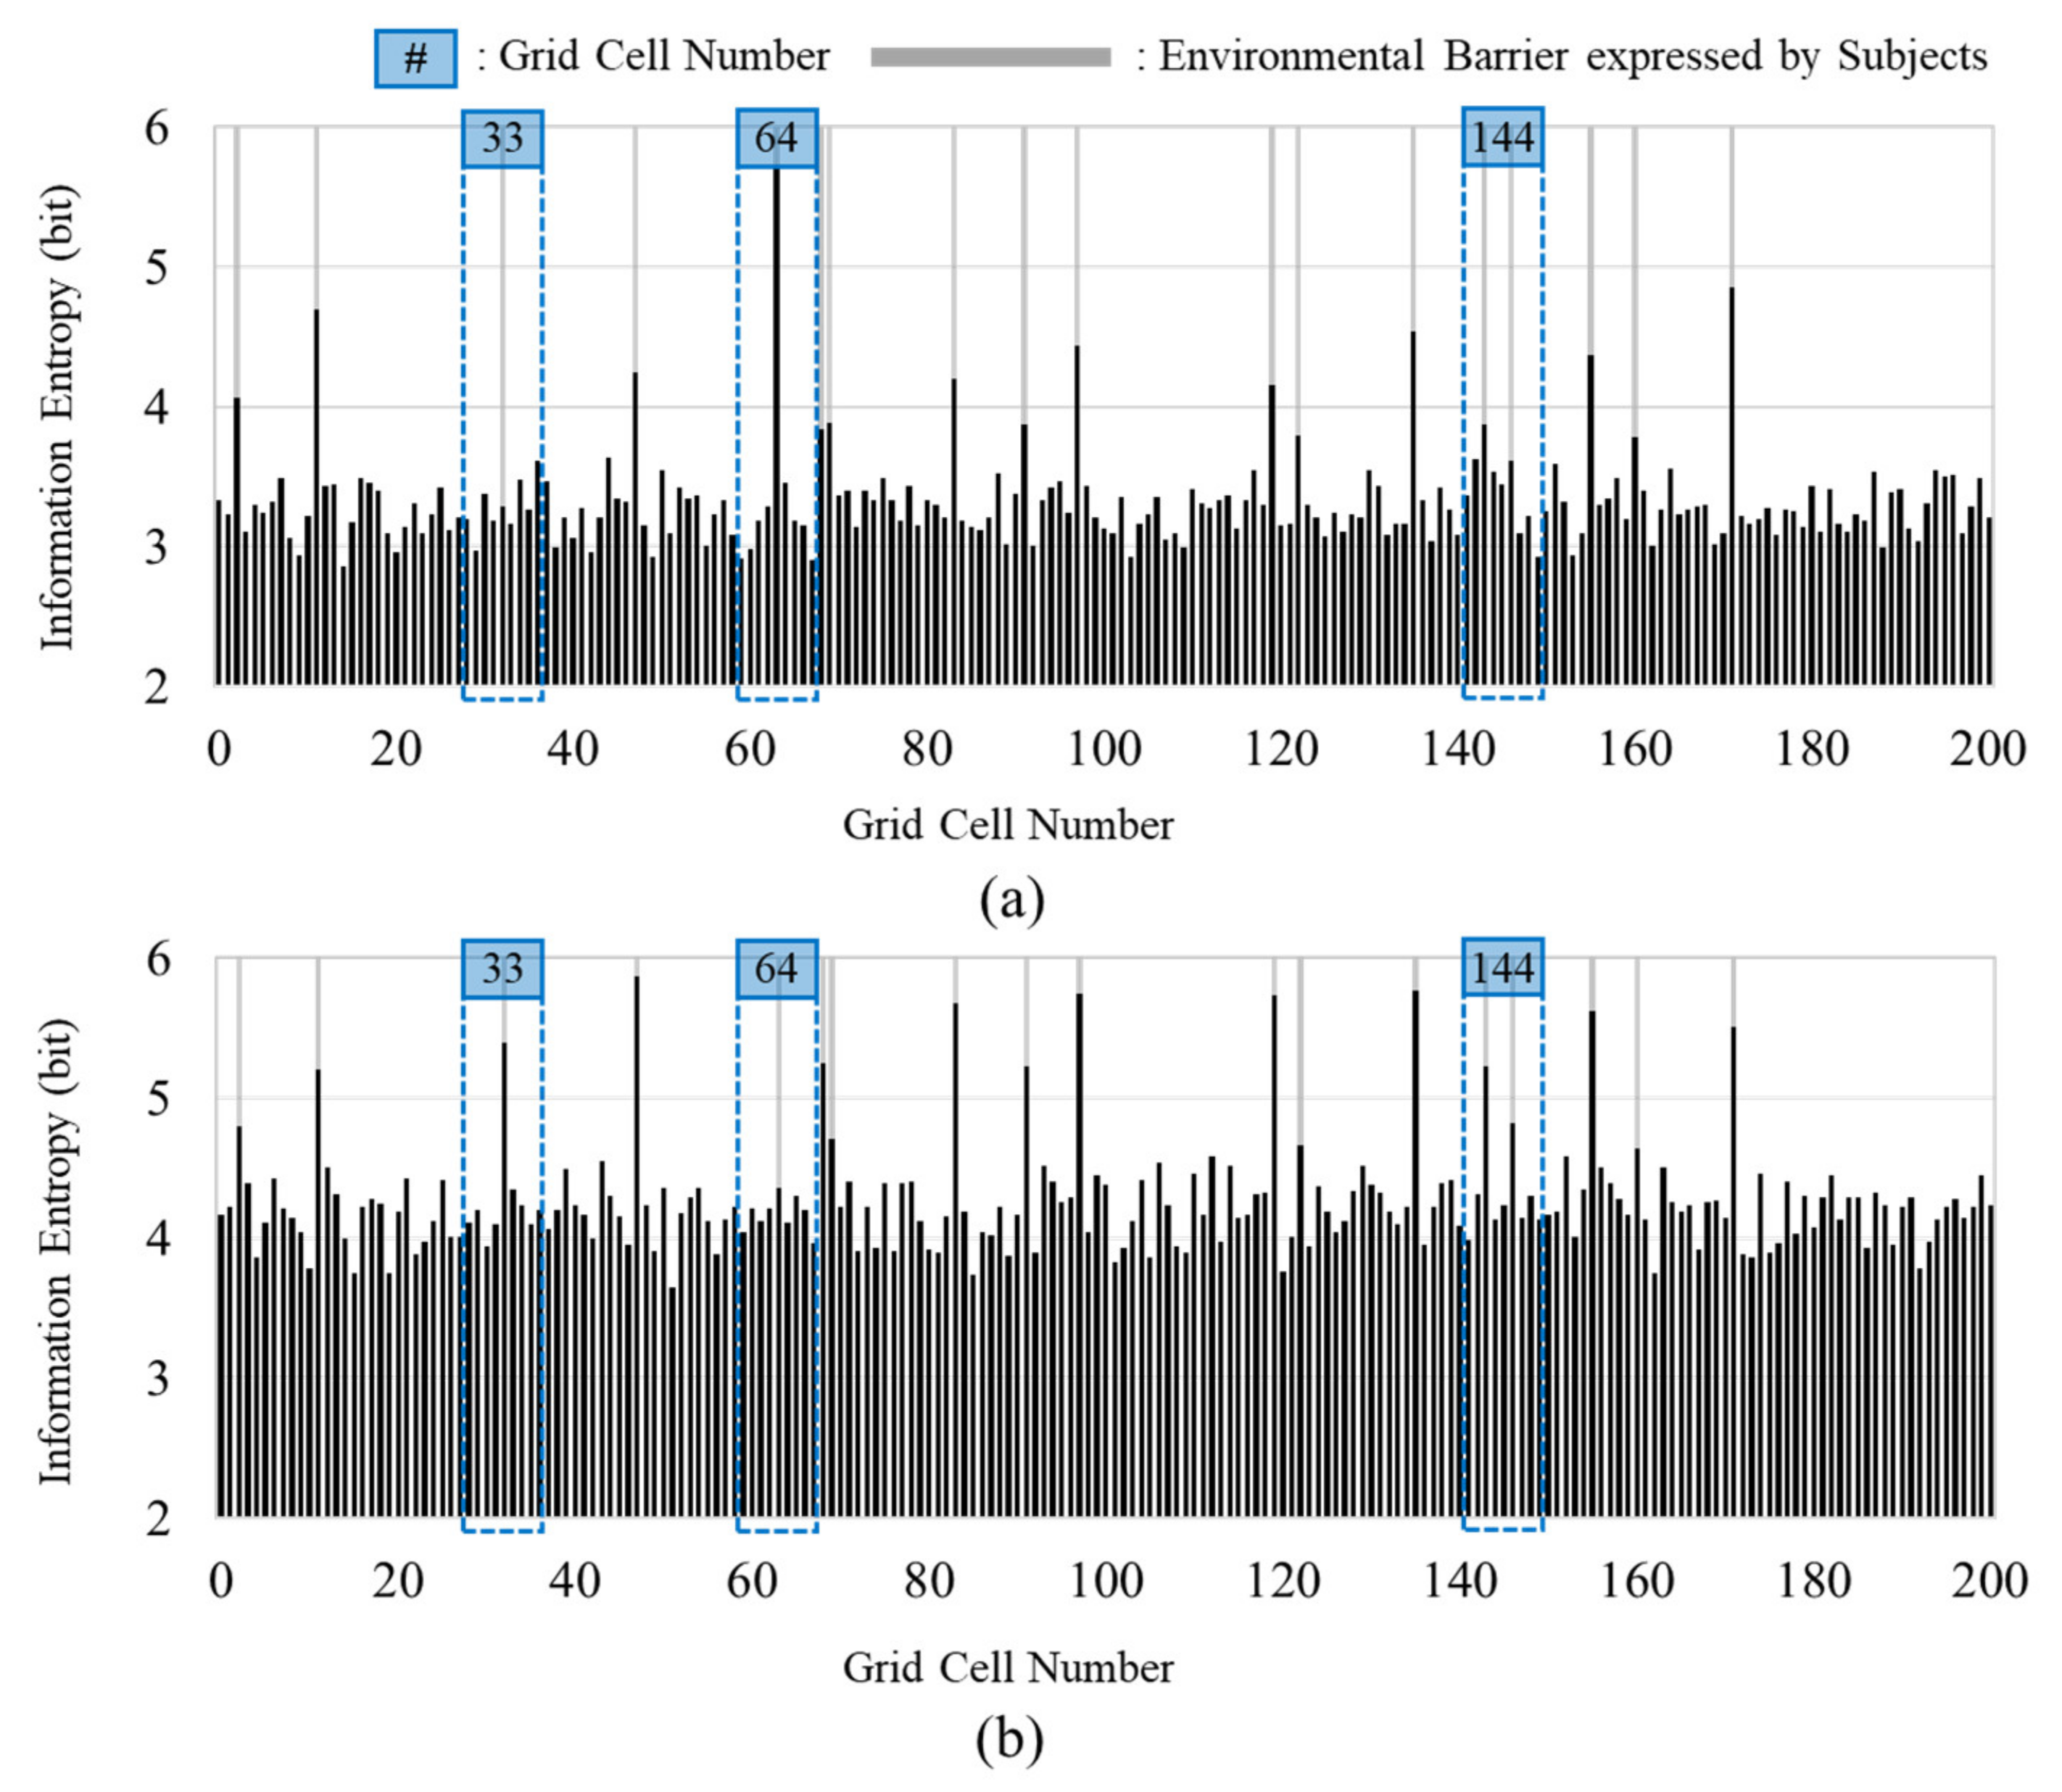
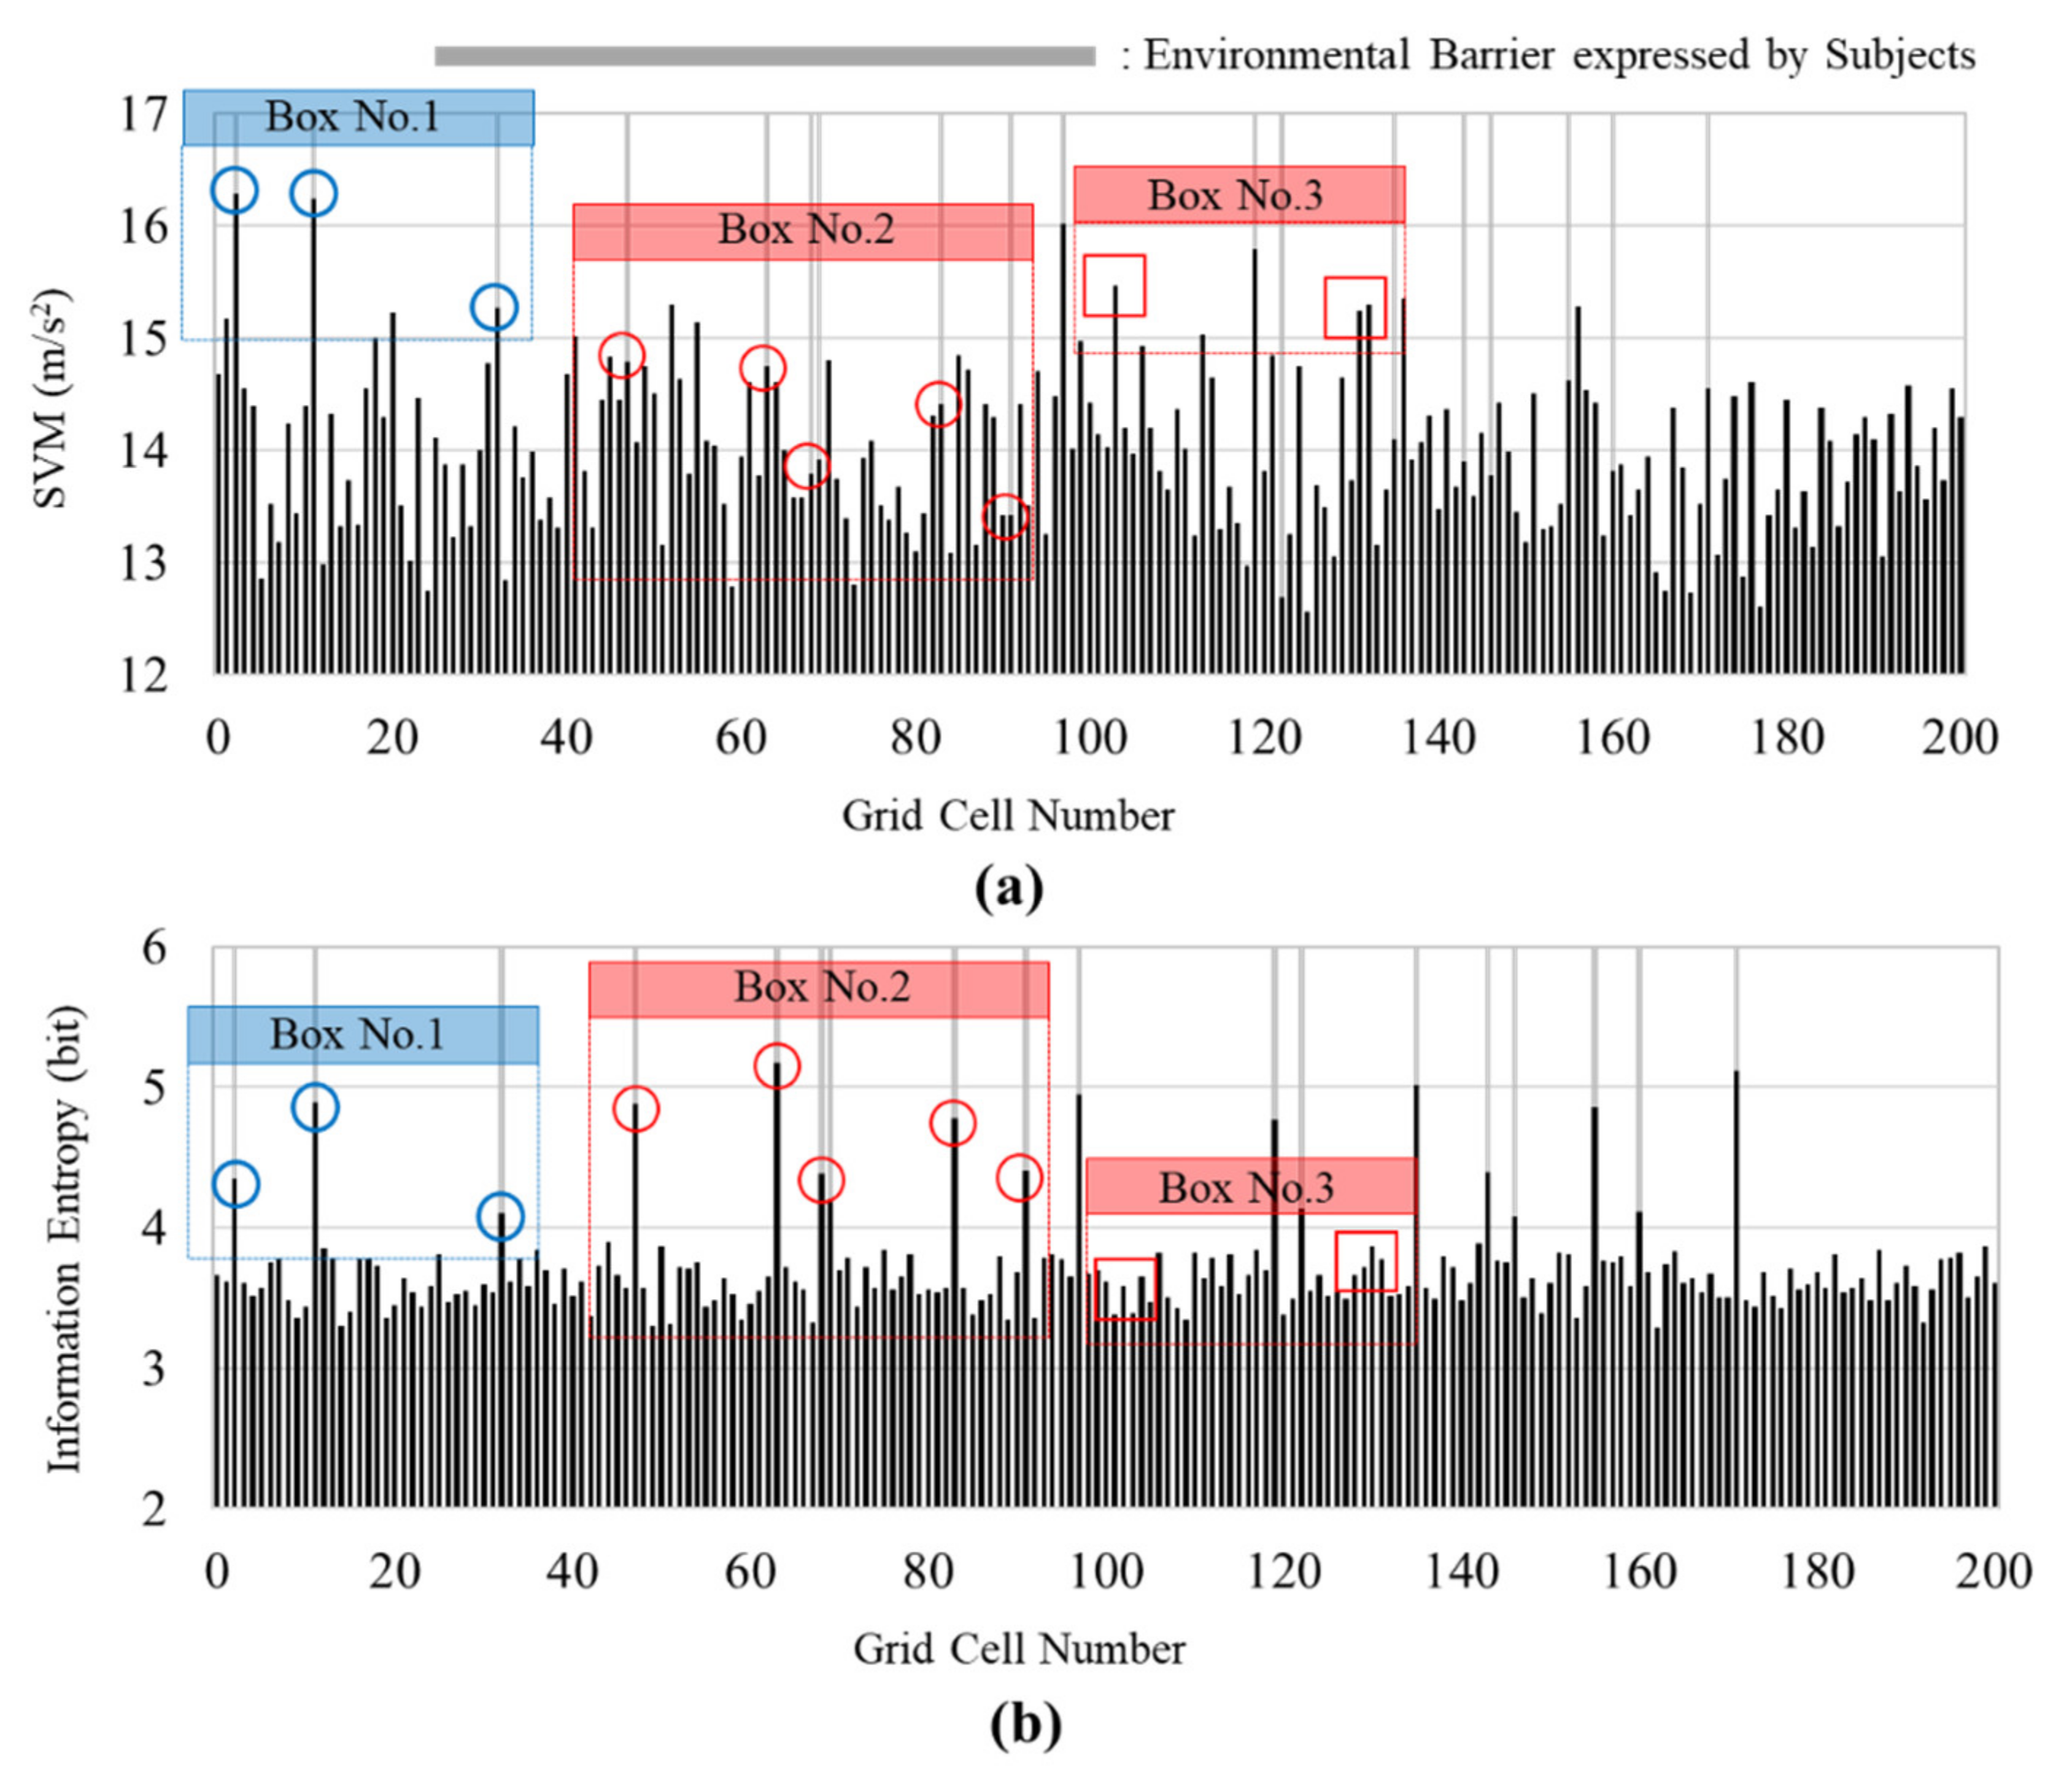
3. Results
4. Discussion
4.1. Effectiveness of Data Collection from Diverse Groups
4.2. The Possibility of Wearable-Based Sensing Approaches for Detecting Environmental Barriers
4.3. Contibutions of the Proposed Method
4.4. Limitations and Future Research
5. Conclusions
Author Contributions
Funding
Institutional Review Board Statement
Informed Consent Statement
Data Availability Statement
Acknowledgments
Conflicts of Interest
References
- Rütten, A.; Abel, T.; Kannas, L.; Von Lengerke, T.; Lüschen, G.; Diaz, J.R.; Vinck, J.; Van der Zee, J. Self Reported Physical Activity, Public Health, and Perceived Environment: Results from a Comparative European Study. J. Epidemiol. Community Health 2001, 55, 139–146. [Google Scholar] [CrossRef] [Green Version]
- Haskell, W.L.; Blair, S.N.; Hill, J.O. Physical Activity: Health Outcomes and Importance for Public Health Policy. Prev. Med. 2009, 49, 280–282. [Google Scholar] [CrossRef]
- Adkins, A.; Dill, J.; Luhr, G.; Neal, M. Unpacking Walkability: Testing the Influence of Urban Design Features on Perceptions of Walking Environment Attractiveness. J. Urban Des. 2012, 17, 499–510. [Google Scholar] [CrossRef]
- Arellana, J.; Saltarín, M.; Larrañaga, A.M.; Alvarez, V.; Henao, C.A. Urban Walkability Considering Pedestrians’ Perceptions of the Built Environment: A 10-Year Review and a Case Study in a Medium-Sized City in Latin America. Transp. Rev. 2020, 40, 183–203. [Google Scholar] [CrossRef]
- Frank, L.D.; Sallis, J.F.; Saelens, B.E.; Leary, L.; Cain, K.; Conway, T.L.; Hess, P.M. The Development of a Walkability Index: Application to the Neighborhood Quality of Life Study. Br. J. Sports Med. 2010, 44, 924–933. [Google Scholar] [CrossRef] [PubMed]
- Buck, C.; Tkaczick, T.; Pitsiladis, Y.; De Bourdehaudhuij, I.; Reisch, L.; Ahrens, W.; Pigeot, I. Objective Measures of the Built Environment and Physical Activity in Children: From Walkability to Moveability. J. Urban Health 2015, 92, 24–38. [Google Scholar] [CrossRef] [Green Version]
- Gray, J.A.; Zimmerman, J.L.; Rimmer, J.H. Built Environment Instruments for Walkability, Bikeability, and Recreation: Disability and Universal Design Relevant? Disabil. Health J. 2012, 5, 87–101. [Google Scholar] [CrossRef] [PubMed]
- Kim, H.; Ahn, C.R.; Yang, K. A People-Centric Sensing Approach to Detecting Sidewalk Defects. Adv. Eng. Inform. 2016, 30, 660–671. [Google Scholar] [CrossRef] [Green Version]
- Saelens, B.E.; Handy, S.L. Built Environment Correlates of Walking: A Review. Med. Sci. Sports Exerc. 2008, 40, S550. [Google Scholar] [CrossRef] [Green Version]
- Lovasi, G.S.; Moudon, A.V.; Pearson, A.L.; Hurvitz, P.M.; Larson, E.B.; Siscovick, D.S.; Berke, E.M.; Lumley, T.; Psaty, B.M. Using Built Environment Characteristics to Predict Walking for Exercise. Int. J. Health Geogr. 2008, 7, 1–13. [Google Scholar] [CrossRef] [PubMed]
- Forsyth, A.; Oakes, J.M.; Lee, B.; Schmitz, K.H. The Built Environment, Walking, and Physical Activity: Is the Environment More Important to Some People than Others? Transp. Res. Part D Transp. Environ. 2009, 14, 42–49. [Google Scholar] [CrossRef]
- Frank, L.D.; Kerr, J.; Sallis, J.F.; Miles, R.; Chapman, J. A Hierarchy of Sociodemographic and Environmental Correlates of Walking and Obesity. Prev. Med. 2008, 47, 172–178. [Google Scholar] [CrossRef]
- Browning, R.C.; Baker, E.A.; Herron, J.A.; Kram, R. Effects of Obesity and Sex on the Energetic Cost and Preferred Speed of Walking. J. Appl. Physiol. 2006, 100, 390–398. [Google Scholar] [CrossRef] [Green Version]
- Levine, J.A.; McCrady, S.K.; Lanningham-Foster, L.M.; Kane, P.H.; Foster, R.C.; Manohar, C.U. The Role of Free-Living Daily Walking in Human Weight Gain and Obesity. Diabetes 2008, 57, 548–554. [Google Scholar] [CrossRef] [PubMed] [Green Version]
- Murtagh, E.M.; Murphy, M.H.; Boone-Heinonen, J. Walking–the First Steps in Cardiovascular Disease Prevention. Curr. Opin. Cardiol. 2010, 25, 490. [Google Scholar] [CrossRef] [Green Version]
- Johnson, S.T.; Bell, G.J.; McCargar, L.J.; Welsh, R.S.; Bell, R.C. Improved Cardiovascular Health Following a Progressive Walking and Dietary Intervention for Type 2 Diabetes. Diabetes Obes. Metab. 2009, 11, 836–843. [Google Scholar] [CrossRef] [PubMed]
- Smith, T.C.; Wingard, D.L.; Smith, B.; Kritz-Silverstein, D.; Barrett-Connor, E. Walking Decreased Risk of Cardiovascular Disease Mortality in Older Adults with Diabetes. J. Clin. Epidemiol. 2007, 60, 309–317. [Google Scholar] [CrossRef] [PubMed] [Green Version]
- Hu, F.B.; Sigal, R.J.; Rich-Edwards, J.W.; Colditz, G.A.; Solomon, C.G.; Willett, W.C.; Speizer, F.E.; Manson, J.E. Walking Compared with Vigorous Physical Activity and Risk of Type 2 Diabetes in Women: A Prospective Study. JAMA 1999, 282, 1433–1439. [Google Scholar] [CrossRef] [PubMed] [Green Version]
- Fisher, K.J.; Li, F. A Community-Based Walking Trial to Improve Neighborhood Quality of Life in Older Adults: A Multilevel Analysis. Ann. Behav. Med. 2004, 28, 186–194. [Google Scholar] [CrossRef] [PubMed]
- Blacklock, R.E.; Rhodes, R.E.; Brown, S.G. Relationship between Regular Walking, Physical Activity, and Health-Related Quality of Life. J. Phys. Act. Health 2007, 4, 138–152. [Google Scholar] [CrossRef]
- Ewing, R.; Handy, S. Measuring the Unmeasurable: Urban Design Qualities Related to Walkability. J. Urban Des. 2009, 14, 65–84. [Google Scholar] [CrossRef]
- Iwarsson, S.; Nygren, C.; Oswald, F.; Wahl, H.-W.; Tomsone, S. Environmental Barriers and Housing Accessibility Problems over a One-Year Period in Later Life in Three European Countries. J. Hous. Elder. 2006, 20, 23–43. [Google Scholar] [CrossRef]
- Rantakokko, M.; Törmäkangas, T.; Rantanen, T.; Haak, M.; Iwarsson, S. Environmental Barriers, Person-Environment Fit and Mortality among Community-Dwelling Very Old People. BMC Public Health 2013, 13, 1–8. [Google Scholar] [CrossRef] [Green Version]
- Granbom, M.; Iwarsson, S.; Kylberg, M.; Pettersson, C.; Slaug, B. A Public Health Perspective to Environmental Barriers and Accessibility Problems for Senior Citizens Living in Ordinary Housing. BMC Public Health 2016, 16, 1–11. [Google Scholar] [CrossRef] [Green Version]
- Dawson, J.; Hillsdon, M.; Boller, I.; Foster, C. Perceived Barriers to Walking in the Neighborhood Environment: A Survey of Middle-Aged and Older Adults. J. Aging Phys. Act. 2007, 15, 318–335. [Google Scholar] [CrossRef] [PubMed]
- Rantakokko, M.; Iwarsson, S.; Mänty, M.; Leinonen, R.; Rantanen, T. Perceived Barriers in the Outdoor Environment and Development of Walking Difficulties in Older People. Age Ageing 2012, 41, 118–121. [Google Scholar] [CrossRef] [Green Version]
- Clark, A.F.; Scott, D.M. Barriers to Walking: An Investigation of Adults in Hamilton (Ontario, Canada). Int. J. Environ. Res. Public Health 2016, 13, 179. [Google Scholar] [CrossRef] [Green Version]
- Kim, J.; Ahn, C.R.; Nam, Y. The Influence of Built Environment Features on Crowdsourced Physiological Responses of Pedestrians in Neighborhoods. Comput. Environ. Urban Syst. 2019, 75, 161–169. [Google Scholar] [CrossRef]
- Kim, J.; Yadav, M.; Ahn, C.R.; Chaspari, T. Saliency detection analysis of pedestrians’ physiological responses to assess adverse built environment features. In Computing in Civil Engineering 2019: Smart Cities, Sustainability, and Resilience; American Society of Civil Engineers: Reston, VA, USA, 2019; pp. 90–97. [Google Scholar]
- Kim, J.; Yadav, M.; Chaspari, T.; Ahn, C.R. Saliency Detection Analysis of Collective Physiological Responses of Pedestrians to Evaluate Neighborhood Built Environments. Adv. Eng. Inform. 2020, 43, 101035. [Google Scholar] [CrossRef]
- Lee, G.; Choi, B.; Jebelli, H.; Ahn, C.R.; Lee, S. Wearable Biosensor and Collective Sensing–Based Approach for Detecting Older Adults’ Environmental Barriers. J. Comput. Civ. Eng. 2020, 34, 04020002. [Google Scholar] [CrossRef]
- Lee, G.; Choi, B.; Ahn, C.R.; Lee, S. Wearable Biosensor and Hotspot Analysis–Based Framework to Detect Stress Hotspots for Advancing Elderly’s Mobility. J. Manag. Eng. 2020, 36, 04020010. [Google Scholar] [CrossRef]
- Arya, D.; Maeda, H.; Ghosh, S.K.; Toshniwal, D.; Mraz, A.; Kashiyama, T.; Sekimoto, Y. Deep Learning-Based Road Damage Detection and Classification for Multiple Countries. Autom. Constr. 2021, 132, 103935. [Google Scholar] [CrossRef]
- Ham, Y.; Han, K.K.; Lin, J.J.; Golparvar-Fard, M. Visual Monitoring of Civil Infrastructure Systems via Camera-Equipped Unmanned Aerial Vehicles (UAVs): A Review of Related Works. Vis. Eng. 2016, 4, 1–8. [Google Scholar] [CrossRef] [Green Version]
- Koch, C.; Brilakis, I. Pothole Detection in Asphalt Pavement Images. Adv. Eng. Inform. 2011, 25, 507–515. [Google Scholar] [CrossRef]
- Yoon, J.; Chun, J.; Kim, H. Investigating the Relation between Walkability and the Changes in Pedestrian Policy through Wearable Sensing. Sustainability 2020, 12, 10447. [Google Scholar] [CrossRef]
- Kim, H. Wearable Sensor Data-Driven Walkability Assessment for Elderly People. Sustainability 2020, 12, 4041. [Google Scholar] [CrossRef]
- Bisadi, M.; Kim, H.; Ahn, C.R.; Nam, Y. Effects of physical disorders in neighborhoods on pedestrians’ physiological responses. In Computing in Civil Engineering 2017; American Society of Civil Engineers: Reston, VA, USA, 2017; pp. 183–190. [Google Scholar]
- Bhuvaneswari, A.; Valliyammai, C. Information Entropy Based Event Detection during Disaster in Cyber-Social Networks. J. Intell. Fuzzy Syst. 2019, 36, 3981–3992. [Google Scholar] [CrossRef]
- Wen, Z.; Zhang, H.; Zhang, R. Safety-Critical Event Identification on Mountain Roads for Traffic Safety and Environmental Protection Using Support Vector Machine with Information Entropy. Sustainability 2021, 13, 4426. [Google Scholar] [CrossRef]
- Xu, J.; Tang, Y.; Yang, W.; Li, F.; Shi, L. Event-Triggered Minimax State Estimation with a Relative Entropy Constraint. Automatica 2019, 110, 108592. [Google Scholar] [CrossRef]
- Daneshgadeh, S.; Kemmerich, T.; Ahmed, T.; Baykal, N. An Empirical Investigation of Ddos and Flash Event Detection Using Shannon Entropy, Koad and Svm Combined. In Proceedings of the 2019 International Conference on Computing, Networking and Communications (ICNC), IEEE, Honolulu, HI, USA, 18 February 2019; pp. 658–662. [Google Scholar]
- Zhang, X.; Yu, Q.; Wang, Y. Fuzzy Evaluation of Crowd Safety Based on Pedestrians’ Number and Distribution Entropy. Entropy 2020, 22, 832. [Google Scholar] [CrossRef]
- Li, X.; Telesca, L.; Lovallo, M.; Xu, X.; Zhang, J.; Song, W. Spectral and Informational Analysis of Pedestrian Contact Force in Simulated Overcrowding Conditions. Phys. A: Stat. Mech. Its Appl. 2020, 555, 124614. [Google Scholar] [CrossRef]
- Procházka, J.; Olševičová, K. Monitoring Lane Formation of Pedestrians: Emergence and Entropy. In Proceedings of the 7th Asian Conference on Intelligent Information and Database Systems, Springer, Bali, Indonesia, 23–25 March 2015; pp. 221–228. [Google Scholar]
- Asarian, L.; Gloy, V.; Geary, N. Homeostasis. In Encyclopedia of Human Behavior, 2nd ed.; Ramachandran, V.S., Ed.; Academic Press: San Diego, CA, USA, 2012; pp. 324–333. ISBN 978-0-08-096180-4. [Google Scholar]
- Gray, R.M. Entropy and information. In Entropy and Information Theory; Springer: New York, NY, USA, 1990; pp. 21–55. [Google Scholar]
- Mokkadem, A. Estimation of the Entropy and Information of Absolutely Continuous Random Variables. IEEE Trans. Inf. Theory 1989, 35, 193–196. [Google Scholar] [CrossRef]
- Niandong, L.; Yanqi, S.; Sheng, S.; Xianshen, H.; Haoliang, M. Detection of Probe Flow Anomalies Using Information Entropy and Random Forest Method. J. Intell. Fuzzy Syst. 2020, 39, 433–447. [Google Scholar] [CrossRef]
- Shannon, C.E. A Mathematical Theory of Communication. Bell Syst. Tech. J. 1948, 27, 379–423. [Google Scholar] [CrossRef] [Green Version]
- Kim, H.; Ahn, C.R.; Yang, K. Identifying Safety Hazards Using Collective Bodily Responses of Workers. J. Constr. Eng. Manag. 2017, 143, 04016090. [Google Scholar] [CrossRef]
- Yang, K.; Ahn, C.R.; Vuran, M.C.; Kim, H. Collective Sensing of Workers’ Gait Patterns to Identify Fall Hazards in Construction. Autom. Constr. 2017, 82, 166–178. [Google Scholar] [CrossRef]
- Yang, K.; Ahn, C.R.; Kim, H. Validating Ambulatory Gait Assessment Technique for Hazard Sensing in Construction Environments. Autom. Constr. 2019, 98, 302–309. [Google Scholar] [CrossRef]
- Bobko, P. Correlation and Regression: Applications for Industrial Organizational Psychology and Management; Sage Publications: Thousand Oaks, CA, USA, 2001. [Google Scholar]
- Campbell, A.T.; Eisenman, S.B.; Lane, N.D.; Miluzzo, E.; Peterson, R.A. People-Centric Urban Sensing. In Proceedings of the 2nd Annual International Workshop on Wireless Internet, Boston, MA, USA, 2–5 August 2006; pp. 18–31. [Google Scholar]
- Campbell, A.T.; Eisenman, S.B.; Lane, N.D.; Miluzzo, E.; Peterson, R.A.; Lu, H.; Zheng, X.; Musolesi, M.; Fodor, K.; Ahn, G.-S. The Rise of People-Centric Sensing. IEEE Internet Comput. 2008, 12, 12–21. [Google Scholar] [CrossRef]


| Statistical Parameter | Age | Height (cm) | Weight (kg) |
|---|---|---|---|
| Mean | 42.28 | 170.86 | 70.63 |
| Median | 31 | 171 | 68.94 |
| Standard Deviation | 20.87 | 8.07 | 11.51 |
| Maximum | 70 | 183 | 90.48 |
| Minimum | 20 | 158 | 48.76 |
| Cell # | Description | Figure | Cell # | Description | Figure |
|---|---|---|---|---|---|
| 3 | Broken blocks | 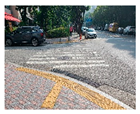 | 98 | Obstacle |  |
| 12 | Parked vehicles with narrow path | 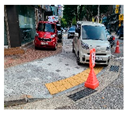 | 120 | Broken blocks | 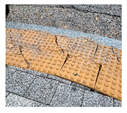 |
| 33 | Parked vehicles with narrow path |  | 123 | Parked vehicles with narrow path | 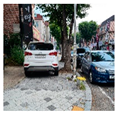 |
| 48 | Parked vehicles (narrow path) |  | 136 | Parked electric scooter |  |
| 64 | Illegal smoking area | 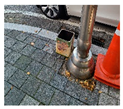 | 144 | Broken and unfixed blocks | 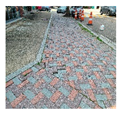 |
| 69 | Unfixed blocks | 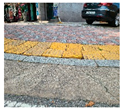 | 147 | Illegally stocked materials | 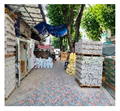 |
| 70 | Illegal smoking area |  | 156 | Parked vehicles with narrow path |  |
| 84 | Stocked materials | 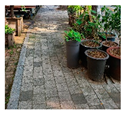 | 161 | Illegally parked bicycle | 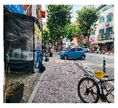 |
| 92 | Trash | 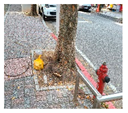 | 172 | Unfixed manhole | 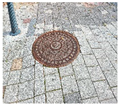 |
Publisher’s Note: MDPI stays neutral with regard to jurisdictional claims in published maps and institutional affiliations. |
© 2021 by the authors. Licensee MDPI, Basel, Switzerland. This article is an open access article distributed under the terms and conditions of the Creative Commons Attribution (CC BY) license (https://creativecommons.org/licenses/by/4.0/).
Share and Cite
Lee, B.; Hwang, S.; Kim, H. The Feasibility of Information-Entropy-Based Behavioral Analysis for Detecting Environmental Barriers. Int. J. Environ. Res. Public Health 2021, 18, 11727. https://doi.org/10.3390/ijerph182111727
Lee B, Hwang S, Kim H. The Feasibility of Information-Entropy-Based Behavioral Analysis for Detecting Environmental Barriers. International Journal of Environmental Research and Public Health. 2021; 18(21):11727. https://doi.org/10.3390/ijerph182111727
Chicago/Turabian StyleLee, Bogyeong, Sungjoo Hwang, and Hyunsoo Kim. 2021. "The Feasibility of Information-Entropy-Based Behavioral Analysis for Detecting Environmental Barriers" International Journal of Environmental Research and Public Health 18, no. 21: 11727. https://doi.org/10.3390/ijerph182111727
APA StyleLee, B., Hwang, S., & Kim, H. (2021). The Feasibility of Information-Entropy-Based Behavioral Analysis for Detecting Environmental Barriers. International Journal of Environmental Research and Public Health, 18(21), 11727. https://doi.org/10.3390/ijerph182111727