Abstract
To prevent intensive noise exposure in advance and be safely controlled during such exposure, hearing protection devices (HPDs) have been widely used by workers. The present study evaluates the effectiveness of these HPDs, partitioned into three different outcomes, such as sound attenuation, sound localization, and speech perception. Seven electronic journal databases were used to search for published articles from 2000 to 2021. Based on inclusion criteria, 20 articles were chosen and then analyzed. For a systematic review and meta-analysis, standardized mean differences (SMDs) and effect size were calculated using a random-effect model. The funnel plot and Egger’s regression analysis were conducted to assess the risk of bias. From the overall results of the included 20 articles, we found that the HPD function performed significantly well for their users (SMDs: 0.457, 95% confidence interval (CI): 0.034–0.881, p < 0.05). Specifically, a subgroup analysis showed a meaningful difference in sound attenuation (SMDs: 1.080, 95% CI: 0.167–1.993, p < 0.05) when to wear and not to wear HPDs, but indicated no significance between the groups for sound localization (SMDs: 0.177, 95% CI: 0.540–0.894, p = 0.628) and speech perception (SMDs: 0.366, 95% CI: −0.100–1.086, p = 0.103). The HPDs work well for their originally designated purposes without interfering to find the location of the sound sources and for talking between the workers. Taking into account various factors, such as the characteristics of the users, selection of appropriate types, and fitting methods for wearing in different circumstances, seems to be necessary for a reliable systematic analysis in terms of offering the most useful information to the workers.
1. Introduction
It is clearly acknowledged that industrial workers and individuals in military service have inevitably faced more noise exposure and that exposure has increased the incidence of noise-induced hearing loss (NIHL) [1,2]. Not only temporary noise exposure of high intensity (i.e., more than 85 dBA) in terms of level of intensity, but also continuous exposure to moderate-intensity noise in terms of frequency can contribute seriously to negative effects on the human auditory system [1,2]. Thus, noise is regarded as a decisive factor producing the hearing loss of workers [3] and consequently accompanying other otologic problems and diseases such as tinnitus, poor hearing ability for situational awareness and communication, and psychological problems such as a lower quality of life [4].
To prevent such exposure to intensive noise in advance and be safely controlled during exposure, hearing protection devices (HPDs) have been under development for several decades. Although HPDs seem to be a passive method of noise control, they are the most practical and good enough when appropriately fitted for a correct size and have received adequate maintenance [5,6]. Unlike their original purpose, however, many workers are frequently reluctant or even do not wear these devices due to discomfort and a tight fit feeling even in a noisy environment [4]. Further, the sound attenuation obtained by wearing the HPDs, which is a key function to prevent NIHL [7], may decrease the ability to identify sound localization [8,9,10] and achieve speech perception [3,11,12,13]. Therefore, many researchers have studied the functions and effects of HPDs whenever a new device is released. Regardless, these studies have produced a problem, namely, how to organize and summarize their different findings, consequently resulting in the suggestion of needing a systematic analysis to achieve the highest level of evidence. Hence, we aimed to evaluate the major functions of the HPDs using systematic review and meta-analysis techniques. More specifically, the effectiveness of HPDs was partitioned to three different functions and effects, including sound attenuation, sound localization, and speech perception, which can give the users clearer expectations about the efficiency of these HPDs when wearing them.
2. Materials and Methods
2.1. Strategy for Systematic Search
The Preferred Reporting Items for Systematic Reviews and Meta-analysis (PRISMA) 2020 statement [14] and the International Prospective Register of Systematic Reviews (PROSPERO) of Cochrane Collaboration [15] were used as a methodology that commonly processes the systematic search for and meta-analysis of published articles and their review was reported. The PROSPERO registration number was CRD42021276424.
The process applied for the inclusion criteria of articles for the systematic review and meta-analysis [14,15] combined a strategy using participants, intervention, control, outcome measures, and study design (PICOS). Table 1 displays the PICOS criteria used in the present study. On the other hand, our exclusion criteria were modeling studies, engineering design, no research article (e.g., narrative review paper, conference abstract, letters, book and book chapters, magazines, and proceeding paper), and not being written in English.

Table 1.
Inclusion criteria for the present study using Participants, Intervention, Control, Outcomes, and Study Designs (PICOS) Strategy.
2.2. Article Selection
Seven electronic databases (i.e., Embase, Medline, Pubmed, Web of Science, Science Direct, Scopus, Cumulative Index to Nursing and Allied Health) were used and searched from January 2000 to June 2021 using the key terms, “hearing protection devices” OR “hearing protector” AND “hearing protection devices effects” OR “effects” OR “attenuation” OR “intervention” OR “sound localization” OR “benefits” OR “speech intelligibility”. The terms were always combined to limit identifying duplicate papers.
Initially, the number of articles searched in the electronic databases equaled 3971. After eliminating 2118 articles which were met the exclusion criteria due to duplication, 1853 articles remained. As a part of the screening process, their titles and abstracts were confirmed to exclude 1166 records. Then, only 687 articles were accessed to review their full texts at the eligibility stage. Further, because 667 studies failed to meet the PICOS criteria for several reasons (i.e., participants in industrial work and irrelevant outcome measures), a total of 20 articles were included for the specific review. Figure 1 explains each of these steps visually.
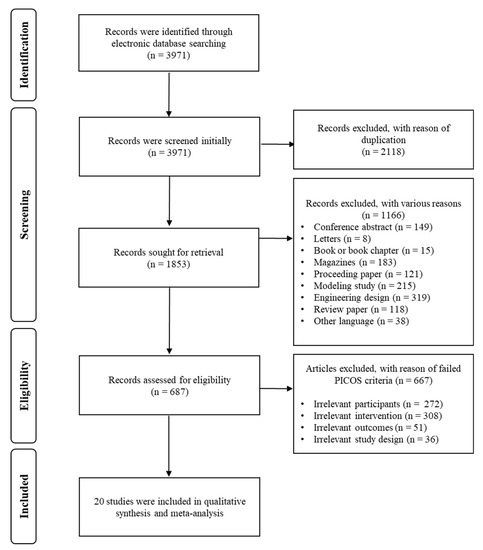
Figure 1.
A Preferred Reporting for Items for a Systematic Review and Meta-analysis (PRISMA) flow diagram to explain the inclusion and exclusion process of the current study.
2.3. Study Quality and Potential Sources of Study Bias
To evaluate both study quality and potential sources of any study bias, the CAMARADES checklist was used [16]. It contained six independent items, namely, randomization (pseudo-randomization of participants allocation, test condition, or materials), controls, sample size calculation (calculation of the appropriate number of study sample produced using power analysis), articles published with peer review, outcome measure, and statement of potential conflict of interests (see Table 2 for details). The scores were calculated using 1, which was assigned by the item (i.e., YES), or 0 (i.e., NO). After providing scores for study quality, each study was summed up at the level of the evidence based on the Grading of Recommendations, Assessment, Development, and Evaluation (GRADE) Working Group Guideline [17]. The study quality scores of selected articles were analyzed by the chi-square test. Simply put, as the level of evidence increased, the results of the study were considered to be valid.
Table 2.
Analysis of the scientific study validity criteria based on CAMARADES checklists [16].
The data contained in the articles were extracted and synthesized for the following content: (1) participants (number, age, sex, and hearing threshold); (2) types of hearing protection devices; (3) study design; (4) the main factor of the experiments (i.e., level of attenuation, ability of sound localization, and performance of speech perception); (5) outcome measures; and (6) major findings. Two authors (C.K. and W.H.) conducted the process independently and then any discrepancies (less than 5%) were resolved by consensus between the two authors.
2.4. Meta-Analysis
The included articles were identified to determine whether their data were suitable for meta-analysis. Comprehensive Meta-Analysis software (Ver. 3, Biostat Inc., Englewood, NJ, USA) was used to conduct the meta-analysis. The data collected from the included articles were continuous, and the same outcome measures, mean differences (MDs), were calculated with 95% confidence intervals (CIs). However, when the data having different outcome measures were collected, the effect sizes were calculated using standardized mean differences (SMDs). After the effect sizes were calculated, a summary estimate was examined. As the participants in the reviewed articles were adults, both with and without hearing loss, the random-effect model was used to calculate the effect size and summary estimate. Heterogeneity (genuine differences underlying the results of the studies) [28] across the articles was identified using the Higgins I2-statistics and Cochran’s Q-test. To quantify heterogeneity, Higgins I2 provided a value from 0 to 100%: 0–25% for low, 25–75% for moderate, and 75–100% for high [28]. Cochran’s Q-test indicated a 95% statistical significance level (p < 0.05). The subgroup analysis, which categorized the articles as having three remarkable features (e.g., sound attenuation, sound localization, and speech perception) and meta-regression were considered due to the possibility of high heterogeneity and/or different outcome measures for the reviewed studies.
Reporting bias occurred when the reporting and spreading of the results of studies were influenced by their characteristics and directions of their main findings. The most representative was a publication bias where the studies having statistically significant differences had a larger possibility of publication compared to those studies with no significant differences. Since the publication bias usually produced distorted results for the meta-analysis [29], the funnel plot and Egger’s regression test were used to identify it. The funnel plot is a kind of scatter plot consisting of a y-axis for the sample size of studies and an x-axis for the effect size.
3. Results
3.1. Study Quality Scores
The scores for study quality, based on the CAMARADES checklists, were analyzed using a chi-square test and R statistical computing software [30]. The mean value of the study quality scores was 3.45 (SD: 0.83, range: 2~5). Then, to identify the goodness of fit for the study quality scores, a chi-square test was also conducted using the R software [30]. There were no significant differences between the study quality scores (χ2 = 3.7536, df = 19, p > 0.05).
3.2. Charactersits of Studies
3.2.1. Participants
The summarized results of the reviewed studies according to the PICOS criteria are displayed in Table 3. The participants included individuals with both normal hearing [4,7,8,9,10,11,12,13,18,19,20,21,22,23,24,25] and hearing loss [3,5,26]. Specifically, Smalt et al. reported on one single individual with a threshold of 30 dB HL in one ear [3] and Abel et al. had 24 older adults with hearing loss [5]. In the study of Giguère and colleagues, the subjects were divided into four groups, e.g., normal hearing, slight-to-mild hearing loss, mild-to-moderate hearing loss, and moderate-to-severe hearing loss [26].
Table 3.
Characteristics and effects of hearing protection devices for all enrolled studies for the participants, intervention, control group, and outcome of each study.
3.2.2. Intervention
Types of HPDs, their functions and effects were evaluated as the intervention. Six of twenty studies conducted a comparison between types of HPDs. For example, in the study by Simpson et al., types of HPDs for earplugs, earmuffs, and a combination of earplugs and earmuffs [24] were compared. On the other hand, fourteen of twenty studies compared two conditions for when to wear and not to wear HPDs by using various scenarios of use, such as earplugs only [3,7,10,12,13,19,20,22], earmuffs only [5,8,9,11], earplugs and/or earmuffs [4,18,21,23,25,26], earplugs with earmuffs [24], and headsets [27]. In terms of functions and effects, only six of twenty studies used passive noise reduction HPDs such as earplugs and earmuffs [5,7,13,20,23,24]. More than half of the studies (fourteen of twenty studies) used HPDs with a function for active noise reduction [3,4,8,9,10,11,12,18,19,21,22,25,26,27].
3.2.3. Controls and Study Designs
It was desirable to ensure that there was high-level evidence (i.e., randomized controlled trials) for the research articles [31]. Additionally, a between-group comparison (i.e., experimental group versus control group) was regarded as an alternative choice to use to confirm the effects of the experiment. In the current review, only three of twenty studies used between-group comparisons [5,8,26], and the other seventeen studies were conducted using repeated measures under various conditions [3,4,7,9,10,11,12,13,18,19,20,22,23,24,25]. In the other view, although three of the twenty studies provided between-group comparisons [5,8,26], twenty studies, including the aforementioned three, were used repeated measures that compared types of HPDs or made comparisons with and without HPDs.
3.2.4. Outcomes
To identify the functions and effects of HPDs, the outcomes of the reviewed studies were classified. Five of twenty studies mainly determined the functions and effects of HPDs by sound attenuation [5,7,20,21,22]. Outcomes of sound localization and speech perception were reported by eight [4,8,9,10,18,23,24,25] and seven [3,11,12,13,19,26,27] of the twenty studies, respectively.
3.3. Overall Functions and Effects of Hearing Protection Devices
The results of effect size for the overall studies with the random effect model are presented in Figure 2A. Overall, the studies showed an SMD of 0.457 (95% CI: 0.034–0.881, p < 0.05), indicating that there was a significant functional difference. To identify the publication bias for the reviewed studies, a funnel plot is presented in Figure 2B. Not only was the funnel plot asymmetrical, but also the results of Egger’s regression analysis showed that there was publication bias in the reviewed studies (intercept: 4.159, SE: 2.310, p < 0.05). Further, the results of Higgins I2 statistics and Cochran’s Q test showed that heterogeneity was high (I2: 88.08, Q: 159.369, p < 0.001).
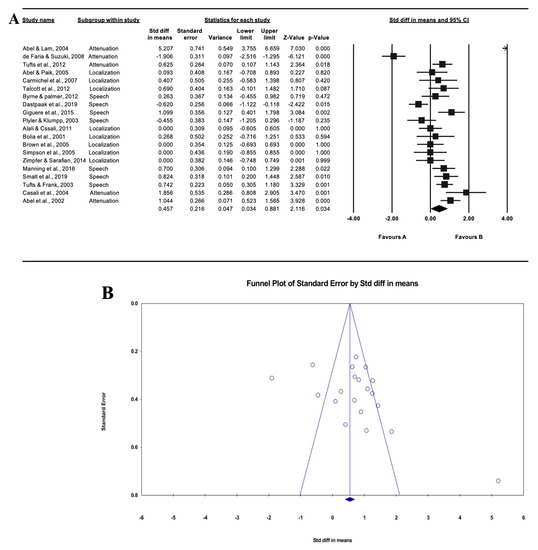
Figure 2.
Forest plot of the twenty reviewed studies overall (A) and funnel plot of standard error for the standardized difference in means. Asymmetrical graph of funnel plot indicating publication bias (B).
3.4. Subgroup Analysis
To identify the results of the meta-analysis more clearly, a subgroup analysis (i.e., attenuation, sound localization, and speech perception) was conducted. For the functions and effects of HPDs, a subgroup analysis was conducted and is presented in Figure 3. First, the effect size of sound attenuation which compared the hearing thresholds for the control (i.e., unoccluded and/or open ear) and an experimental group (i.e., wearing the HPDs) showed 1.080 (95% CI: 0.167–1.993, p < 0.05).
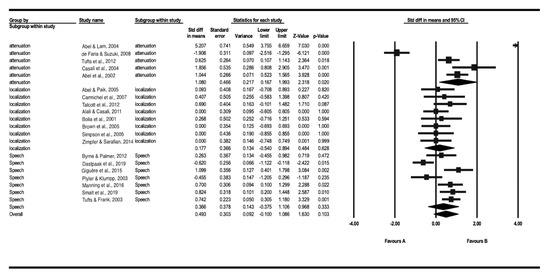
Figure 3.
The forest plot of the subgroup analysis for sound attenuation (n = 6), sound localization (n = 9), and speech perception (n = 8).
Secondly, the subgroup analysis for sound localization included those studies that mainly reported the results for localization ability, such as the percentage correctness, response time, and azimuth error. These results confirmed that the ability of sound localization was not significantly different (SMD: 0.177, 95% CI: −0.540–0.894, p = 0.628) in individuals with HPDs compared to individuals without HPDs.
Finally, the studies that reported various speech perception performances (i.e., speech perception in noise, speech intelligibility, and word recognition ability) were classified as a subgroup of speech perception. The results for speech perception demonstrated that HPDs partially support the ability of speech perception, but they do not have any significant effect (SMD: 0.366, 95% CI: −0.375–1.106, p = 0.333).
4. Discussion
The primary purpose of the current study on systematic review and meta-analysis was to identify the effectiveness of HPDs. Three outcome measures, including sound attenuation, sound localization, and speech perception, were divided into two factors based on function (i.e., sound attenuation) and effect (i.e., sound localization and speech perception). Based on the effect size of a total of twenty reviewed studies, the functions and effects of HPDs that were revealed were significant. Several studies had a value 0 between the lower limit and upper limit of 95% CI and/or a p-value higher than 0.05 which means there were high heterogeneities. These results might have occurred due to the small sample size. In fact, there were no studies that demonstrated a sample size calculation for their study design.
4.1. Do HPDs Effectively Attenuate the Level of Intensity of Unwanted Noise?
The major and key functions of HPDs were revealed to be significantly effective, which means the hearing thresholds for the experimental group (wearing the HPDs) increased more than that of the control group (not wearing the HPDs). Abel and Lam reported that both conventional and level-dependent earplugs attenuated the input sounds from 21 to 40 dB and 5 to 22 dB, respectively [20]. This result suggested that individuals who might recommend or willingly wear the HPDs have the choice to select HPDs to meet their purposes and situations. For example, the level-dependent earplugs were regarded as an alternative choice for the hearing-impaired or normal hearing in the case of a relatively not loud situation due to the increased hearing thresholds. According to Casali and colleagues [21], wearing HPDs significantly attenuated the sound more than not using HPDs. They also reported that masked thresholds when wearing HPDs at 85 dBA were more significantly reduced than without having the HPDs condition. These results implied that HPDs could meet the role of their designated purpose.
Again, the HPDs are direct wearing devices, which were originally designated to prevent noise exposure and preserve hearing acuity [32]. Interestingly, Tufts et al. reported the effects of user training and fitting consistency [7]. Their results showed the significant effects of user training. Compared to non-customized earplugs, customized earplugs showed significantly better consistency of attenuation values at frequency ranges of 500, 1000, and 2000 Hz. Moreover, the effects of user training were significant at three testing frequencies (i.e., 250, 500, and 1000 Hz). These results suggest that the function of HPDs, especially for sound attenuation, could be improved and decrease the deviation for trials where individuals tried to wear HPDs. Regardless, to obtain the best benefit from the HPDs, an appropriate fitting method should be required [5] because the uncomfortable feeling of HPDs stems from an inadequate fitting method and/or the type of HPDs and is reported as a problem when wearing HPDs [4].
4.2. Does Wearing HPDs Affect Sound Localization Ability for Their Users?
The effects that occurred while wearing the HPDs were analyzed as sound localization ability. Sound localization was defined as a kind of ability, such as percentage correctness, response time, and azimuth error. The results of sound localization when wearing the HPDs could not significantly change the ability of sound localization compared to the condition of no HPDs [4,8,9,10,24]. In other words, wearing the HPDs did not interfere with sound localization, but it did not improve sound localization for their users. The reason why the HPDs failed to improve the ability of sound localization might be due to the distortions of high-frequency spectral cues [4]. Simpson et al. argued that double protection, such as a combination of earplugs with earmuffs, does not help localize the incoming sounds [24]. Simply, in terms of the latest technology of HPDs, active noise reduction HPDs may be better than the HPDs in terms of passive noise reduction. Still, Abel and Paik argued that not only the earmuff is not desirable to use for directionality, but also that the active noise reduction HPDs do not help recover the sound localization ability. In addition, the studies conducted by Carmichel et al. and Talcott et al. compared the two different functions of active and passive noise reduction HPDs and concluded that both noise reduction HPDs unfortunately did not recover the ability to determine sound localization [9,10].
4.3. Does Wearing an HPD Affect a User’s Speech Perception Ability?
In view of user ability to have speech perception, similar to sound localization ability, the effect of HPDs was not significant based on the current meta-analysis. Since many of the studies that have reported the function of HPDs for speech perception ability are controversial, we believe that a current decisive and unified analysis is more informative. That is, three of seven studies which were clustered as a subgroup of speech perception argued that to wear HPDs did not improve speech perception ability [3,11,13]. Smalt et al. further reported the effects of HPDs on the listening effort, which was regarded as cognitive resources for auditory tasks [3]. They concluded that the use of HPDs increased the amount of listening effort. This increased listening effort produced cognitive fatigue, especially in noisy circumstances.
On the other hand, three studies posited that wearing HPDs could improve speech perception performance [12,26,27]. Although passive noise reduction HPDs which have a low noise reduction rating (NRR) showed increased speech intelligibility in the presence of background noise [12], active noise reduction HPDs provided substantial benefits for speech recognition performance, especially for the hearing-impaired users [26]. Plyler and Klumpp also suggested that active noise reduction HPDs may be beneficial for individuals with sensorineural hearing loss [19]. Further considering the characteristics and requirements of users who would be recommended and/or mandated for HPDs, Manning et al. reported on the benefits of bone-conduction HPDs for tinnitus patients [27]. They conducted speech recognition tasks under noisy circumstances for tinnitus patients, the hearing-impaired users, and normal hearing listeners, using both air- and bone-conduction HPDs. The authors reported that bone-conduction HPDs exhibited better performances than air-conduction HPDs did in all groups.
5. Conclusions
Based on the present systematic review that included meta-analysis, the HPDs performed well for their originally designated function, i.e., sound attenuation, without interfering with finding a location from the sound sources and talk between the workers. It is obvious that HPDs provide great benefits in specific situations and/or for individuals, such as in the presence of high-intensity noise, military soldiers, and occupational workers, b due to the attenuation of HPDs. Furthermore, the performance of sound localization and speech perception were not negatively affected for those users wearing the HPDs.
Although the present systematic review and meta-analysis were conducted with specific purposes, such as the evaluation of major functions and effects (i.e., sound attenuation, sound localization, and speech perception) of HPDs, a comparison between passive and active HPDs was not considered. For example, six articles used passive HPDs, and fourteen articles used active HPDs in the twenty reviewed articles. It is obvious that the mechanisms of passive HPDs and active HPDs are differently enacted, and these types of mechanisms for HPDs should be discussed in further.
In conclusion, because the results of HPDs analysis from many previous studies are controversial, high-level evidence of using HPDs will need to include evidence-based guidelines for those individuals who are recommended and/or mandated to wear HPDs.
Author Contributions
Conceptualization: C.K. and W.H.; Formal analysis: C.K.; Funding acquisition: W.H.; Methodology: C.K. and W.H.; Supervision: W.H.; Validation: W.H.; Visualization: C.K.; Writing—original draft: C.K.; Writing—review and editing: W.H. All authors have read and agreed to the published version of the manuscript.
Funding
This work was supported by the Hallym University Research Fund (HRF-202109-006).
Institutional Review Board Statement
Not Applicable.
Informed Consent Statement
Not Applicable.
Data Availability Statement
The datasets used and/or analyzed for current study are available from the corresponding author on reasonable request.
Conflicts of Interest
The authors declare no conflict of interest.
References
- Chung, I.S.; Chu, I.M.; Cullen, M.R. Hearing effects from intermittent and continuous noise exposure in a study of Korean factory workers and firefighters. BMC Public Health 2012, 12, 1–7. [Google Scholar] [CrossRef]
- MacGregor, A.J.; Joseph, A.R.; Walker, G.J.; Dougherty, A.L. Co-occurrence of hearing loss and posttraumatic stress disorder among injured military personnel: A retrospective study. BMC Public Health 2020, 20, 1–7. [Google Scholar] [CrossRef]
- Smalt, C.J.; Calamia, P.T.; Dumas, A.P.; Perricone, J.P.; Patel, T.; Bobrow, J.; Collins, P.P.; Markey, M.L.; Quatieri, T.F. The Effect of Hearing-Protection Devices on Auditory Situational Awareness and Listening Effort. Ear Hear. 2020, 41, 82–94. [Google Scholar] [CrossRef]
- Brown, A.D.; Beemer, B.T.; Greene, N.T.; Argo IV, T.; Meegan, G.D.; Tollin, D.J. Effects of active and passive hearing protection devices on sound source localization, speech recognition, and tone detection. PLoS ONE 2015, 10, e0136568. [Google Scholar] [CrossRef] [PubMed]
- Abel, S.M.; Sass-Kortsak, A.; Kielar, A. The effect on earmuff attenuation of other safety gear worn in combination. Noise Health 2002, 5, 1–13. [Google Scholar]
- Song, H.; Jeong, S.; Lee, E.; Alsabbagh, N.; Lee, J.; You, S.; Kwak, C.; Kim, S.; Han, W. Types of hearing protection devices and application. Korean J. Otorhinolaryngol.-Head Neck Surg. 2019, 62, 1–14. [Google Scholar] [CrossRef]
- Tufts, J.B.; Jahn, K.N.; Byram, J.P. Consistency of attenuation across multiple fittings of custom and non-custom earplugs. Ann. Occup. Hyg. 2013, 57, 571–580. [Google Scholar]
- Abel, S.M.; Paik, J.S. Sound source identification with ANR earmuffs. Noise Health 2005, 7, 1–10. [Google Scholar] [CrossRef] [PubMed]
- Carmichel, E.L.; Harris, F.P.; Story, B.H. Effects of binaural electronic hearing protectors on localization and response time to sounds in the horizontal plane. Noise Health 2007, 9, 83–95. [Google Scholar]
- Talcott, K.A.; Casali, J.G.; Keady, J.P.; Killion, M.C. Azimuthal auditory localization of gunshots in a realistic field environment: Effects of open-ear versus hearing protection-enhancement devices (HPEDs), military vehicle noise, and hearing impairment. Int. J. Audiol. 2012, 51, S20–S30. [Google Scholar] [CrossRef] [PubMed]
- Byrne, D.C.; Palmer, C.V. Comparison of speech intelligibility measures for an electronic amplifying earmuff and an identical passive attenuation device. Audiol. Res. 2012, 2, 17–24. [Google Scholar] [CrossRef]
- Dastpaak, H.; Alimohammadi, I.; jalal Sameni, S.; Abolghasemi, J.; Vosoughi, S. Effects of earplug hearing protectors on the intelligibility of Persian words in noisy environments. Appl. Acoust. 2019, 148, 19–22. [Google Scholar] [CrossRef]
- Tufts, J.B.; Frank, T. Speech production in noise with and without hearing protection. J. Acoust. Soc. Am. 2003, 114, 1069–1080. [Google Scholar] [CrossRef] [PubMed]
- Page, M.J.; McKenzie, J.E.; Bossuyt, P.M.; Boutron, I.; Hoffmann, T.C.; Mulrow, C.D.; Shamseer, L.; Tetzlaff, J.M.; Akl, E.A.; Brennan, S.E.; et al. The PRISMA 2020 statement: An updated guideline for reporting systematic revies. BMJ 2021, 372, 1–9. [Google Scholar]
- PROSPERO, Centre for Reviews and Dissemination. Title of subordinate document. International Prospective Register of Systematic Reviews. Centre for Reviews and Dissemination. 2014. Available online: http://cdn.elsevier.com/promis_misc/PROSPEROAnimal.pdf (accessed on 5 April 2021).
- Macleod, M.R.; O’Collins, T.; Horky, L.L.; Howells, D.W.; Donnan, G.A. Systematic review and metaanalysis of the efficacy of FK506 in experimental stroke. J. Cereb. Blood Flow Metab. 2005, 25, 713–721. [Google Scholar] [CrossRef] [PubMed]
- Group, G.W. Grading quality of evidence and strength of recommendations. BMJ 2004, 328, 1490–1494. [Google Scholar]
- Alali, K.A.; Casali, J.G. The challenge of localizing vehicle backup alarms: Effects of passive and electronic hearing protectors, ambient noise level, and backup alarm spectral content. Noise Health 2011, 13, 99–112. [Google Scholar] [PubMed]
- Plyler, P.N.; Klumpp, M.L. Communication in noise with acoustic and electronic hearing protection devices. J. Am. Acad. Audiol. 2003, 14, 260–268. [Google Scholar] [CrossRef]
- Abel, S.M.; Lam, Q. Sound attenuation of the indoor/outdoor range EAR plug. Mil. Med. 2004, 169, 551–555. [Google Scholar] [CrossRef] [PubMed][Green Version]
- Casali, J.G.; Robinson, G.S.; Dabney, E.C.; Gauger, D. Effect of electronic ANR and conventional hearing protectors on vehicle backup alarm detection in noise. Hum. Factors 2004, 46, 1–10. [Google Scholar] [CrossRef]
- de Faria, C.A.R.; Suzuki, F.A. Pure tone audiometry with and without specific ear protectors. Braz. J. Otorhinolaryngol. 2008, 74, 417–422. [Google Scholar] [CrossRef]
- Bolia, R.S.; D’Angelo, W.R.; Mishler, P.J.; Morris, L.J. Effects of hearing protectors on auditory localization in azimuth and elevation. Hum. Factors 2001, 43, 122–128. [Google Scholar] [CrossRef] [PubMed]
- Simpson, B.D.; Bolia, R.S.; McKinley, R.L.; Brungart, D.S. The impact of hearing protection on sound localization and orienting behavior. Hum. Factors 2005, 47, 188–198. [Google Scholar] [CrossRef] [PubMed]
- Zimpfer, V.; Sarafian, D. Impact of hearing protection devices on sound localization performance. Front. Neurosci. 2014, 8, 1–10. [Google Scholar] [CrossRef]
- Giguère, C.; Laroche, C.; Vaillancourt, V. The interaction of hearing loss and level-dependent hearing protection on speech recognition in noise. Int. J. Audiol. 2015, 54, S9–S18. [Google Scholar] [CrossRef] [PubMed]
- Manning, C.; Mermagen, T.; Scharine, A. The effect of sensorineural hearing loss and tinnitus on speech recognition over air and bone conduction military communications headsets. Hear. Res. 2017, 349, 67–75. [Google Scholar] [CrossRef]
- Higgins, J.P.; Thompson, S.G.; Deeks, J.J.; Altman, D.G. Measuring inconsistency in meta-analysis. BMJ 2003, 327, 557–560. [Google Scholar] [CrossRef] [PubMed]
- Simes, R.J. Confronting publication bias: A cohort design for meta-analysis. Stat. Med. 1987, 6, 11–29. [Google Scholar] [CrossRef]
- The R Foundation. R: A Language and Environment for Statistical Computing. The R Foundation. 2018. Available online: https://www.R-project.org/ (accessed on 7 April 2021).
- Henshaw, H.; Ferguson, M.A. Efficacy of individual computer-based auditory training for people with hearing loss: A systematic review of the evidence. PLoS ONE 2013, 8, e62836. [Google Scholar] [CrossRef]
- Rawool, V.W. Conservation and management of hearing loss in musicians. In Hearing Conservation in Occupational, Recreational, Educational, and Home Settings, 1st ed.; Rawool, V.W., Ed.; Thieme: New York, NY, USA, 2012; pp. 201–223. [Google Scholar]
Publisher’s Note: MDPI stays neutral with regard to jurisdictional claims in published maps and institutional affiliations. |
© 2021 by the authors. Licensee MDPI, Basel, Switzerland. This article is an open access article distributed under the terms and conditions of the Creative Commons Attribution (CC BY) license (https://creativecommons.org/licenses/by/4.0/).