
The Link between Landscape Characteristics and Soil Losses Rates over a Range of Spatiotemporal Scales: Hubei Province, China

 , , , ,
Abstract
:1. Introduction
2. Study Area and Data Sources
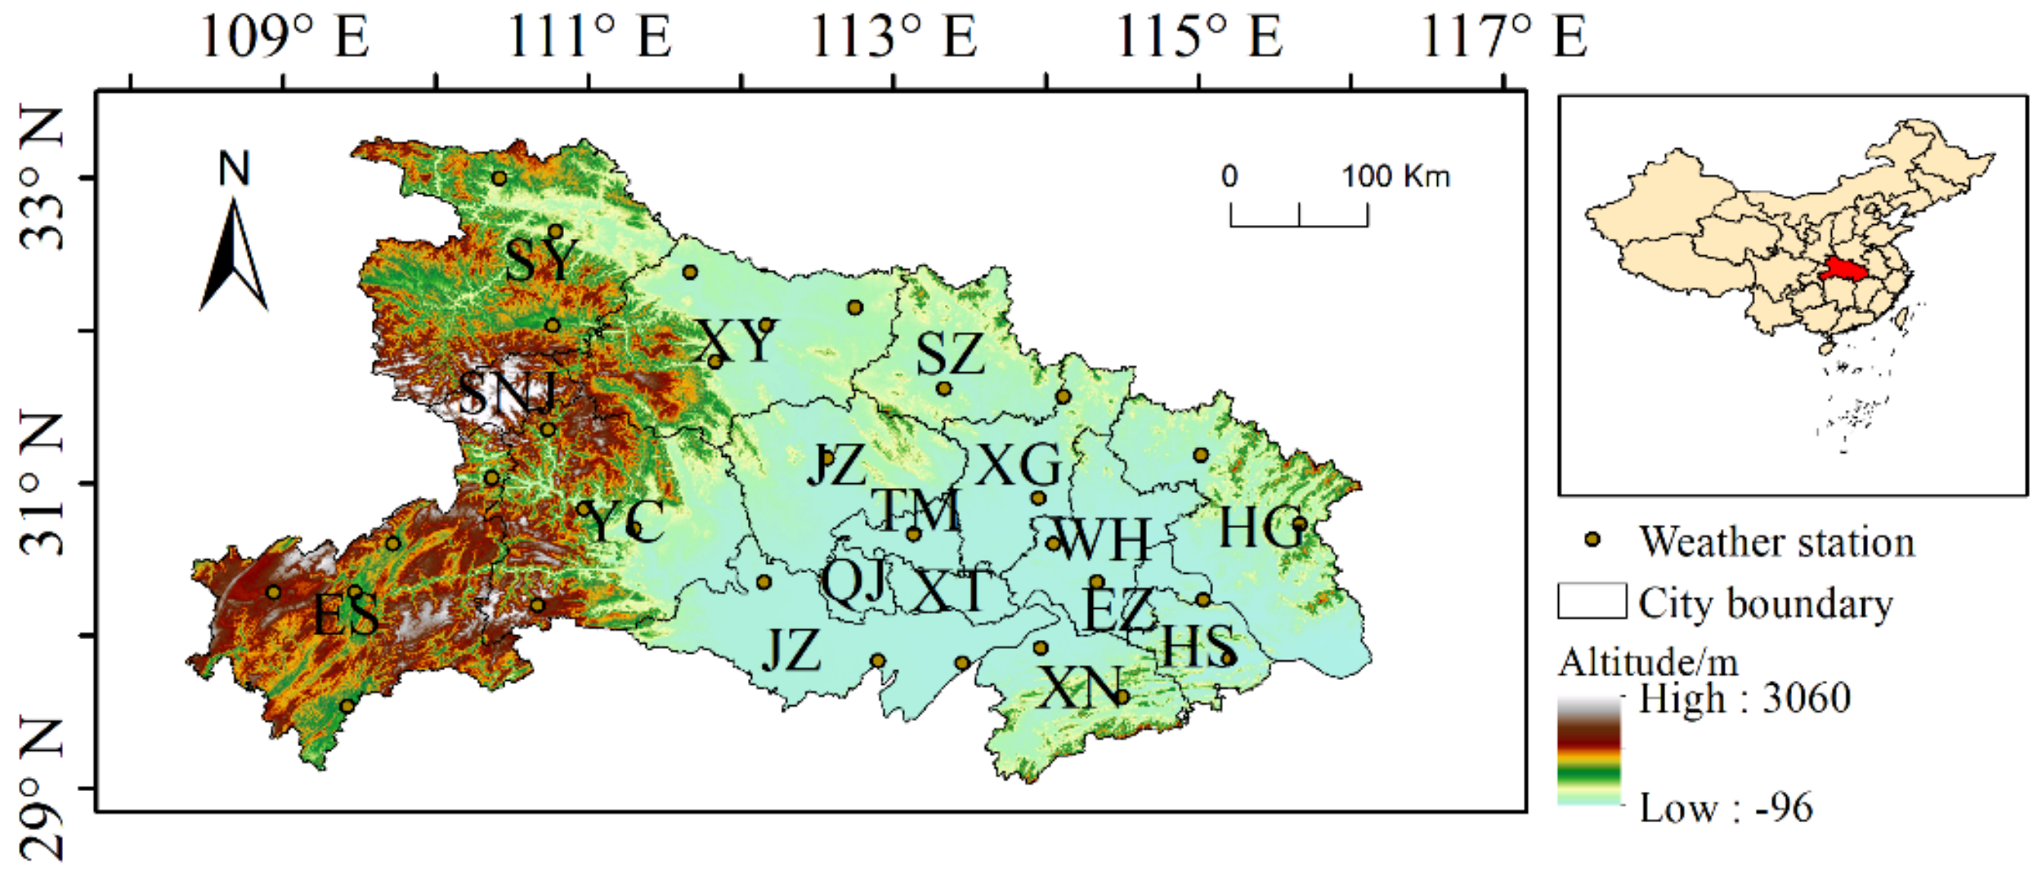
2.1. Study Area
2.2. Data Sources
3. Method
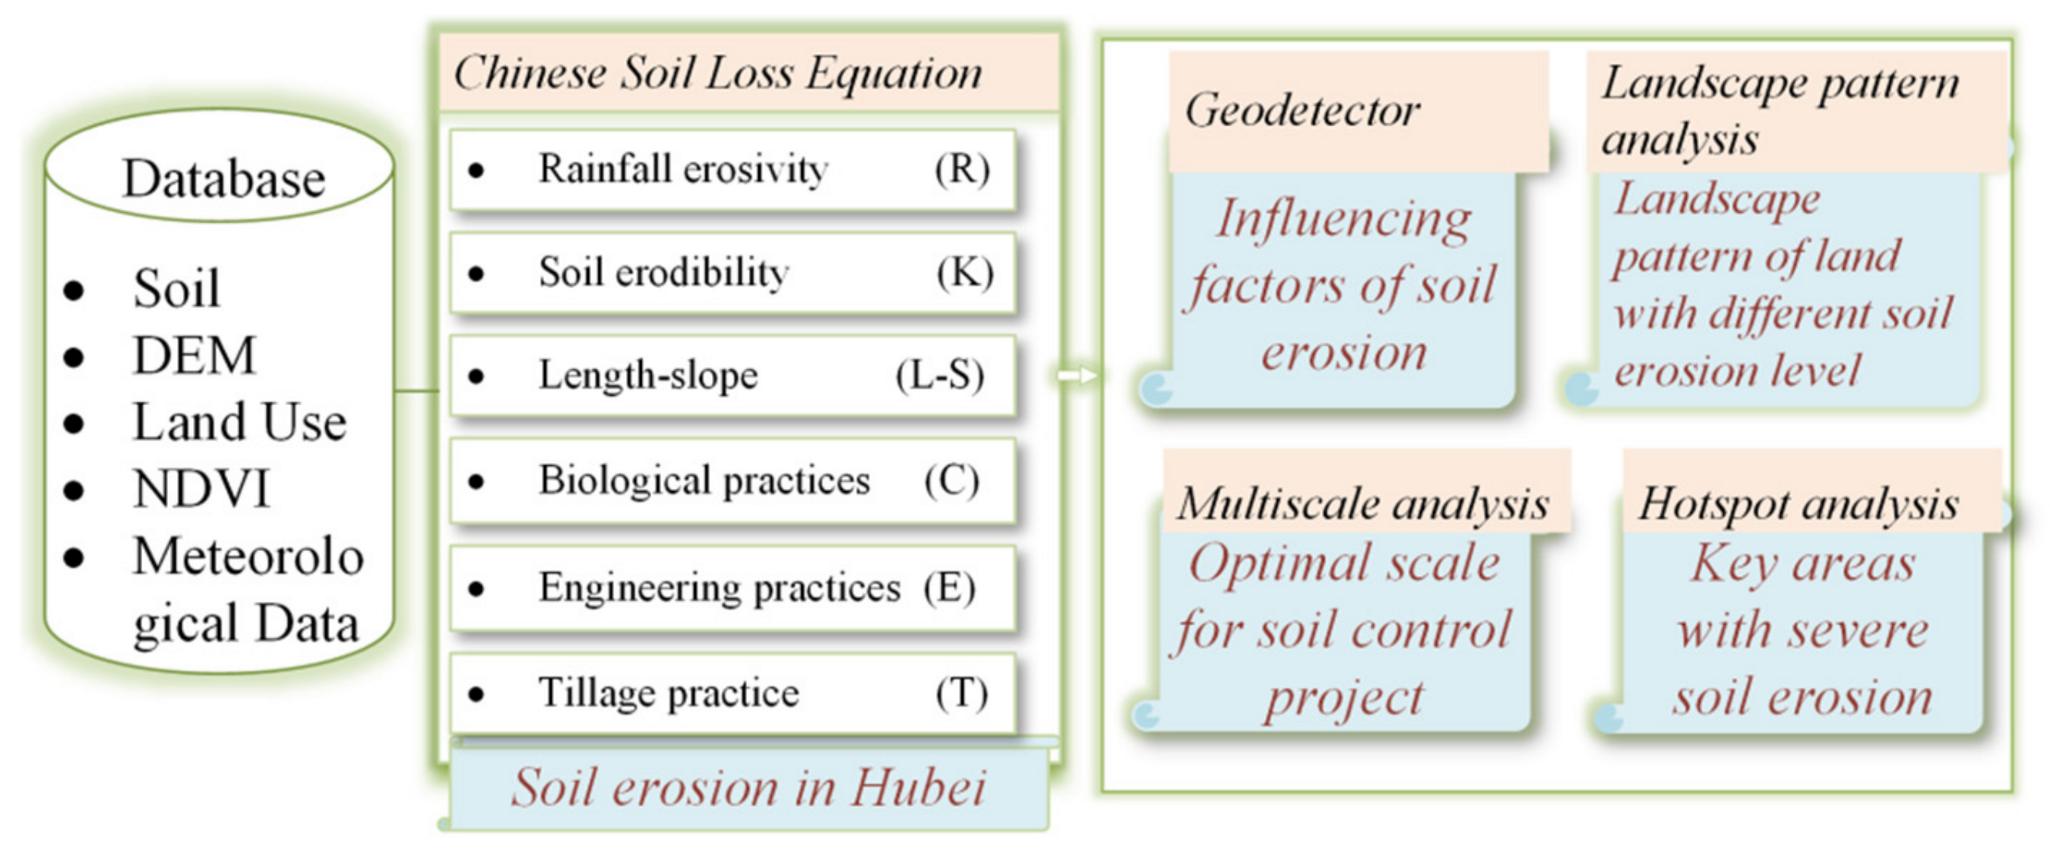
3.1. Chinese Soil Loss Equation (CSLE)
3.2. Geodetector
3.3. Landscape Pattern Analysis
3.3.1. Aggregation Index (AI)
3.3.2. Fractal Dimension Index (FRAC)
3.4. Hotspot Analysis
4. Results
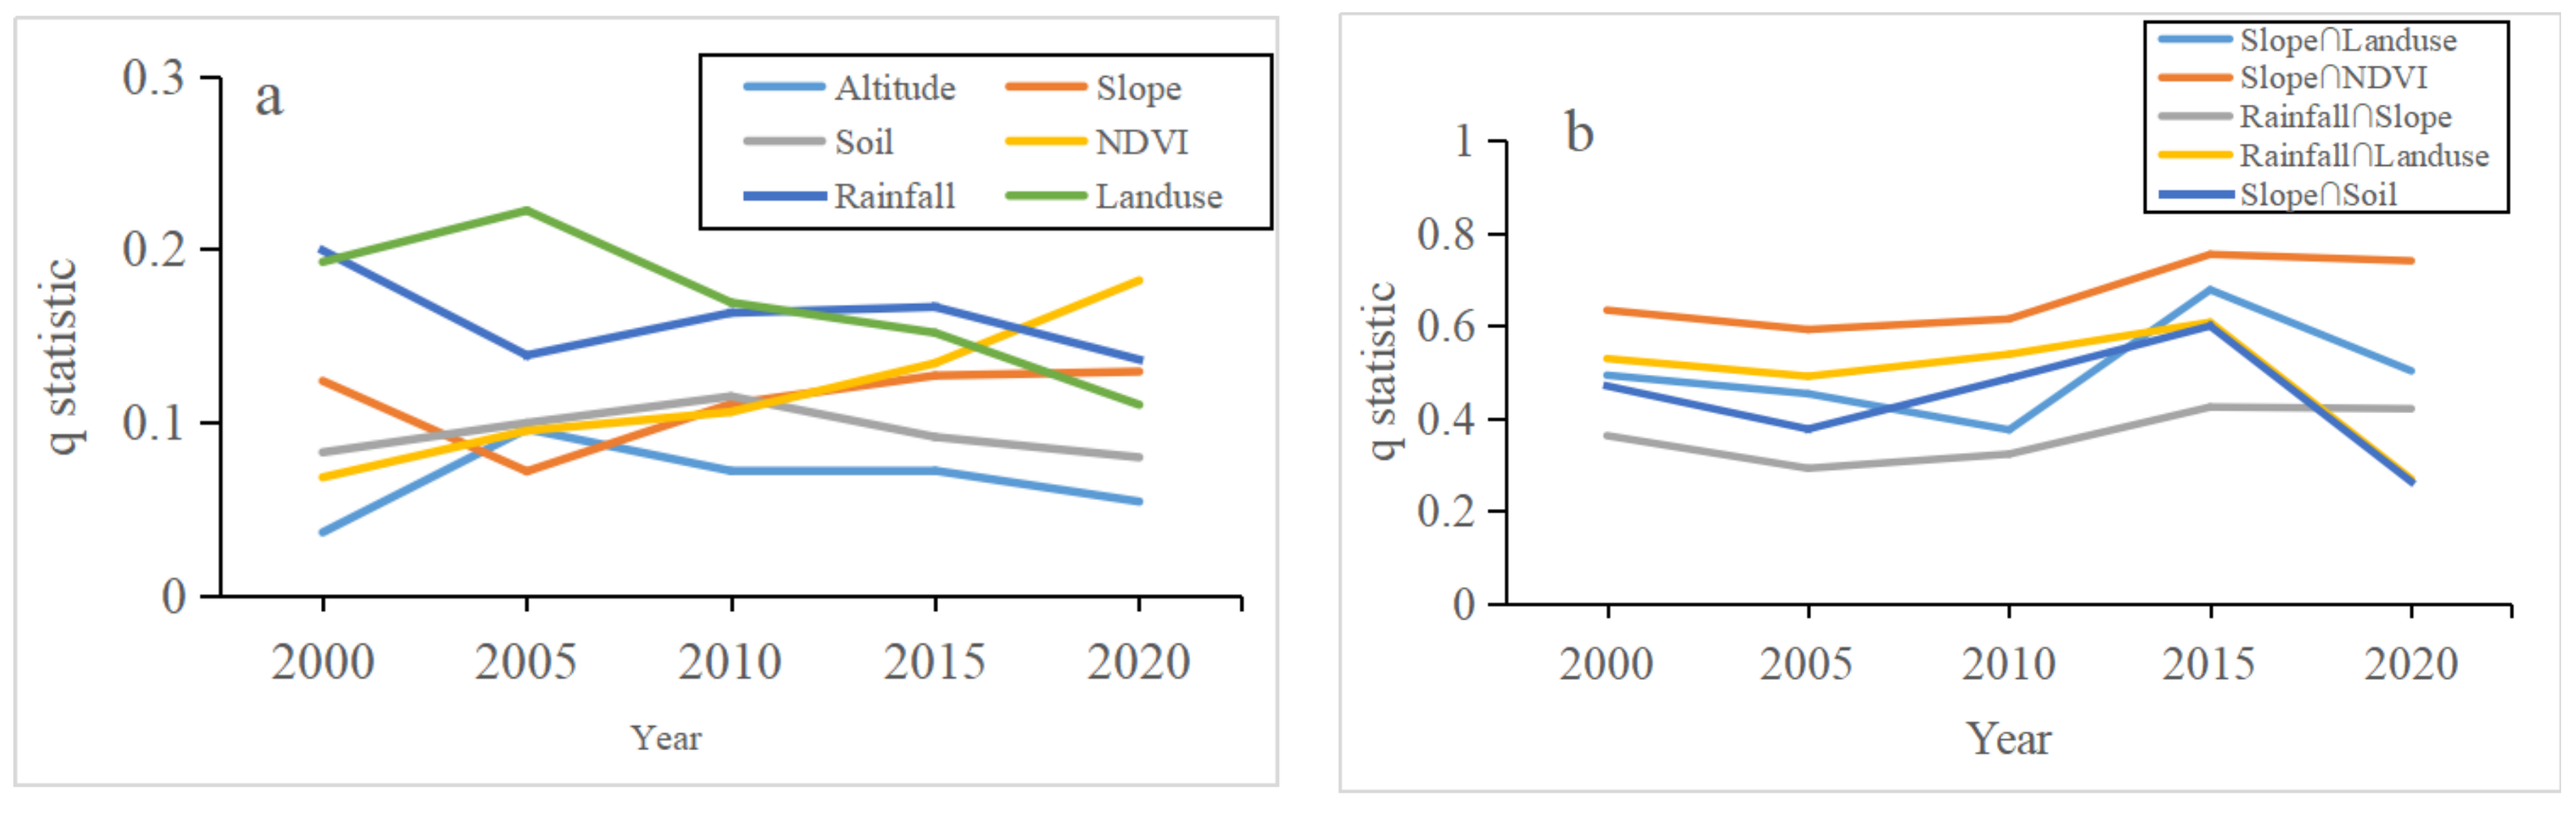
4.1. Factors Influencing Soil Erosion
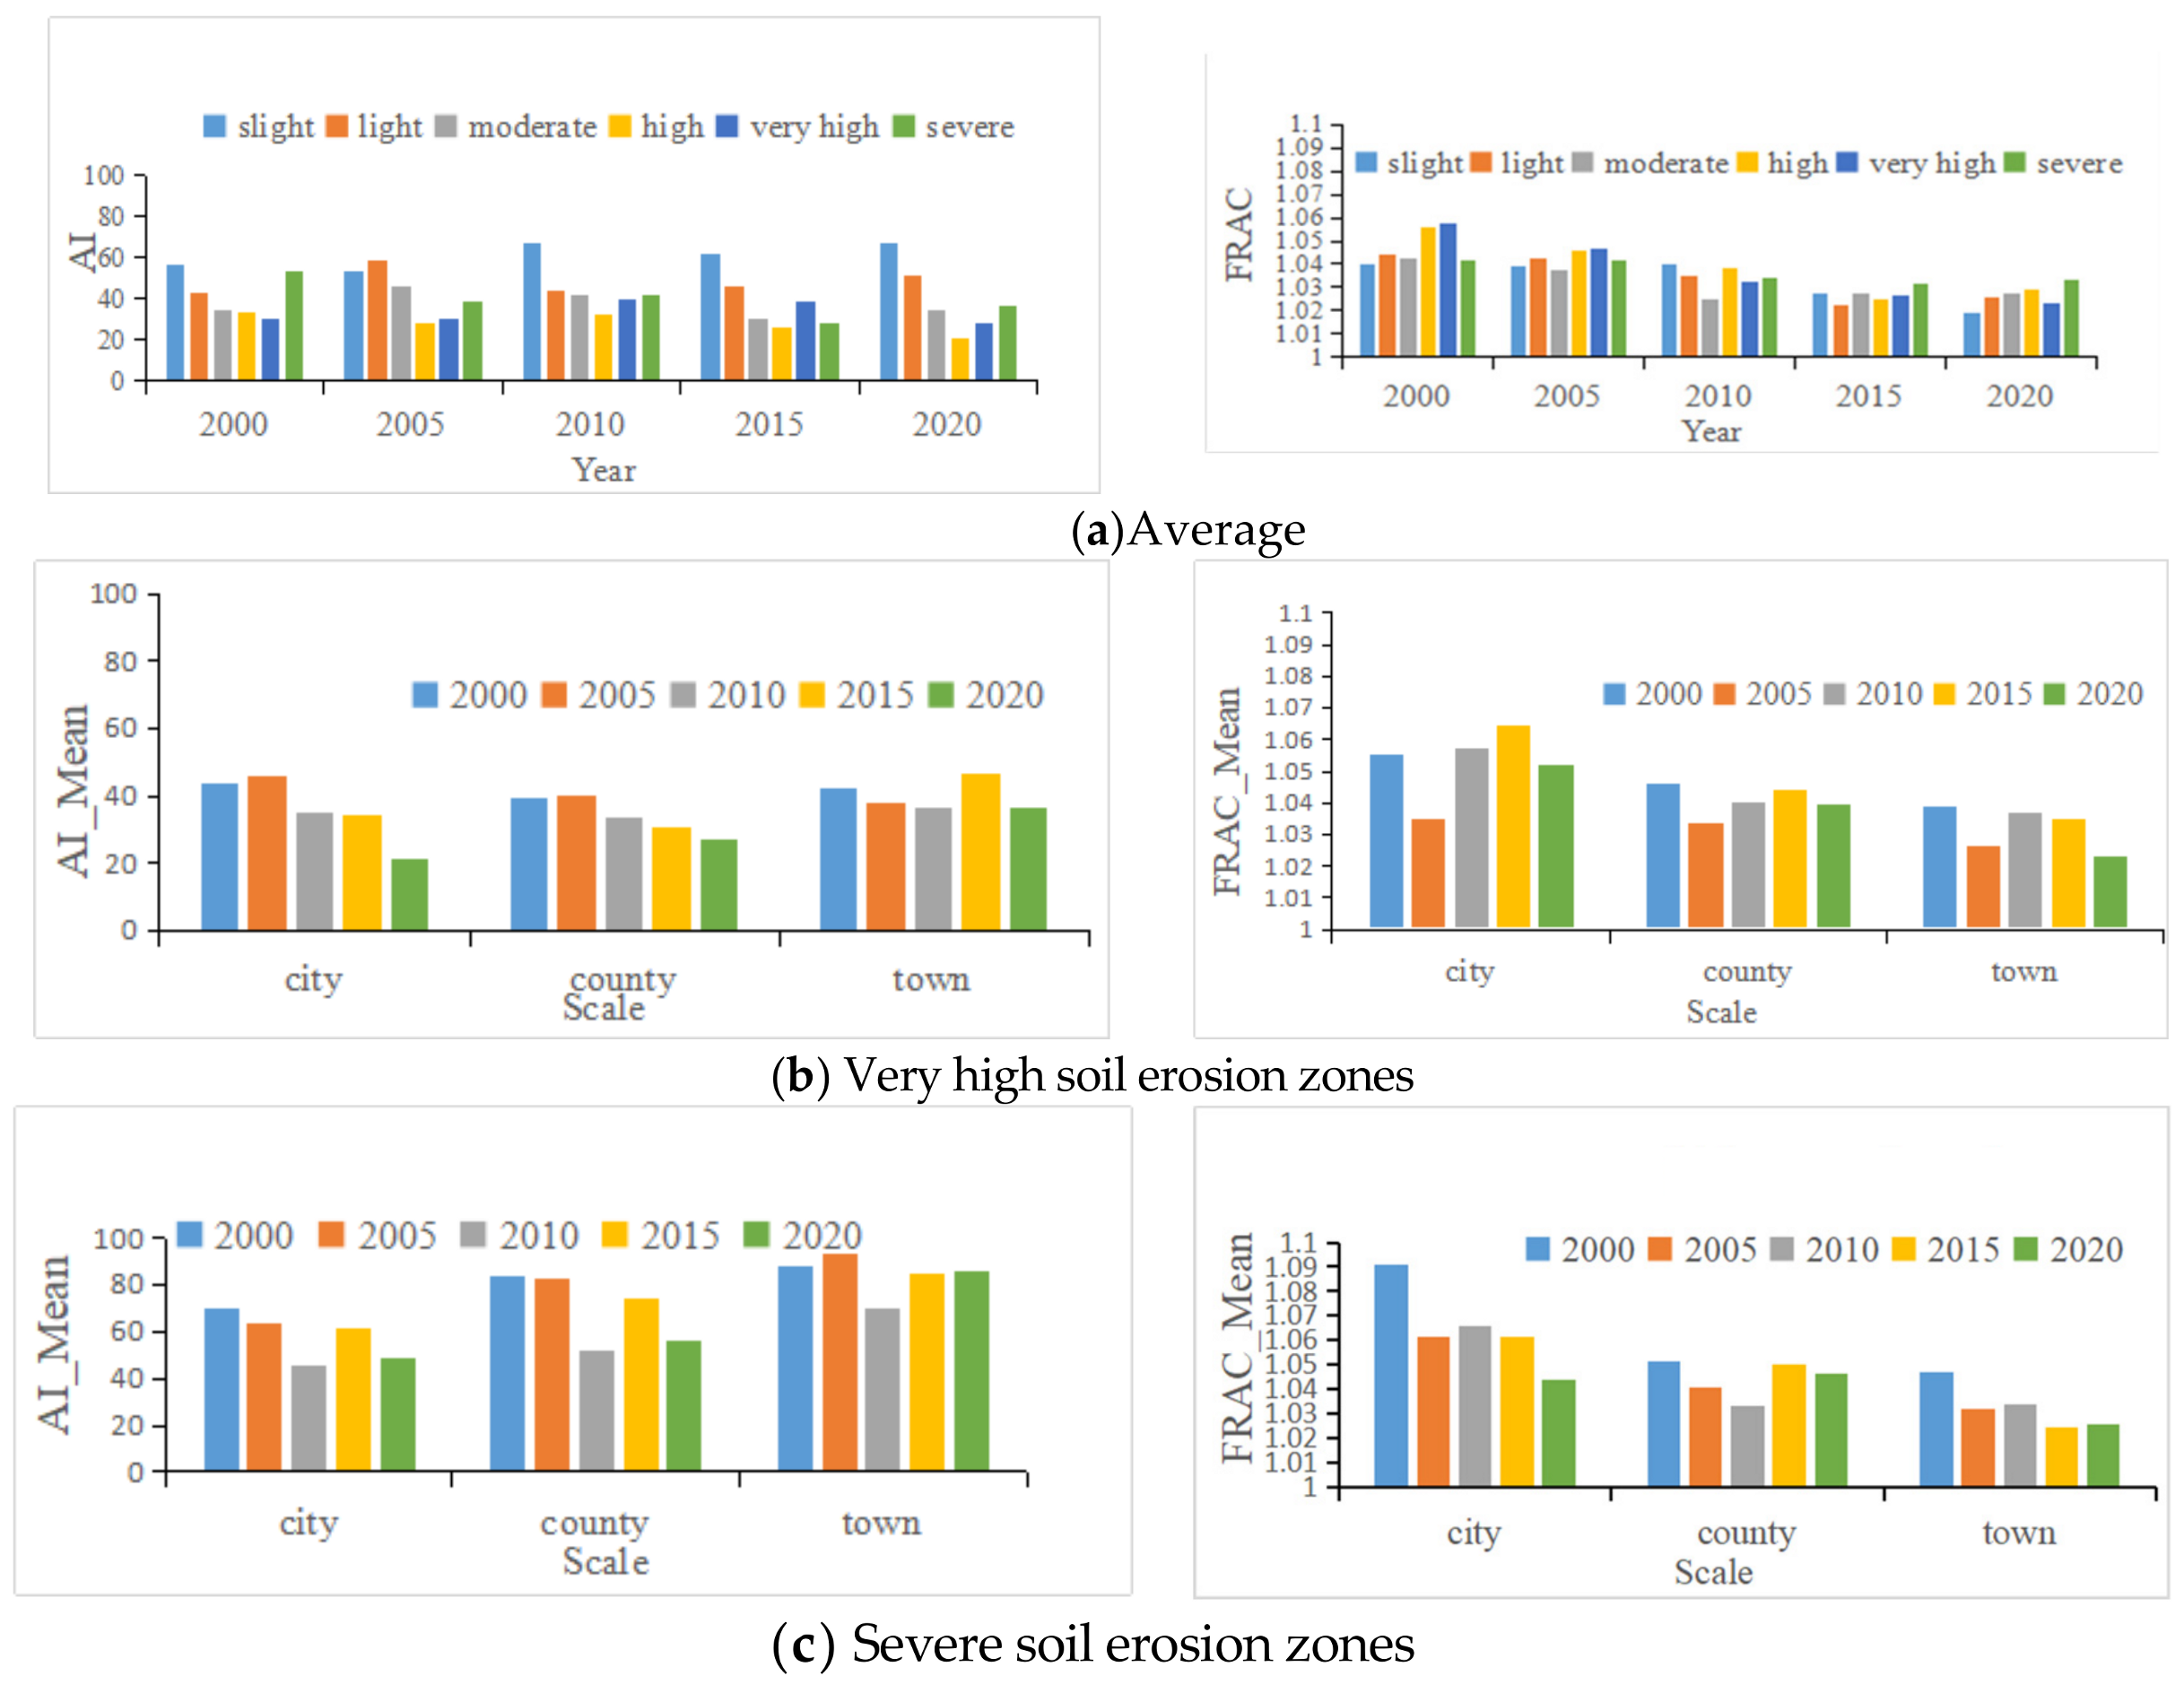
4.2. Landscape Pattern Analysis of Land at Different Soil Erosion Levels
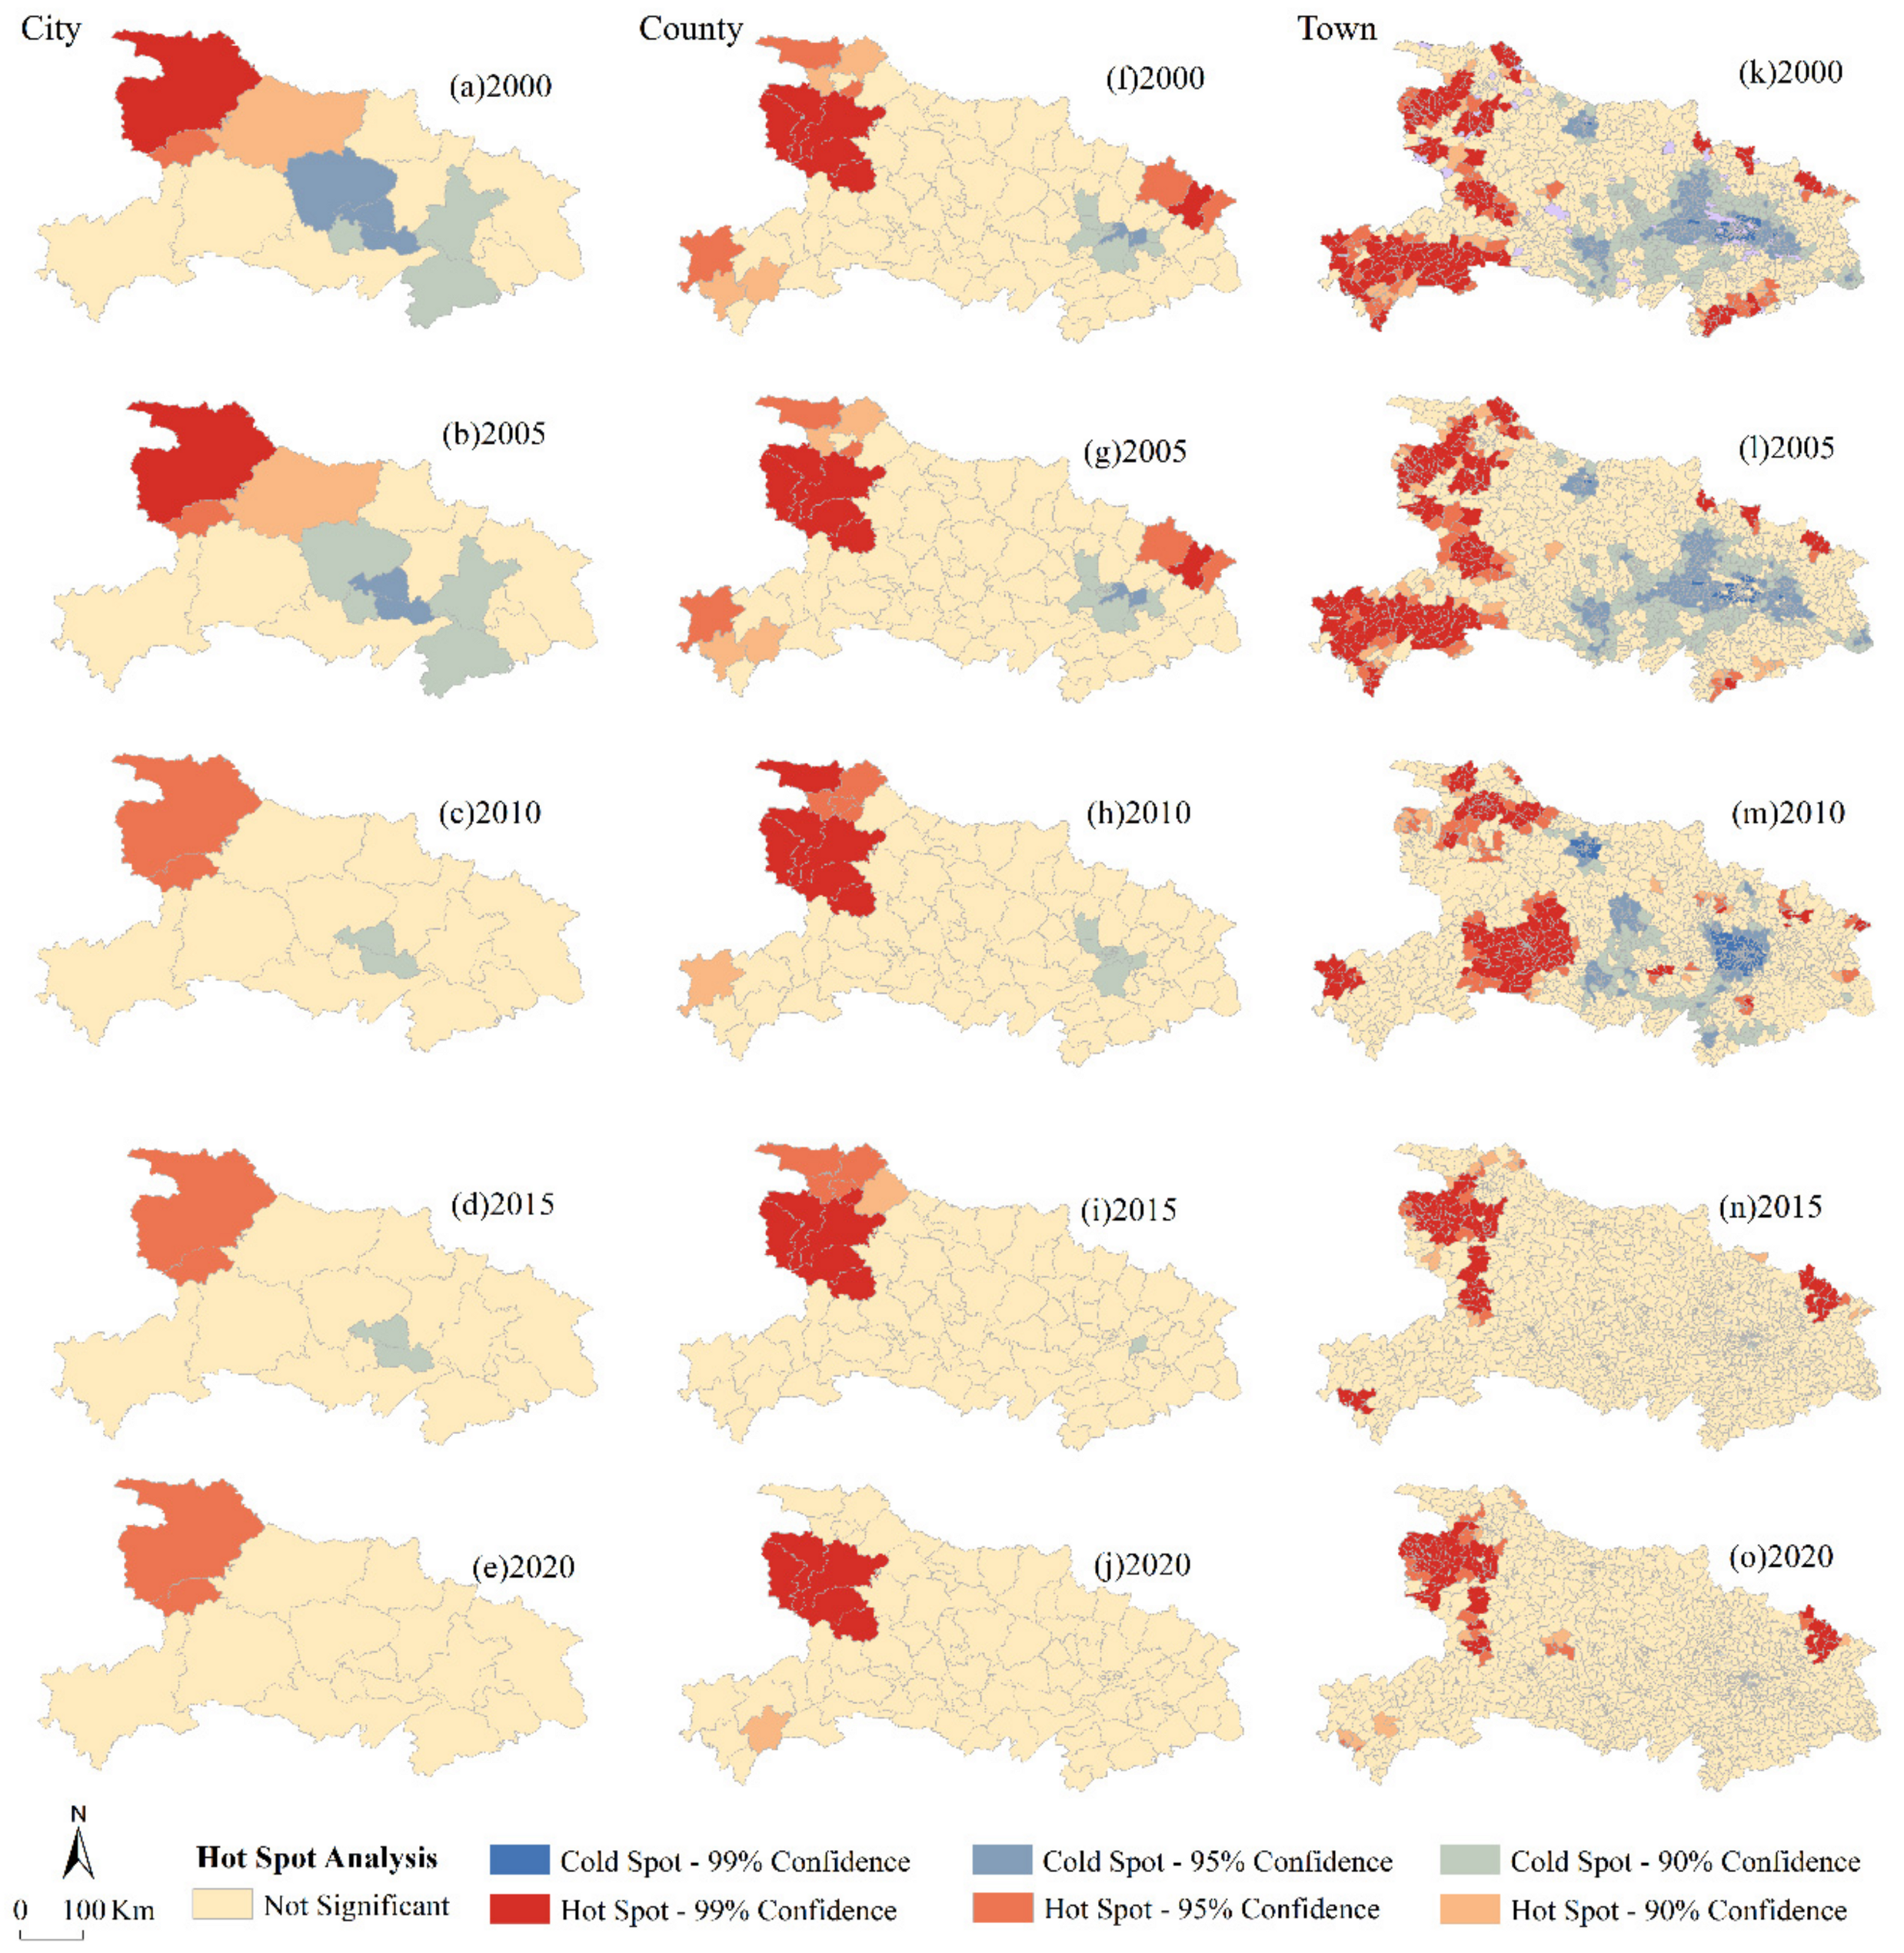
4.3. Hotspot Analysis of Soil Erosion
5. Discussion
5.1. Comparison with Existing Studies
5.2. Methodological Limitations
6. Conclusions
Author Contributions
Funding
Institutional Review Board Statement
Informed Consent Statement
Data Availability Statement
Conflicts of Interest
Appendix A. Rainfall Erosivity Factor (R)
Appendix B. Soil Erodibility Factor (K)
Appendix C. Length-Slope Factor (LS)
Appendix D. Vegetation and Biological Practice Factor (B)

| FVC | Forestland | Grassland | Arable Land | Water Bodies | Built-Up Area |
|---|---|---|---|---|---|
| 0–20% | 0.1 | 0.45 | 0.23 | 1.0 | 0.9 |
| 20–40% | 0.08 | 0.24 | |||
| 40–60% | 0.06 | 0.15 | |||
| 60–80% | 0.02 | 0.09 | |||
| 80–100% | 0.004 | 0.043 |
Appendix E. Engineering Practices (P)
| Forestland | Grassland | Arable Land | Water Bodies | Built-Up Area | |
|---|---|---|---|---|---|
| P factor | 1 | 1 | 0.4 | 0 | 0 |
Appendix F. Tillage Practice (T)
| Slope | 0–5° | 5–10° | 10–15° | 15–20° | 20–25° | >25° |
| T Value | 0.100 | 0.221 | 0.305 | 0.575 | 0.735 | 0.800 |
References
- Borrelli, P.; Robinson, D.A.; Fleischer, L.R.; Lugato, E.; Ballabio, C.; Alewell, C.; Meusburger, K.; Modugno, S.; Schuett, B.; Ferro, V.; et al. An Assessment of the Global Impact of 21st Century Land Use Change on Soil Erosion. Nat. Commun. 2017, 8, 2013. [Google Scholar] [CrossRef] [PubMed] [Green Version]
- State Council of China. National Soil and Water Conservation Plan (2015–2030); State Council of China: Beijing, China, 2015.
- Asmamaw, L.B.; Mohammed, A.A. Identification of Soil Erosion Hotspot Areas for Sustainable Land Management in the Gerado Catchment, North-Eastern Ethiopia. Remote Sens. Appl.-Soc. Environ. 2019, 13, 306–317. [Google Scholar] [CrossRef]
- Wang, Z.; HU, C. Strategies for Managing Reservoir Sedimentation. Int. J. Sediment Res. 2009, 24, 369–384. [Google Scholar] [CrossRef]
- AbdelRahman, M.A.E.; Natarajan, A.; Hegde, R.; Prakash, S.S. Assessment of Land Degradation Using Comprehensive Geostatistical Approach and Remote Sensing Data in GIS-Model Builder. Egypt. J. Remote Sens. Space Sci. 2019, 22, 323–334. [Google Scholar] [CrossRef]
- Hateffard, F.; Mohammed, S.; Alsafadi, K.; Enaruvbe, G.O.; Heidari, A.; Abdo, H.G.; Rodrigo-Comino, J. CMIP5 Climate Projections and RUSLE-Based Soil Erosion Assessment in the Central Part of Iran. Sci. Rep. 2021, 11, 7273. [Google Scholar] [CrossRef] [PubMed]
- Stefanidis, S.; Alexandridis, V.; Chatzichristaki, C.; Stefanidis, P. Assessing Soil Loss by Water Erosion in a Typical Mediterranean Ecosystem of Northern Greece under Current and Future Rainfall Erosivity. Water 2021, 13, 2002. [Google Scholar] [CrossRef]
- Houet, T.; Loveland, T.R.; Hubert-Moy, L.; Gaucherel, C.; Napton, D.; Barnes, C.A.; Sayler, K. Exploring Subtle Land Use and Land Cover Changes: A Framework for Future Landscape Studies. Landsc. Ecol. 2010, 25, 249–266. [Google Scholar] [CrossRef] [Green Version]
- Mohammed, S.; Abdo, H.G.; Szabo, S.; Pham, Q.B.; Holb, I.J.; Linh, N.T.; Anh, D.T.; Alsafadi, K.; Mokhtar, A.; Kbibo, I.; et al. Estimating Human Impacts on Soil Erosion Considering Different Hillslope Inclinations and Land Uses in the Coastal Region of Syria. Water 2020, 12, 2786. [Google Scholar] [CrossRef]
- Qi, Y.; Lian, X.; Wang, H.; Zhang, J.; Yang, R. Dynamic Mechanism between Human Activities and Ecosystem Services: A Case Study of Qinghai Lake Watershed, China. Ecol. Indic. 2020, 117, 106528. [Google Scholar] [CrossRef]
- Stefanidis, S.; Chatzichristaki, C.; Stefanidis, P. An Arcgis Toolbox for Estimation and Mapping Soil Erosion. J. Environ. Prot. Ecol. 2021, 22, 689–696. [Google Scholar]
- Alewell, C.; Borrelli, P.; Meusburger, K.; Panagos, P. Using the USLE: Chances, Challenges and Limitations of Soil Erosion Modelling. Int. Soil Water Conserv. Res. 2019, 7, 203–225. [Google Scholar] [CrossRef]
- Borrelli, P.; Alewell, C.; Alvarez, P.; Ayach Anache, J.A.; Baartman, J.; Ballabio, C.; Bezak, N.; Biddoccu, M.; Cerda, A.; Chalise, D.; et al. Soil Erosion Modelling: A Global Review and Statistical Analysis. Sci. Total Environ. 2021, 780, 146494. [Google Scholar] [CrossRef]
- Brini, I.; Alexakis, D.D.; Kalaitzidis, C. Linking Soil Erosion Modeling to Landscape Patterns and Geomorphometry: An Application in Crete, Greece. Appl. Sci. 2021, 11, 5684. [Google Scholar] [CrossRef]
- Bezak, N.; Borrelli, P.; Panagos, P. A First Assessment of Rainfall Erosivity Synchrony Scale at Pan-European Scale. Catena 2021, 198, 105060. [Google Scholar] [CrossRef]
- Corbane, C.; Raclot, D.; Jacob, F.; Albergel, J.; Andrieux, P. Remote Sensing of Soil Surface Characteristics from a Multiscale Classification Approach. Catena 2008, 75, 308–318. [Google Scholar] [CrossRef]
- Modica, G.; Praticò, S.; Laudari, L.; Ledda, A.; Di Fazio, S.; De Montis, A. Implementation of Multispecies Ecological Networks at the Regional Scale: Analysis and Multi-Temporal Assessment. J. Environ. Manag. 2021, 289, 112494. [Google Scholar] [CrossRef]
- Inoubli, N.; Raclot, D.; Mekki, I.; Moussa, R.; Le Bissonnais, Y. A Spatiotemporal Multiscale Analysis of Runoff and Erosion in a Mediterranean Marly Catchment. Vadose Zone J. 2017, 16. [Google Scholar] [CrossRef] [Green Version]
- Yu, D.; Qiao, J.; Shi, P. Spatiotemporal Patterns, Relationships, and Drivers of China’s Agricultural Ecosystem Services from 1980 to 2010: A Multiscale Analysis. Landsc. Ecol. 2018, 33, 575–595. [Google Scholar] [CrossRef]
- Zhu, D.; Xiong, K.; Xiao, H. Multi-Time Scale Variability of Rainfall Erosivity and Erosivity Density in the Karst Region of Southern China, 1960–2017. Catena 2021, 197, 104977. [Google Scholar] [CrossRef]
- Staentzel, C.; Beisel, J.-N.; Gallet, S.; Hardion, L.; Barillier, A.; Combroux, I. A Multiscale Assessment Protocol to Quantify Effects of Restoration Works on Alluvial Vegetation Communities. Ecol. Indic. 2018, 90, 643–652. [Google Scholar] [CrossRef]
- Schroter, M.; Remme, R.P. Spatial Prioritisation for Conserving Ecosystem Services: Comparing Hotspots with Heuristic Optimisation. Landsc. Ecol. 2016, 31, 431–450. [Google Scholar] [CrossRef] [Green Version]
- Yingjie, L.; Liwei, Z.; Junping, Y.; Pengtao, W.; Ningke, H.; Wei, C.; Bojie, F. Mapping the Hotspots and Coldspots of Ecosystem Services in Conservation Priority Setting. J. Geogr. Sci. 2017, 27, 681–696. [Google Scholar] [CrossRef]
- Department of Water Resources in Hubei Province. Hubei Soil and Water Conservation Bulletin; Department of Water Resources in Hubei Province: Wuhan, China, 2019. [Google Scholar]
- Scientific Data. Available online: https://www.nature.com/sdata/ (accessed on 10 October 2021).
- Harmonized World Soil Database v1.2. Available online: http://www.fao.org/soils-portal/data-hub/soil-maps-and-databases/harmonized-world-soil-database-v12/en/ (accessed on 10 October 2021).
- Resources and Environmental Science Data Center. Available online: https://www.resdc.cn (accessed on 10 October 2021).
- Meteorological Data Center of China Meteorological Administration. 2021. Available online: http://data.cma.cn/ (accessed on 10 October 2021).
- The Shuttle Radar Topography Mission. Available online: http://srtm.csi.cgiar.org/ (accessed on 10 October 2021).
- Jun, W.; Lina, Z.; Wenwu, Z.; Lingxiao, Y. The Influence of Rainfall and Land Use Patterns on Soil Erosion in Multi-Scale Watersheds: A Case Study in the Hilly and Gully Area on the Loess Plateau, China. J. Geogr. Sci. 2018, 28, 1415–1426. [Google Scholar] [CrossRef] [Green Version]
- Wang, J.-F.; Zhang, T.-L.; Fu, B.-J. A Measure of Spatial Stratified Heterogeneity. Ecol. Indic. 2016, 67, 250–256. [Google Scholar] [CrossRef]
- Wang, J.-F.; Li, X.-H.; Christakos, G.; Liao, Y.-L.; Zhang, T.; Gu, X.; Zheng, X.-Y. Geographical Detectors-Based Health Risk Assessment and Its Application in the Neural Tube Defects Study of the Heshun Region, China. Int. J. Geogr. Inf. Sci. 2010, 24, 107–127. [Google Scholar] [CrossRef]
- He, H.S.; DeZonia, B.E.; Mladenoff, D.J. An Aggregation Index (AI) to Quantify Spatial Patterns of Landscapes. Landsc. Ecol. 2000, 15, 591–601. [Google Scholar] [CrossRef]
- Feng, Y.; Liu, Y. Fractal Dimension as an Indicator for Quantifying the Effects of Changing Spatial Scales on Landscape Metrics. Ecol. Indic. 2015, 53, 18–27. [Google Scholar] [CrossRef]
- Hubei Forestry Bureau. Hubei Has Returned More than 20 Million Mu of Farmland to Forests in 20 Years; Hubei Forestry Bureau: Wuhan, China, 2019.
- Zhang, X.; Deng, Y.; Hou, M.; Yao, S. Response of Land Use Change to the Grain for Green Program and Its Driving Forces in the Loess Hilly-Gully Region. Land 2021, 10, 194. [Google Scholar] [CrossRef]
- Zhao, A.; Zhang, A.; Liu, J.; Feng, L.; Zhao, Y. Assessing the Effects of Drought and “Grain for Green” Program on Vegetation Dynamics in China’s Loess Plateau from 2000 to 2014. Catena 2019, 175, 446–455. [Google Scholar] [CrossRef]
- Morgan, R.P.; Rickson, R.J. Slope Stabilization and Erosion Control: A Bioengineering Approach; Taylor & Francis: Abingdon, UK, 2011. [Google Scholar] [CrossRef]
- Zeng, S. Soil erosion characteristics and its prevention in Hubei Province. Soil Water Conserv. 1981, 1, 4–8. [Google Scholar] [CrossRef]
- Wang, X.; Zhao, X.; Zhang, Z.; Yi, L.; Zuo, L.; Wen, Q.; Liu, F.; Xu, J.; Hu, S.; Liu, B. Assessment of Soil Erosion Change and Its Relationships with Land Use/Cover Change in China from the End of the 1980s to 2010. Catena 2016, 137, 256–268. [Google Scholar] [CrossRef]
- Wang, H.; Liu, L.; Yin, L.; Shen, J.; Li, S. Exploring the Complex Relationships and Drivers of Ecosystem Services across Different Geomorphological Types in the Beijing-Tianjin-Hebei Region, China (2000–2018). Ecol. Indic. 2021, 121, 107116. [Google Scholar] [CrossRef]
- Gao, J.; Wang, H.; Zuo, L. Spatial Gradient and Quantitative Attribution of Karst Soil Erosion in Southwest China. Environ. Monit. Assess. 2018, 190, 730. [Google Scholar] [CrossRef] [PubMed]
- Huan, W.; Jiangbo, G.; Wenjuan, H. Quantitative Attribution Analysis of Soil Erosion in Different Geomorphological Types in Karst Areas: Based on the Geodetector Method. J. Geogr. Sci. 2019, 29, 271–286. [Google Scholar] [CrossRef] [Green Version]
- Terranova, O.G.; Bodini, A.; Coscarelli, R.; Gariano, S.L.; Iaquinta, P. Estimation of Annual Rainfall Erosivity in Calabria through Regional Frequency Analysis. Ital. J. Agrometeorol.-Riv. Ital. Agrometeorol. 2013, 18, 13–24. [Google Scholar]
- Nearing, M.A.; Yin, S.; Borrelli, P.; Polyakov, V.O. Rainfall Erosivity: An Historical Review. Catena 2017, 157, 357–362. [Google Scholar] [CrossRef]
- Wu, L.; Yen, H.; Ma, X. Effects of Particulate Fractions on Critical Slope and Critical Rainfall Intensity for Runoff Phosphorus from Bare Loessial Soil. Catena 2021, 196, 104935. [Google Scholar] [CrossRef]
- Wang, Y.; Tan, S.; Liu, B.; Yang, Y. Estimating Rainfall Erosivity by Incorporating Seasonal Variations in Parameters into the Richardson Model. J. Geogr. Sci. 2017, 27, 275–296. [Google Scholar] [CrossRef] [Green Version]
- Sun, C.; Hou, H.; Chen, W. Effects of Vegetation Cover and Slope on Soil Erosion in the Eastern Chinese Loess Plateau under Different Rainfall Regimes. PeerJ 2021, 9, e11226. [Google Scholar] [CrossRef]
- Jin, F.; Yang, W.; Fu, J.; Li, Z. Effects of Vegetation and Climate on the Changes of Soil Erosion in the Loess Plateau of China. Sci. Total Environ. 2021, 773, 145514. [Google Scholar] [CrossRef]
- Ran, L.; Lu, X.; Xu, J. Effects of Vegetation Restoration on Soil Conservation and Sediment Loads in China: A Critical Review. Crit. Rev. Environ. Sci. Technol. 2013, 43, 1384–1415. [Google Scholar] [CrossRef]
- Liu, B.; Xie, Y.; Li, Z.; Liang, Y.; Zhang, W.; Fu, S.; Yin, S.; Wei, X.; Zhang, K.; Wang, Z.; et al. The Assessment of Soil Loss by Water Erosion in China. Soil Eros. Assess. 2020, 8, 430–439. [Google Scholar] [CrossRef]
- Williams, J.R.; Arnold, J.G. A System of Erosion—Sediment Yield Models. Soil Technol. 1997, 11, 43–55. [Google Scholar] [CrossRef]
- McCool, K.D.; C. Brown, L.; R. Foster, G.; K. Mutchler, C.; D. Meyer, L. Revised Slope Steepness Factor for the Universal Soil Loss Equation. Trans. ASAE 1987, 30, 1387–1396. [Google Scholar] [CrossRef]
- Liu, Y.B.; A. Nearing, M.; M. Risse, L. Slope Gradient Effects on Soil Loss for Steep Slopes. Trans. ASAE 1994, 37, 1835–1840. [Google Scholar] [CrossRef]
- Wang, X.; Yang, Q. Effects of Land Use Change on Soil Erosion in Mesoscale Watershed: A Case Study at Gushanchuan Watershed. Bull. Soil Water Conserv. 2016, 36, 1–8. [Google Scholar] [CrossRef]
- Li, M.; Wu, B.; Yan, C.; Zhou, W. Estimation of Vegetation Fraction in Upper Basin of Miyun Reservoir by Remote Sensing. Resour. Sci. 2004, 26, 153–159. [Google Scholar]
- Xu, L.; Xu, X.; Meng, X. Risk Assessment of Soil Erosion in Different Rainfall Scenarios by RUSLE Model Coupled with Information Diffusion Model: A Case Study of Bohai Rim, China. Catena 2013, 100, 74–82. [Google Scholar] [CrossRef]


| Data Name | Data Source | Time | Units/Resolution |
|---|---|---|---|
| Depth to bedrock map of China | Scientific data [25] | 2018 | 100 m × 100 m |
| Soil types | Harmonized World Soil Database (HWSD) [26] | 2012 | 1:1,000,000 |
| Land-use/land cover data | Resource and Environment Science and Data Center [27] | 2000; 2005; 2010; 2015; 2020 | 30 m × 30 m |
| Normalized difference vegetation index (NDVI) | 1000 m × 1000 m | ||
| Meteorological data | Meteorological Data Center of China Meteorological Administration [28] | 2000–2020 | Daily |
| Digital elevation model (DEM) | Shuttle Radar Topography Mission (SRTM) [29] | 2008 | 30 m × 30 m |
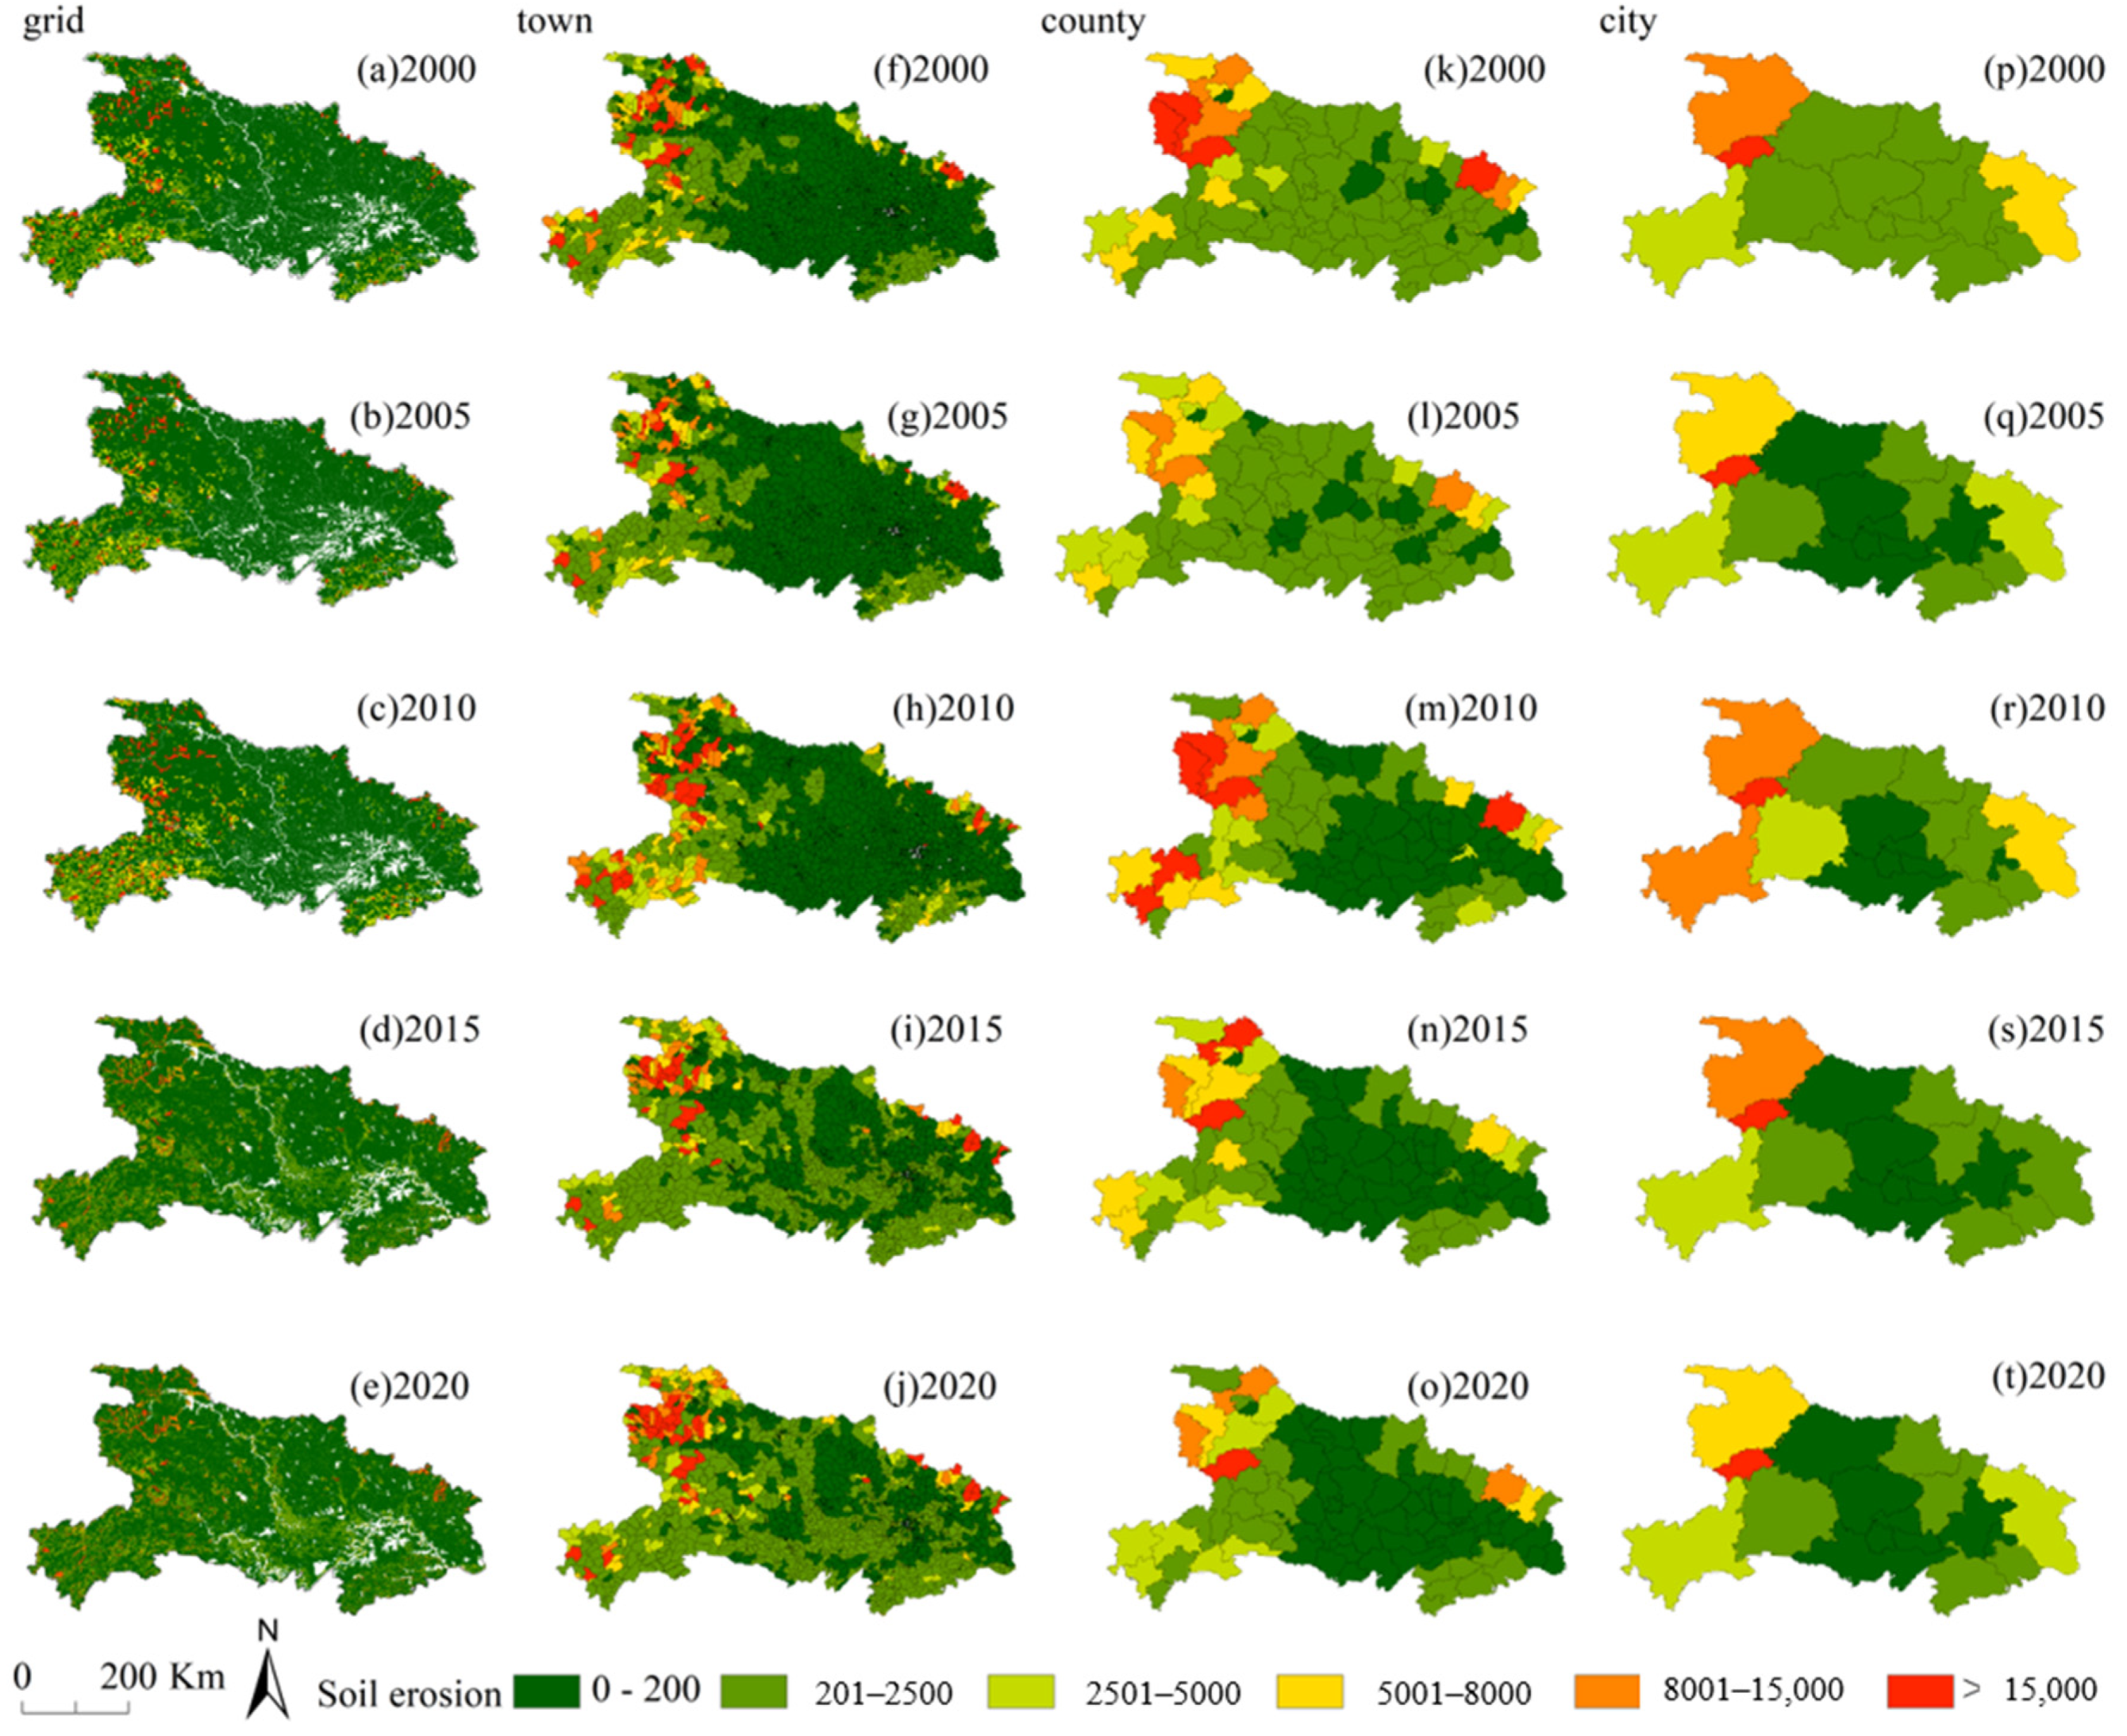
| Soil Erosion Level | Slight | Light | Moderate | High | Very High | Severe |
|---|---|---|---|---|---|---|
| Soil erosion rate (t·ha−1·yr−1) | <200 | 200–2500 | 2500–5000 | 5000–8000 | 8000–15,000 | >15,000 |
Publisher’s Note: MDPI stays neutral with regard to jurisdictional claims in published maps and institutional affiliations. |
© 2021 by the authors. Licensee MDPI, Basel, Switzerland. This article is an open access article distributed under the terms and conditions of the Creative Commons Attribution (CC BY) license (https://creativecommons.org/licenses/by/4.0/).
Share and Cite
Li, Q.; Zhou, Y.; Wang, L.; Zuo, Q.; Yi, S.; Liu, J.; Su, X.; Xu, T.; Jiang, Y. The Link between Landscape Characteristics and Soil Losses Rates over a Range of Spatiotemporal Scales: Hubei Province, China. Int. J. Environ. Res. Public Health 2021, 18, 11044. https://doi.org/10.3390/ijerph182111044
Li Q, Zhou Y, Wang L, Zuo Q, Yi S, Liu J, Su X, Xu T, Jiang Y. The Link between Landscape Characteristics and Soil Losses Rates over a Range of Spatiotemporal Scales: Hubei Province, China. International Journal of Environmental Research and Public Health. 2021; 18(21):11044. https://doi.org/10.3390/ijerph182111044
Chicago/Turabian StyleLi, Qing, Yong Zhou, Li Wang, Qian Zuo, Siqi Yi, Jingyi Liu, Xueping Su, Tao Xu, and Yan Jiang. 2021. "The Link between Landscape Characteristics and Soil Losses Rates over a Range of Spatiotemporal Scales: Hubei Province, China" International Journal of Environmental Research and Public Health 18, no. 21: 11044. https://doi.org/10.3390/ijerph182111044
APA StyleLi, Q., Zhou, Y., Wang, L., Zuo, Q., Yi, S., Liu, J., Su, X., Xu, T., & Jiang, Y. (2021). The Link between Landscape Characteristics and Soil Losses Rates over a Range of Spatiotemporal Scales: Hubei Province, China. International Journal of Environmental Research and Public Health, 18(21), 11044. https://doi.org/10.3390/ijerph182111044