
Using Social Media Data to Evaluate Urban Parks Use during the COVID-19 Pandemic

 ,
, 

Abstract
:1. Introduction
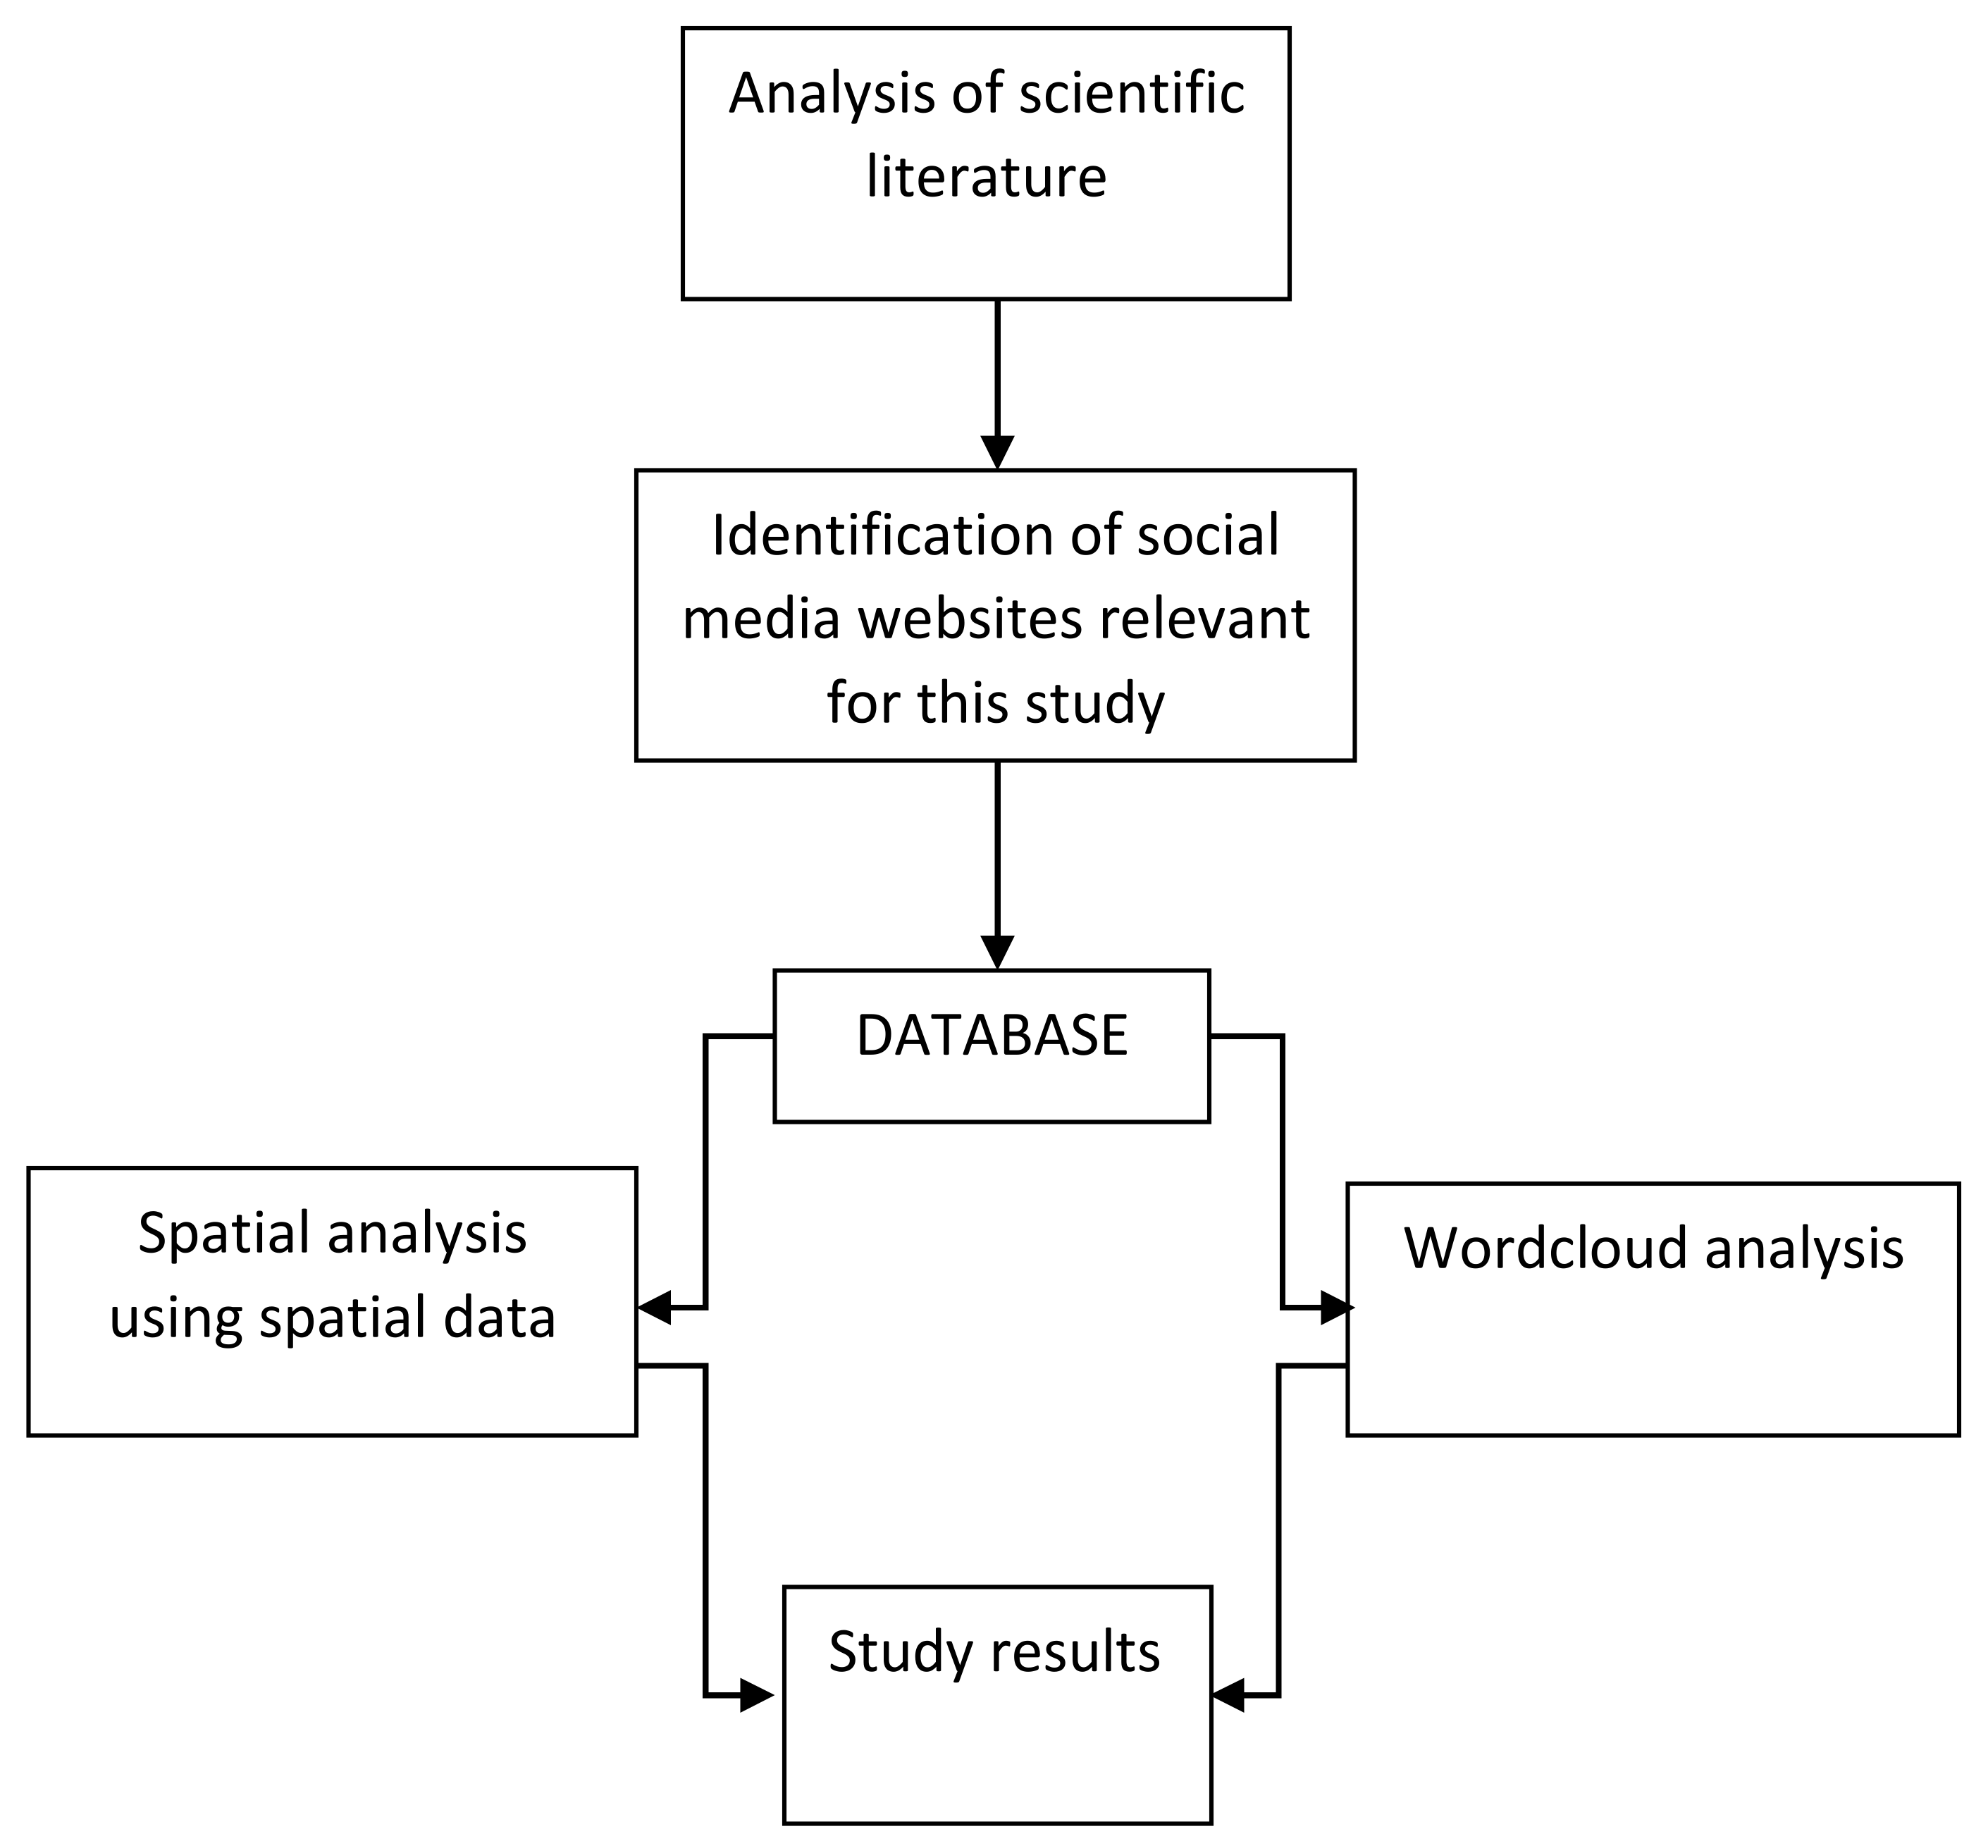
2. Materials and Methods
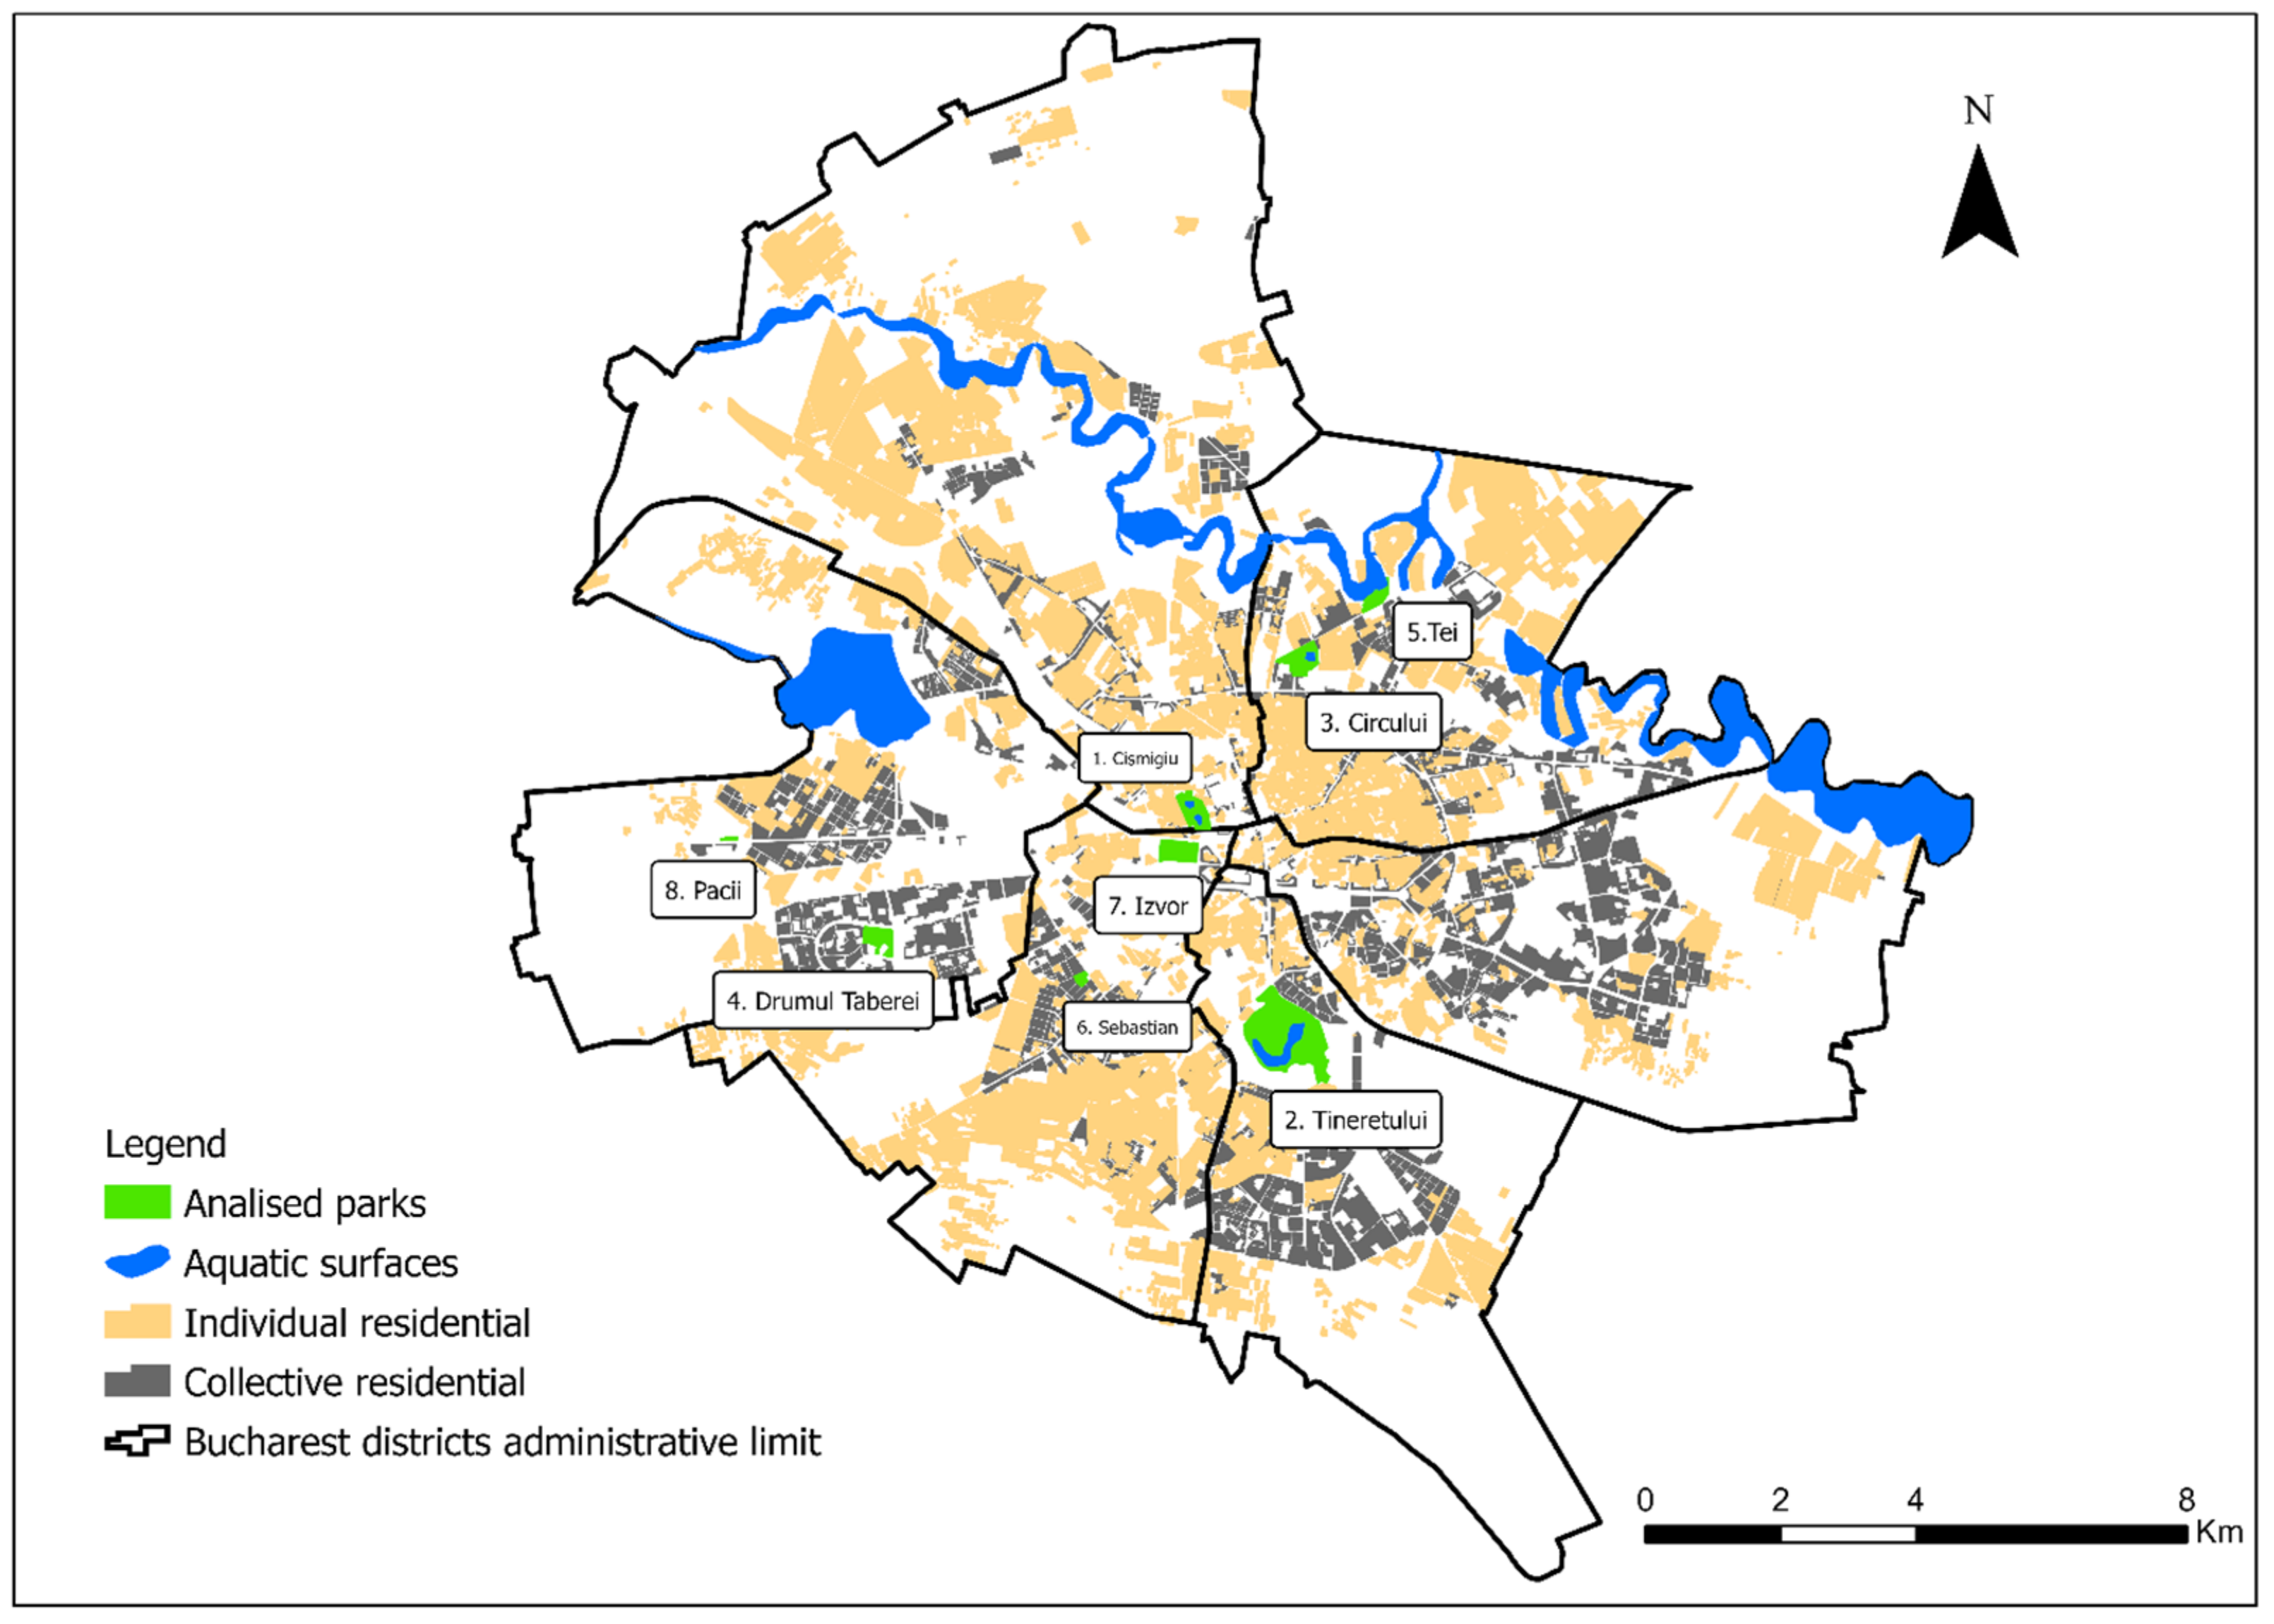
2.1. Study Area
2.2. Study Design
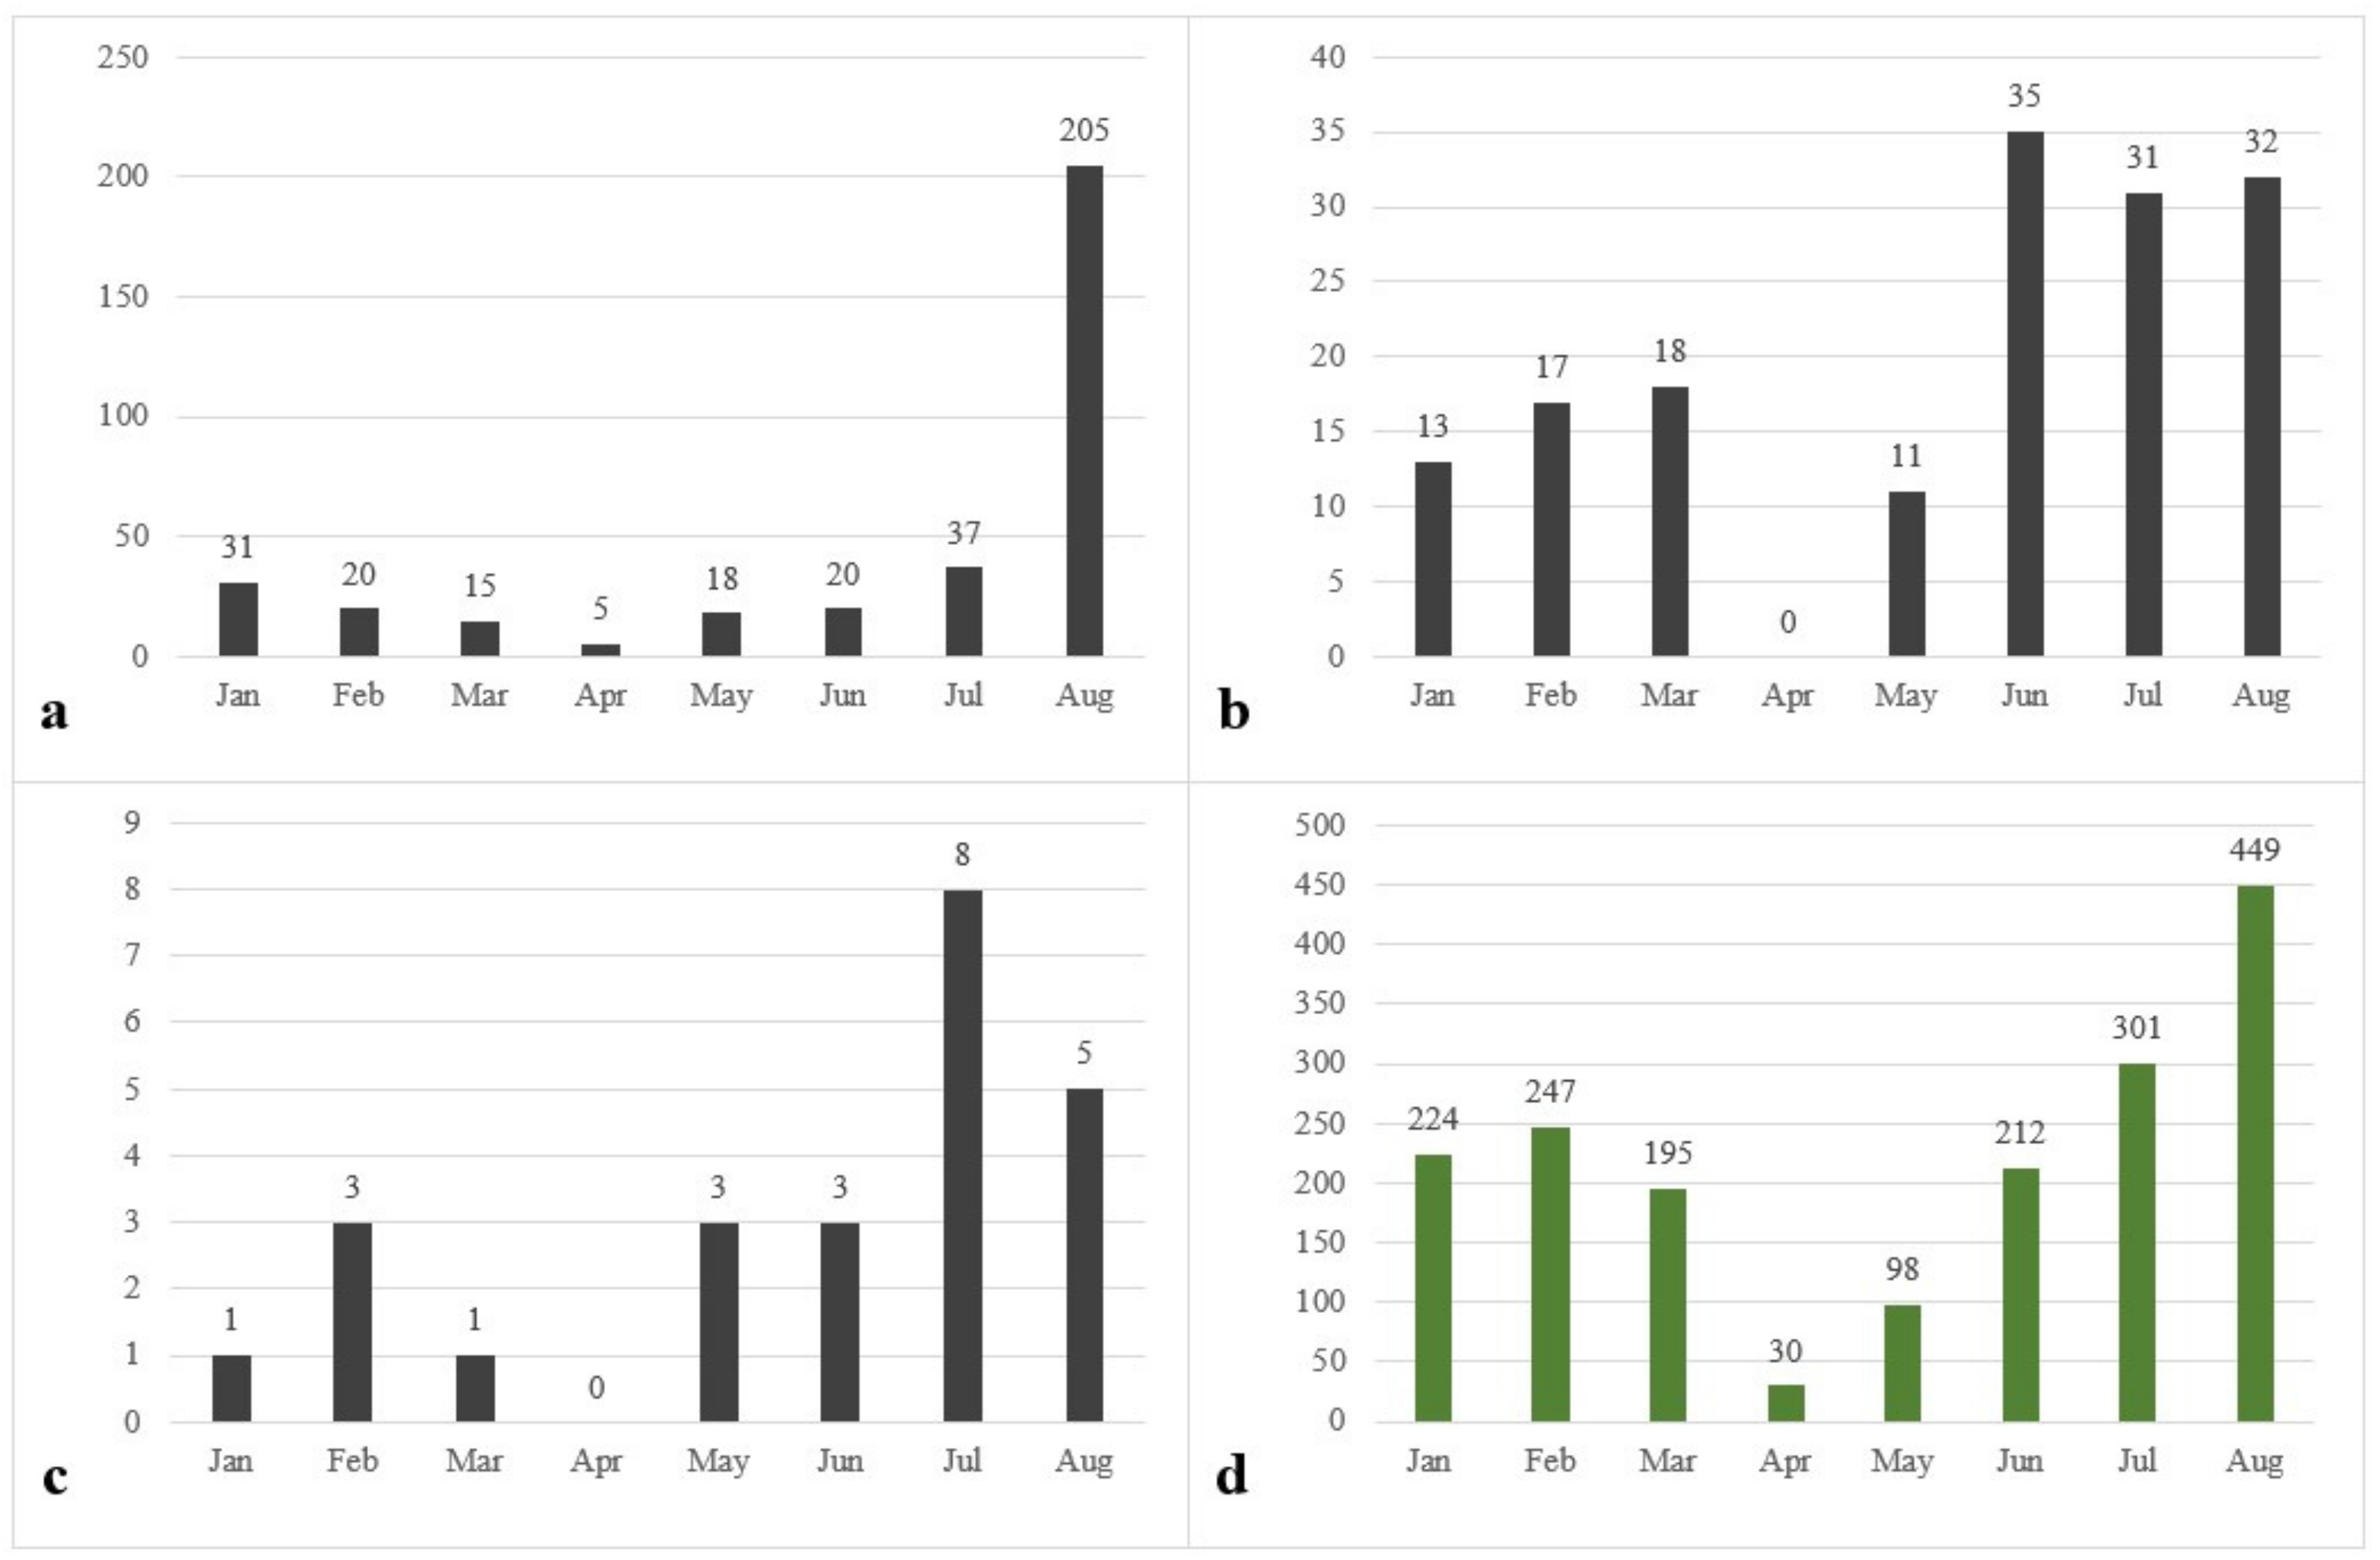
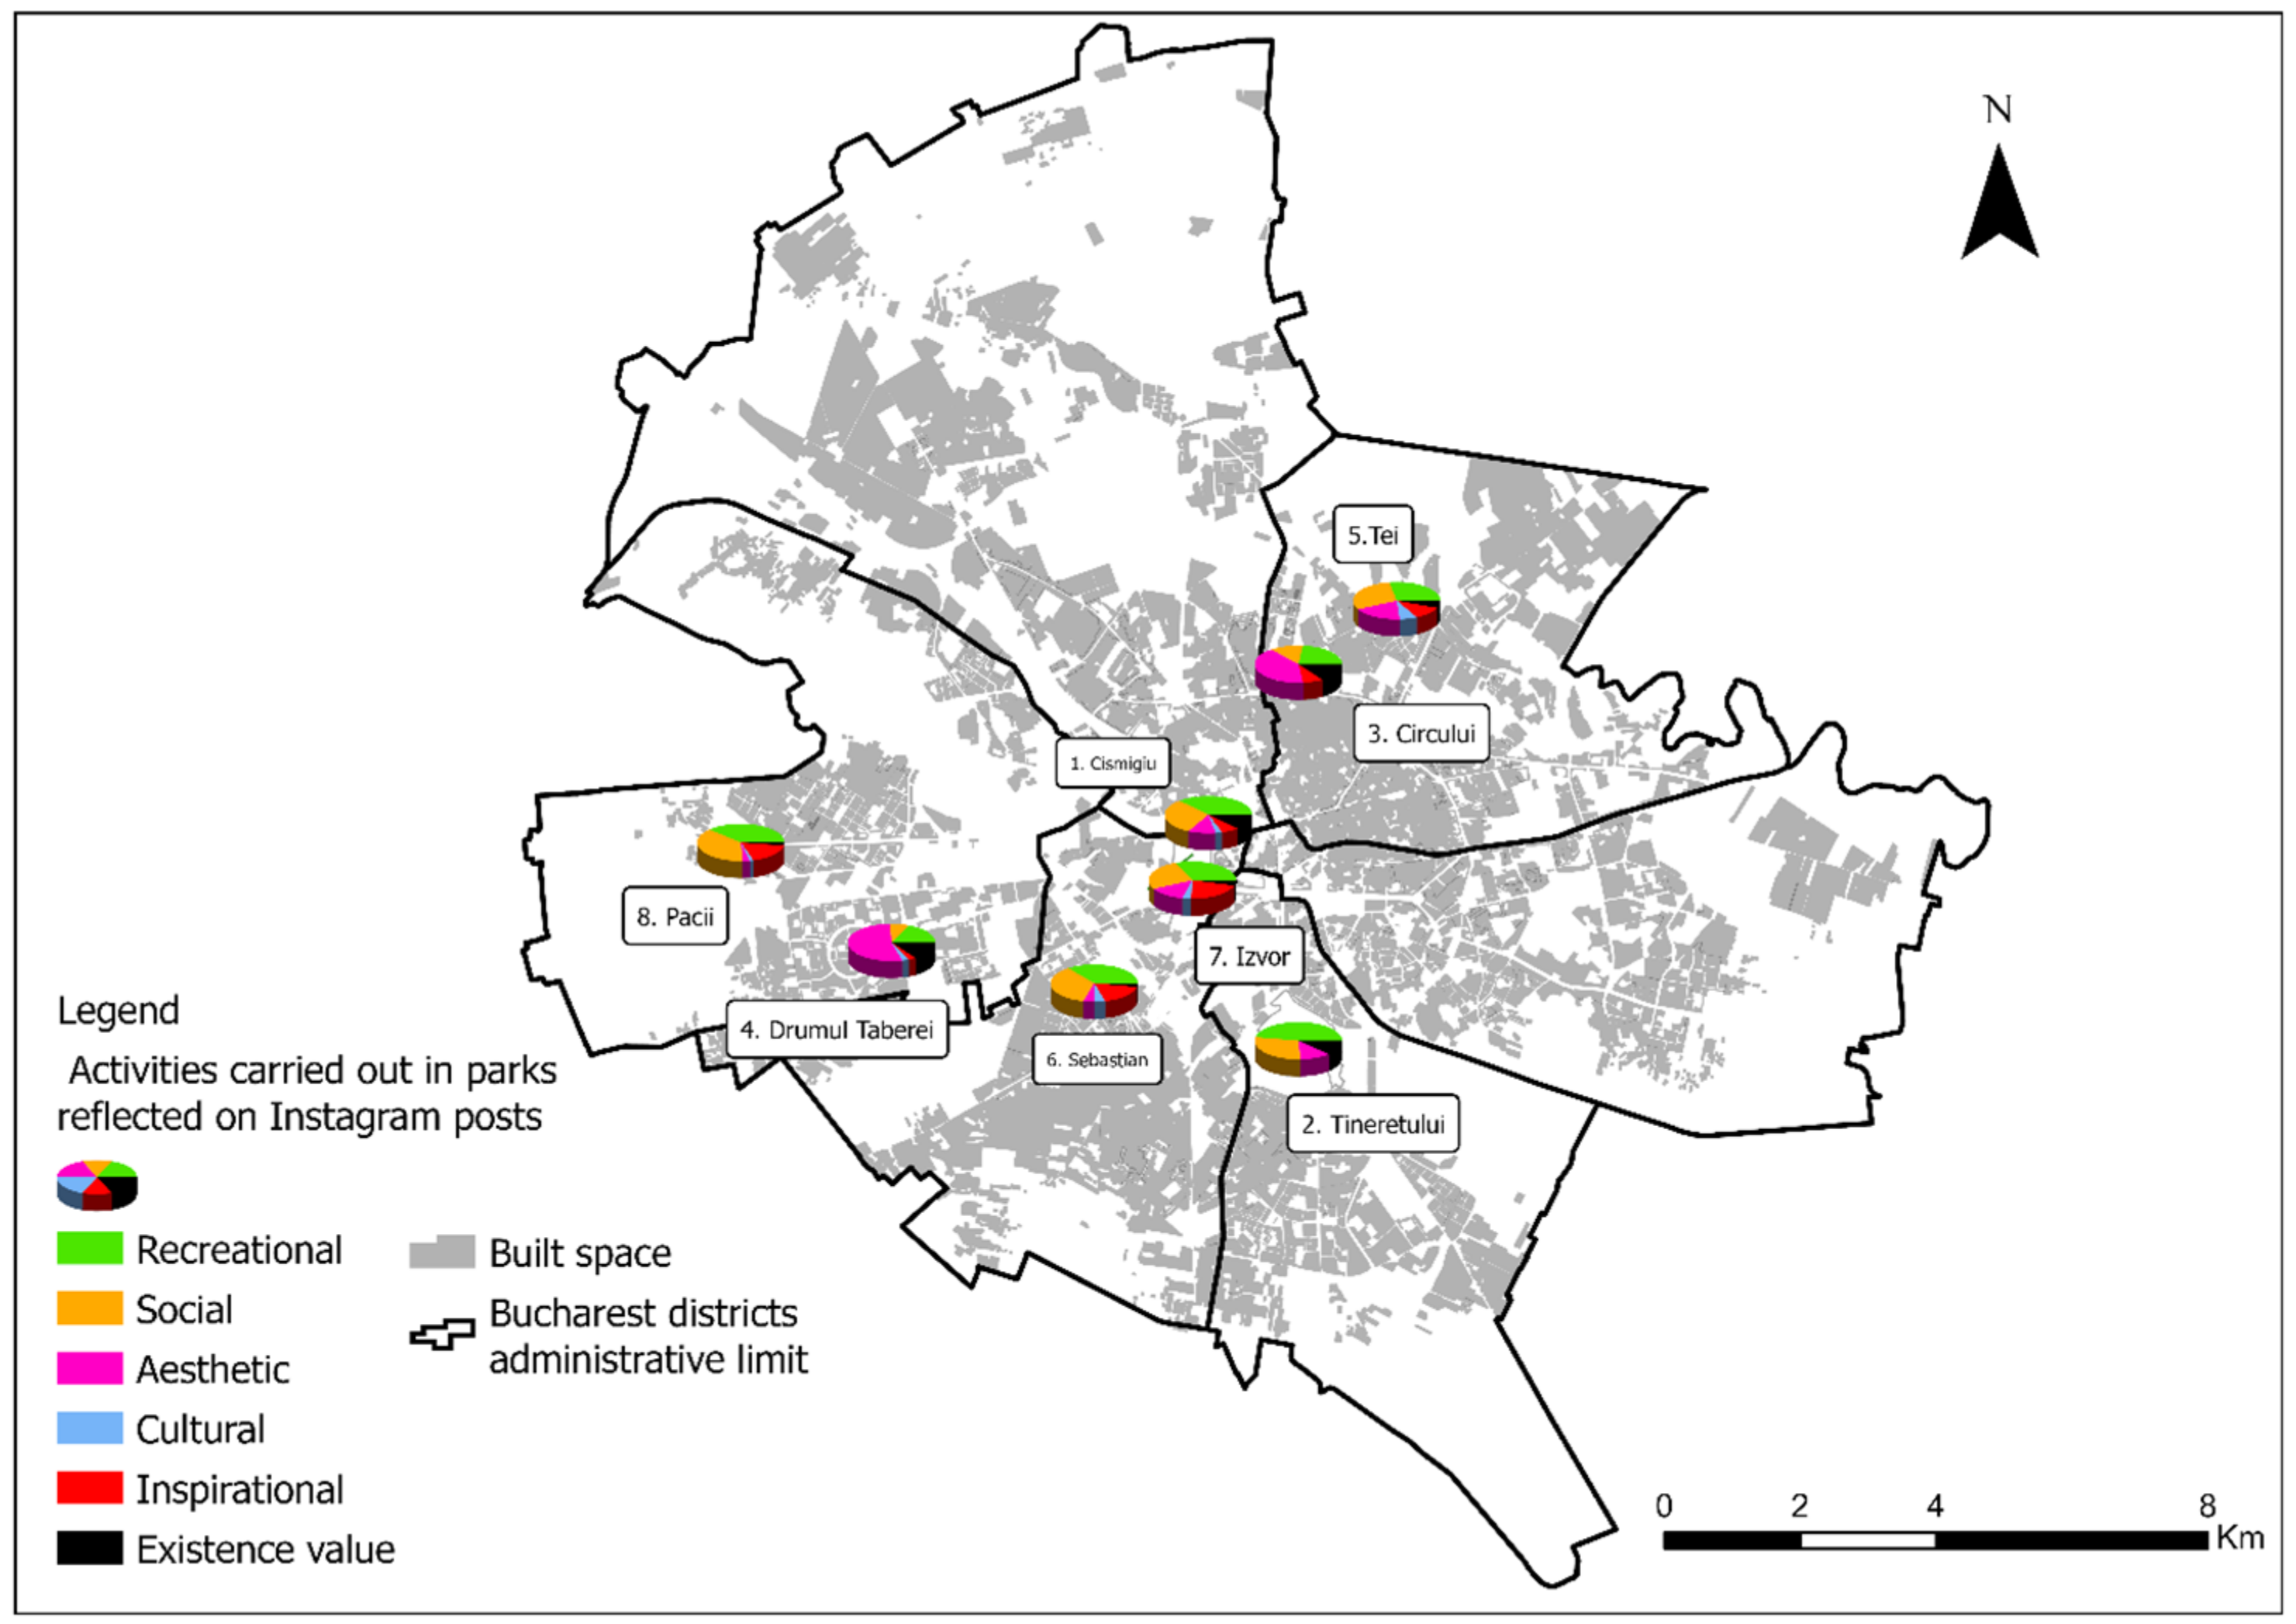
3. Results
4. Discussion
5. Conclusions
Author Contributions
Funding
Institutional Review Board Statement
Informed Consent Statement
Data Availability Statement
Acknowledgments
Conflicts of Interest
References
- Van Oijstaeijen, W.; Van Passel, S.; Cools, J. Urban green infrastructure: A review on valuation toolkits from an urban planning perspective. J. Environ. Manag. 2020, 267, 110603. [Google Scholar] [CrossRef]
- Rigolon, A.; Browning, M.; Jennings, V. Inequities in the quality of urban park systems: An environmental justice investigation of cities in the United States. Landsc. Urban Plan. 2018, 178, 156–169. [Google Scholar] [CrossRef]
- Gavrilidis, A.A.; Popa, A.M.; Niță, M.R.; Onose, D.A.; Badiu, D.L. Planning the “unknown”: Perception of urban green infrastructure concept in Romania. Urban For. Urban Green. 2020, 51, 126649. [Google Scholar] [CrossRef]
- Badiu, D.L.; Niță, A.; Ioja, I.C.; Niță, M.R. Disentangling the connections: A network analysis of approaches to urban green infrastructure. Urban For. Urban Green. 2019, 41, 211–220. [Google Scholar] [CrossRef]
- Huang, S.; Qi, J.; Li, W.; Dong, J.; van den Bosch, C.K. The Contribution to Stress Recovery and Attention Restoration Potential of Exposure to Urban Green Spaces in Low-Density Residential Areas. Int. J. Environ. Res. Public Health 2021, 18, 8713. [Google Scholar] [CrossRef] [PubMed]
- European Commission. Communication from the Commission to the European Parliament, the Council, the European Economic and Social Committee and the Committee of the Regions: Youth Opportunities Initiative. In Green Infrastructure (GI)—Enhancing Europe’s Natural Capital; European Commission: Brussels, Belgium, 2013. [Google Scholar]
- Zhang, S.; Zhou, W. Recreational visits to urban parks and factors affecting park visits: Evidence from geotagged social media data. Landsc. Urban Plan. 2018, 180, 27–35. [Google Scholar] [CrossRef]
- Chen, Y.; Liu, X.; Gao, W.; Wang, R.Y.; Li, Y.; Tu, W. Emerging social media data on measuring urban park use. Urban For. Urban Green. 2018, 31, 130–141. [Google Scholar] [CrossRef]
- Donahue, M.L.; Keeler, B.L.; Wood, S.A.; Fisher, D.M.; Hamstead, Z.A.; McPhearson, T. Using social media to understand drivers of urban park visitation in the Twin Cities, MN. Landsc. Urban Plan. 2018, 175, 1–10. [Google Scholar] [CrossRef]
- Song, X.P.; Richards, D.R.; He, P.; Tan, P.Y. Does geo-located social media reflect the visit frequency of urban parks? A city-wide analysis using the count and content of photographs. Landsc. Urban Plan. 2020, 203, 103908. [Google Scholar] [CrossRef]
- Kronenberg, J.; Haase, A.; Łaszkiewicz, E.; Antal, A.; Baravikova, A.; Biernacka, M.; Dushkovae, D.; Filčak, R.; Haasee, D.; Ignatieva, M.; et al. Environmental justice in the context of urban green space availability, accessibility, and attractiveness in postsocialist cities. Cities 2020, 106, 102862. [Google Scholar] [CrossRef]
- Yoshimura, N.; Hiura, T. Demand and supply of cultural ecosystem services: Use of geotagged photos to map the aesthetic value of landscapes in Hokkaido. Ecosyst. Serv. 2017, 24, 68–78. [Google Scholar] [CrossRef]
- Thiagarajah, J.; Wong, S.K.M.; Richards, D.R.; Friess, D.A. Historical and contemporary cultural ecosystem service values in the rapidly urbanizing city state of Singapore. Ambio 2015, 44, 666–677. [Google Scholar] [CrossRef] [Green Version]
- Svendsen, E.S.; Campbell, L.K.; Mcmillen, H.L. Stories, shrines, and symbols: Recognizing psycho-social-spiritual benefits of urban parks and natural areas. J. Ethnobiol. 2016, 36, 881–907. [Google Scholar] [CrossRef] [Green Version]
- Cohen, D.; Sehgal, A.; Williamson, S.; Sturm, R.; McKenzie, T.; Lara, R.; Lurie, N. Park Use and Physical Activity in a Sample of Public Parks in the City of Los Angeles; RAND Corporation: Santa Monica, CA, USA, 2006. [Google Scholar]
- Onose, D.A.; Iojă, I.C.; Niţă, M.R.; Vânău, G.O.; Popa, A.M. Too old for recreation? How friendly are urban parks for elderly people? Sustainability 2020, 12, 790. [Google Scholar] [CrossRef] [Green Version]
- Brown, A. Engaging Older People in Parks and Green Spaces. 2007. Available online: https://media.churchillfellowship.org/documents/Brown_A_Report_2007_Final.pdf (accessed on 23 April 2021).
- Wood, L. Parks and open space: For the health and wellbeing of children and young people. In Action for Young Australians Report; ARACY: Canberra, Australia, 2009; ISBN 978-1-921352-58-4. [Google Scholar]
- Stier, A.J.; Berman, M.G.; Bettencourt, L.M.A. COVID-19 attack rate increases with city size. medRxiv 2020. [Google Scholar] [CrossRef]
- Gu, C.; Jiang, W.; Zhao, T.; Zheng, B. Mathematical Recommendations to Fight Against COVID-19. SSRN Electron. J. 2020. [Google Scholar] [CrossRef]
- Samuelsson, K.; Barthel, S.; Colding, J.; Macassa, G.; Giusti, M. Urban nature as a source of resilience during social distancing amidst the coronavirus pandemic. Sustain. Urban Dev. 2020. [Google Scholar] [CrossRef]
- Geng, D.; Innes, J.; Wu, W.; Wang, G. Impacts of COVID-19 pandemic on urban park visitation: A global analysis. J. For. Res. 2021, 32, 553–567. [Google Scholar] [CrossRef] [PubMed]
- Gherheș, V.; Cernicova-Buca, M.; Fărcașiu, M.; Palea, A. Romanian Students’ Environment-Related Routines during COVID-19 Home Confinement: Water, Plastic, and Paper Consumption. Int. J. Environ. Res. Public Health 2021, 18, 8209. [Google Scholar] [CrossRef]
- Riskos, K.; Dekoulou, P.; Mylonas, N.; Tsourvakas, G. Ecolabels and the Attitude–Behavior Relationship towards Green Product Purchase: A Multiple Mediation Model. Sustainability 2021, 13, 6867. [Google Scholar] [CrossRef]
- Trust for Public Land. Parks and the Pandemic. Available online: https://www.tpl.org/parks-and-pandemic-report (accessed on 23 April 2021).
- Cortinez-O’Ryan, A.; Moran, M.R.; Rios, A.P.; Anza-Ramirez, C.; Slovic, A.D. Could severe mobility and park use restrictions during the COVID-19 pandemic aggravate health inequalities? Insights and challenges from Latin America. Cad. Saude Publica 2020, 36, e00185820. [Google Scholar] [CrossRef]
- Rice, W.L.; Mateer, T.J.; Reigner, N.; Newman, P.; Lawhon, B.; Taff, B.D. Changes in recreational behaviors of outdoor enthusiasts during the COVID-19 pandemic: Analysis across urban and rural communities. J. Urban Ecol. 2020, 6, juaa020. [Google Scholar] [CrossRef]
- Mobility Changes Report. Community Mobility Reports. Available online: https://www.google.com/covid19/mobility/ (accessed on 19 April 2021).
- Rice, W.; Pan, B. Understanding drivers of change in park visitation during the COVID-19 pandemic: A spatial application of Big data. SocArXiv 2020. [Google Scholar] [CrossRef]
- Slater, S.J.; Christiana, R.W.; Gustat, J. Recommendations for Keeping Parks and Green Space Accessible for Mental and Physical Health During COVID-19 and Other Pandemics. Prev. Chronic Dis. 2020, 17, 200204. [Google Scholar] [CrossRef]
- BBiernacka, M.; Kronenberg, J.; Łaszkiewicz, E. An integrated system of monitoring the availability, accessibility and attractiveness of urban parks and green squares. Appl. Geogr. 2020, 116, 102152. [Google Scholar] [CrossRef]
- Van Herzele, A.; Wiedemann, T. A monitoring tool for the provision of accessible and attractive urban green spaces. Landsc. Urban Plan. 2003, 63, 109–126. [Google Scholar] [CrossRef]
- Sugiyama, T.; Francis, J.; Middleton, N.J.; Owen, N.; Giles-Corti, B. Associations Between Recreational Walking and Attractiveness, Size, and Proximity of Neighborhood Open Spaces. Am. J. Public Health 2010, 100, 1752–1757. [Google Scholar] [CrossRef]
- Song, X.P.; Richards, D.R.; Tan, P.Y. Using social media user attributes to understand human–environment interactions at urban parks. Sci. Rep. 2020, 10, 808. [Google Scholar] [CrossRef] [PubMed] [Green Version]
- Chen, Y.; Liu, T.; Xie, X.; Marušić, B.G. What attracts people to visit community open spaces? A case study of the overseas chinese town community in Shenzhen, China. Int. J. Environ. Res. Public Health 2016, 13, 644. [Google Scholar] [CrossRef] [PubMed] [Green Version]
- Jiang, B.; Li, D.; Larsen, L.; Sullivan, W. A Dose-Response Curve Describing the Relationship Between Urban Tree Cover Density and Self-Reported Stress Recovery. Environ. Behav. 2014, 48, 607–629. [Google Scholar] [CrossRef]
- Marine-Roig, E.; Clavé, S.A. Tourism analytics with massive user-generated content: A case study of Barcelona. J. Destin. Mark. Manag. 2015, 4, 162–172. [Google Scholar] [CrossRef]
- Gonzaga, L.S.; Capone, D.L.; Bastian, S.E.; Danner, L.; Jeffery, D.W. Using Content Analysis to Characterise the Sensory Typicity and Quality Judgements of Australian Cabernet Sauvignon Wines. Foods 2019, 8, 691. [Google Scholar] [CrossRef] [PubMed] [Green Version]
- Onose, D.-A. Modelarea Interdependențelor dintre Componentele Structurale, Funcțiile Urbane si Calitatea Mediului din Municipiul Bucuresti; Editura Etnologică: București, Romania, 2018. [Google Scholar]
- Grădinaru, S.R.; Triboi, R.; Iojă, C.I.; Artmann, M. Contribution of agricultural activities to urban sustainability: Insights from pastoral practices in Bucharest and its peri-urban area. Habitat Int. 2018, 82, 62–71. [Google Scholar] [CrossRef]
- Simion, G.; Nistor, C. Spatial structure changes inside post-communist capital city of Bucharest. Hum. Geogr. 2012, 6, 79–89. [Google Scholar] [CrossRef]
- Culescu, D. Elaborarea Unei Metode De Analiză a Calității Spațiilor Verzi Urbane. Ph.D. Thesis, USAMV Cluj-Napoca, Cluj-Napoca, Romania, 2013. [Google Scholar]
- Colesca, S.E.; Alpopi, C. The quality of Bucharest’s green spaces. Res. Cent. Public Adm. Public Serv. 2011, 6, 45–59. [Google Scholar]
- Ioja, C.; Patroescu, M.; Nita, M.; Rozylowicz, L.; Vanau, G.; Ioja, A.; Onose, D. Categories of residential spaces by their accessibility to urban parks-indicator of sustainability in human settlements case study: Bucharest. WSEAS Trans. Environ. Dev. 2010, 6, 307–316. [Google Scholar]
- Dumitru, C.; Mariana, S.; Huma, C. Green Space—Current urbanization issues. Qual. Life 2009, 3–4, 249–270. [Google Scholar]
- Stănescu, A.; Cocioabă, S. Tineretului park—Functional and compositional components in the urban landscape of Bucharest. Horticulture 2018, 62, 611–614. [Google Scholar]
- Constantinescu, N. Modernizarea Arhitecturala si Peisagistica a Parcului Drumul Taberei Faza Proiectare: Documentatie de Avizare a Lucrarilor de Interventie. 2010. Available online: https://www.primarie6.ro/consiliul-local/sedintele-consiliului-local/hotarari-ale-consiliului-local/hotarari-2010/ (accessed on 13 April 2021).
- Stănescu, A. The Aesthetic Criterion-Component for Designing Urban Public Green Space. Study Based on Two Alternatives for Izvor Park, Bucharest. Sci. Pap. Ser. B Hortic. 2016, 60, 243–245. [Google Scholar]
- Kupfer, J.A.; Li, Z.; Ning, H.; Huang, X. Using Mobile Device Data to Track the Effects of the COVID-19 Pandemic on Spatiotemporal Patterns of National Park Visitation. Sustainability 2021, 13, 9366. [Google Scholar] [CrossRef]
- Cui, N.; Malleson, N.; Houlden, V.; Comber, A. Using VGI and Social Media Data to Understand Urban Green Space: A Narrative Literature Review. ISPRS Int. J. Geo-Inf. 2021, 10, 425. [Google Scholar] [CrossRef]
- Ioja, I.C.; Osaci-Costache, G.; Breuste, J.; Hossu, C.A.; Gradinaru, S.R.; Onose, D.A.; Nita, M.R.; Skokanova, H. Integrating urban blue and green areas based on historical evidence. Urban For. Urban Green. 2018, 34, 217–225. [Google Scholar] [CrossRef]
- Uchiyama, Y.; Kohsaka, R. Access and Use of Green Areas during the COVID-19 Pandemic: Green Infrastructure Management in the “New Normal”. Sustainability 2020, 12, 9842. [Google Scholar] [CrossRef]
- Burzyńska, J.; Bartosiewicz, A.; Rękas, M. The social life of COVID-19: Early insights from social media monitoring data collected in Poland. Health Inform. J. 2020, 26, 3056–3065. [Google Scholar] [CrossRef]
- Zhao, Y.; Cheng, S.; Yu, X.; Xu, H. Chinese Public’s Attention to the COVID-19 Epidemic on Social Media: Observational Descriptive Study. J. Med. Internet Res. 2020, 22, e18825. [Google Scholar] [CrossRef]
- Pamukcu-Albers, P.; Ugolini, F.; La Rosa, D.; Gradinaru, S.R.; Azevedo, J.C.; Wu, J. Building green infrastructure to enhance urban resilience to climate change and pandemics. Landsc. Ecol. 2021, 36, 665–673. [Google Scholar] [CrossRef] [PubMed]
- Mondal, P.; Sinharoy, A.; Sankoorikal, B.-J.; Siddaiah, R.; Mazur, L.; Graff, G. The Influence of Sociodemographic Heterogeneity on the Perceptions of COVID-19: A Countrywide Survey Study in the USA. Int. J. Environ. Res. Public Health 2021, 18, 8922. [Google Scholar] [CrossRef] [PubMed]
- Gavrilidis, A.A.; Nita, M.R.; Onose, D.A.; Badiu, D.L.; Nastase, I.I. Methodological framework for urban sprawl control through sustainable planning of urban green infrastructure. Ecol. Indic. 2019, 96, 67–78. [Google Scholar] [CrossRef]
- Olszewska-Guizzo, A.; Mukoyama, A.; Naganawa, S.; Dan, I.; Husain, S.F.; Ho, C.S.; Ho, R. Hemodynamic Response to Three Types of Urban Spaces before and after Lockdown during the COVID-19 Pandemic. Int. J. Environ. Res. Public Health 2021, 18, 6118. [Google Scholar] [CrossRef]
- Larcher, F.; Pomatto, E.; Battisti, L.; Gullino, P.; Devecchi, M. Perceptions of Urban Green Areas during the Social Distancing Period for COVID-19 Containment in Italy. Horticulturae 2021, 7, 55. [Google Scholar] [CrossRef]
- Cooke, P. After the Contagion. Ghost City Centres: Closed “Smart” or Open Greener? Sustainability 2021, 13, 3071. [Google Scholar] [CrossRef]

| Park Name | Average Nr. of Visitors/Weekend Day | Average Visit Length (min) | Park Category | Accessibility of Visitors | Park Size (ha) |
|---|---|---|---|---|---|
| Cismigiu | 5100 | 129 | Metropolitan | Assured by public transport network | 14.6 |
| Tineretului | 7800 | 113 | Metropolitan | Assured by public transport network | 94 |
| Circului | 3500 | 95 | Municipal | Monopolistic position at the neighborhood level, but reduced accessibility to the rest of the city | 17.2 |
| Drumul Taberei | 2200 | 106 | Municipal | Monopolistic position at the neighborhood level, but reduced accessibility to the rest of the city | 37 |
| Tei | 1200 | 90 | District | Low | 8.5 |
| Sebastian | 1100 | 89 | District | Low | 2.3 |
| Izvor | 820 | 97 | Located near the inter-modal hubs, shopping centers, etc. | ||
| Pacii | 1100 | 94 | Located near the inter-modal hubs, shopping centers, etc. |
| Park | January | February | March | April | May | June | July | August | Total | |||||||||
|---|---|---|---|---|---|---|---|---|---|---|---|---|---|---|---|---|---|---|
| IG | G | IG | G | IG | G | IG | G | IG | G | IG | G | IG | G | IG | G | IG | G | |
| Cismigiu | 22 | 9 | 16 | 10 | 15 | 10 | 4 | 1 | 13 | 5 | 6 | 14 | 10 | 27 | 183 | 22 | 269 | 98 |
| Tineretului | 0 | 13 | 0 | 17 | 0 | 18 | 0 | 0 | 9 | 2 | 17 | 18 | 15 | 16 | 16 | 16 | 57 | 100 |
| Circului | 1 | 27 | 3 | 21 | 1 | 19 | 2 | 1 | 4 | 8 | 5 | 24 | 4 | 24 | 0 | 21 | 20 | 145 |
| Dr. Taberei | 0 | 9 | 1 | 11 | 2 | 21 | 3 | 9 | 7 | 2 | 2 | 10 | 5 | 23 | 3 | 15 | 23 | 100 |
| Tei | 3 | 24 | 2 | 37 | 3 | 15 | 0 | 1 | 3 | 2 | 11 | 7 | 26 | 21 | 32 | 14 | 80 | 121 |
| Sebastian | 15 | 43 | 8 | 25 | 4 | 15 | 2 | 0 | 7 | 3 | 17 | 7 | 23 | 21 | 9 | 17 | 85 | 131 |
| Izvor | 11 | 46 | 11 | 82 | 16 | 55 | 3 | 4 | 21 | 9 | 20 | 20 | 18 | 29 | 20 | 45 | 120 | 290 |
| Pacii | 0 | 1 | 3 | 0 | 1 | 0 | 0 | 0 | 3 | 0 | 3 | 0 | 8 | 0 | 4 | 1 | 22 | 2 |
| Park Name | Average Monthly Reviews | |||||||
|---|---|---|---|---|---|---|---|---|
| January | February | March | April | May | June | July | August | |
| Cismigiu | 1.1 | 1.2 | 1.2 | 0.1 | 0.6 | 1.7 | 3.3 | 2.7 |
| Tineretului | 1.6 | 2.1 | 2.2 | 0 | 0.2 | 2.2 | 2 | 2 |
| Circului | 3.3 | 2.6 | 2.3 | 0.1 | 1 | 3 | 3 | 2.6 |
| Dr. Taberei | 1.1 | 1.3 | 2.6 | 1.1 | 0.2 | 1.2 | 2.8 | 1.8 |
| Tei | 3 | 4.6 | 1.8 | 0.1 | 0.2 | 0.8 | 2.6 | 1.7 |
| Sebastian | 5.3 | 3.1 | 1.8 | 0 | 0.3 | 0.8 | 2.6 | 2.1 |
| Izvor | 5.7 | 10.2 | 6.8 | 0.5 | 1.1 | 2.5 | 3.6 | 5.6 |
| Pacii | 0.1 | 0 | 0 | 0 | 0 | 0 | 0 | 0.1 |
| Park Name | Average Review by Month | |||||||
|---|---|---|---|---|---|---|---|---|
| January | February | March | April | May | June | July | August | |
| Cismigiu | 3.5 | 3.9 | 4.4 | 4 | 3.4 | 3.5 | 4.1 | 3.0 |
| Tineretului | 4.6 | 4.1 | 4.4 | NA | 5 | 4.3 | 4.0 | 3.8 |
| Circului | 4.4 | 4.5 | 4.4 | 5 | 4.3 | 4.5 | 4.7 | 4.4 |
| Dr. Taberei | 3.7 | 4.0 | 4.4 | 4.7 | 5 | 4.6 | 4.4 | 4.2 |
| Tei | 4.2 | 3.9 | 4.4 | 3 | 5 | 3.4 | 4.4 | 4.4 |
| Sebastian | 3.9 | 4.2 | 3.6 | NA | 5 | 3.5 | 4.4 | 4.2 |
| Izvor | 4.1 | 4.1 | 4.2 | 4.5 | 4.55 | 4.6 | 4.1 | 4.1 |
| Pacii | 5 | NA | NA | NA | NA | NA | NA | 4 |
| Recreational | Social | Aesthetic | Cultural | Inspirational | Existence Value | |
|---|---|---|---|---|---|---|
| Cismigiu | 39.5 | 25.2 | 14.0 | 3.3 | 7.4 | 10.5 |
| Tineretului | 47.9 | 28.2 | 14.1 | 0.0 | 0.0 | 9.9 |
| Circului | 22.6 | 16.1 | 38.7 | 0.0 | 9.7 | 12.9 |
| Dr. Taberei | 16.1 | 9.7 | 54.8 | 3.2 | 3.2 | 12.9 |
| Tei | 29.1 | 26.4 | 21.1 | 8.7 | 10.2 | 4.5 |
| Sebastian | 38.1 | 31.2 | 6.0 | 5.5 | 17.0 | 2.3 |
| Izvor | 32.0 | 22.3 | 14.6 | 4.9 | 22.9 | 3.4 |
| Pacii | 40.7 | 35.2 | 3.7 | 1.9 | 16.7 | 1.9 |
Publisher’s Note: MDPI stays neutral with regard to jurisdictional claims in published maps and institutional affiliations. |
© 2021 by the authors. Licensee MDPI, Basel, Switzerland. This article is an open access article distributed under the terms and conditions of the Creative Commons Attribution (CC BY) license (https://creativecommons.org/licenses/by/4.0/).
Share and Cite
Niță, M.R.; Arsene, M.; Barbu, G.; Cus, A.G.; Ene, M.; Serban, R.M.; Stama, C.M.; Stoia, L.N. Using Social Media Data to Evaluate Urban Parks Use during the COVID-19 Pandemic. Int. J. Environ. Res. Public Health 2021, 18, 10860. https://doi.org/10.3390/ijerph182010860
Niță MR, Arsene M, Barbu G, Cus AG, Ene M, Serban RM, Stama CM, Stoia LN. Using Social Media Data to Evaluate Urban Parks Use during the COVID-19 Pandemic. International Journal of Environmental Research and Public Health. 2021; 18(20):10860. https://doi.org/10.3390/ijerph182010860
Chicago/Turabian StyleNiță, Mihai Răzvan, Miruna Arsene, Giorgiana Barbu, Alina Gabriela Cus, Mihail Ene, Ramona Mihaela Serban, Constantin Marian Stama, and Larissa Nicoleta Stoia. 2021. "Using Social Media Data to Evaluate Urban Parks Use during the COVID-19 Pandemic" International Journal of Environmental Research and Public Health 18, no. 20: 10860. https://doi.org/10.3390/ijerph182010860
APA StyleNiță, M. R., Arsene, M., Barbu, G., Cus, A. G., Ene, M., Serban, R. M., Stama, C. M., & Stoia, L. N. (2021). Using Social Media Data to Evaluate Urban Parks Use during the COVID-19 Pandemic. International Journal of Environmental Research and Public Health, 18(20), 10860. https://doi.org/10.3390/ijerph182010860