
Processed and Unprocessed Red Meat Consumption and Risk for Type 2 Diabetes Mellitus: An Updated Meta-Analysis of Cohort Studies


Abstract
:1. Introduction
2. Materials and Methods
2.1. Data Source and Search Strategy
2.2. Article Selection
2.3. Data Extraction
2.4. Quality Assessment of Included Studies
2.5. Statistical Analysis
3. Results
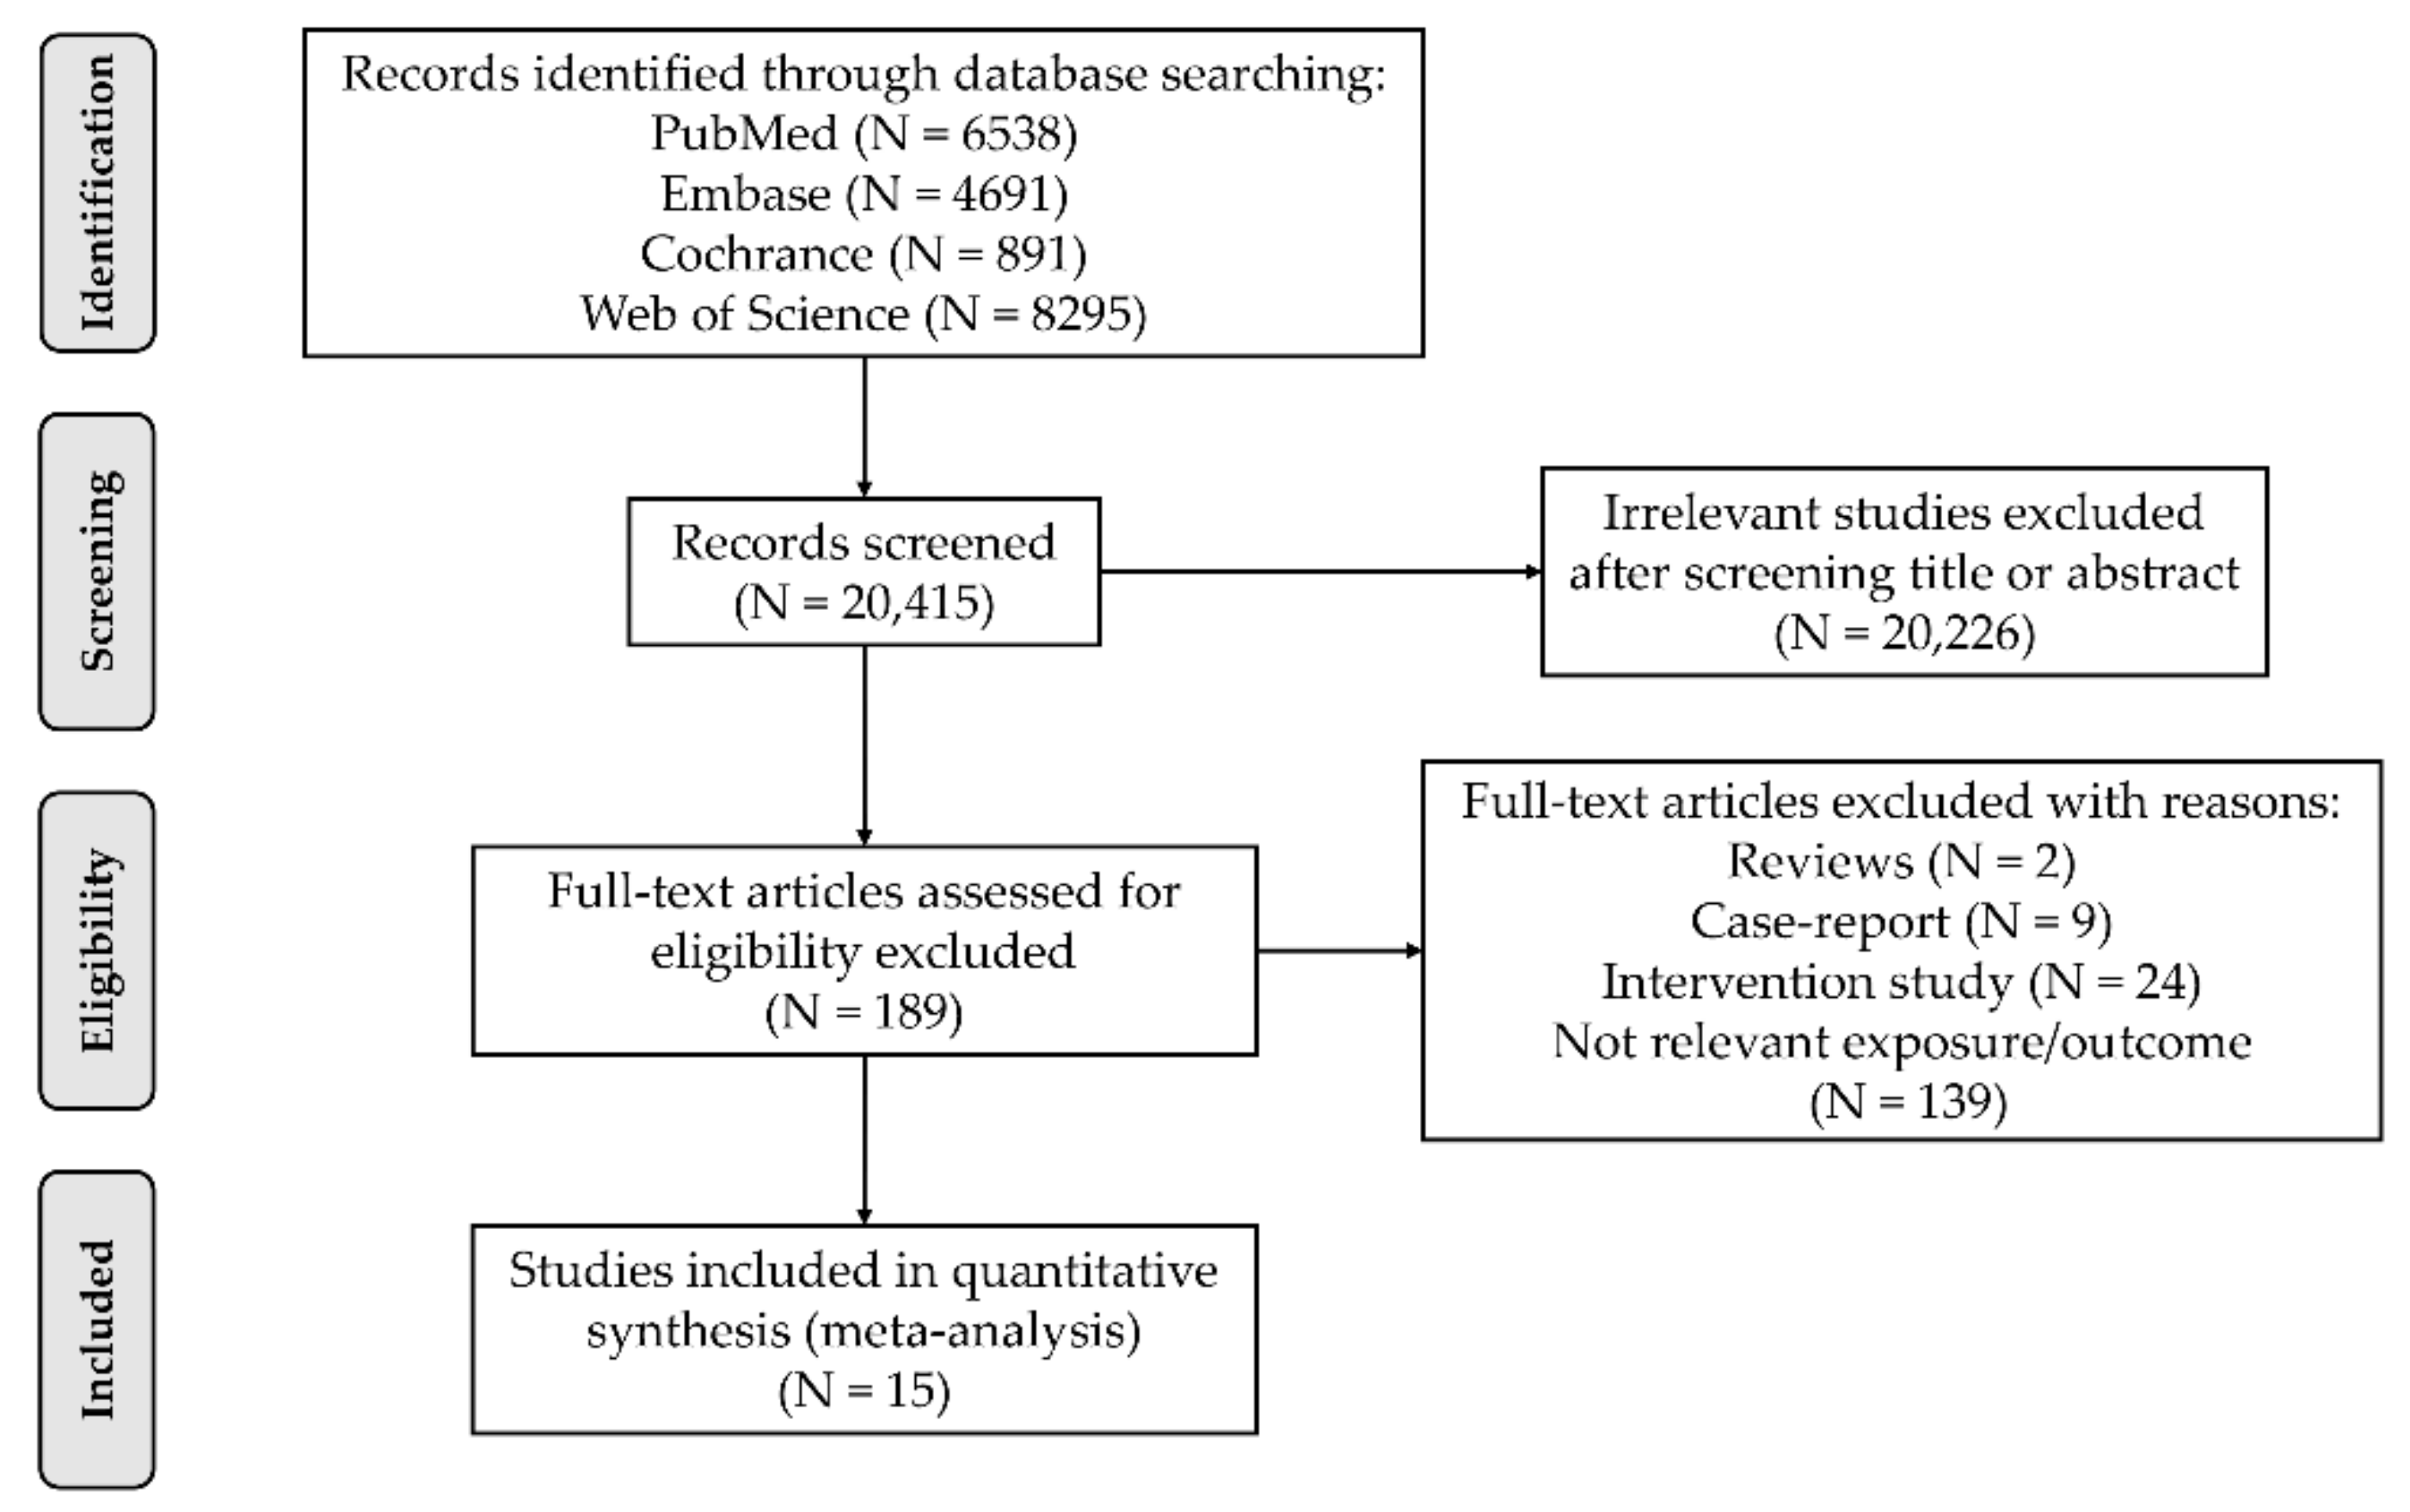
3.1. Literature Search and Trial Selection
3.2. Description of the Included Trials
3.3. PRM Consumption and T2DM Risk
3.4. URM Consumption and T2DM Risk
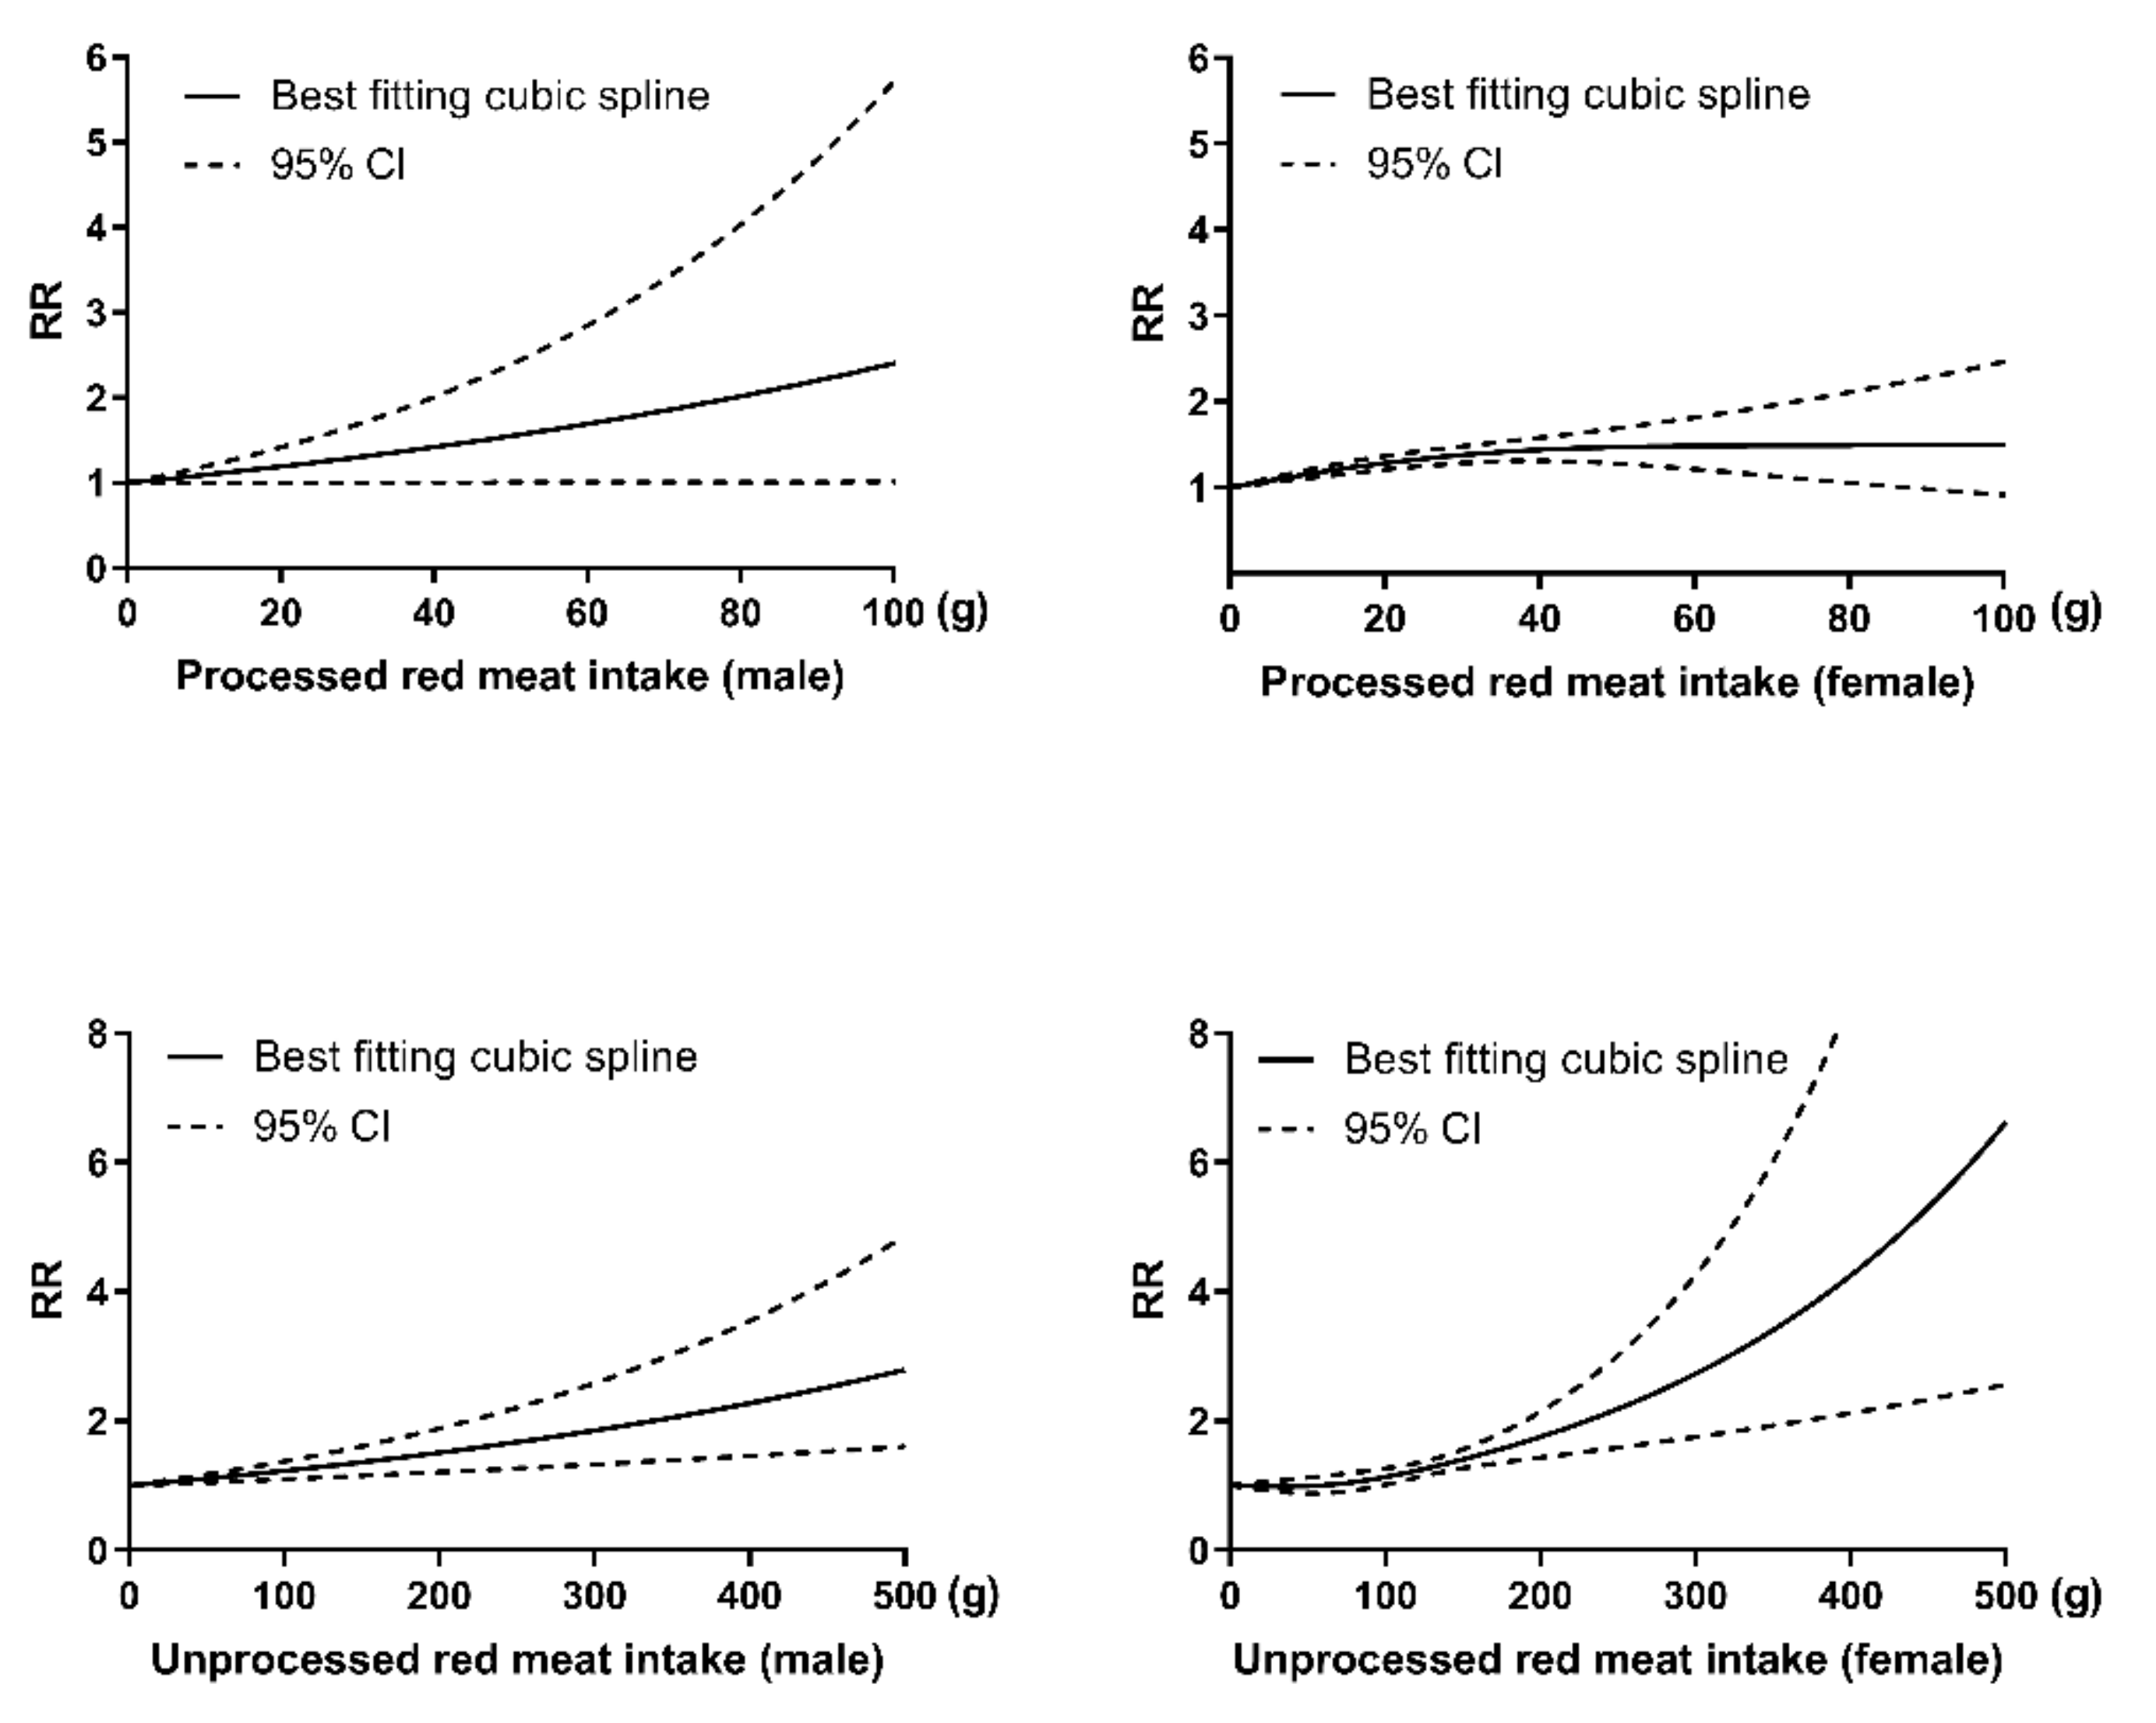
3.5. Dose–Response Analysis Stratified by Sex
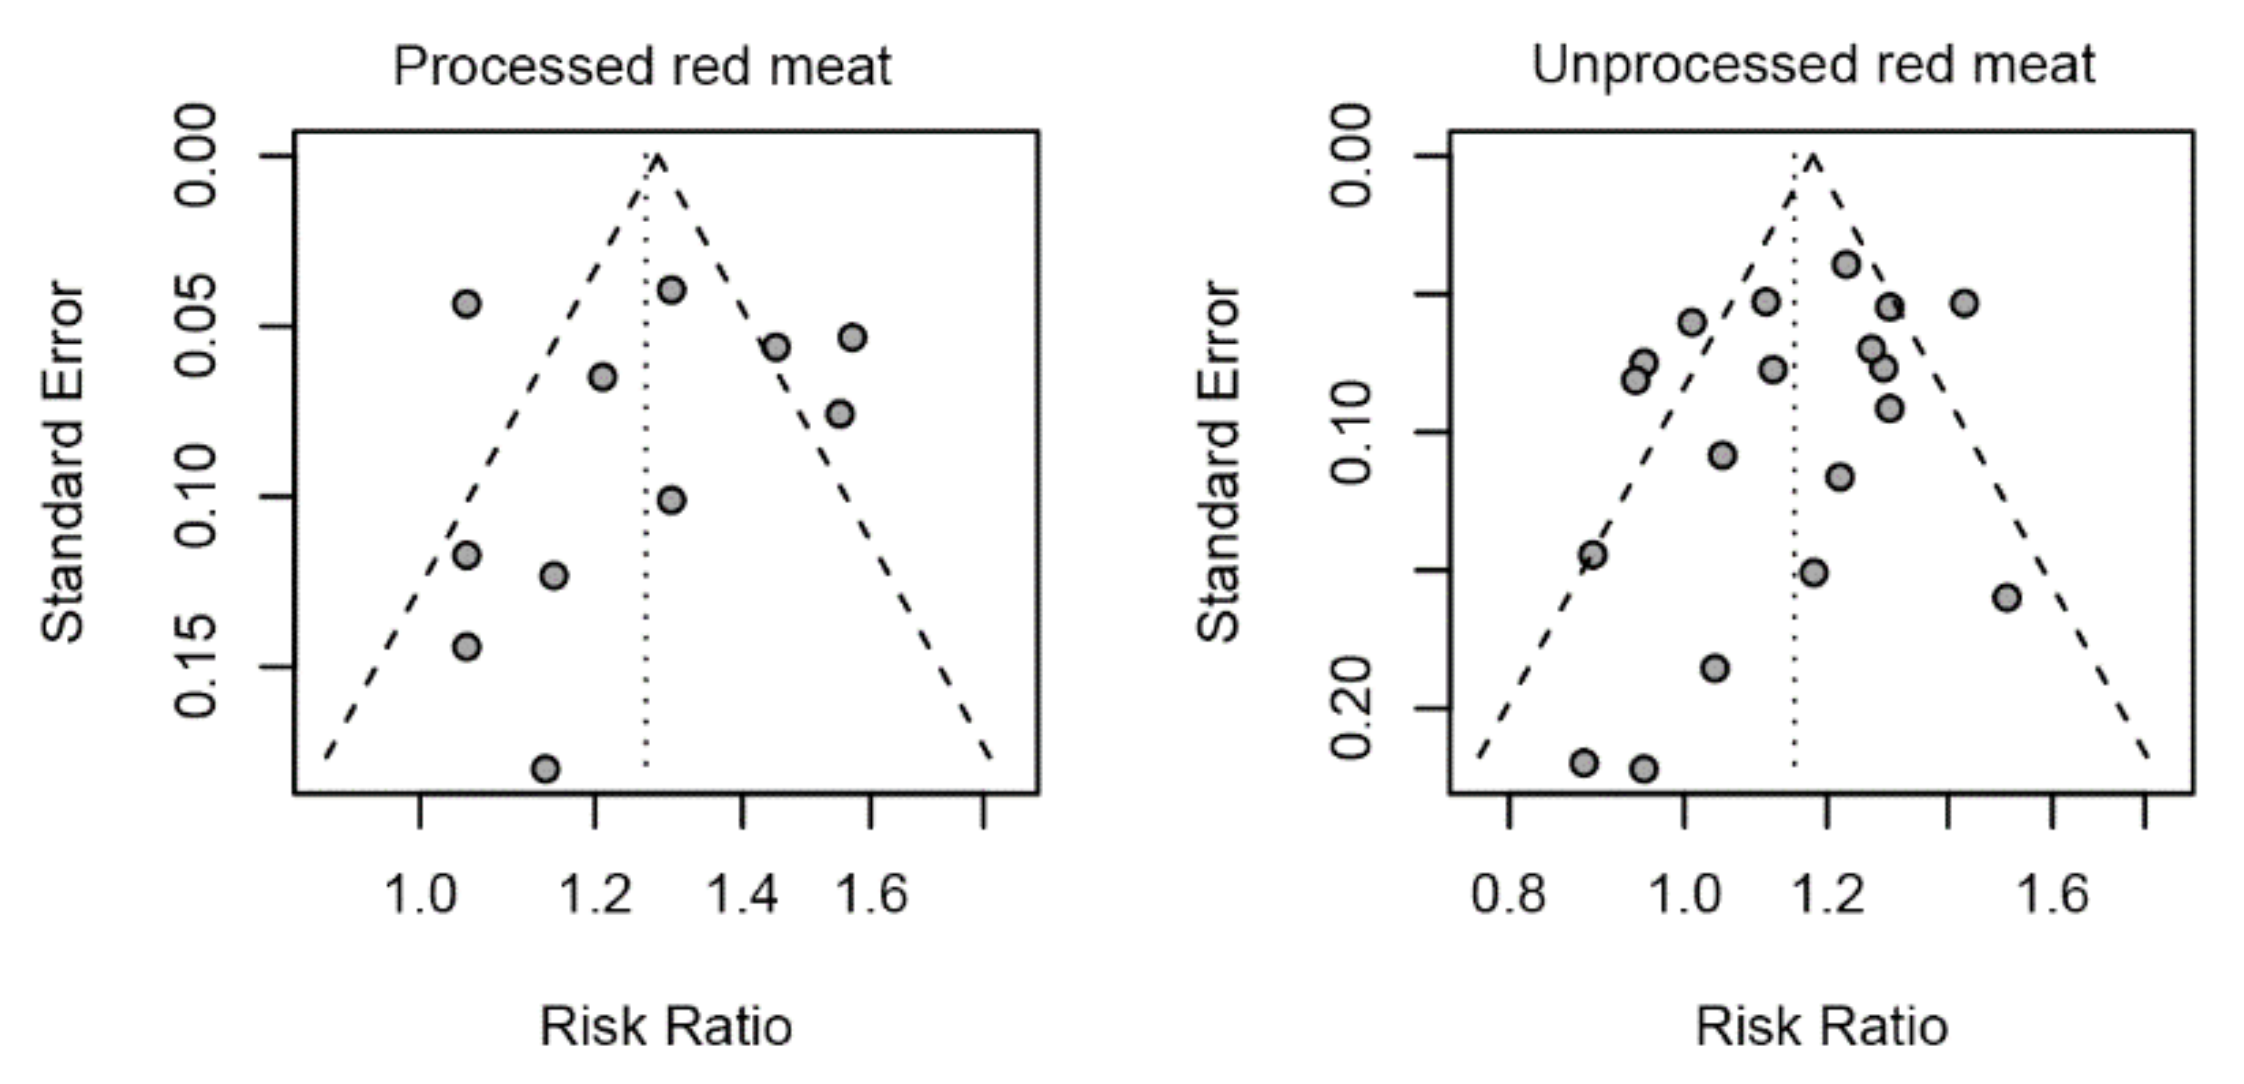
3.6. Sensitivity Analysis and Publication Bias
4. Discussion
5. Conclusions
Author Contributions
Funding
Institutional Review Board Statement
Informed Consent Statement
Data Availability Statement
Conflicts of Interest
Appendix A

| Author | Country/ Published Year | Follow-up Period | Age at Entry | Gender | Study Cases /Size | Case Ascertainment | Ascertainment of T2DM | Adjusted Factors | NOS Score |
|---|---|---|---|---|---|---|---|---|---|
| PRM | |||||||||
| Kurotani et al. | Japan/2013 | 5 | 45–75 | both | 1178/63,849 | self-reported | History of clinical diagnosis | 1,5–11,18,19,23, 27,29,31–34 | 8 |
| Lajous et al. | France/2012 | 20 | NA | female | 1369/66,118 | self-reported and medical records | History of clinical diagnosis or reimbursement claims for diabetes medications. | 3,5,6,8,10–12,18–22, 24,29,30,42 | 7 |
| Pan-HPFS et al. | US/2011 | 20 | 40–75 | male | 2438/37,083 | self-reported and medical records | History of clinical diagnosis or National Diabetes Data Group criteria | 1,5–9,11,14,16, 19,20,39 | 8 |
| Pan-NHS1 et al. | US/2011 | 28 | 30–55 | female | 8253/79,570 | self-reported and medical records | History of clinical diagnosis or National Diabetes Data Group criteria | 1,5–9,11,14,16, 19,20,39 | 8 |
| Pan-NHS2 et al. | US/2011 | 16 | 25–42 | female | 3068/87,504 | self-reported and medical records | History of clinical diagnosis or National Diabetes Data Group criteria | 1,5–9,11,14,16, 19,20,39 | 8 |
| Son et al. | Korean/2018 | 10 | 40–69 | both | 668/8618 | self-reported | History of clinical diagnosis, currently receiving medication, or use of insulin or oral medication | 1–3,5–10,12,13, 18,23,30,35,40 | 7 |
| Steinbrecher et al. | US/2011 | 14 | 45–75 | both | 8587/75,512 | self-reported and medical records | History of clinical diagnosis or currently receiving medication | 3,5,8,9,14 | 8 |
| Talaei et al. | Singapore/2017 | 18 | 45–74 | both | 5027/45,411 | self-reported | History of clinical diagnosis | 1,3,5–9,13,15,19, 39,50,51 | 7 |
| Virtanen et al. | Finnish/2017 | 19.3 | 42–60 | male | 432/2330 | self-reported, medical records and examination | History of clinical diagnosis, fasting plasma glucose ≥ 7.0 mmol/L or 2 h oral glucose ≥ 11.1 mmol/L | 1–12,17,21,25,27,29, 30,40,41,51,59–63 | 8 |
| URM | |||||||||
| EPIC-InterAct et al. | Europe/2013 | 11.7 | 20–80 | both | 11,559/26,088 | self-reported and medical records | History of clinical diagnosis or currently receiving medication | 3,5–9 | 8 |
| Ericson et al. | Sweden/2015 | 14 | 45–74 | both | 2860/26,930 | registry and examination | Fasting plasma glucose concentration ≥7.0 mmol/L or fasting whole blood concentration ≥ 6.1 mmol/L | 1,3,5–9,13,52,56 | 7 |
| Fretts et al. | US/2012 | 5 | 18–75 | both | 243/2001 | examination | American Diabetes Association’s criteria | 1,3,5–9,11–13, 18,36 | 8 |
| Kurotani et al. | Japan/2013 | 5 | 45–75 | both | 1178/63,849 | self-reported | History of clinical diagnosis | 1,5–11,18,19, 23,27,29,31–34 | 8 |
| Lajous et al. | France/2012 | 20 | NA | female | 1369/66,118 | self-reported | History of clinical diagnosis or reimbursement claims for diabetes medications. | 3,5,6,8,10–12, 18–22,24,29,30,42 | 7 |
| Mannisto et al. | Finland/2010 | 12 | 50−69 | male | 1098/25,943 | medical records | History of clinical diagnosis | 1,5–10,26,29,30, 37,38,41,57 | 7 |
| Mari-Sanchis et al. | Spain/2016 | 14 | 20−90 | both | 146/18,527 | self-reported and medical records | History of clinical diagnosis or currently receiving medication | 1,5,6,8,9,11–13, 19,20,24,25,39, | 8 |
| Pan-HPFS et al. | US/2011 | 20 | 40–75 | male | 2438/37,083 | self-reported and medical records | History of clinical diagnosis or National Diabetes Data Group criteria | 1,5–9,11,14,16, 19,20,39 | 8 |
| Pan-NHS1 et al. | US/2011 | 28 | 30−55 | female | 8253/79,570 | self-reported and medical records | History of clinical diagnosis or National Diabetes Data Group criteria | 1,5–9,11,14,16, 19,20,39 | 8 |
| Pan-NHS2 et al. | US/2011 | 16 | 25−42 | female | 3068/87,504 | self-reported and medical records | History of clinical diagnosis or National Diabetes Data Group criteria | 1,5–9,11,14,16, 19,20,39 | 8 |
| Steinbrecher et al. | US/2011 | 14 | 45–75 | both | 8587/75,512 | self-reported and medical records | History of clinical diagnosis or currently receiving medication | 3,5,8,9,14 | 8 |
| Talaei et al. | Singapore/2017 | 18 | 45–74 | both | 5027/45,411 | self-reported | History of clinical diagnosis | 1,3,5–9,13,15,19, 39,50,51 | 7 |
| Van et al. | Dutch/2012 | 13 | ≥55 | both | 456/4366 | registry | History of clinical diagnosis or currently receiving medication | 1,5–7,9,11–13,23,24, 34,38,42,43,46–48 | 7 |
| Villegas et al. | China/2006 | 5 | 40–70 | female | 1972/70,609 | self-reported | History of clinical diagnosis or fasting glucose ≥ 7 mmol/L on at least two occasions or an oral glucose tolerance test ≥ 11.1 mmol/L and/or currently receiving medication | 1,2,3,5–10,19, 28,45 | 7 |
| Virtanen et al. | Finnish/2017 | 19.3 | 42–60 | male | 432/2330 | self-reported, medical records and examination | History of clinical diagnosis, fasting plasma glucose ≥ 7.0 mmol/L or 2-h oral glucose ≥ 11.1 mmol/L | 1–12,17,21,25,27,29, 30,40,41,51,59–63 | 8 |
| Van Dam et al. | America/2002 | 12 | 40–75 | male | 1321/42,504 | self-reported, medical records and examination | An elevated plasma glucose concentration plus at least one classic symptom or at least two elevated plasma glucose concentrations on different occasions or treatment with insulin or oral hypoglycemic medication | 1–9,11,17,26, 27,51,58 | 8 |
References
- Kerner, W.; Brückel, J. Definition, Classification and Diagnosis of Diabetes Mellitus. Exp. Clin. Endocrinol. Diabetes 2018, 126, 406–410. [Google Scholar] [CrossRef] [Green Version]
- Cho, N.; Shaw, J.E.; Karuranga, S.; Huang, Y.D.; da Rocha Fernandes, J.D.; Ohlrogge, A.W.; Malanda, B. IDF Diabetes Atlas: Global estimates of diabetes prevalence for 2017 and projections for 2045. Diabetes Res. Clin. Pract. 2018, 138, 271–281. [Google Scholar] [CrossRef]
- Jannasch, F.; Kröger, J.; Schulze, M.B. Dietary Patterns and Type 2 Diabetes: A Systematic Literature Review and Meta-Analysis of Prospective Studies. J. Nutr. 2017, 147, 1174–1182. [Google Scholar] [CrossRef] [PubMed] [Green Version]
- Deed, G.; Deed, G.; Barlow, J.; Kawol, D.; Kilov, G.; Sharma, A.; Hwa, L.Y. Diet and diabetes. Aust. Fam. Physician 2015, 44, 192–196. [Google Scholar] [PubMed]
- Wolk, A. Potential health hazards of eating red meat. J. Intern. Med. 2017, 281, 106–122. [Google Scholar] [CrossRef]
- Pan, A.; Sun, Q.; Bernstein, A.M.; Schulze, M.B.; Manson, J.E.; Willett, W.C.; Hu, F.B. Red meat consumption and risk of type 2 diabetes: 3 cohorts of US adults and an updated meta-analysis. Am. J. Clin. Nutr. 2011, 94, 1088–1096. [Google Scholar] [CrossRef]
- Palli, D.; InterAct, C. Association between dietary meat consumption and incident type 2 diabetes: The EPIC-InterAct study. Diabetologia 2013, 56, 47–59. [Google Scholar] [CrossRef] [Green Version]
- Marí-Sanchis, A.; Díaz-Jurado, G.; Basterra-Gortari, F.J.; de la Fuente-Arrillaga, C.; Martínez-González, M.A.; Bes-Rastrollo, M. Association between pre-pregnancy consumption of meat, iron intake, and the risk of gestational diabetes: The SUN project. Eur. J. Nutr. 2018, 57, 939–949. [Google Scholar] [CrossRef]
- Talaei, M.; Wang, Y.L.; Yuan, J.M.; Pan, A.; Koh, W.P. Meat, Dietary Heme Iron, and Risk of Type 2 Diabetes Mellitus The Singapore Chinese Health Study. Am. J. Epidemiol. 2017, 186, 824–833. [Google Scholar] [CrossRef]
- Du, H.; Guo, Y.; Bennett, D.A.; Bragg, F.; Bian, Z.; Chadni, M.; Yu, C.; Chen, Y.; Tan, Y.; Millwood, I.Y.; et al. Red meat, poultry and fish consumption and risk of diabetes: A 9 year prospective cohort study of the China Kadoorie Biobank. Diabetologia 2020, 63, 767–779. [Google Scholar] [CrossRef] [PubMed] [Green Version]
- Löfvenborg, J.E.; Ahlqvist, E.; Alfredsson, L.; Andersson, T.; Groop, L.; Tuomi, T.; Wolk, A.; Carlsson, S. Consumption of red meat, genetic susceptibility, and risk of LADA and type 2 diabetes. Eur. J. Nutr. 2021, 60, 769–779. [Google Scholar] [CrossRef]
- Zelber-Sagi, S.; Ivancovsky-Wajcman, D.; Isakov, N.F.; Webb, M.; Orenstein, D.; Shibolet, O.; Kariv, R. High red and processed meat consumption is associated with non-alcoholic fatty liver disease and insulin resistance. J. Hepatol. 2018, 68, 1239–1246. [Google Scholar] [CrossRef] [PubMed]
- Lajous, M.; Tondeur, L.; Fagherazzi, G.; de Lauzon-Guillain, B.; Boutron-Ruaualt, M.C.; Clavel-Chapelon, F. Processed and Unprocessed Red Meat Consumption and Incident Type 2 Diabetes Among French Women. Diabetes Care 2012, 35, 128–130. [Google Scholar] [CrossRef] [PubMed] [Green Version]
- Männistö, S.; Kontto, J.; Kataja-Tuomola, M.; Albanes, D.; Virtamo, J. High processed meat consumption is a risk factor of type 2 diabetes in the Alpha-Tocopherol, Beta-Carotene Cancer Prevention study. Br. J. Nutr. 2010, 103, 1817–1822. [Google Scholar] [CrossRef] [PubMed]
- Van Dam, R.M.; Willett, W.C.; Rimm, E.B.; Stampfer, M.J.; Hu, F.B. Dietary fat and meat intake in relation to risk of type 2 diabetes in men. Diabetes Care 2002, 25, 417–424. [Google Scholar] [CrossRef] [PubMed] [Green Version]
- Steinbrecher, A.; Erber, E.; Grandinetti, A.; Kolonel, L.N.; Maskarinec, G. Meat consumption and risk of type 2 diabetes: The Multiethnic Cohort. Public Health Nutr. 2011, 14, 568–574. [Google Scholar] [CrossRef] [PubMed] [Green Version]
- Son, J.; Lee, Y.; Park, K. Effects of processed red meat consumption on the risk of type 2 diabetes and cardiovascular diseases among Korean adults: The Korean Genome and Epidemiology Study. Eur. J. Nutr. 2019, 58, 2477–2484. [Google Scholar] [CrossRef]
- Virtanen, H.E.; Koskinen, T.T.; Voutilainen, S.; Mursu, J.; Tuomainen, T.P.; Kokko, P.; Virtanen, J.K. Intake of different dietary proteins and risk of type 2 diabetes in men: The Kuopio Ischaemic Heart Disease Risk Factor Study. Br. J. Nutr. 2017, 117, 882–893. [Google Scholar] [CrossRef] [Green Version]
- Mari-Sanchis, A.; Gea, A.; Basterra-Gortari, F.J.; Martinez-Gonzalez, M.A.; Beunza, J.J.; Bes-Rastrollo, M. Meat Consumption and Risk of Developing Type 2 Diabetes in the SUN Project: A Highly Educated Middle-Class Population. PLoS ONE 2016, 11, 15. [Google Scholar] [CrossRef] [Green Version]
- Ericson, U.; Hellstrand, S.; Brunkwall, L.; Schulz, C.A.; Sonestedt, E.; Wallström, P.; Gullberg, B.; Wirfält, E.; Orho-Melander, M. Food sources of fat may clarify the inconsistent role of dietary fat intake for incidence of type 2 diabetes. Am. J. Clin. Nutr. 2015, 101, 1065–1080. [Google Scholar] [CrossRef]
- Van Woudenbergh, G.J.; Kuijsten, A.; Tigcheler, B.; Sijbrands, E.J.; Van Rooij, F.J.; Hofman, A.; Witteman, J.C.; Feskens, E.J. Meat Consumption and Its Association With C-Reactive Protein and Incident Type 2 Diabetes The Rotterdam Study. Diabetes Care 2012, 35, 1499–1505. [Google Scholar] [CrossRef] [Green Version]
- Kurotani, K.; Nanri, A.; Goto, A.; Mizoue, T.; Noda, M.; Oba, S.; Kato, M.; Matsushita, Y.; Inoue, M.; Tsugane, S.; et al. Red meat consumption is associated with the risk of type 2 diabetes in men but not in women: A Japan Public Health Center-based Prospective Study. Br. J. Nutr. 2013, 110, 1910–1918. [Google Scholar] [CrossRef] [PubMed] [Green Version]
- Fretts, A.M.; Howard, B.V.; McKnight, B.; Duncan, G.E.; Beresford, S.A.; Mete, M.; Eilat-Adar, S.; Zhang, Y.; Siscovick, D.S. Associations of processed meat and unprocessed red meat intake with incident diabetes: The Strong Heart Family Study. Am. J. Clin. Nutr. 2012, 95, 752–758. [Google Scholar] [CrossRef] [Green Version]
- Villegas, R.; Shu, X.O.; Gao, Y.T.; Yang, G.; Cai, H.; Li, H.; Zheng, W. The association of meat intake and the risk of type 2 diabetes may be modified by body weight. Int. J. Med Sci. 2006, 3, 152–159. [Google Scholar] [CrossRef] [PubMed] [Green Version]
- Fan, M.; Li, Y.; Wang, C.; Mao, Z.; Zhou, W.; Zhang, L.; Yang, X.; Cui, S.; Li, L. Dietary Protein Consumption and the Risk of Type 2 Diabetes: ADose-Response Meta-Analysis of Prospective Studies. Nutrients 2019, 11, 16. [Google Scholar] [CrossRef] [Green Version]
- Tian, S.; Xu, Q.; Jiang, R.; Han, T.; Sun, C.; Na, L. Dietary Protein Consumption and the Risk of Type 2 Diabetes: A Systematic Review and Meta-Analysis of Cohort Studies. Nutrients 2017, 9, 17. [Google Scholar] [CrossRef] [PubMed] [Green Version]
- Neuenschwander, M.; Ballon, A.; Weber, K.S.; Norat, T.; Aune, D. Role of diet in type 2 diabetes incidence: Umbrella review of meta-analyses of prospective observational studies. BMJ-Br. Med J. 2019, 366, 19. [Google Scholar] [CrossRef] [Green Version]
- Micha, R.; Michas, G.; Mozaffarian, D. Unprocessed Red and Processed Meats and Risk of Coronary Artery Disease and Type 2 Diabetes—An Updated Review of the Evidence. Curr. Atheroscler. Rep. 2012, 14, 515–524. [Google Scholar] [CrossRef] [Green Version]
- Schwingshackl, L.; Hoffmann, G.; Lampousi, A.M.; Knüppel, S.; Iqbal, K.; Schwedhelm, C.; Bechthold, A.; Schlesinger, S.; Boeing, H. Food groups and risk of type 2 diabetes mellitus: A systematic review and meta-analysis of prospective studies. Eur. J. Epidemiol. 2017, 32, 363–375. [Google Scholar] [CrossRef] [Green Version]
- McAfee, A.J.; McSorley, E.M.; Cuskelly, G.J.; Moss, B.W.; Wallace, J.M.; Bonham, M.P.; Fearon, A.M. Red meat consumption: An overview of the risks and benefits. Meat Sci. 2010, 84, 1–13. [Google Scholar] [CrossRef]
- Panagiotakos, D.B.; Tzima, N.; Pitsavos, C.; Chrysohoou, C.; Papakonstantinou, E.; Zampelas, A.; Stefanadis, C. The relationship between dietary habits, blood glucose and insulin levels among people without cardiovascular disease and type 2 diabetes; the ATTICA study. Rev. Diabet. Stud. RDS 2005, 2, 208–215. [Google Scholar] [CrossRef] [Green Version]
- Rouhani, M.H.; Salehi-Abargouei, A.; Surkan, P.J.; Azadbakht, L.J.O.R. Is there a relationship between red or processed meat intake and obesity? A systematic review and meta-analysis of observational studies. Obes. Rev. 2014, 15, 740–748. [Google Scholar] [CrossRef] [PubMed]
- Bouvard, V.; Loomis, D.; Guyton, K.Z.; Grosse, Y.; El Ghissassi, F.; Benbrahim-Tallaa, L.; Guha, N.; Mattock, H.; Straif, K.; Corpet, D. Carcinogenicity of consumption of red and processed meat. Lancet Oncol. 2015, 16, 1599–1600. [Google Scholar] [CrossRef] [Green Version]
- Kouvari, M.; Notara, V.; Kalogeropoulos, N.; Panagiotakos, D.B. Diabetes mellitus associated with processed and unprocessed red meat: An overview. Int. J. Food Sci. Nutr. 2016, 67, 735–743. [Google Scholar] [CrossRef]
- Aune, D.; Ursin, G.; Veierød, M.B. Meat consumption and the risk of type 2 diabetes: A systematic review and meta-analysis of cohort studies. Diabetologia 2009, 52, 2277–2287. [Google Scholar] [CrossRef] [PubMed] [Green Version]
- Knobloch, K.; Yoon, U.; Vogt, P.M. Preferred reporting items for systematic reviews and meta-analyses (PRISMA) statement and publication bias. J. Cranio-Maxillofac. Surg. 2011, 39, 91–92. [Google Scholar] [CrossRef] [PubMed]
- Stang, A. Critical evaluation of the Newcastle-Ottawa scale for the assessment of the quality of nonrandomized studies in meta-analyses. Eur. J. Epidemiol. 2010, 25, 603–605, Editorial Material. [Google Scholar] [CrossRef] [Green Version]
- Mantel, N.; Haenszel, W. Statistical aspects of the analysis of data from retrospective studies of disease. J. Natl. Cancer Inst. 1959, 22, 719–748. [Google Scholar]
- DerSimonian, R.; Kacker, R. Random-effects model for meta-analysis of clinical trials: An update. Contemp. Clin. Trials 2007, 28, 105–114. [Google Scholar] [CrossRef] [PubMed]
- Dersimonian, R.; Laird, N. Metaanalysis in clinical-trials. Control. Clin. Trials 1986, 7, 177–188. [Google Scholar] [CrossRef]
- Higgins, J.P.T.; Thompson, S.G. Quantifying heterogeneity in a meta-analysis. Stat. Med. 2002, 21, 1539–1558. [Google Scholar] [CrossRef] [PubMed]
- Normand, S.L.T. Meta-analysis: Formulating, evaluating, combining, and reporting. Stat. Med. 1999, 18, 321–359. [Google Scholar] [CrossRef]
- Seagroatt, V.; Stratton, I. Bias in meta-analysis detected by a simple, graphical test - Test had 10% false positive rate. Br. Med. J. 1998, 316, 470. [Google Scholar]
- Orsini, N.; Bellocco, R.; Greenland, S. Generalized least squares for trend estimation of summarized dose-response data. Stata J. 2006, 6, 40–57. [Google Scholar] [CrossRef] [Green Version]
- Greenland, S.; Longnecker, M.P. Methods for trend estimation from summarized dose-response data, with applications to metaanalysis. Am. J. Epidemiol. 1992, 135, 1301–1309. [Google Scholar] [CrossRef]
- Moskal, A.; Norat, T.; Ferrari, P.; Riboli, E. Alcohol intake and colorectal cancer risk: A dose-response meta-analysis of published cohort studies. Int. J. Cancer 2007, 120, 664–671. [Google Scholar] [CrossRef] [PubMed]
- Pan, A.; Sun, Q.; Bernstein, A.M.; Manson, J.E.; Willett, W.C.; Hu, F.B. Changes in Red Meat Consumption and Subsequent Risk of Type 2 Diabetes Mellitus Three Cohorts of US Men and Women. JAMA Intern. Med. 2013, 173, 1328–1335. [Google Scholar] [CrossRef]
- Wittenbecher, C.; Mühlenbruch, K.; Kröger, J.; Jacobs, S.; Kuxhaus, O.; Floegel, A.; Fritsche, A.; Pischon, T.; Prehn, C.; Adamski, J.; et al. Amino acids, lipid metabolites, and ferritin as potential mediators linking red meat consumption to type 2 diabetes. Am. J. Clin. Nutr. 2015, 101, 1241–1250. [Google Scholar] [CrossRef] [Green Version]
- Shang, X.; Scott, D.; Hodge, A.M.; English, D.R.; Giles, G.G.; Ebeling, P.R.; Sanders, K.M. Dietary protein intake and risk of type 2 diabetes: Results from the Melbourne Collaborative Cohort Study and a meta-analysis of prospective studies. Am. J. Clin. Nutr. 2016, 104, 1352–1365. [Google Scholar] [CrossRef]
- Dehghan, A.; Van Hoek, M.; Sijbrands, E.J.; Hofman, A.; Witteman, J.C. High Serum Uric Acid as a Novel Risk Factor for Type 2 Diabetes. Diabetes Care 2008, 31, 361–362. [Google Scholar] [CrossRef] [Green Version]
- Ibsen, D.B.; Warberg, C.K.; Würtz, A.M.L.; Overvad, K.; Dahm, C.C. Substitution of red meat with poultry or fish and risk of type 2 diabetes: A Danish cohort study. Eur. J. Nutr. 2019, 58, 2705–2712. [Google Scholar] [CrossRef] [PubMed]
- Kouvari, M.; Tyrovolas, S.; Panagiotakos, D.B. Red meat consumption and healthy ageing: A review. Maturitas 2016, 84, 17–24. [Google Scholar] [CrossRef] [PubMed]
- Wang, X.; Lin, X.; Ouyang, Y.Y.; Liu, J.; Zhao, G.; Pan, A.; Hu, F.B. Red and processed meat consumption and mortality: Dose-response meta-analysis of prospective cohort studies. Public Health Nutr. 2016, 19, 893–905. [Google Scholar] [CrossRef] [Green Version]
- Trafialek, J.; Kolanowski, W. Dietary exposure to meat-related carcinogenic substances: Is there a way to estimate the risk? Int. J. Food Sci. Nutr. 2014, 65, 774–780. [Google Scholar] [CrossRef]
- Kim, Y.; Keogh, J.; Clifton, P. A review of potential metabolic etiologies of the observed association between red meat consumption and development of type 2 diabetes mellitus. Metab.-Clin. Exp. 2015, 64, 768–779. [Google Scholar] [CrossRef]
- Daniel, C.R.; Cross, A.J.; Koebnick, C.; Sinha, R. Trends in meat consumption in the USA. Public Health Nutr. 2011, 14, 575–583. [Google Scholar] [CrossRef] [Green Version]
- Würtz, A.M.L.; Jakobsen, M.U.; Bertoia, M.L.; Hou, T.; Schmidt, E.B.; Willett, W.C.; Overvad, K.; Sun, Q.; Manson, J.E.; Hu, F.B.; et al. Replacing the consumption of red meat with other major dietary protein sources and risk of type 2 diabetes mellitus: A prospective cohort study. Am. J. Clin. Nutr. 2021, 113, 612–621. [Google Scholar] [CrossRef]
| Subgroup | No. of Included Studies | RR (95% CI) | p Value | I2 |
|---|---|---|---|---|
| Overall | 7 | 1.27 (1.15, 1.40) | 81.40% | |
| Gender | <0.01 | |||
| Both | 2 | 1.05 (0.97, 1.14) | 0.00% | |
| Male | 4 | 1.41 (1.21, 1.64) | 61.90% | |
| Female | 5 | 1.30 (1.20, 1.40) | 44.10% | |
| Location | <0.01 | |||
| Europe | 2 | 1.26 (1.06, 1.50) | 0.00% | |
| US | 2 | 1.40 (1.28, 1.55) | 73.90% | |
| Asia | 3 | 1.06 (0.98, 1.14) | 0.00% | |
| Follow-up | 0.15 | |||
| <10 years | 1 | 1.11 (0.92, 1.33) | 0.00% | |
| ≥10 years | 6 | 1.29 (1.16, 1.44) | 86.10% | |
| Sample size | 0.10 | |||
| <10,000 | 2 | 1.08 (0.89, 1.30) | 0.00% | |
| ≥10,000 | 3 | 1.29 (1.16, 1.44) | 84.10% | |
| No. of Case | 0.47 | |||
| <5000 | 4 | 1.23 (1.09, 1.38) | 53.20% | |
| ≥5000 | 3 | 1.32 (1.12, 1.57) | 92.60% |
| Subgroup | No. of Included Studies | RR (95% CI) | p Value | I2 |
|---|---|---|---|---|
| Overall | 14 | 1.15 (1.08, 1.23) | 67.90% | |
| Gender | <0.01 | |||
| Both | 5 | 1.06 (0.99, 1.14) | 0.00% | |
| Male | 7 | 1.24 (1.11, 1.40) | 60.40% | |
| Female | 7 | 1.13 (1.02, 1.25) | 73.20% | |
| Location | 0.01 | |||
| Europe | 7 | 1.08 (0.98, 1.18) | 41.50% | |
| US | 4 | 1.27 (1.18, 1.36) | 39.70% | |
| Asia | 3 | 1.10 (0.94, 1.29) | 60.60% | |
| Follow-up | 0.47 | |||
| <10 years | 3 | 1.07 (0.84, 1.35) | 59.90% | |
| ≥10 years | 11 | 1.17 (1.09, 1.25) | 67.70% | |
| Sample size | 0.12 | |||
| <10,000 | 3 | 0.99 (0.82, 1.20) | 8.40% | |
| ≥10,000 | 11 | 1.17 (1.09, 1.25) | 70.20% | |
| No. of Case | 0.02 | |||
| <5000 | 10 | 1.09 (0.99, 1.19) | 55.10% | |
| ≥5000 | 4 | 1.25 (1.15, 1.35) | 65.00% | |
Publisher’s Note: MDPI stays neutral with regard to jurisdictional claims in published maps and institutional affiliations. |
© 2021 by the authors. Licensee MDPI, Basel, Switzerland. This article is an open access article distributed under the terms and conditions of the Creative Commons Attribution (CC BY) license (https://creativecommons.org/licenses/by/4.0/).
Share and Cite
Zhang, R.; Fu, J.; Moore, J.B.; Stoner, L.; Li, R. Processed and Unprocessed Red Meat Consumption and Risk for Type 2 Diabetes Mellitus: An Updated Meta-Analysis of Cohort Studies. Int. J. Environ. Res. Public Health 2021, 18, 10788. https://doi.org/10.3390/ijerph182010788
Zhang R, Fu J, Moore JB, Stoner L, Li R. Processed and Unprocessed Red Meat Consumption and Risk for Type 2 Diabetes Mellitus: An Updated Meta-Analysis of Cohort Studies. International Journal of Environmental Research and Public Health. 2021; 18(20):10788. https://doi.org/10.3390/ijerph182010788
Chicago/Turabian StyleZhang, Rui, Jialin Fu, Justin B. Moore, Lee Stoner, and Rui Li. 2021. "Processed and Unprocessed Red Meat Consumption and Risk for Type 2 Diabetes Mellitus: An Updated Meta-Analysis of Cohort Studies" International Journal of Environmental Research and Public Health 18, no. 20: 10788. https://doi.org/10.3390/ijerph182010788
APA StyleZhang, R., Fu, J., Moore, J. B., Stoner, L., & Li, R. (2021). Processed and Unprocessed Red Meat Consumption and Risk for Type 2 Diabetes Mellitus: An Updated Meta-Analysis of Cohort Studies. International Journal of Environmental Research and Public Health, 18(20), 10788. https://doi.org/10.3390/ijerph182010788