
Classroom Temperature and Learner Absenteeism in Public Primary Schools in the Eastern Cape, South Africa

 , , and
Abstract
:1. Introduction
2. Materials and Methods
2.1. Study Design
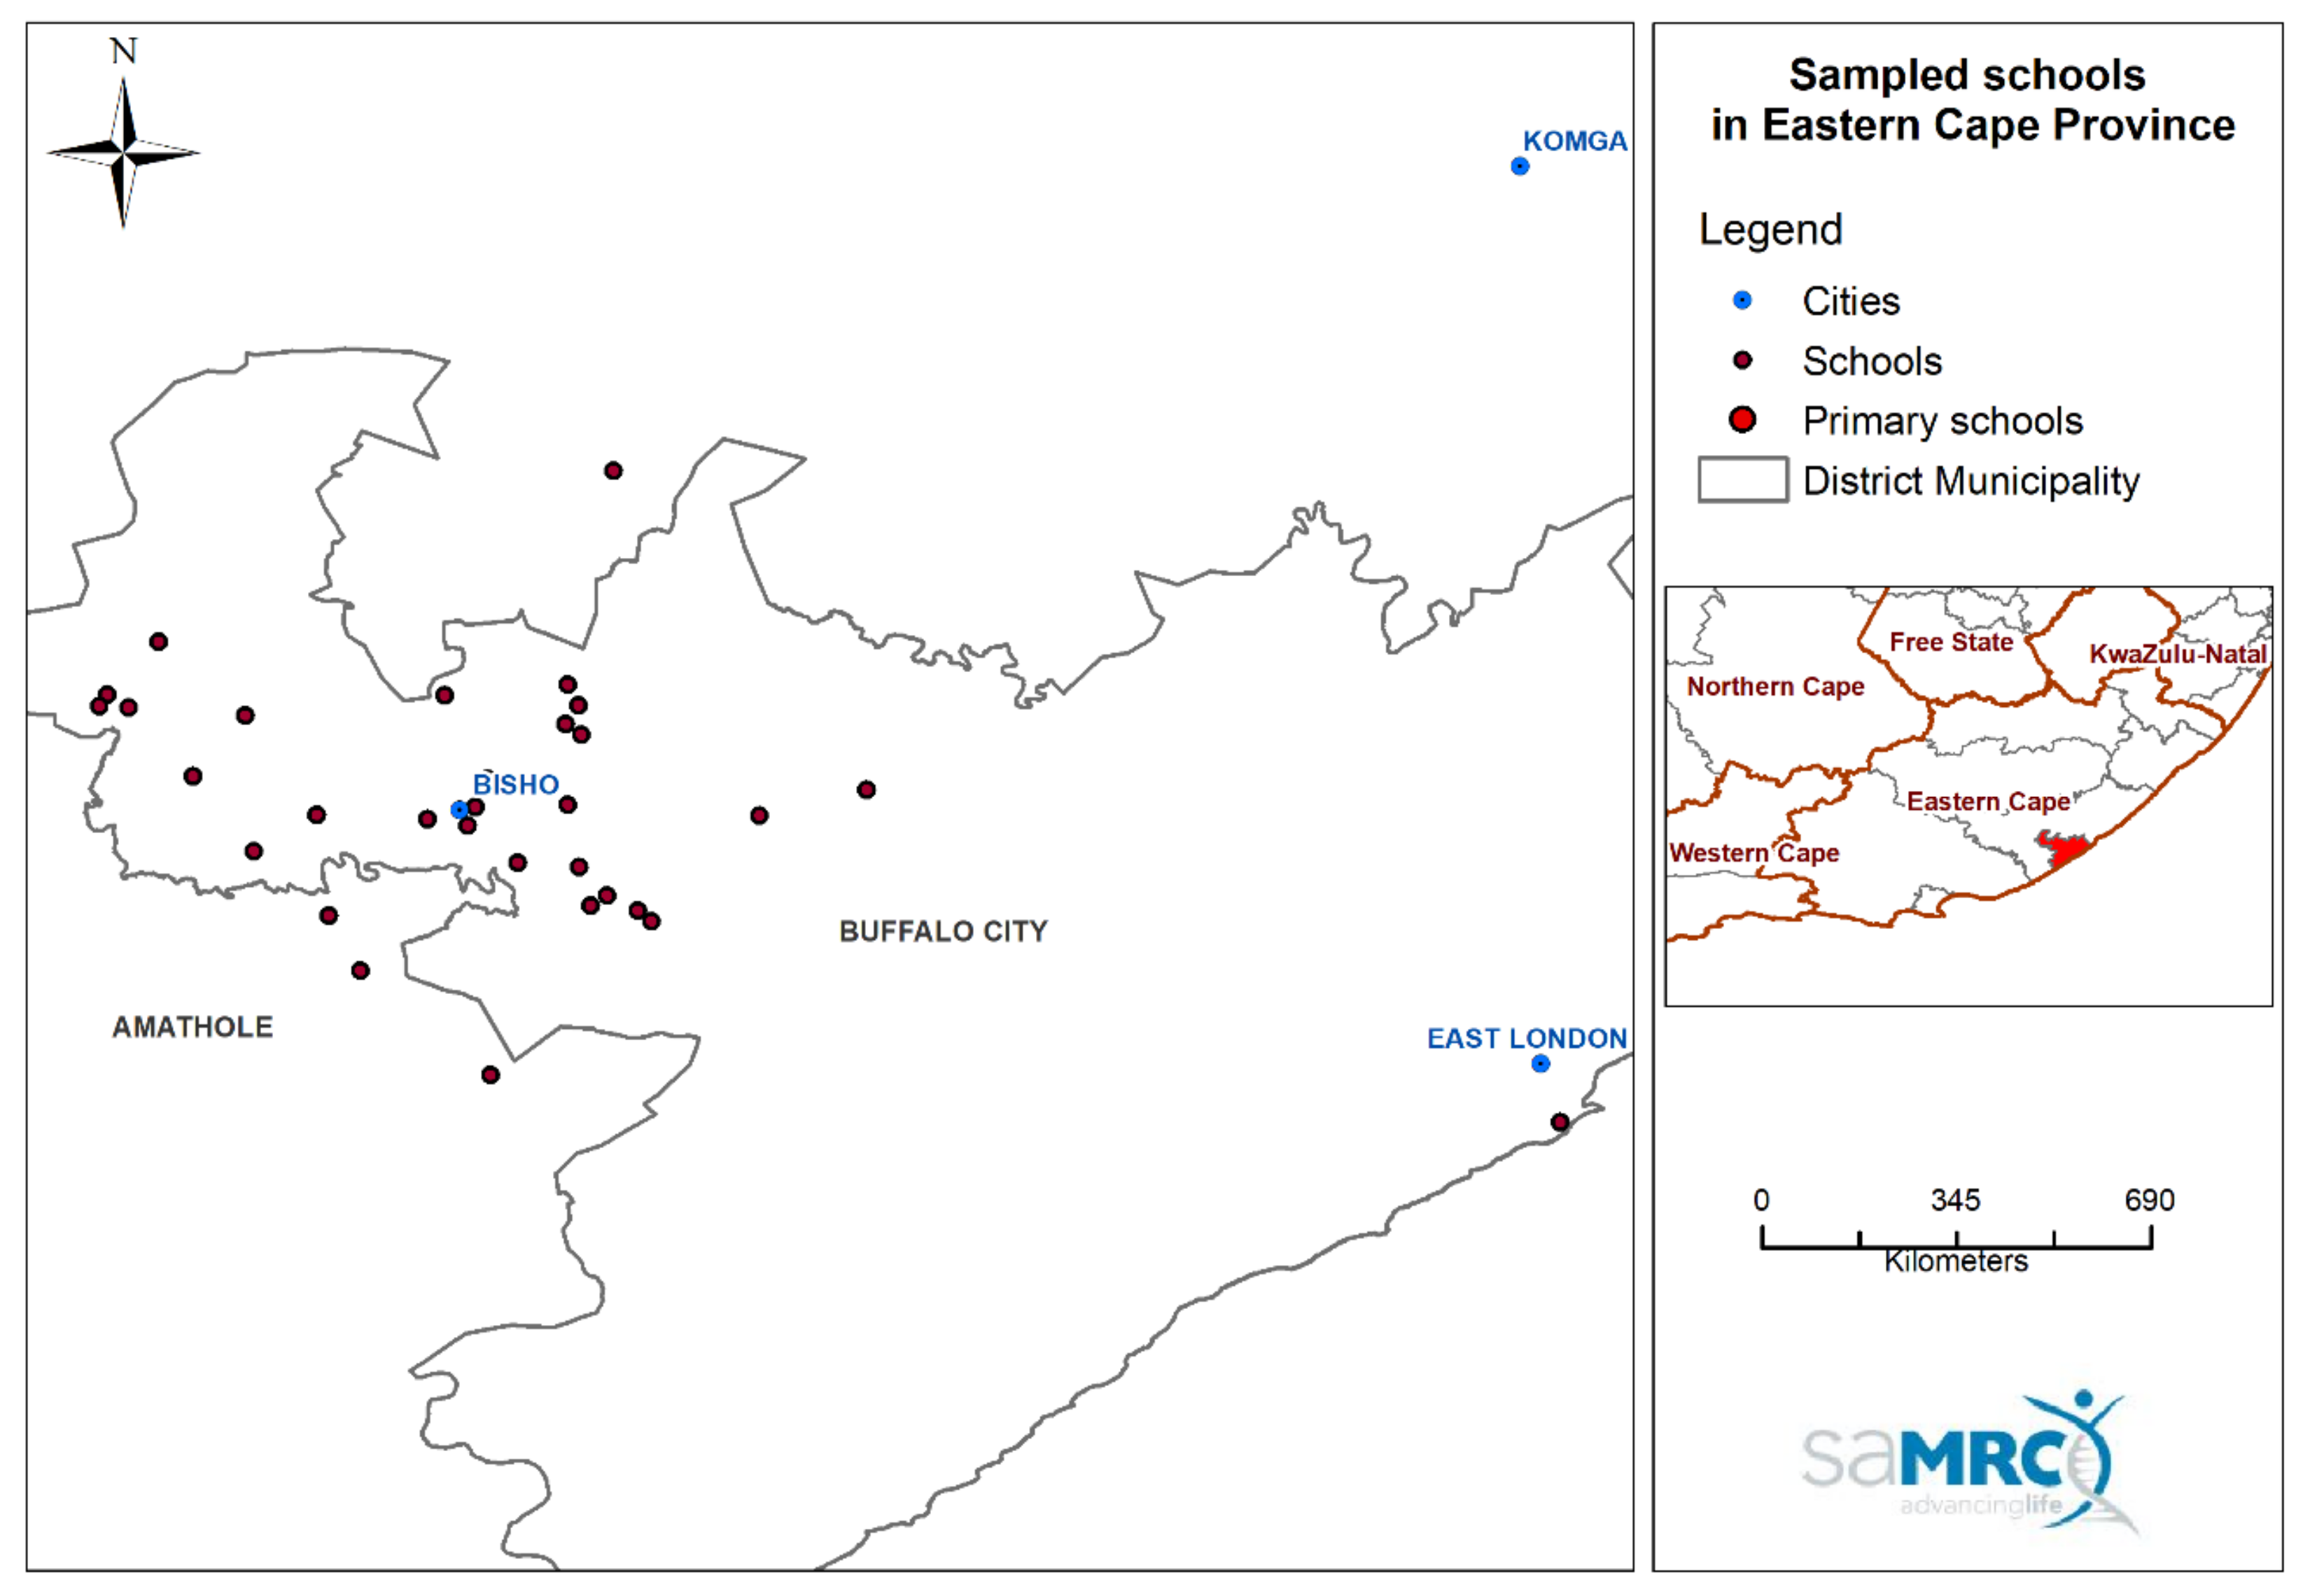
2.2. Study Area
2.3. Study Sample and Procedures
2.4. Absenteeism Data
2.5. Learner’s Parent/Guardian Questionnaire
2.6. Temperature and Humidity Measurements: Indoor Classroom and Outdoor (Ambient)
2.7. School Classroom Characteristics Observation Checklist
2.8. Data Processing and Statistical Analyses
3. Results
3.1. Sample Descriptives
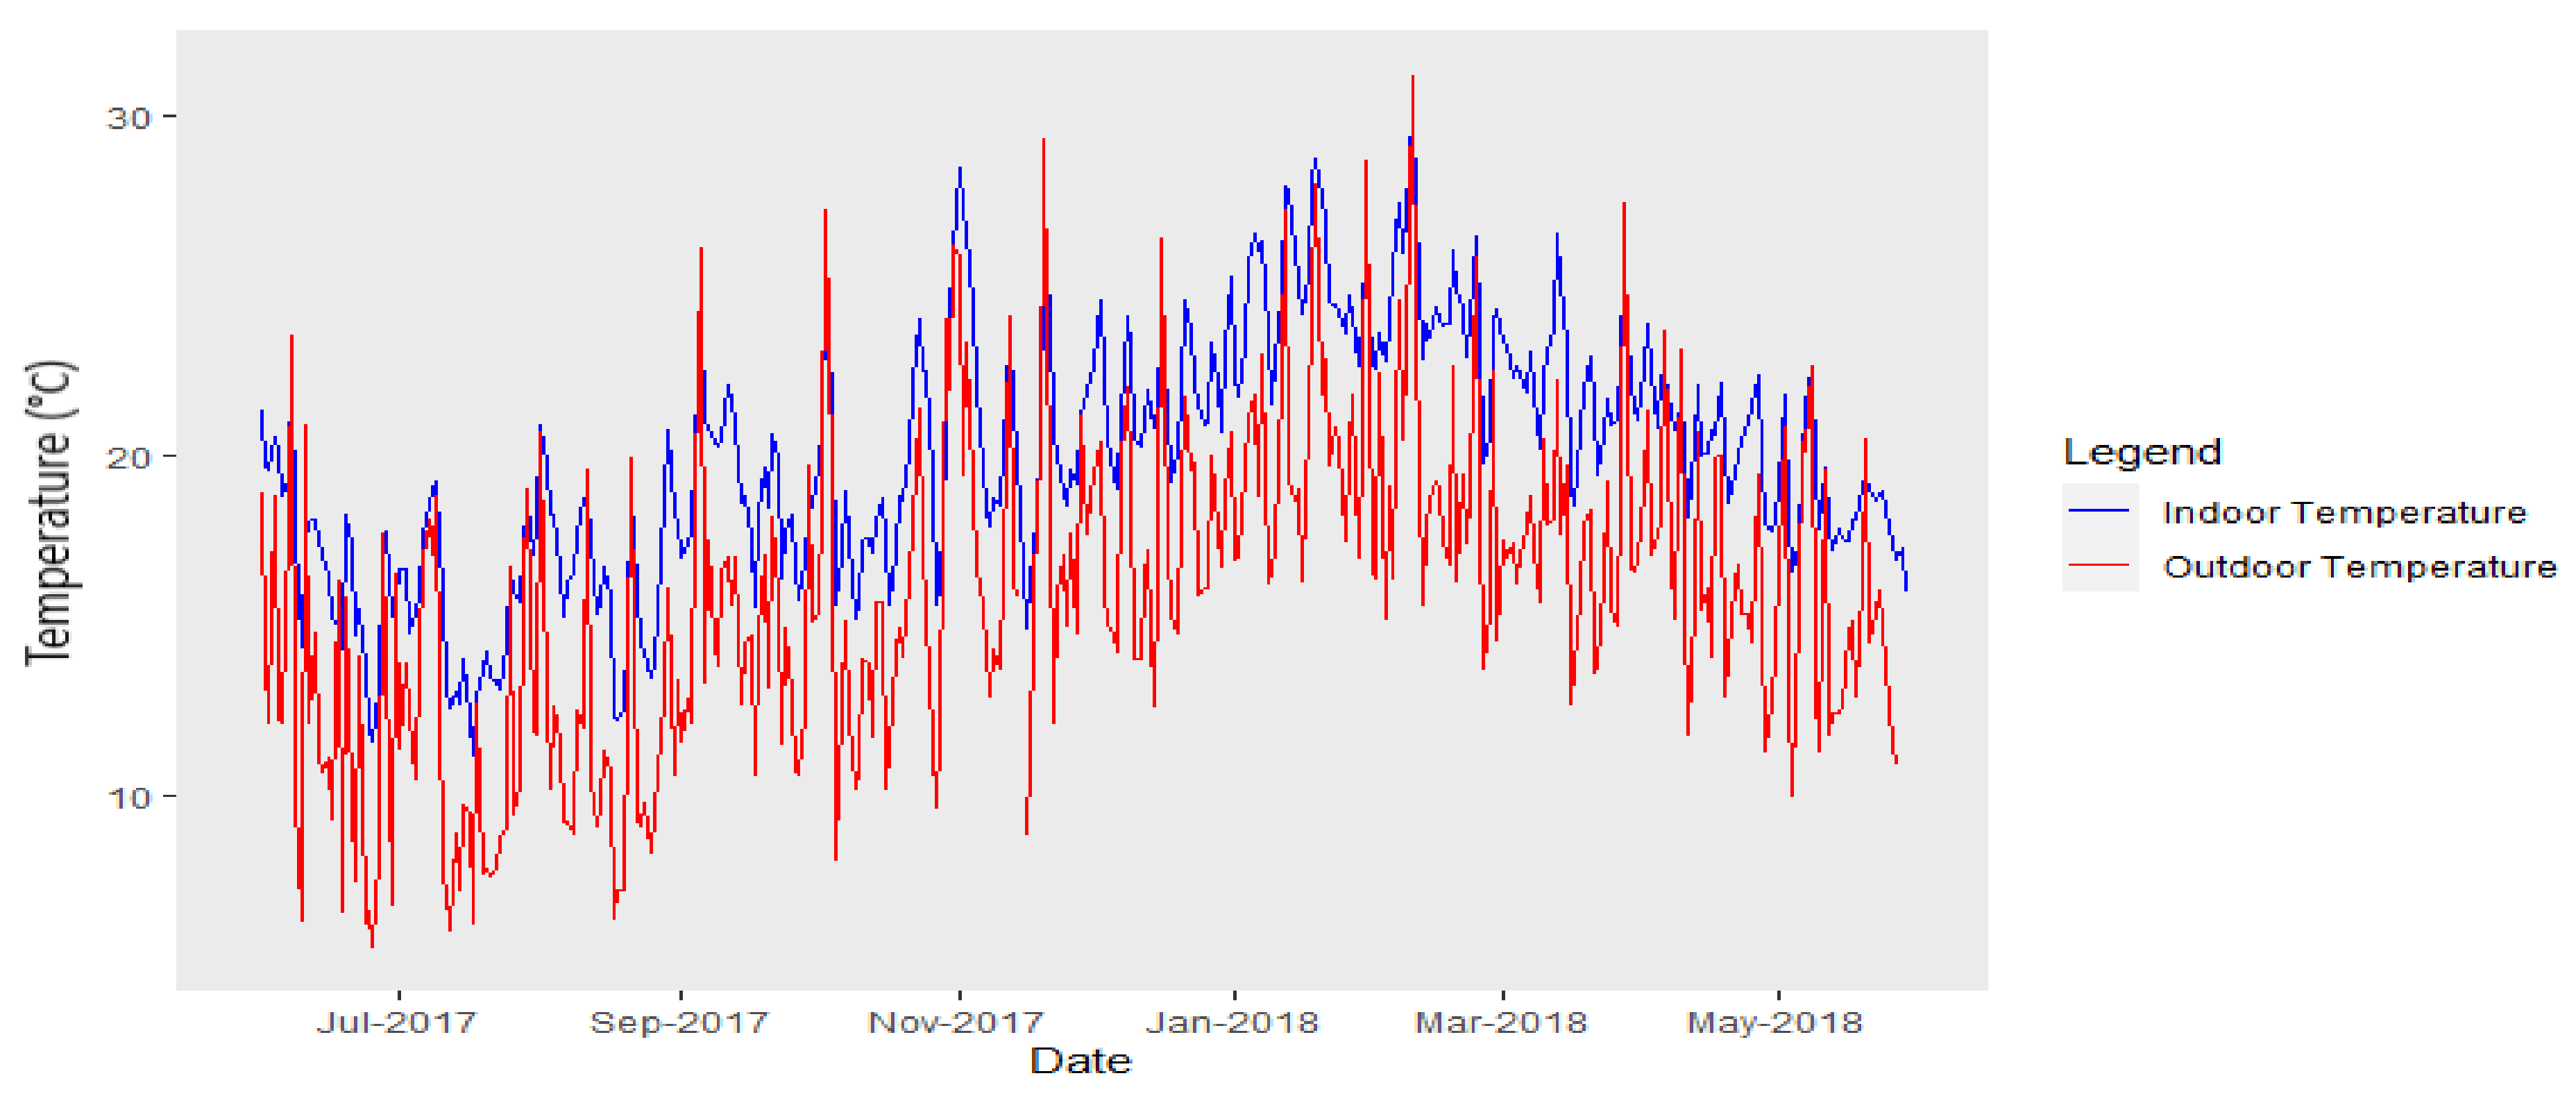
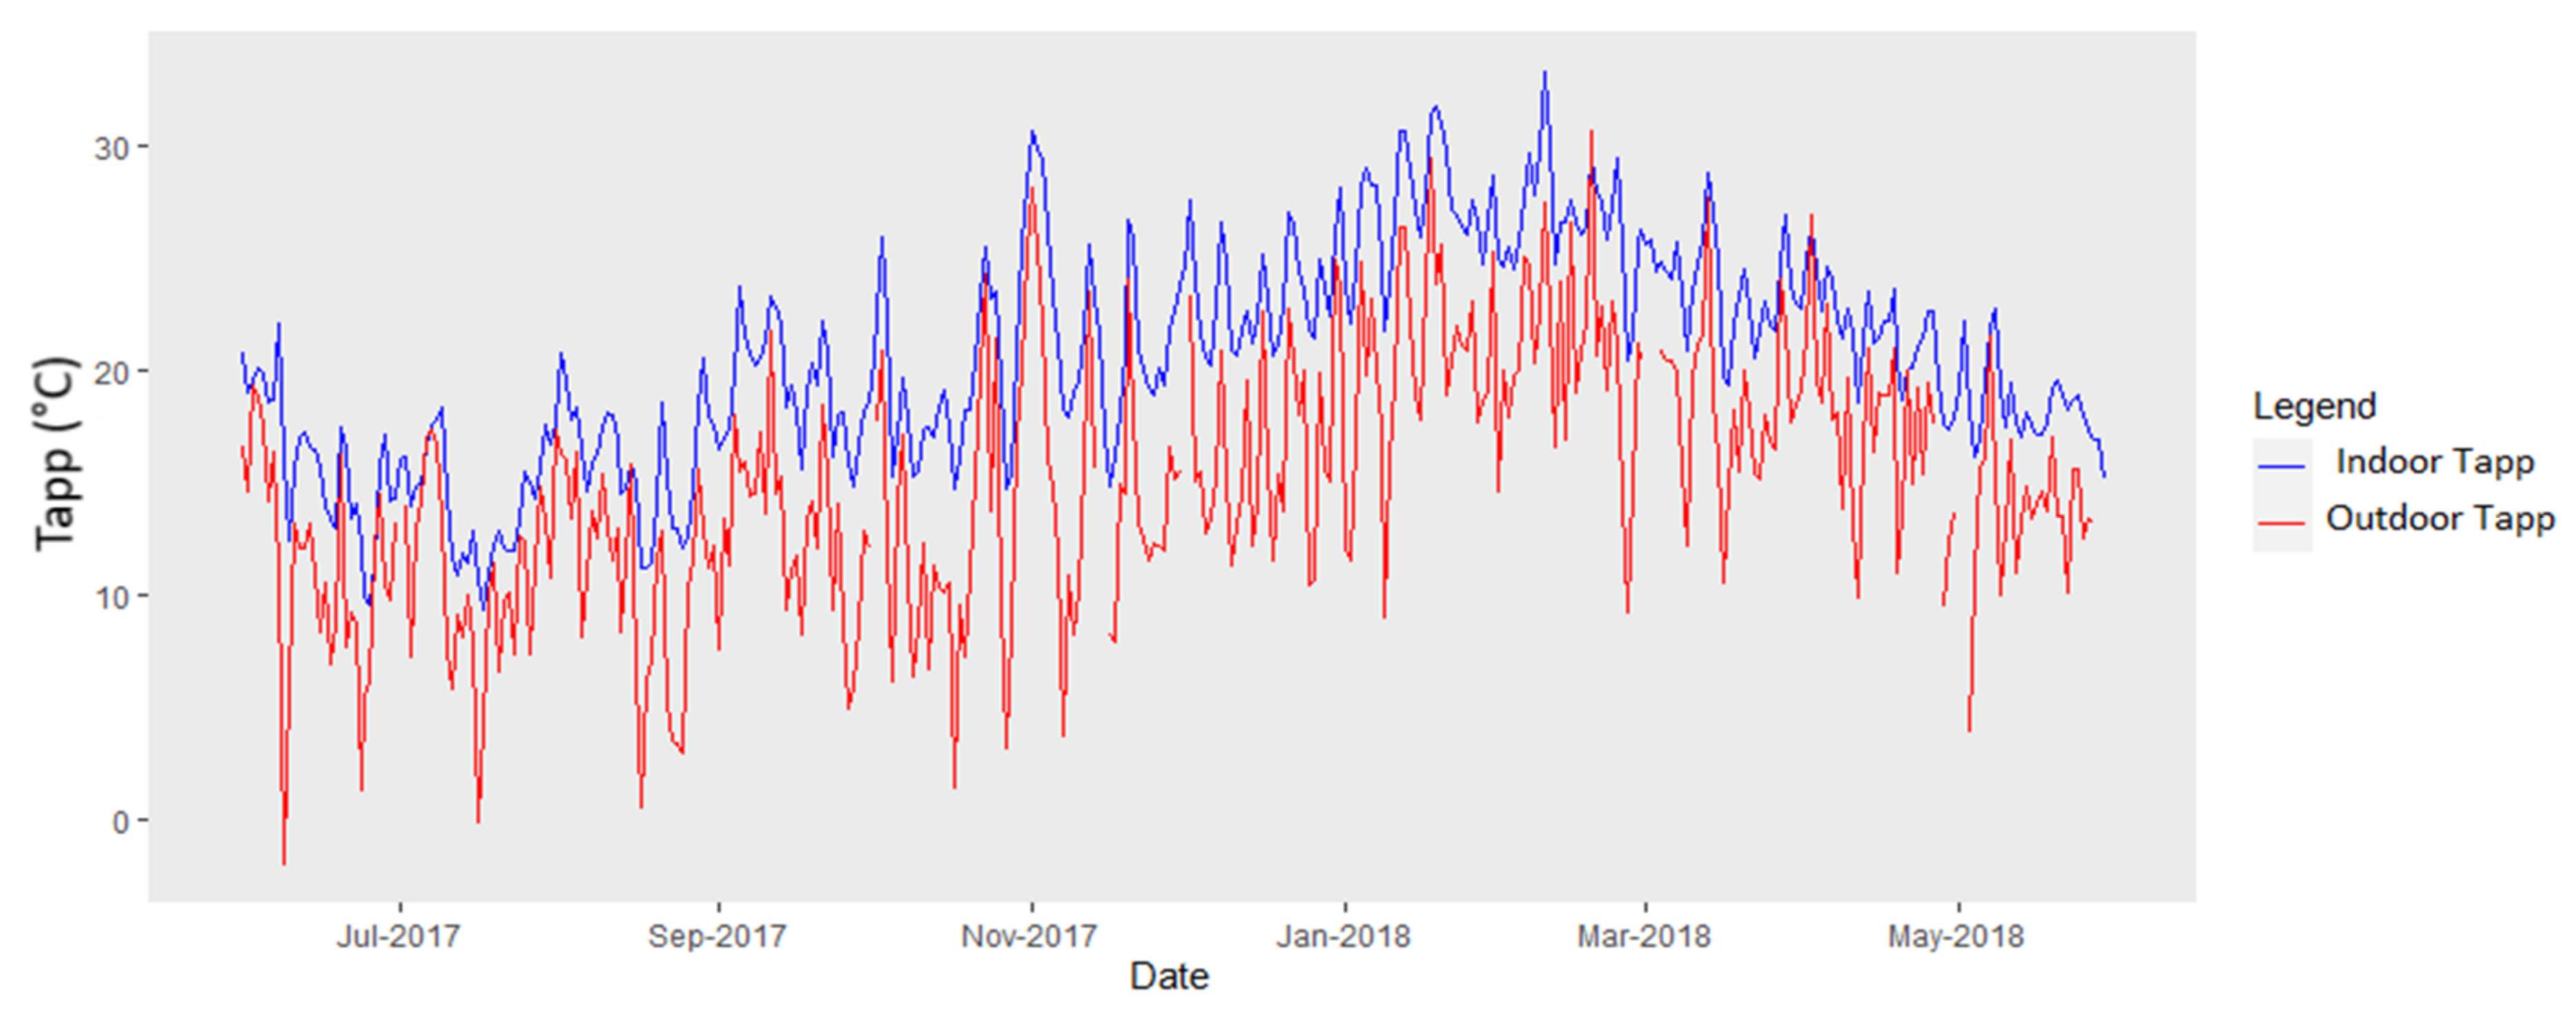
3.2. Indoor Classroom Temperature and Outdoor Temperature
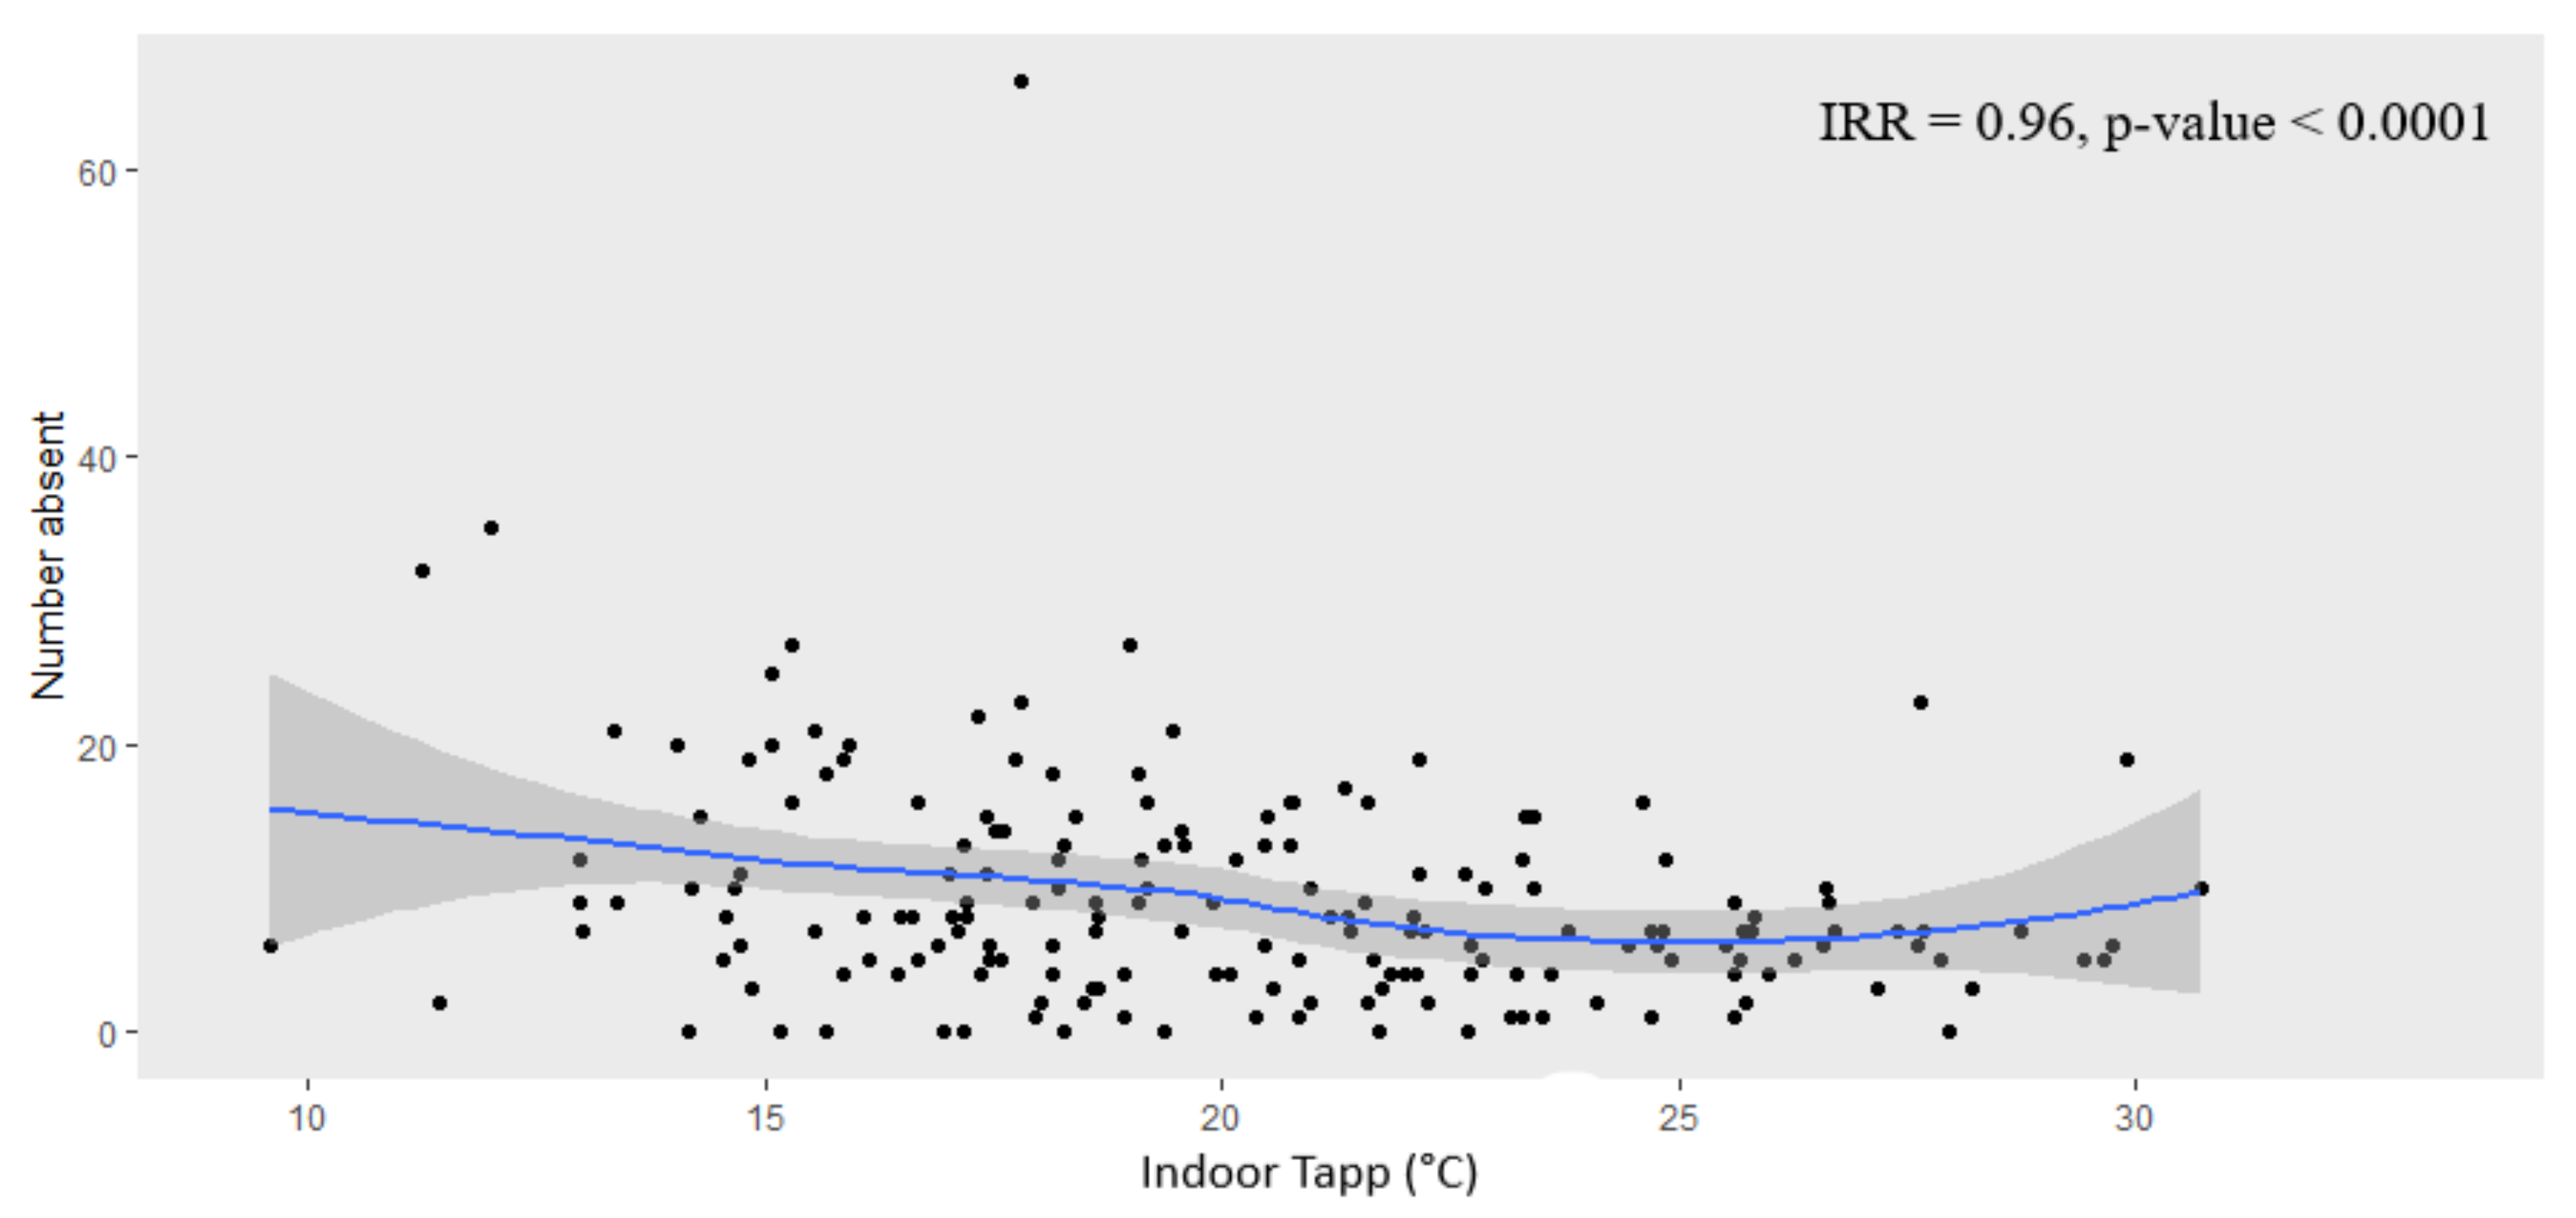
3.3. Absenteeism and Indoor Classroom Apparent Temperature
3.4. School Classroom Building Characteristics
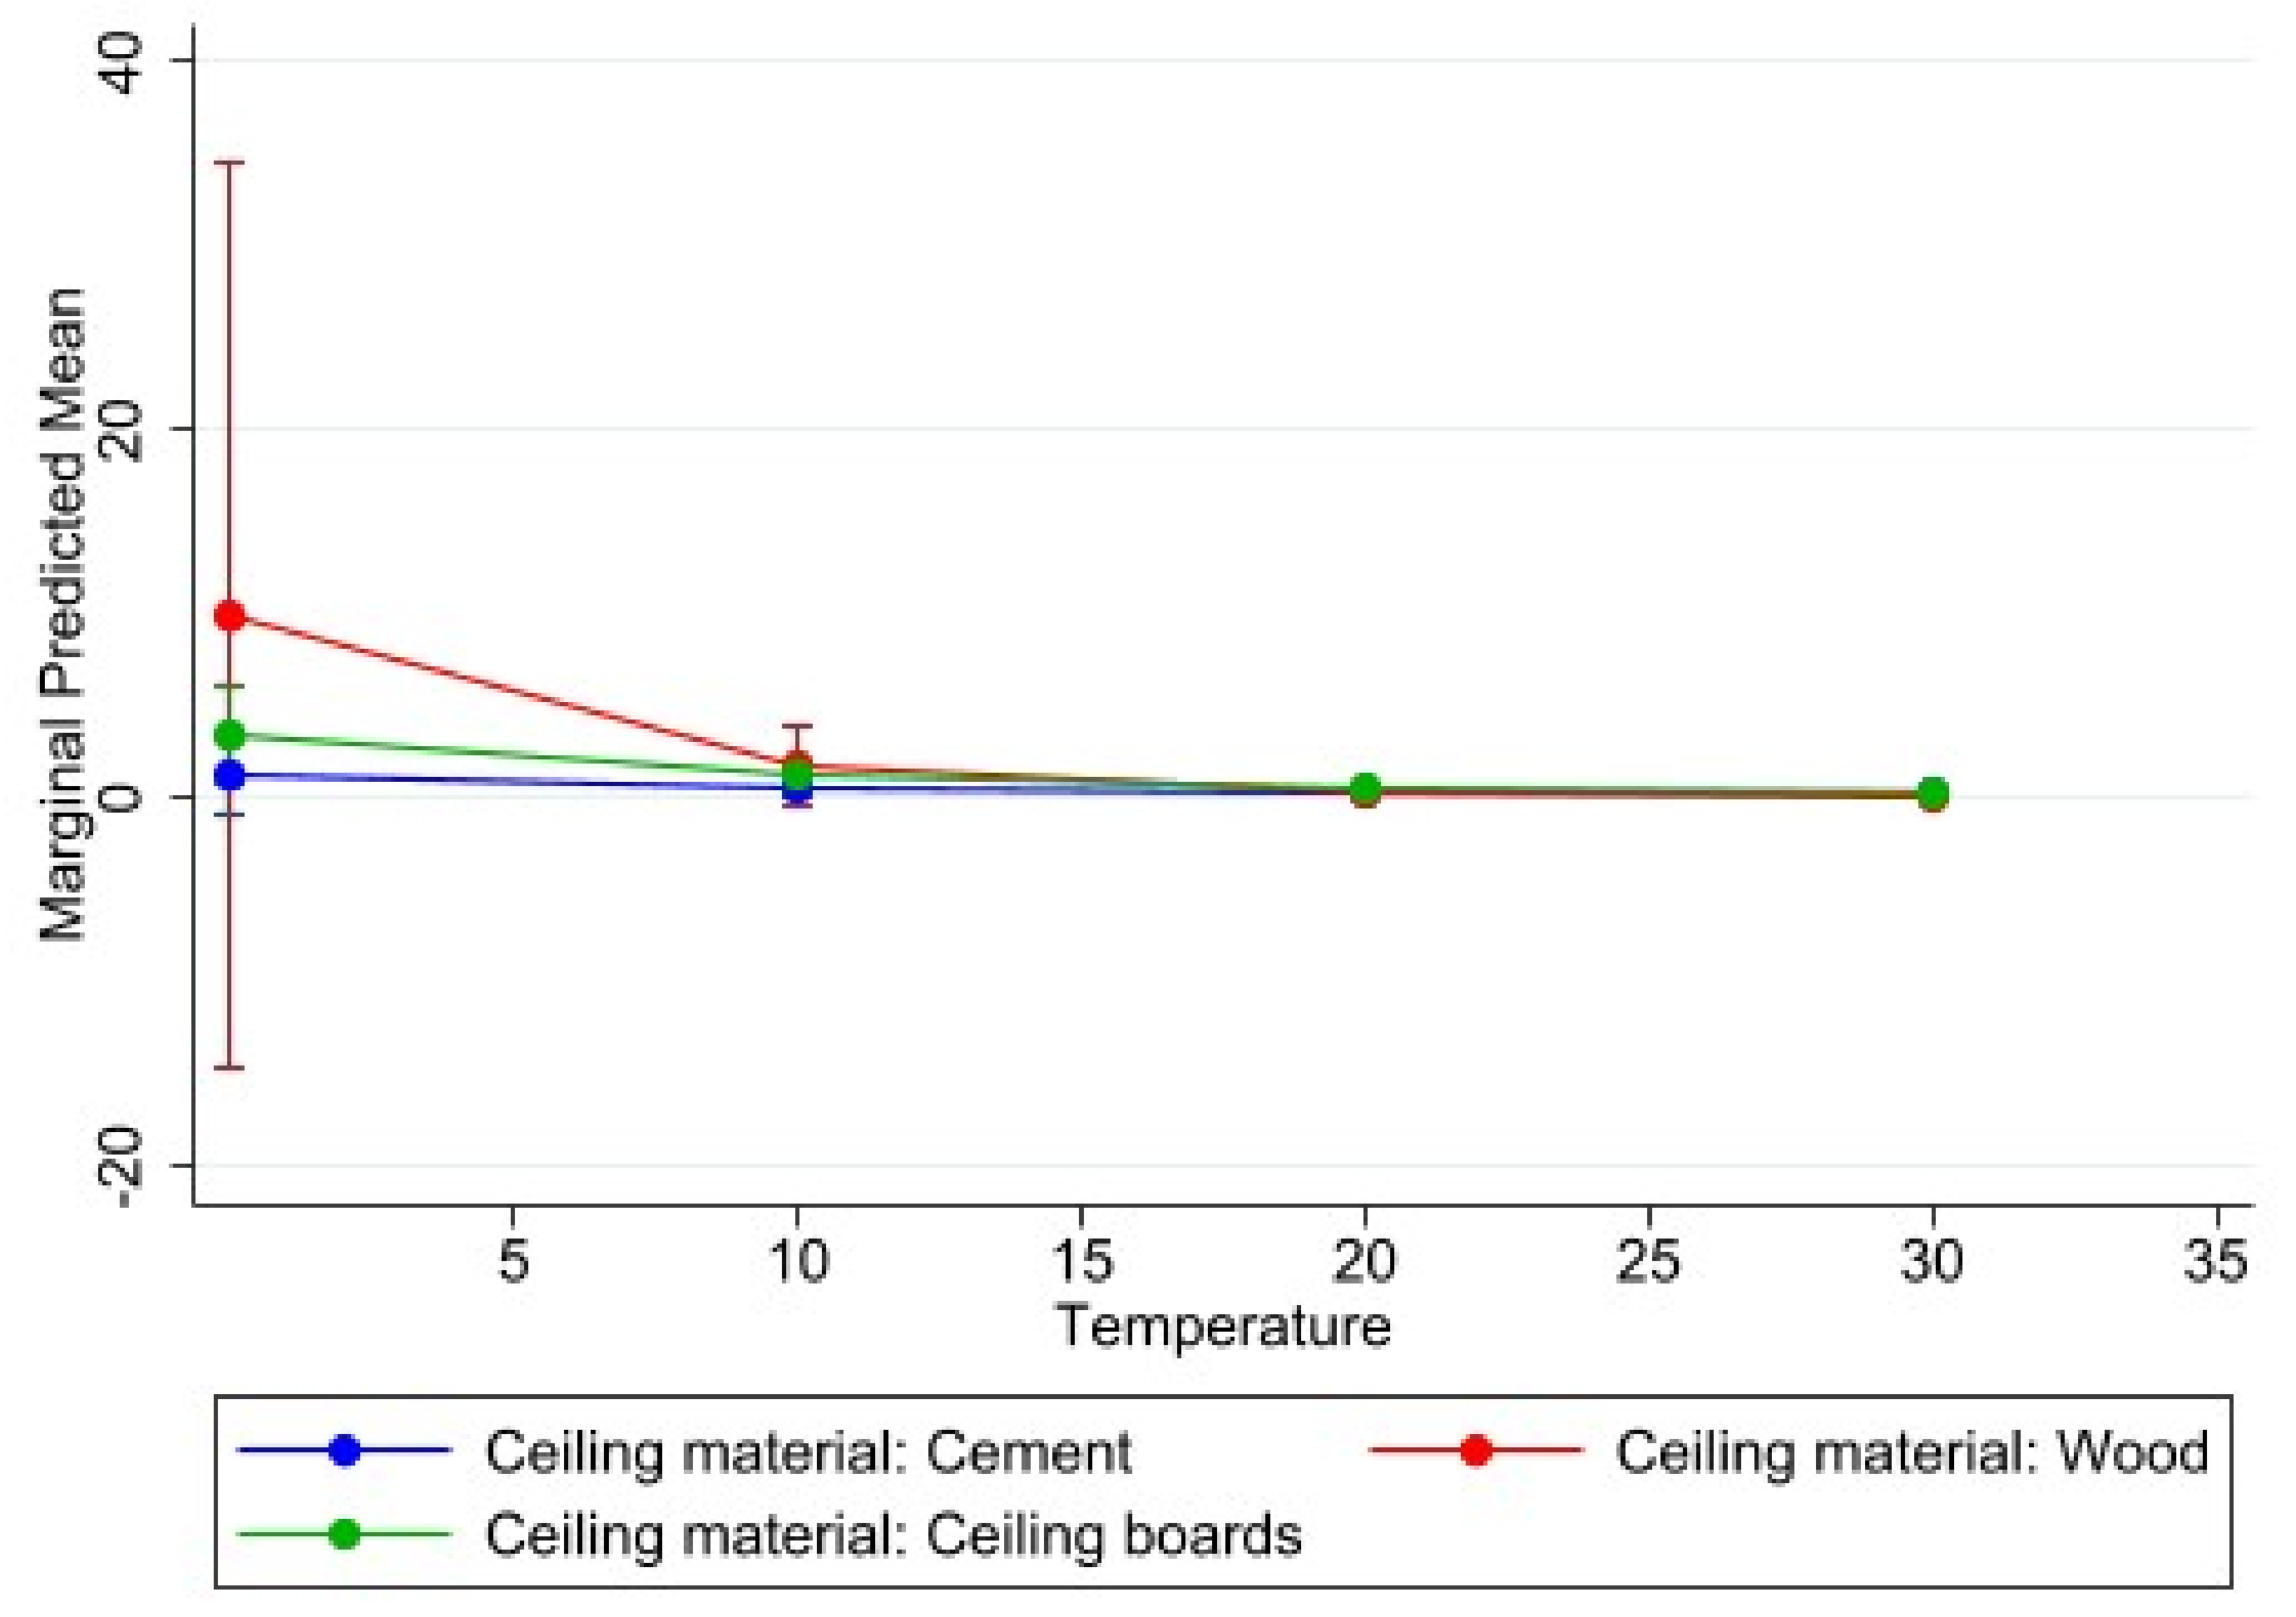
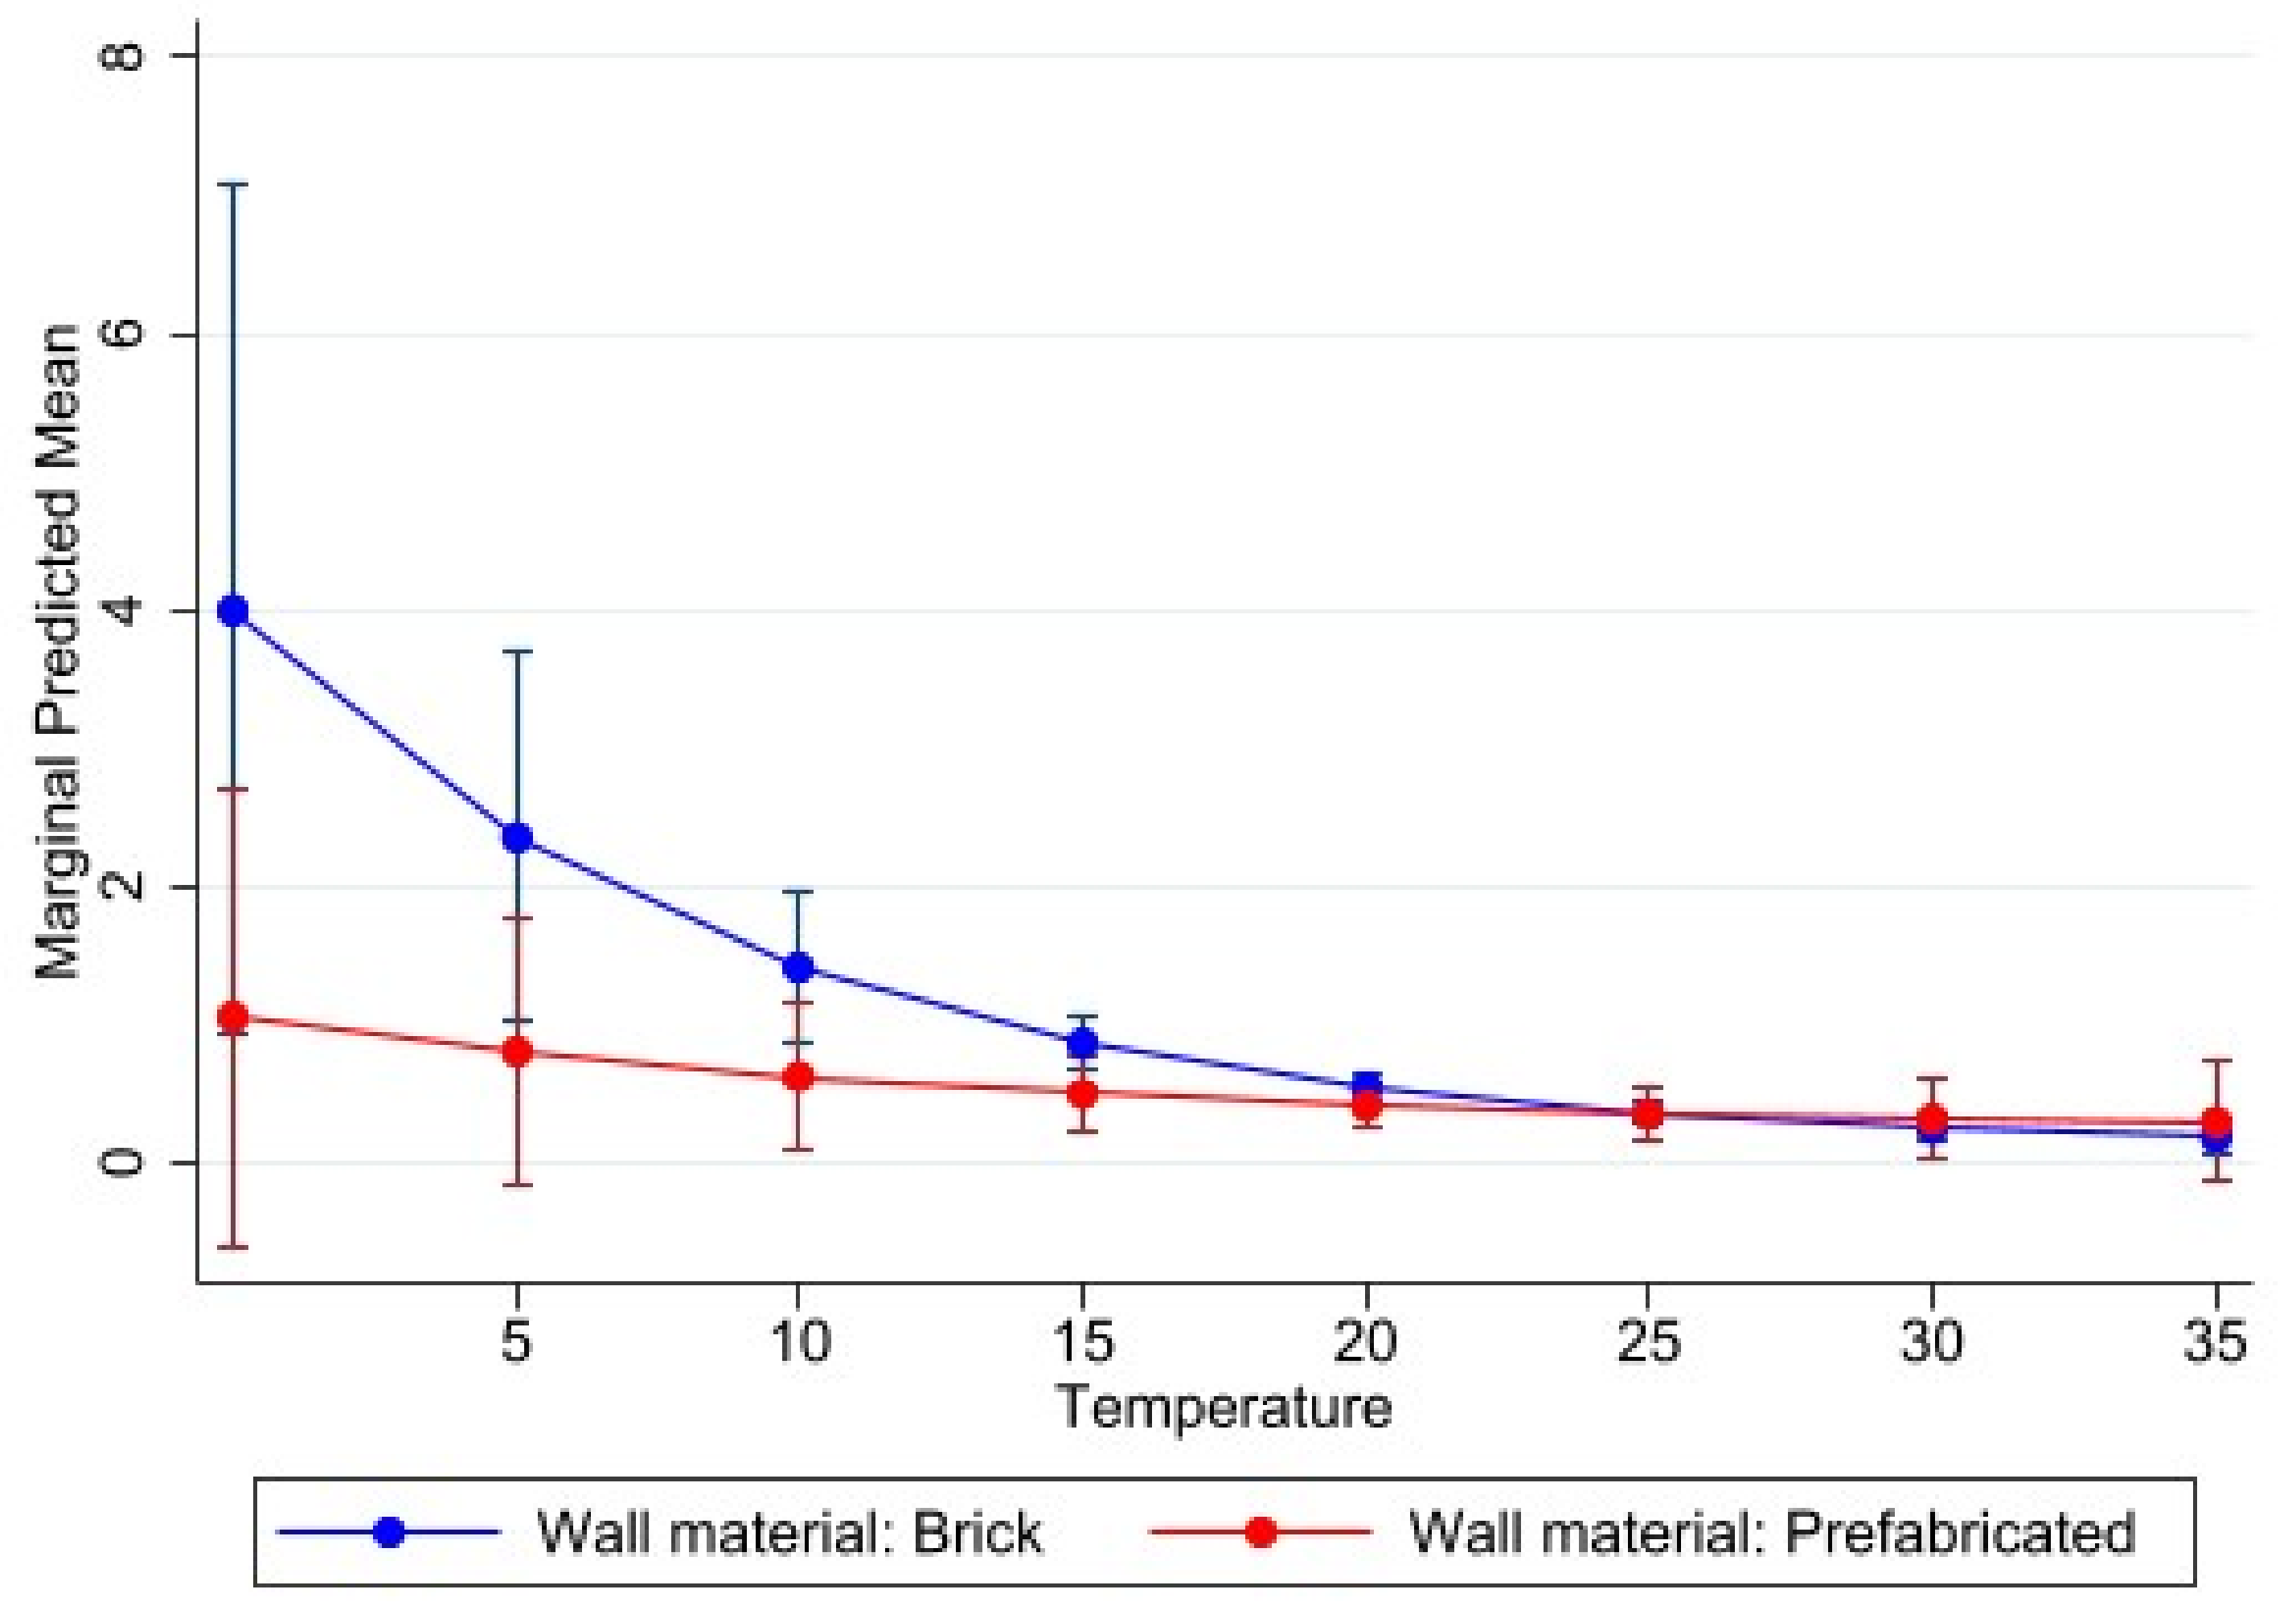
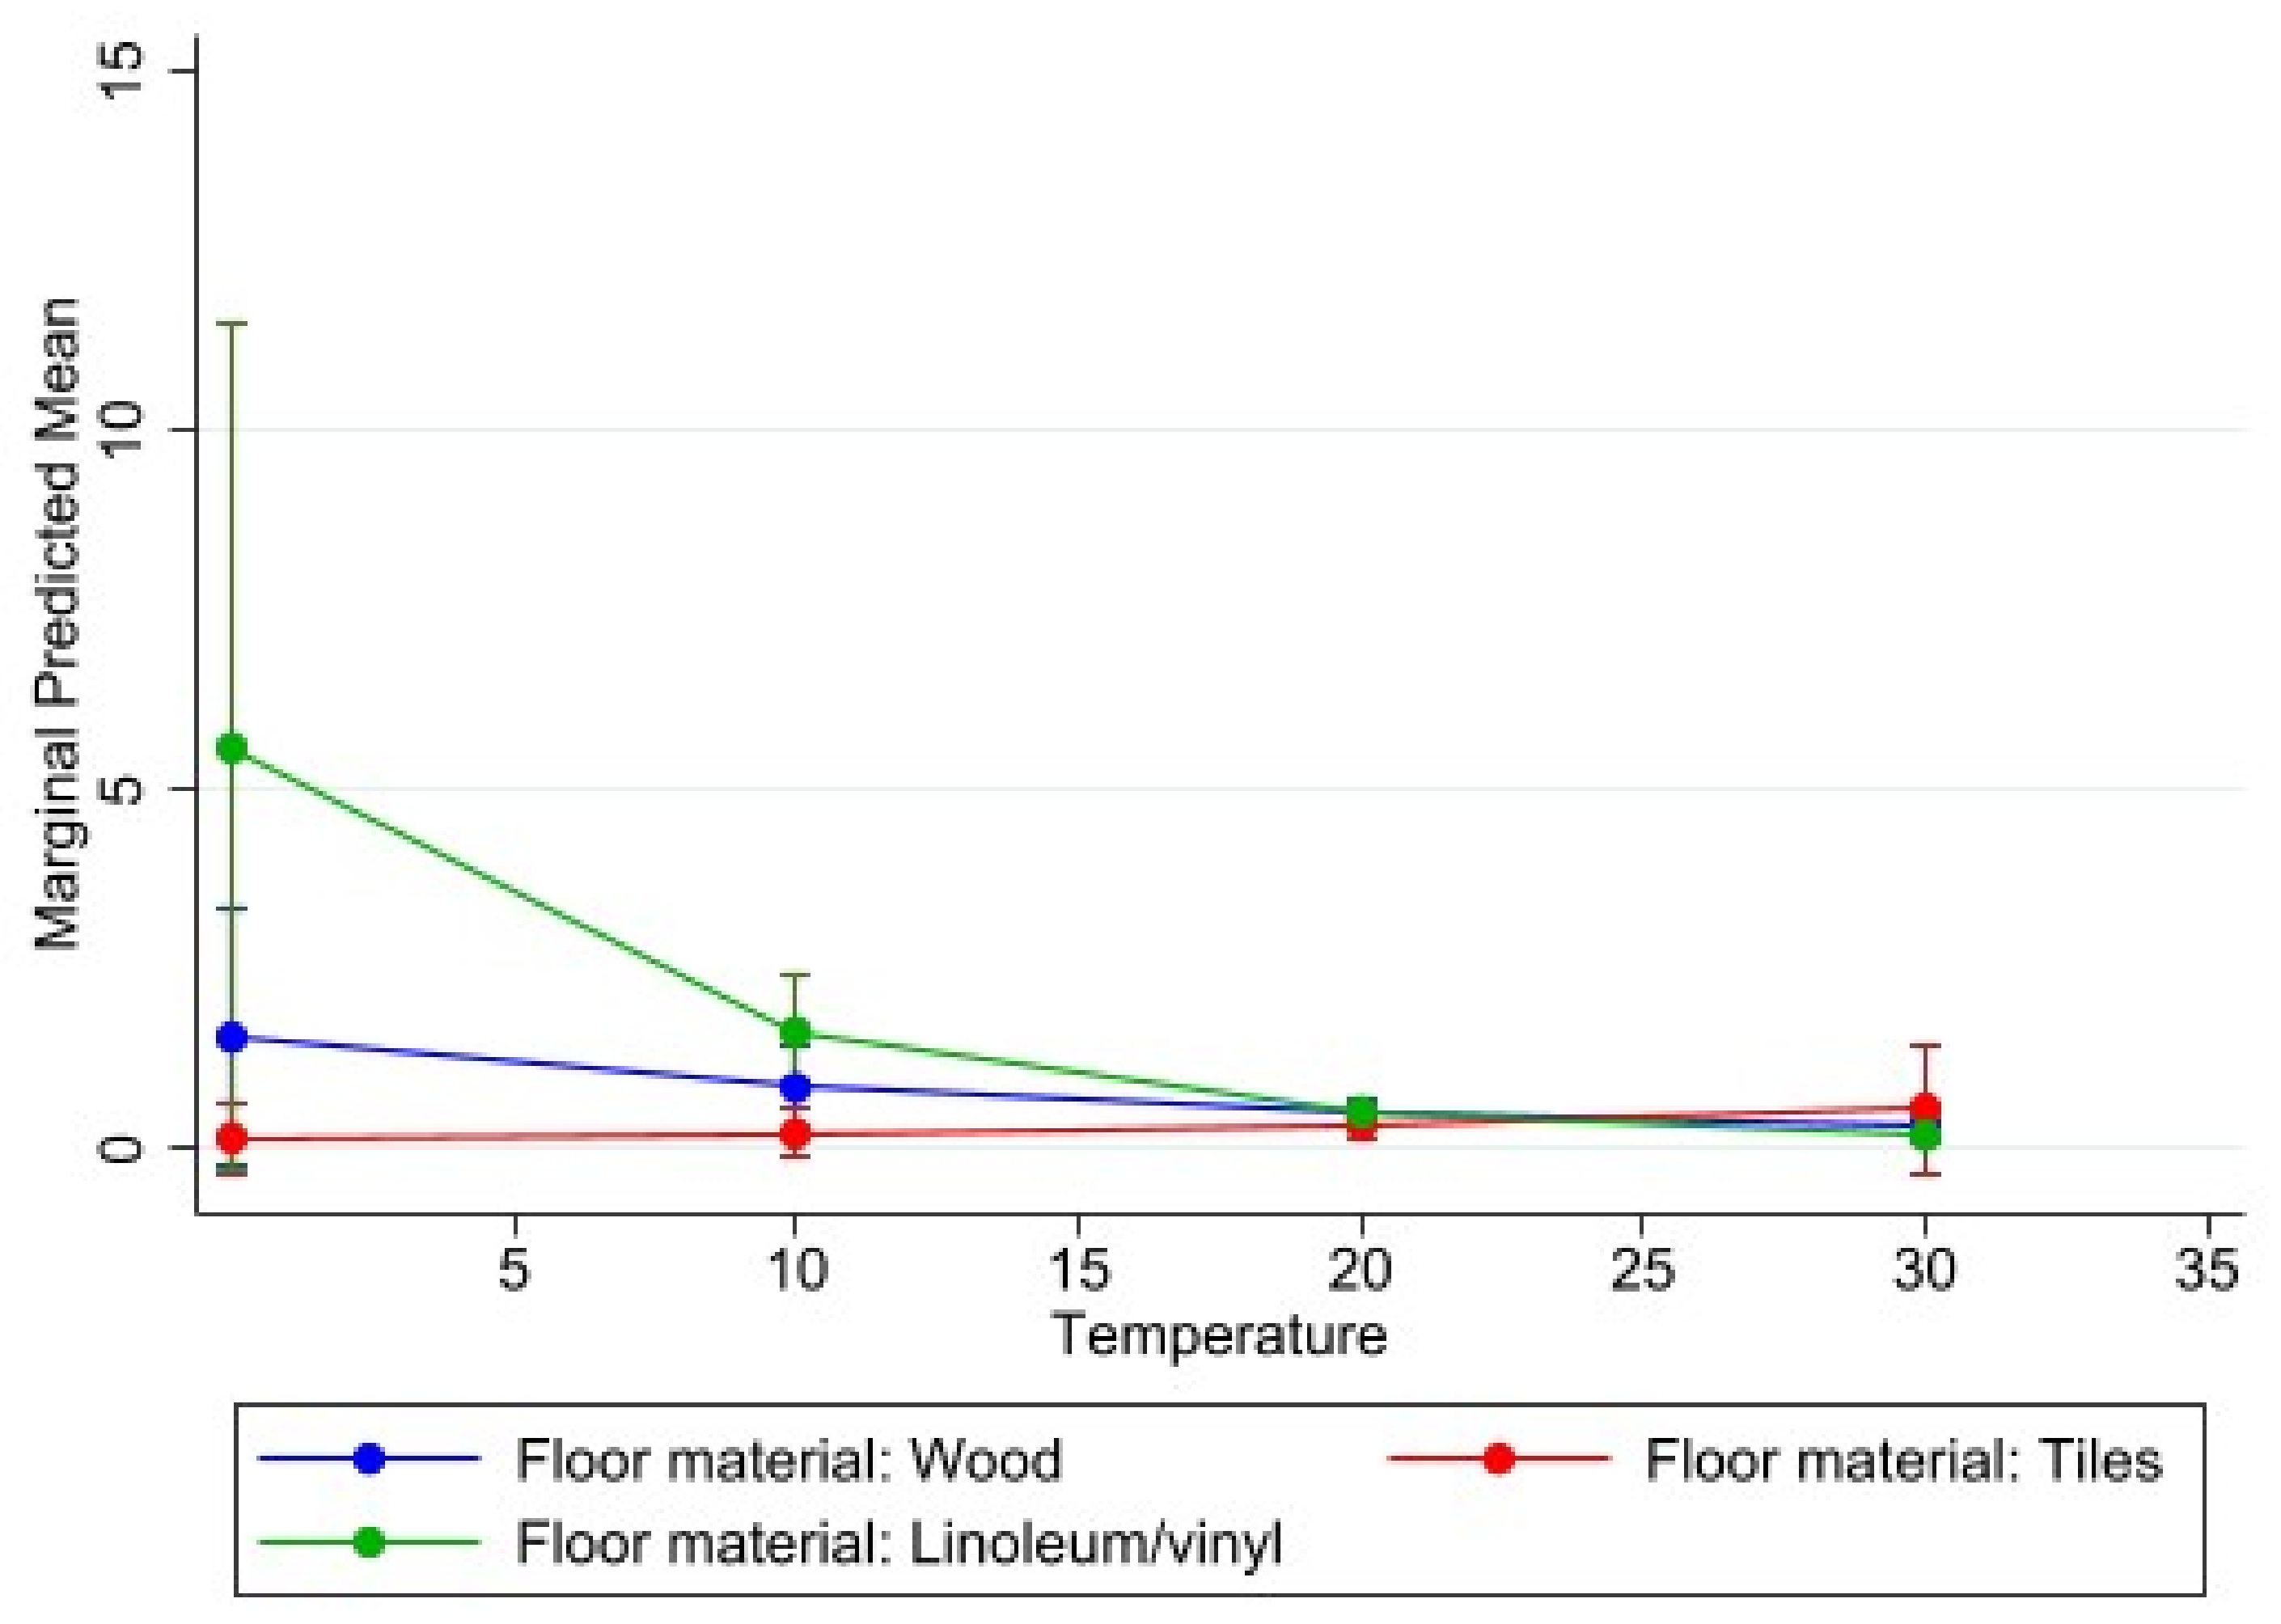
3.5. Multivariate Analyses Results
4. Discussion
4.1. Study Limitations
4.2. Lessons Learned
5. Conclusions
Author Contributions
Funding
Institutional Review Board Statement
Informed Consent Statement
Data Availability Statement
Acknowledgments
Conflicts of Interest
References
- World Health Organization. The Physical School Environment: An Essential Component of a Health Promoting School. WHO Information on Series on School Health; WHO: Geneva, Switzerland, 2004; Available online: https://www.who.int/school_youth_health/media/en/physical_sch_environment.pdf (accessed on 11 August 2021).
- Mendell, M.J.; Heath, G.A. Do indoor pollutants and thermal conditions in schools influence learner performance? A critical review of the literature. Indoor Air 2005, 15, 27–52. [Google Scholar] [CrossRef] [PubMed]
- Earthman, G.I. School Facility Conditions and Learner Academic Achievement. UCLA’s Institute for Democracy, Education, and Access. 2002. Available online: https://escholarship.org/uc/item/5sw56439 (accessed on 3 May 2021).
- Morris, R., Jr. The Relationships among School Facility Characteristics, Learner Achievement, and Job Satisfaction Levels among Teachers. Unpublished Doctoral Dissertation, University of Georgia, Athens, Greece, 2003. Available online: https://getd.libs.uga.edu/pdfs/morris_roy_f_200308_edd.pdf (accessed on 3 May 2021).
- Uline, C.; Tschannen-Moran, M. The Walls Speak: The Interplay of Quality Facilities, School Climate, and learner Achievement. J. Edu. Admin. 2008, 46, 55–73. [Google Scholar] [CrossRef] [Green Version]
- Toyinbo, O.; Shaughnessy, R.; Turunen, M.; Putus, T.; Metsämuuronen, J.; Kurnitski, J. Haverinen-Shaughnessy, U. Building characteristics, indoor environmental quality, and mathematics achievement in Finnish elementary schools. Build. Environ. 2016, 104, 114–121. [Google Scholar] [CrossRef]
- New York Commission on Ventilation. School Ventilation and Practices; Teachers College, Columbia: New York, NY, USA, 1931. Available online: https://escholarship.org/uc/item/5sw56439#page=17 (accessed on 3 May 2021).
- Wargocki, P.; Porras-Salazar, J.; Contreras, S. The relationship between classroom temperature and children’s performance in school. Build. Environ. 2019, 157, 1–5. [Google Scholar] [CrossRef]
- United Nations. Department of Economic and Social Affairs. Sustainable Development. The 17 Goals. Available online: https://sdgs.un.org/goals (accessed on 21 September 2021).
- Chen, L.; Jennison, B.L.; Yang, W.; Omaye, S.T. Elementary School Absenteeism and Air Pollution. Inhal. Toxicol. 2000, 12, 997–1016. [Google Scholar] [CrossRef] [PubMed]
- Bluyssen, P.M.; Zhang, D.; Kurvers, S.; Overtoom, M.; Ortiz-Sanchez, M. Self-reported health and comfort of school children in 54 classrooms of 21 Dutch school buildings. Build. Environ. 2018, 138, 106–123. [Google Scholar] [CrossRef]
- Gilliland, F.D.; Berhane, K.; Rappaport, E.B.; Thomas, D.C.; Avol, E.; Gauderman, W.J.; London, S.J.; Margolis, H.G.; Mcconnell, R.; Islam, K.T.; et al. The Effects of Ambient Air Pollution on School Absenteeism Due to Respiratory Illnesses. Epidemiology 2001, 12, 43–54. [Google Scholar] [CrossRef] [PubMed]
- Haverinen-Shaughnessy, U.; Shaughnessy, R.J.; Cole, E.C.; Toyinbo, O.; Moschandreas, D.J. An assessment of indoor environmental quality in schools and its association with health and performance. Build. Environ. 2015, 93, 35–40. [Google Scholar] [CrossRef]
- Simons, E.; Hwang, S.-A.; Fitzgerald, E.D.; Kielb, C.; Lin, S. The impact of school building conditions on learner absenteeism in Upstate New York. Am. J. Public Health 2010, 100, 1679–1686. [Google Scholar] [CrossRef]
- Gaihre, S.; Semple, S.; Miller, J.; Fielding, S.; Turner, S. Classroom carbon dioxide concentration, school attendance, and educational attainment. J. Sch. Health 2014, 84, 569–574. [Google Scholar] [CrossRef]
- Engelbrecht, F.A.; Adegoke, J.; Bopape, M.J.; Naidoo, M.; Garland, R.M.; Thatcher, M.; McGregor, J.L.; Katzfey, J.; Werner, M.; Ichoku, C.; et al. Projections of rapidly rising surface temperatures over Africa under low mitigation. Environ. Res. Lett. 2015, 10. [Google Scholar] [CrossRef]
- Puteh, M.; Ibrahim, M.H.; Adnan, M.; Che’Ahmad, C.N.; Noh, N.M. Thermal Comfort in Classroom: Constraints and Issues. Procedia Soc. Behav. Sci. 2012, 46, 1834–1838. [Google Scholar] [CrossRef] [Green Version]
- Bidassey-Manilal, S.; Wright, C.Y.; Engelbrecht, J.C.; Albers, P.N.; Garland, R.M.; Matooane, M. Learners’ perceived heat-health symptoms increased with warmer classroom temperatures. Int. J. Environ. Res. Public Health 2016, 13, 566. [Google Scholar] [CrossRef] [PubMed] [Green Version]
- Ebenezer, M.; Abbyssinia, M. Livelihood diversification and its effect on household poverty in Eastern Cape Province, South Africa. J. Dev. Areas 2018, 52, 235–249. [Google Scholar] [CrossRef]
- POPIA South Africa. Protection of Personal Information Act 4 of 2013. Available online: https://www.gov.za/sites/default/files/gcis_document/201409/3706726-11act4of2013protectionofpersonalinforcorrect.pdf (accessed on 11 August 2021).
- Microsoft Corporation. Microsoft Excel 2018. Available online: https://office.microsoft.com/excel (accessed on 11 August 2021).
- StataCorp. Stata Statistical Software: Release 15; StataCorp LLC: College Station, TX, USA, 2017; Available online: https://www.stata.com (accessed on 11 August 2021).
- Saez, M.; Sunyer, J.; Castellsague, J.; Murillo, C.; Anto, J.M. Relationship between weather temperature and mortality: A time series analysis approach in Barcelona. Int. J. Epidemiol. 1995, 24, 576–582. [Google Scholar] [CrossRef] [PubMed]
- United States National Weather Service Weather Forecast Office: Amarillo, T.X. What Is the Heat Index? Available online: http://www.srh.noaa.gov/ama/?n=heatindex (accessed on 11 August 2021).
- R Core Team. R: A Language and Environment for Statistical Computing; R Foundation for Statistical Computing: Vienna, Austria, 2021; Available online: https://www.R-project.org/ (accessed on 11 August 2021).
- Western Cape Government. Background to the National Quintile System. Media Release, Minister of Education Donald Grant, Western Cape. 13 October 2013. Available online: https://wcedonline.westerncape.gov.za/comms/press/2013/74_14oct.html (accessed on 21 September 2021).
- Jacklitsch, B.; Williams, W.J.; Musolin, K.; Coca, A.; Kim, J.-H.; Turner, N.; Cincinnati, OH. U.S. Department of Health and Human Services, Centers for Disease Control and Prevention, National Institute for Occupational Safety and Health. NIOSH Criteria for a Recommended Standard: Occupational Exposure to Heat and Hot Environments, Publication 2016-106. Available online: https://www.cdc.gov/niosh/docs/2016-106/pdfs/2016-106.pdf (accessed on 11 August 2021).
- Canadian Centre for Occupational Health and Safety. Thermal Comfort for Office Work. Available online: https://www.ccohs.ca/oshanswers/phys_agents/thermal_comfort.html (accessed on 11 August 2021).
- South African Labour Guide. Your Guide to Labour Law in South Africa. Available online: https://www.labourguide.co.za/up-to-date-safety-news/2185-managing-office-temperature#:~:text=A%20reasonable%20temperature%20for%20a,C%20and%2026%C2%B0C (accessed on 11 August 2021).
- Dapi, L.N.; Rocklov, J.; Nguefack-Tsague, G.; Tetanye, E.; Kjellstrom, T. Heat impact on schoolchildren in Cameroon, Africa: Potential health threat from climate change. Glob. Health Action 2010, 3, 1. [Google Scholar] [CrossRef] [PubMed]
- Aradhana, J. Investigation and analysis of thermal comfort in naturally ventilated secondary school classrooms in the composite site of India. Archit. Sci. Rev. 2018, 62, 466–484. [Google Scholar] [CrossRef]
- ASHRAE. American Society of Heating, Refrigerating and Air-Conditioning Engineers (ASHRAE) Thermal Comfort Standards. Available online: https:///www.ashrae.org/about/mission-and-vision/ashrae-industry-history (accessed on 21 September 2021).
- Teare, J.; Mathee, A.; Naicker, N.; Swanepoel, C.; Kapwata, T.; Balakrishna, Y.; du Preez, D.J.; Millar, D.A.; Wright, C.Y. Dwelling characteristics influence indoor temperature and may pose health threats in LMICs. Ann. Glob. Health 2020, 86, 91. [Google Scholar] [CrossRef] [PubMed]
- Van Biljon, C.; Burger, B. The Period Effect: The Effect of Menstruation on Absenteeism of Schoolgirls in Limpopo. Stellenbosch Working Paper Series No. WP20/2019. December 2019. Available online: https://www.ekon.sun.ac.za/wpapers/2019/wp202019/wp202019.pdf (accessed on 11 August 2021).
- Stempel, H.; Cox-Martin, M.; Bronsert, M.; Dickinson, L.M.; Allison, M.A. Chronic school absenteeism and the role of adverse childhood experiences. Acad. Paediatr. 2017, 17, 837–843. [Google Scholar] [CrossRef] [PubMed] [Green Version]
- Uleanya, I.B.O.C. Effects of household poverty trap on learners’ academic performances: A case of rural high schools in Nongoma Circuit of South Africa. AFRIKCA J. Politics Econ. Soc. 2019, 9, 1–5. [Google Scholar] [CrossRef]


| Symptom Band | US NWS Classification | Apparent Temperature Range (°C) | US NWS Classified “Effect on the Body” |
|---|---|---|---|
| I | Caution | 27–32 | Fatigue possible with prolonged exposure and/or physical activity |
| II | Extreme caution | 32–39 | Heat stroke, heat cramps, or heat exhaustion possible with prolonged exposure and/or physical activity |
| III | Danger | 39–51 | Heat cramps or heat exhaustion likely, and heat stroke possible with prolonged exposure and/or physical activity |
| IV | Extreme Danger | >51 | Heat stroke highly likely |
| Frequency | |||
|---|---|---|---|
| Section | Variable | n | % |
| Household characteristics | Anyone with a social grant | ||
| No | 246 | 25 | |
| Yes | 731 | 75 | |
| Missing | 0 | 0 | |
| Learner has medical aid | |||
| No | 781 | 80 | |
| Yes | 198 | 20 | |
| Missing | 0 | 0 | |
| Dwelling type | |||
| Brick house | 800 | 82 | |
| Shack | 98 | 10 | |
| Mud house | 76 | 8 | |
| Missing | 0 | 0 | |
| Primary energy source | |||
| Electricity | 834 | 86 | |
| Paraffin | 60 | 6 | |
| Gas | 63 | 6 | |
| Wood | 20 | 2 | |
| Missing | 2 | 0 | |
| Type of sanitation | |||
| Flush toilet | 463 | 47 | |
| Pit latrine | 497 | 51 | |
| Bucket system | 5 | 1 | |
| Missing | 14 | 1 | |
| Water source | |||
| Tap inside dwelling | 460 | 47 | |
| Tap on stand | 392 | 40 | |
| Communal tap | 68 | 7 | |
| Government tank | 28 | 3 | |
| River | 25 | 2 | |
| Missing | 8 | 1 | |
| Learner-related school variables | Numbers of learners attending schools of different quintiles | ||
| Quintile 1 | 0 | 0 | |
| Quintile 2 | 22 | 2 | |
| Quintile 3 | 747 | 76 | |
| Quintile 4 | 130 | 13 | |
| Quintile 5 | 44 | 5 | |
| Not specified | 36 | 4 | |
| Distance to school | |||
| <1 km | 568 | 58 | |
| 1–2 km | 106 | 11 | |
| 2–3 km | 90 | 9 | |
| 3–5 km | 137 | 14 | |
| >5 km | 67 | 7 | |
| Missing | 11 | 1 | |
| School feeding programme | |||
| No | 251 | 26 | |
| Yes | 728 | 74 | |
| Missing | 0 | 0 | |
| General reasons for absence from school | |||
| Illness | 809 | 83 | |
| Family commitments | 28 | 3 | |
| Other (undefined) | 2 | 0 | |
| Missing | 140 | 14 | |
| Variable | Frequency | |
|---|---|---|
| (n = 13) | ||
| n | % | |
| Roof material | ||
| Clay tile | 1 | 8 |
| Corrugated iron | 9 | 69 |
| Asbestos | 2 | 15 |
| Missing | 1 | 8 |
| Ceiling material | ||
| Cement | 1 | 8 |
| Wood | 1 | 8 |
| Ceiling boards | 11 | 84 |
| Floor material | ||
| Wood | 4 | 31 |
| Tiles | 1 | 7 |
| Linoleum/vinyl | 8 | 62 |
| Exterior of school | ||
| Brick | 6 | 46 |
| Plastered brick | 2 | 15 |
| Wood | 1 | 8 |
| Corrugated iron | 1 | 8 |
| Prefabricated walling | 1 | 8 |
| Combination | 2 | 15 |
| Interior of classroom | ||
| Plastered brick | 7 | 54 |
| Corrugated iron | 1 | 8 |
| Unknown | 2 | 15 |
| Combination | 3 | 23 |
| Windows shaded with protection (e.g., awning, tree, curtain) | ||
| No | 10 | 77 |
| Yes | 3 | 23 |
| Temperature control (e.g., mechanical fan, air conditioning, air cooler, whirly roof vent) | ||
| No | 8 | 62 |
| Yes | 4 | 30 |
| Missing | 1 | 8 |
| Parameter | Est. | p-Value | Exp (Est.) % | 95% CI% | |
|---|---|---|---|---|---|
| Indoor temperature | −0.08 | 0.052 | 0.92 | 0.85 | 1.00 |
| Wall material | |||||
| Brick a | - | - | - | - | - |
| Prefabricated | −1.34 | 0.170 | 0.26 | 0.04 | 1.61 |
| Floor material | |||||
| Linoleum/vinyl a | - | - | - | - | - |
| Wood | −1.28 | 0.126 | 0.28 | 0.05 | 1.44 |
| Tiles | −3.47 | 0.020 * | 0.03 | 0.00 | 0.58 |
| Ceiling material | |||||
| Cement a | - | - | - | - | - |
| Wood | 2.08 | 0.188 | 8.03 | 0.36 | 179.18 |
| Ceiling boards | 1.02 | 0.286 | 2.77 | 0.43 | 17.93 |
| Wall material # Indoor temperature | |||||
| Prefabricated | 0.05 | 0.240 | 1.05 | 0.97 | 1.15 |
| Floor material # Indoor temperature | |||||
| Wood | 0.06 | 0.117 | 1.07 | 0.98 | 1.15 |
| Tiles | 0.15 | 0.045 * | 1.16 | 1.00 | 1.35 |
| Ceiling material # Indoor temperature | |||||
| Wood | −0.11 | 0.189 | 0.90 | 0.77 | 1.05 |
| Ceiling boards | −0.03 | 0.513 | 0.97 | 0.88 | 1.07 |
Publisher’s Note: MDPI stays neutral with regard to jurisdictional claims in published maps and institutional affiliations. |
© 2021 by the authors. Licensee MDPI, Basel, Switzerland. This article is an open access article distributed under the terms and conditions of the Creative Commons Attribution (CC BY) license (https://creativecommons.org/licenses/by/4.0/).
Share and Cite
Pule, V.; Mathee, A.; Melariri, P.; Kapwata, T.; Abdelatif, N.; Balakrishna, Y.; Kunene, Z.; Mogotsi, M.; Wernecke, B.; Wright, C.Y. Classroom Temperature and Learner Absenteeism in Public Primary Schools in the Eastern Cape, South Africa. Int. J. Environ. Res. Public Health 2021, 18, 10700. https://doi.org/10.3390/ijerph182010700
Pule V, Mathee A, Melariri P, Kapwata T, Abdelatif N, Balakrishna Y, Kunene Z, Mogotsi M, Wernecke B, Wright CY. Classroom Temperature and Learner Absenteeism in Public Primary Schools in the Eastern Cape, South Africa. International Journal of Environmental Research and Public Health. 2021; 18(20):10700. https://doi.org/10.3390/ijerph182010700
Chicago/Turabian StylePule, Vicky, Angela Mathee, Paula Melariri, Thandi Kapwata, Nada Abdelatif, Yusentha Balakrishna, Zamantimande Kunene, Mirriam Mogotsi, Bianca Wernecke, and Caradee Yael Wright. 2021. "Classroom Temperature and Learner Absenteeism in Public Primary Schools in the Eastern Cape, South Africa" International Journal of Environmental Research and Public Health 18, no. 20: 10700. https://doi.org/10.3390/ijerph182010700
APA StylePule, V., Mathee, A., Melariri, P., Kapwata, T., Abdelatif, N., Balakrishna, Y., Kunene, Z., Mogotsi, M., Wernecke, B., & Wright, C. Y. (2021). Classroom Temperature and Learner Absenteeism in Public Primary Schools in the Eastern Cape, South Africa. International Journal of Environmental Research and Public Health, 18(20), 10700. https://doi.org/10.3390/ijerph182010700