Atmospheric Behaviour of Polycyclic and Nitro-Polycyclic Aromatic Hydrocarbons and Water-Soluble Inorganic Ions in Winter in Kirishima, a Typical Japanese Commercial City

 ,
,
Abstract
1. Introduction
2. Materials and Methods
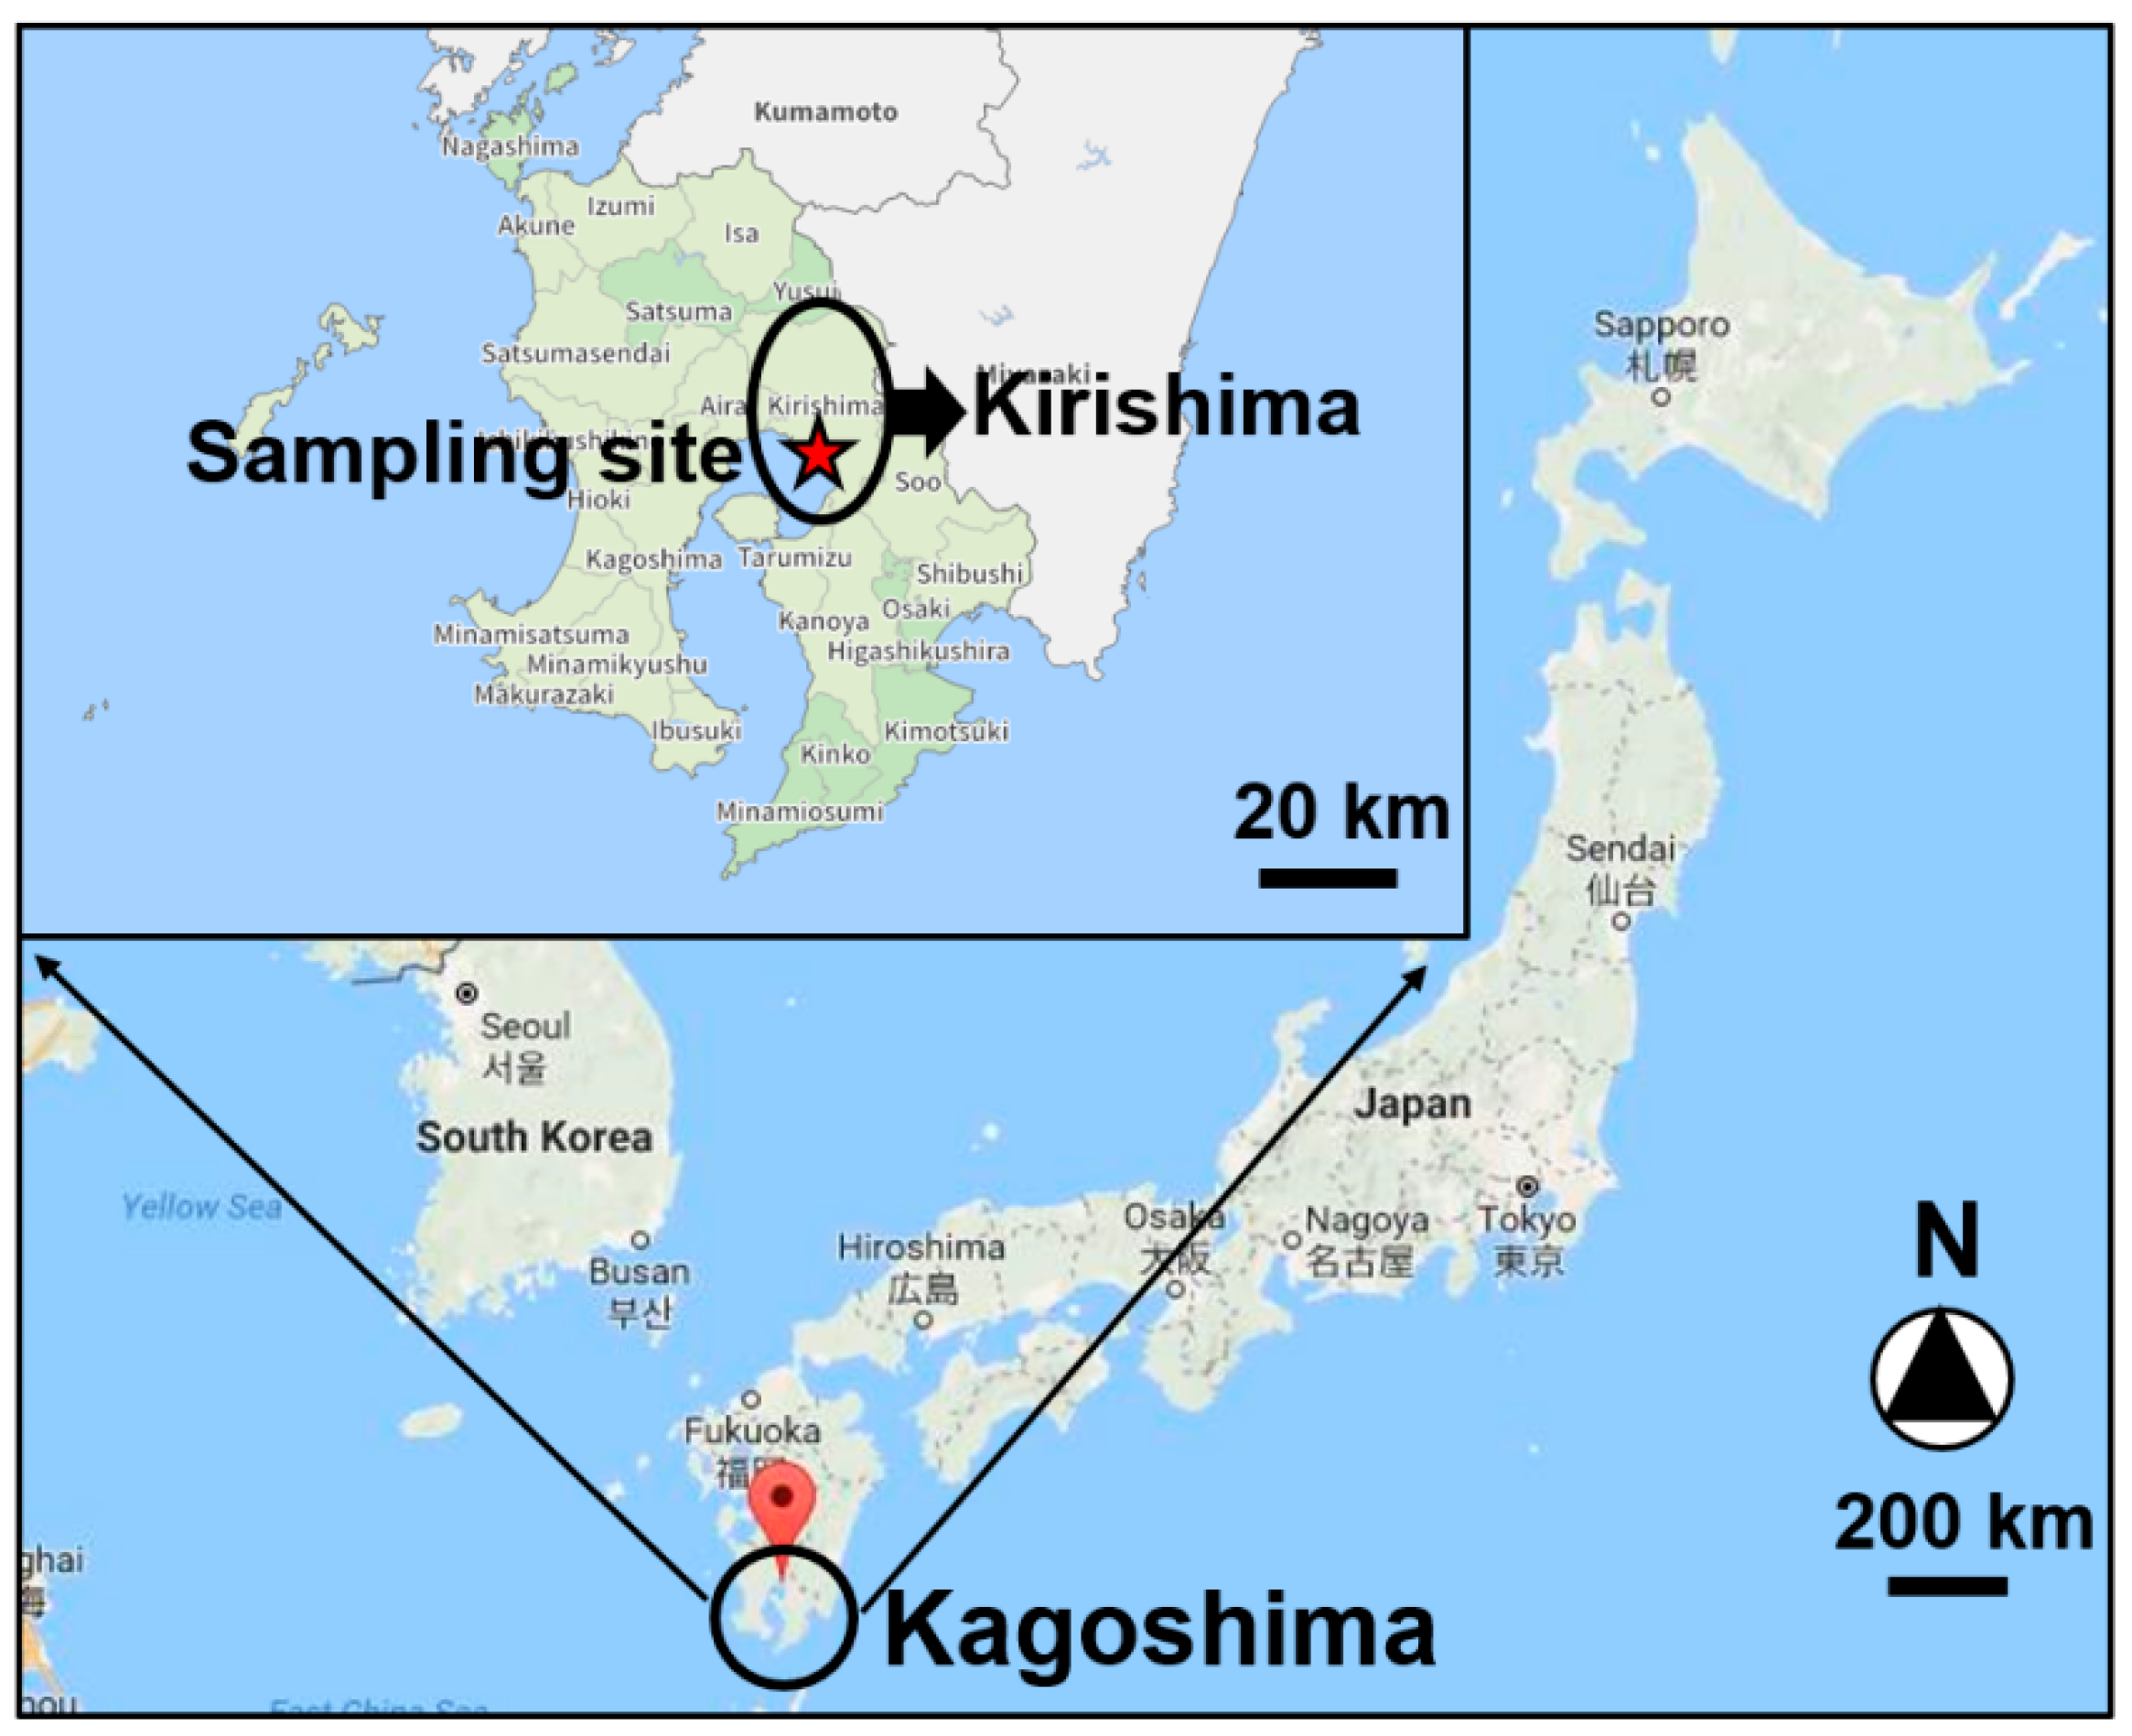
2.1. PM2.5 Sampling
2.2. PAH, NPAH, and WSII Analyses and Chemical Compositions
2.3. Data Analysis
2.3.1. Meteorological Conditions
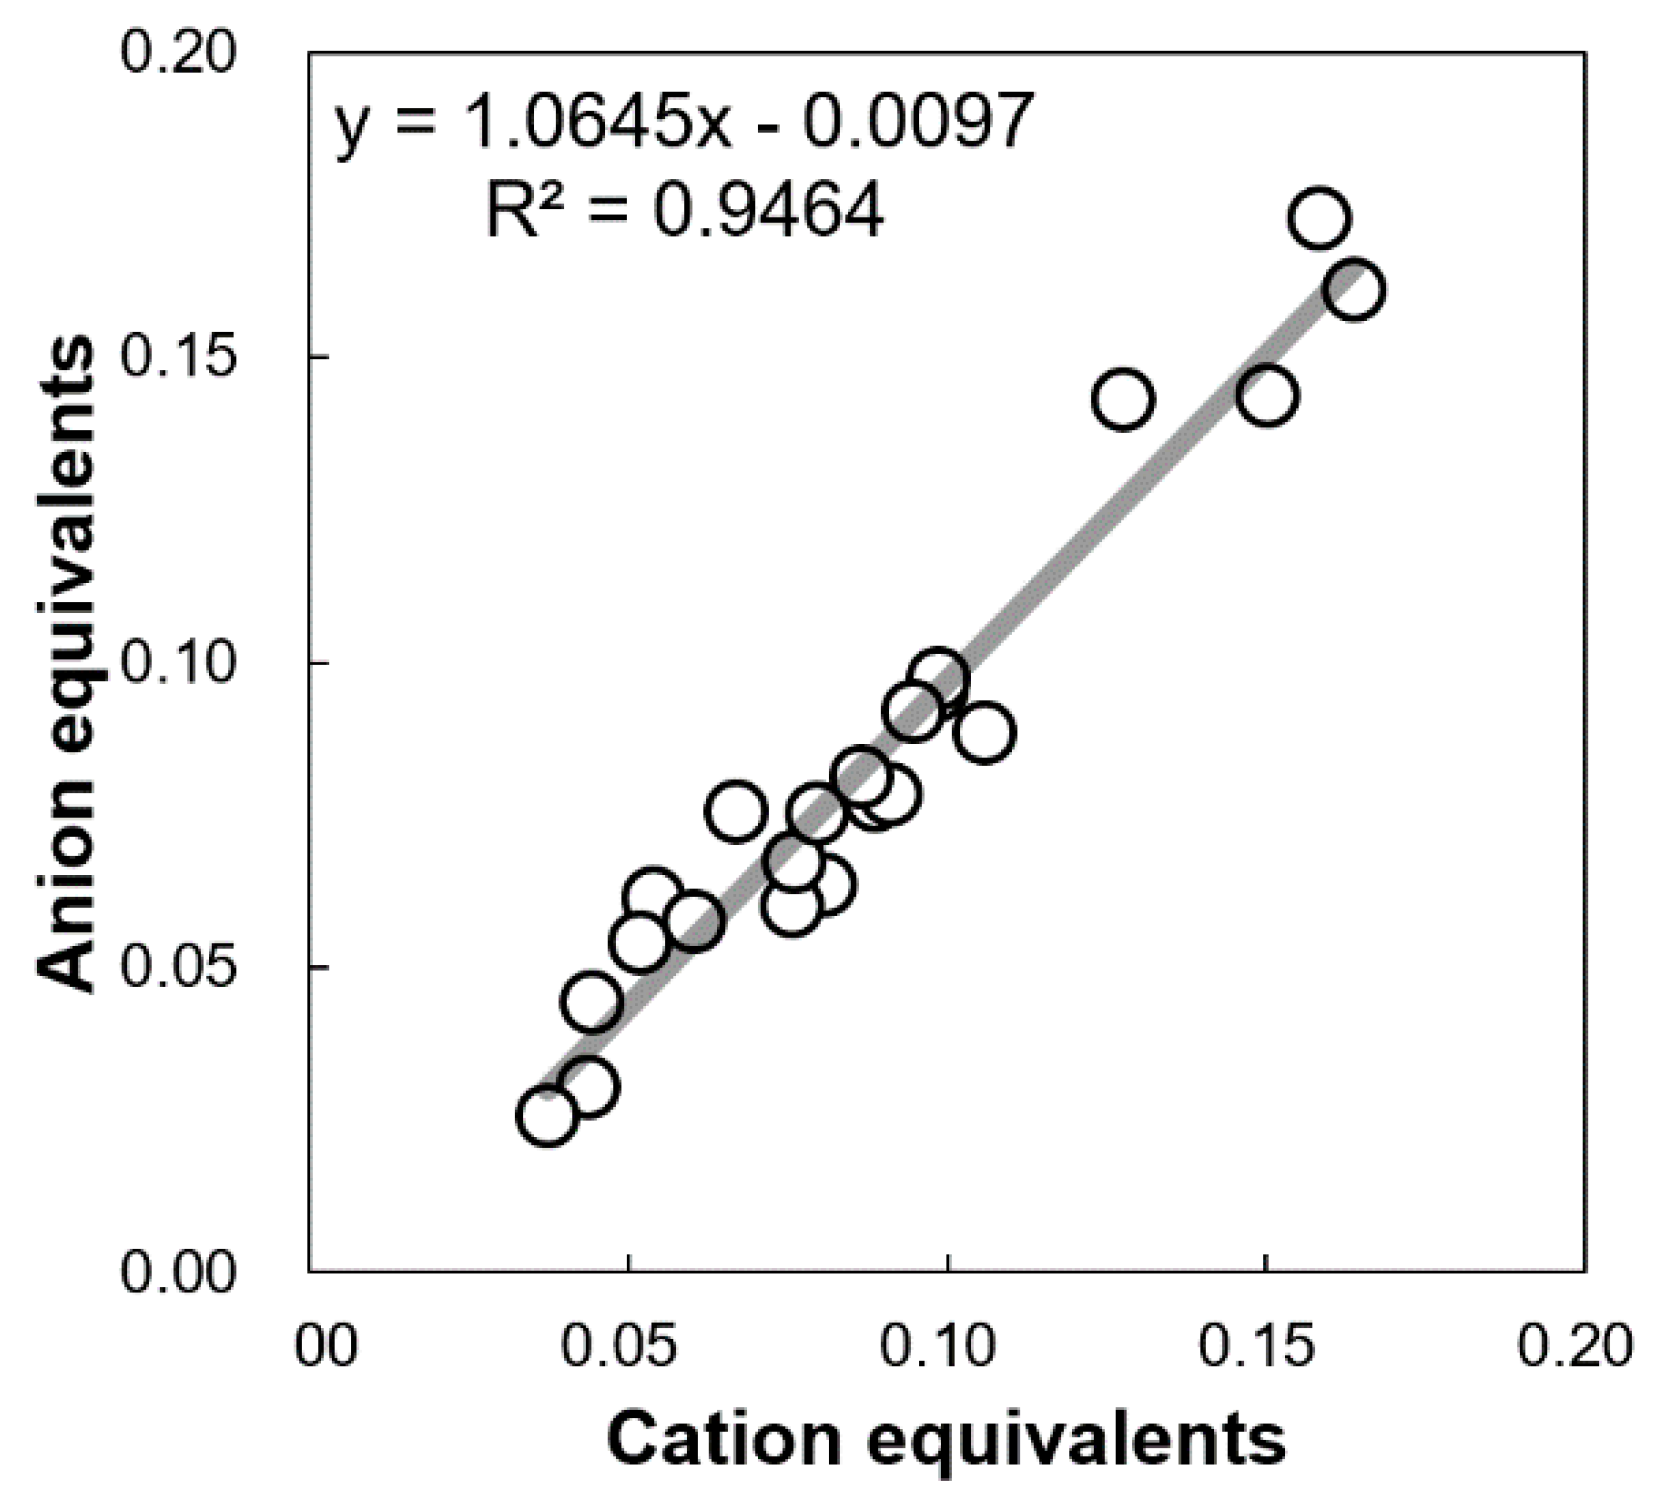
2.3.2. Cation Equivalent (CE), Anion Equivalent (AE), and Non-Sea Salt (nss-) WSIIs
2.3.3. Backward Trajectory
2.3.4. Health Risk Assessment
2.3.5. Statistical Analysis
3. Results and Discussion
3.1. Concentrations of PAHs, NPAHs, and WSIIs
3.2. Composition of PAHs, NPAHs, and WSIIs
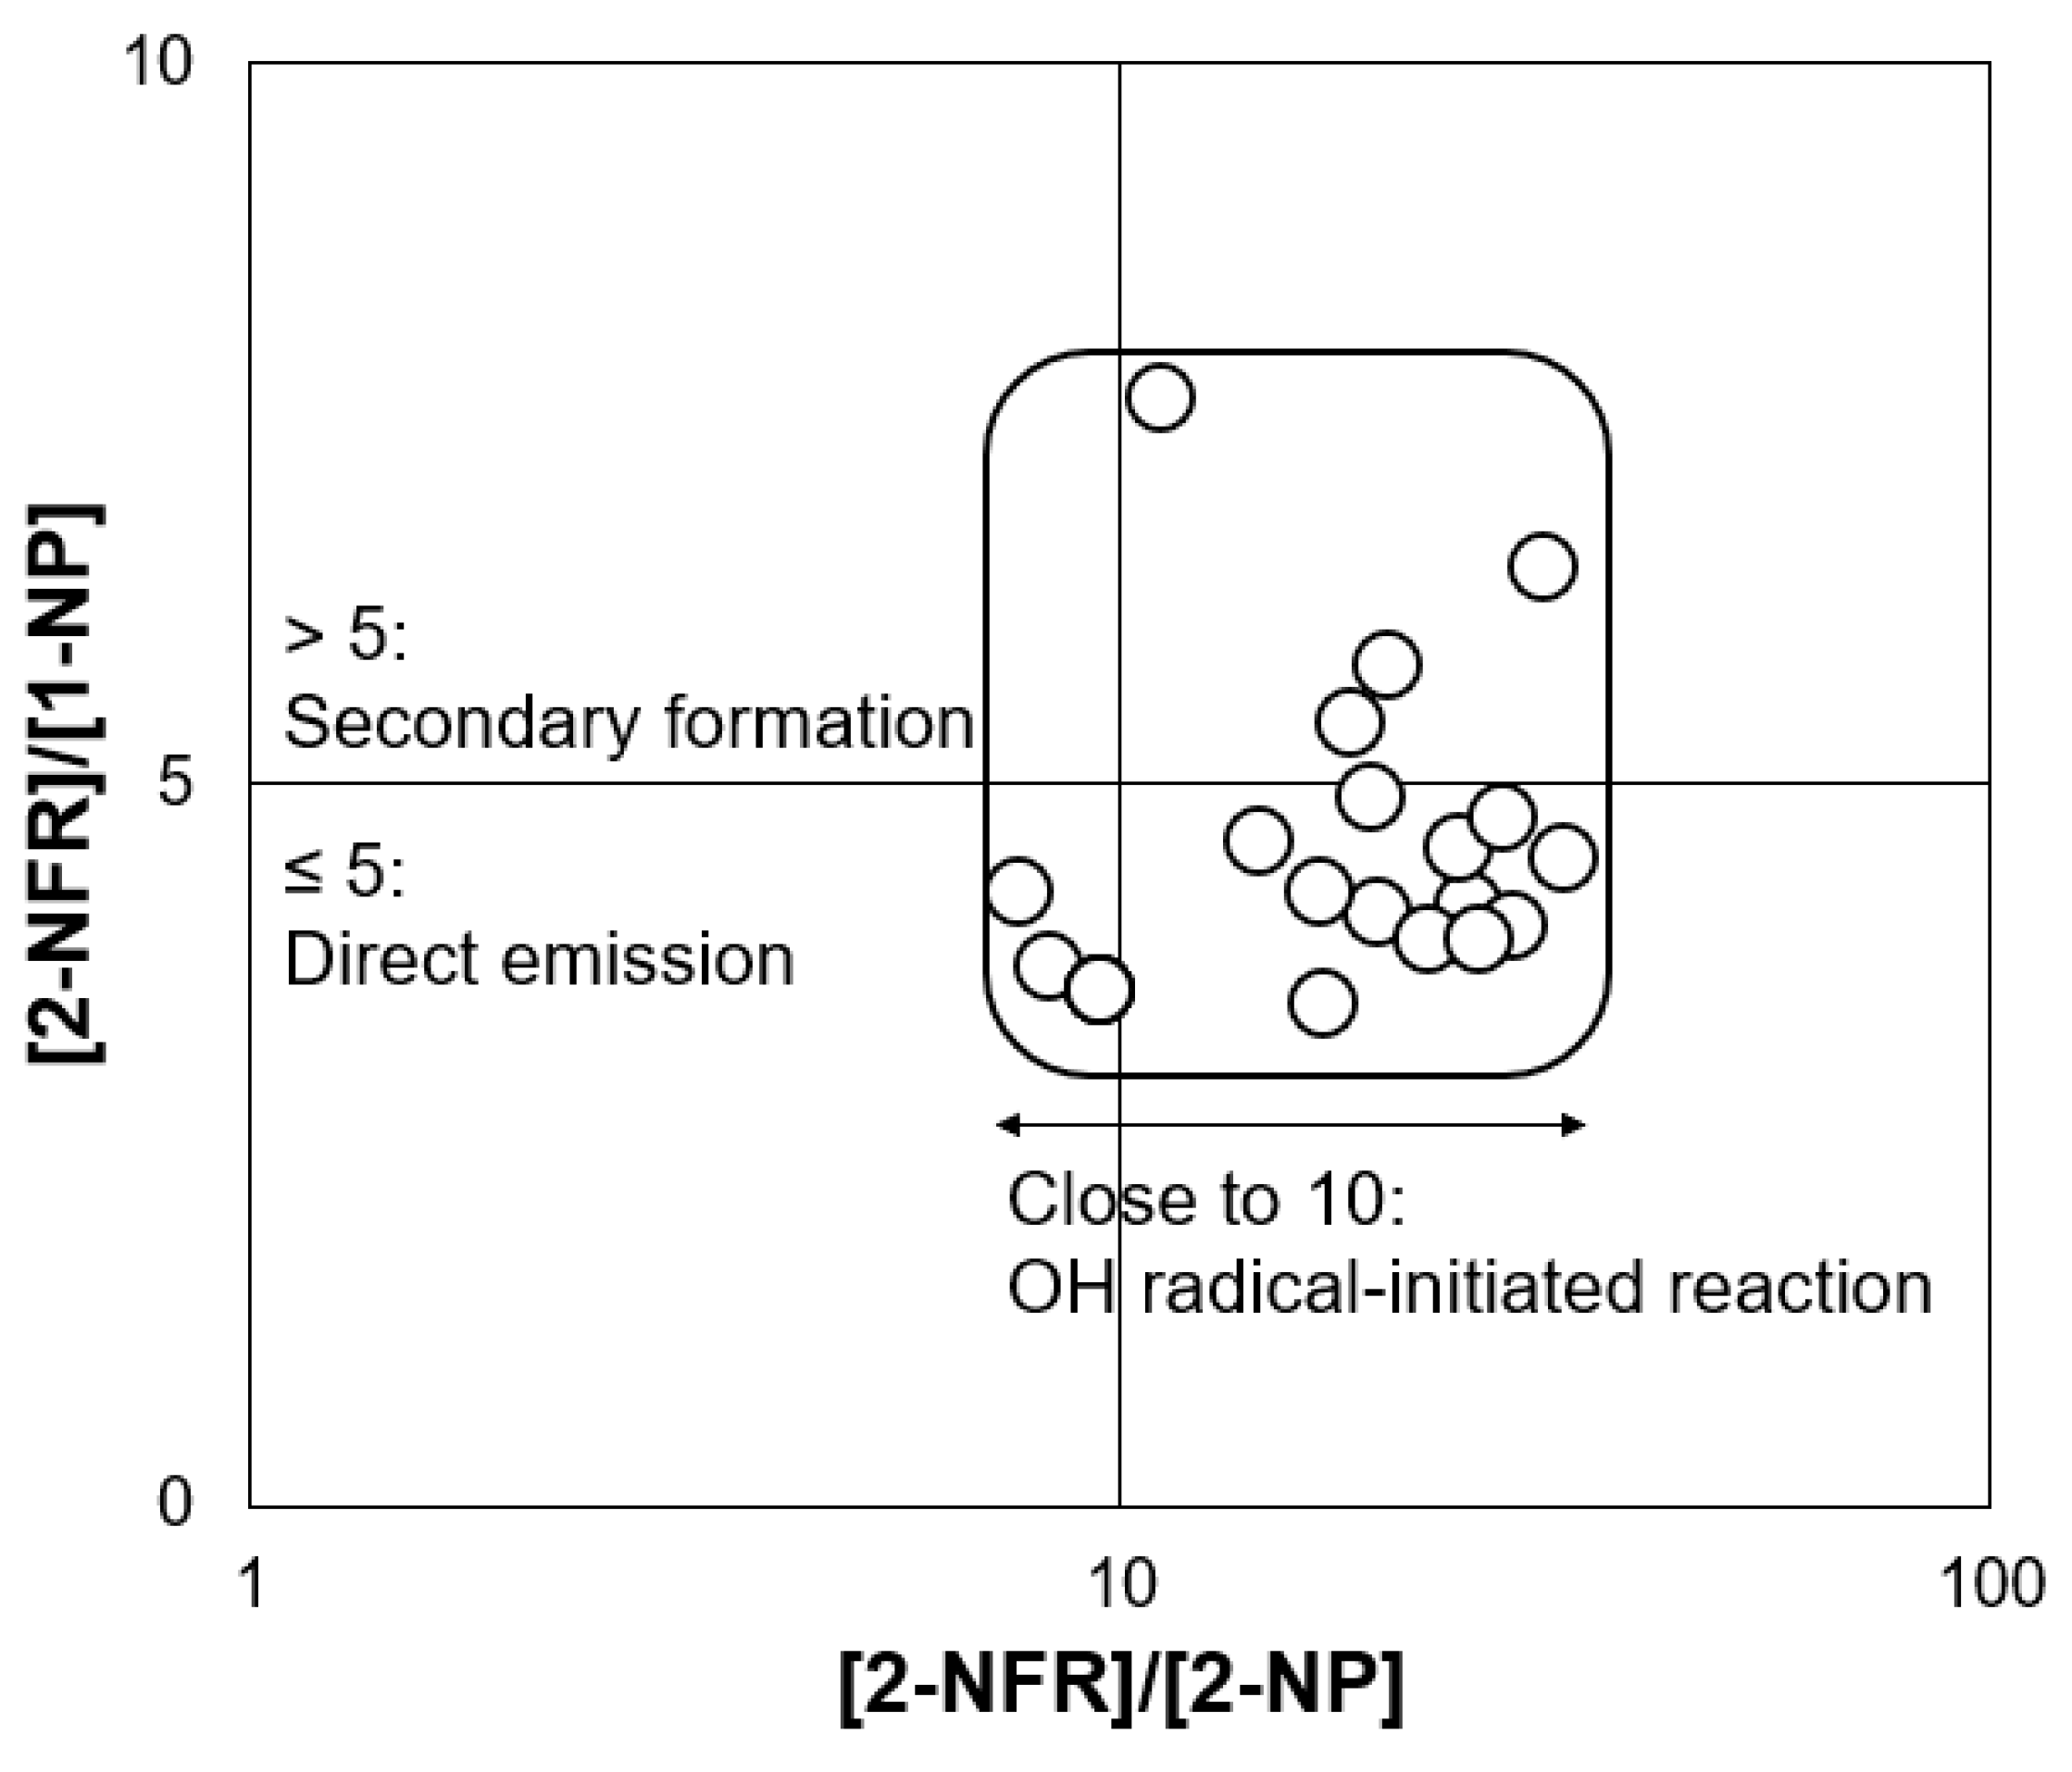
3.3. Potential Emission Sources
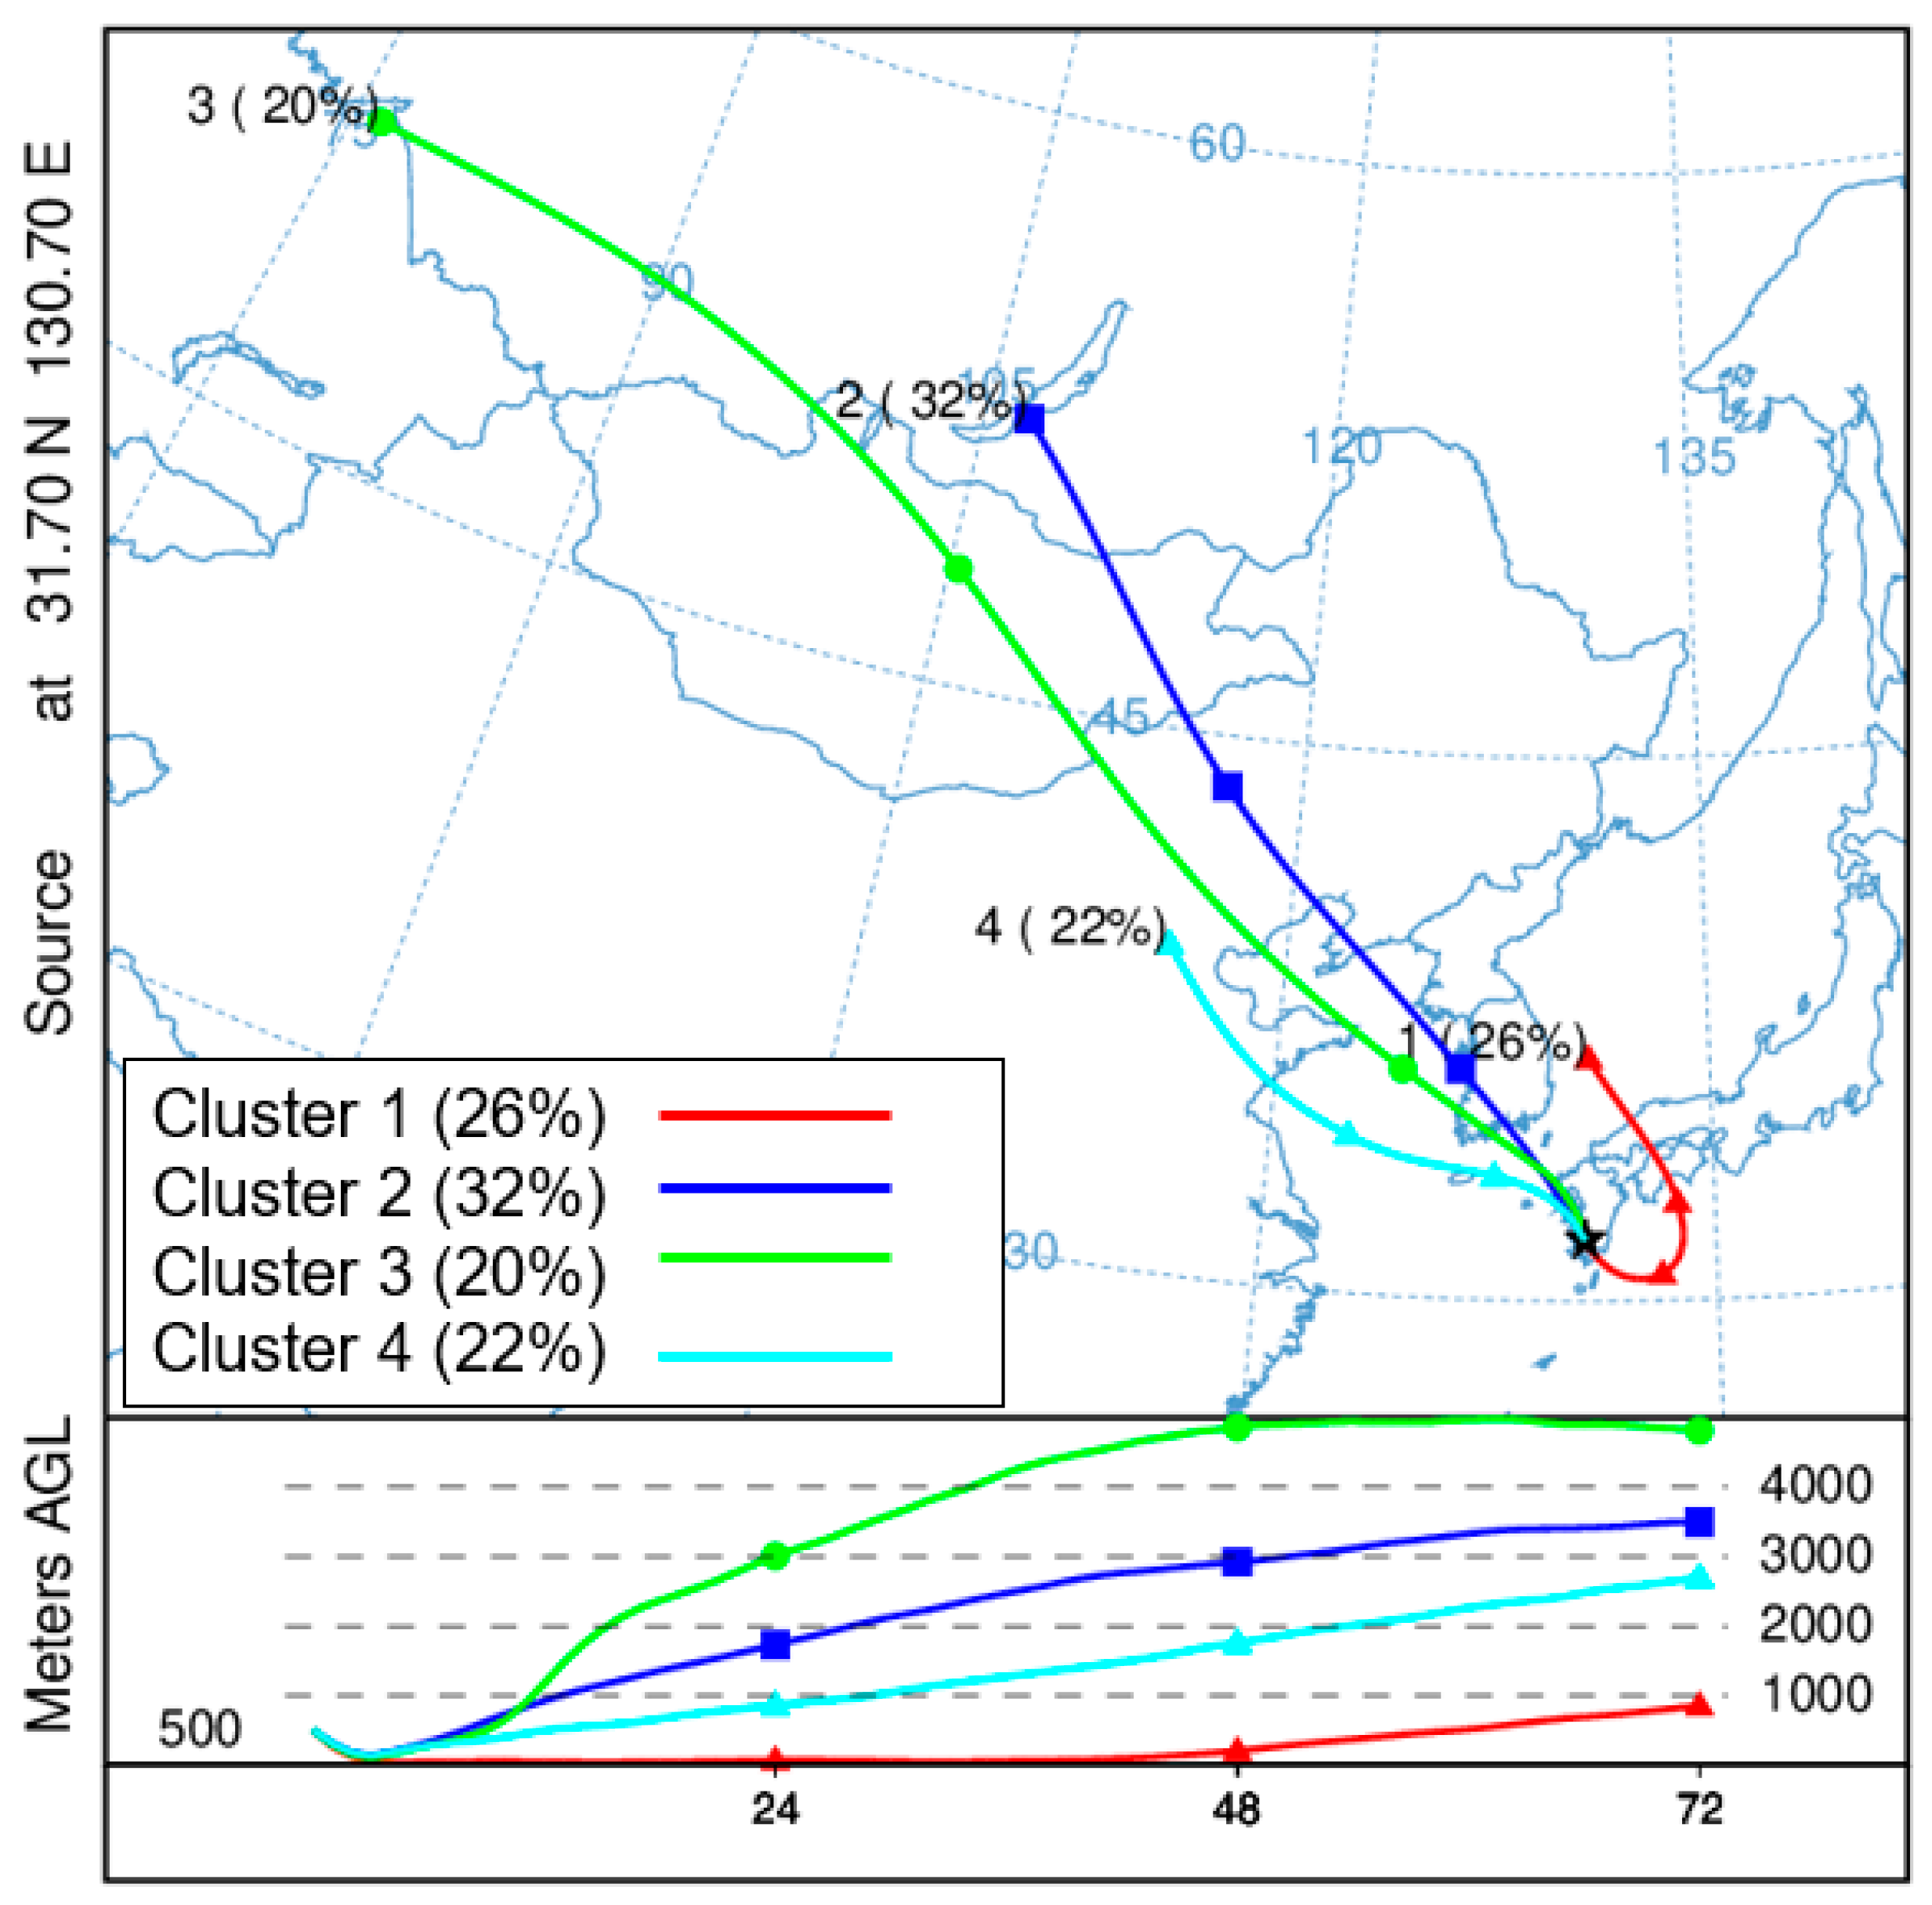
3.4. Backward Trajectory Analysis
3.5. Health Risk Assessment
4. Conclusions
Supplementary Materials
Author Contributions
Funding
Institutional Review Board Statement
Informed Consent Statement
Data Availability Statement
Conflicts of Interest
References
- WHO; Health Effects of Particulate Matter. Policy Implications for Countries in Eastern Europe. Caucasus and Central Asia; World Health Organization Regional Office for Europe: Copenhagen, Denmark, 2013. [Google Scholar]
- Kim, K.-H.; Kabir, E.; Kabir, S. A review on the human health impact of airborne particulate matter. Environ. Int. 2015, 74, 136–143. [Google Scholar] [CrossRef] [PubMed]
- Zhang, L.L.; Zhang, X.; Xing, W.L.; Zhou, Q.Y.; Yang, L.; Nakatsubo, R.; Wei, Y.J.; Bi, J.R.; Shima, M.; Toriba, A.; et al. Natural aeolian dust particles have no substantial effect on atmospheric polycyclic aromatic hydrocarbons (PAHs): A laboratory study based on naphthalene. Environ. Pollut. 2020, 263, 114454. [Google Scholar] [CrossRef] [PubMed]
- Martinelli, N.; Olivieri, O.; Girelli, D. Air particulate matter and cardiovascular disease: A narrative review. Eur. J. Intern. Med. 2013, 24, 295–302. [Google Scholar] [CrossRef] [PubMed]
- Zhang, H.; Zhang, L.L.; Yang, L.; Zhou, Q.Y.; Zhang, X.; Xing, W.L.; Kazuichi, H.; Toriba, A.; Tang, N. Impact of COVID-19 outbreak on the long-range transport of common air pollutants in KUWAMS. Chem. Pharm. Bull. 2020, in press. [Google Scholar]
- Yang, Y.; Ruan, Z.; Wang, X.; Yang, Y.; Mason, T.G.; Lin, H.; Tian, L. Short-term and long-term exposures to fine particulate matter constituents and health: A systematic review and meta-analysis. Environ. Pollut. 2019, 247, 874–882. [Google Scholar] [CrossRef] [PubMed]
- Mukherjee, A.; Agrawal, M. World air particulate matter: Sources, distribution and health effects. Environ. Chem. Lett. 2017, 15, 283–309. [Google Scholar] [CrossRef]
- Nisbet, I.C.; Lagoy, P.K. Toxic equivalency factors (TEFs) for polycyclic aromatic hydrocarbons (PAHs). Regul. Toxicol. Pharmacol. 1992, 16, 290–300. [Google Scholar] [CrossRef]
- Durant, J.L.; Busby, W.F., Jr.; Lafleur, A.L.; Penman, B.W.; Crespi, C.L. Human cell mutagenicity of oxygenated, nitrated and unsubstituted polycyclic aromatic hydrocarbons associated with urban aerosols. Mutat. Res. 1996, 371, 123–157. [Google Scholar] [CrossRef]
- Taga, R.; Tang, N.; Hattori, T.; Tamura, K.; Sakai, S.; Toriba, A.; Kizu, R.; Hayakawa, K. Direct-acting mutagenicity of extracts of coal burning-derived particulates and contribution of nitropolycyclic aromatic hydrocarbons. Mutat. Res. 2005, 581, 91–95. [Google Scholar] [CrossRef]
- IARC. Bitumens and bitumen emissions, and some n- and s-heterocyclic polycyclic aromatic hydrocarbons. In Monographs on the Evaluation of Carcinogenic Risks to Humans Volume; International Agency for Research on Cancer: Lyon, France, 2013; Volume 103. [Google Scholar]
- IARC. Diesel and gasoline engine exhausts and some nitroarenes. In Monographs on the Evaluation of Carcinogenic Risks to Humans Volume; International Agency for Research on Cancer: Lyon, France, 2013; Volume 105. [Google Scholar]
- IARC. Outdoor Air Pollution. In Monographs on the Evaluation of Carcinogenic Risks to Humans; International Agency for Research on Cancer: Lyon, France, 2015; Volume 109. [Google Scholar]
- Anyenda, E.O.; Higashi, T.; Kambayashi, Y.; Thao, N.T.T.; Michigami, Y.; Fujimura, M.; Hara, J.; Tsujiguchi, H.; Kitaoka, M.; Asakura, H. Exposure to daily ambient particulate polycyclic aromatic hydrocarbons and cough occurrence in adult chronic cough patients: A longitudinal study. Atmos. Environ. 2016, 140, 34–41. [Google Scholar] [CrossRef]
- Zhou, Q.Y.; Zhang, L.L.; Yang, L.; Zhang, X.; Xing, W.L.; Hu, M.; Chen, B.; Han, C.; Toriba, A.; Hayakawa, K.; et al. Long-term variability of inorganic ions in TSP at a remote background site in Japan (Wajima) from 2005 to 2015. Chemosphere 2021, 264, 128427. [Google Scholar] [CrossRef] [PubMed]
- Zhou, J.; Xing, Z.; Deng, J.; Du, K. Characterizing and sourcing ambient PM2.5 over key emission regions in China Ⅰ: Water-soluble ions and carbonaceous fractions. Atmos. Environ. 2016, 135, 20–30. [Google Scholar] [CrossRef]
- Tian, M.; Wang, H.; Chen, Y.; Yang, F.; Zhang, X.; Zou, Q.; Zhang, R.; Ma, Y.; He, K. Characteristics of aerosol pollution during heavy haze events in Suzhou, China. Atmos. Chem. Phys. 2016, 16, 7357–7371. [Google Scholar] [CrossRef]
- Zhai, G.; Zhang, N.; Dong, J.; Wang, S.; Shang, K. Analysis of Association Rules between Hourly Meteorological Factors and PM2.5 Water-Soluble Inorganic Ions in Lanzhou, China. Recent Pat. Comput. Sci. 2016, 9, 19–24. [Google Scholar] [CrossRef]
- Zhang, L.L.; Yang, L.; Zhou, Q.Y.; Zhang, X.; Xing, W.L.; Wei, Y.; Hu, M.; Zhao, L.; Toriba, A.; Hayakawa, K.; et al. Size distribution of particulate polycyclic aromatic hydrocarbons in fresh combustion smoke and ambient air: A review. J. Environ. Sci. 2020, 88, 370–384. [Google Scholar] [CrossRef] [PubMed]
- Harrison, R.M.; Smith, D.; Luhana, L. Source apportionment of atmospheric polycyclic aromatic hydrocarbons collected from an urban location in Birmingham, UK. Environ. Sci. Technol. 1996, 30, 825–832. [Google Scholar] [CrossRef]
- Tang, N.; Hattori, T.; Taga, R.; Igarashi, K.; Yang, X.; Tamura, K.; Kakimoto, H.; Mishukov, V.F.; Toriba, A.; Kizu, R.; et al. Polycyclic aromatic hydrocarbons and nitropolycyclic aromatic hydrocarbons in urban air particulates and their relationship to emission sources in the Pan–Japan sea countries. Atmos. Environ. 2005, 39, 5817–5826. [Google Scholar] [CrossRef]
- Arey, J.; Zielinska, B.; Atkinson, R.; Winer, A.M.; Ramdahl, T.; Pitts, J.N. The formation of nitro-PAH from the gas-phase reactions of fluoranthene and pyrene with the oh radical in the presence of NOx. Atmos. Environ. 1986, 20, 2339–2345. [Google Scholar] [CrossRef]
- Wang, H.; Zhu, B.; Shen, L.; Xu, H.; An, J.; Xue, G.; Cao, J. Water-soluble ions in atmospheric aerosols measured in five sites in the Yangtze River delta, China: Size-fractionated, seasonal variations and sources. Atmos. Environ. 2015, 123, 370–379. [Google Scholar] [CrossRef]
- Zhang, J.; Tong, L.; Huang, Z.; Zhang, H.; He, M.; Dai, X.; Zheng, J.; Xiao, H. Seasonal variation and size distributions of water-soluble inorganic ions and carbonaceous aerosols at a coastal site in Ningbo, China. Sci. Total Environ. 2018, 639, 793–803. [Google Scholar] [CrossRef]
- Poulidis, A.P.; Takemi, T.; Shimizu, A.; Iguchi, M.; Jenkins, S.F. Statistical analysis of dispersal and deposition patterns of volcanic emissions from Mt. Sakurajima, Japan. Atmos. Environ. 2018, 179, 305–320. [Google Scholar] [CrossRef]
- Yang, L.; Tang, N.; Matsuki, A.; Takami, A.; Hatakeyama, S.; Kaneyasu, N.; Nagato, E.G.; Sato, K.; Yoshino, A.; Hayakawa, K. A comparison of particulate-bound polycyclic aromatic hydrocarbons long-range transported from the Asian continent to the Noto Peninsula and Fukue Island, Japan. Asian J. Atmos. Environ. 2018, 12, 369–376. [Google Scholar] [CrossRef]
- Yang, L.; Zhang, L.L.; Zhang, H.; Zhou, Q.Y.; Zhang, X.; Xing, W.L.; Takami, A.; Sato, K.; Shimizu, A.; Yoshino, A.; et al. Comparative analysis of PM2.5-bound polycyclic aromatic hydrocarbons (PAHs), nitro-pahs (NPAHs) and water-soluble inorganic ions (WSIIs) at two background sites in Japan. Int. J. Environ. Res. Public Health 2020, 17, 8224. [Google Scholar] [CrossRef] [PubMed]
- Shinohara, H. Composition of volcanic gases emitted during repeating Vulcanian eruption stage of Shinmoedake, Kirishima volcano, Japan. Earth Planets Space 2013, 65, 667–675. [Google Scholar] [CrossRef]
- Zhang, L.L.; Tokuda, T.; Yang, L.; Zhou, Q.Y.; Zhang, X.; Xing, W.L.; Wu, Q.; Zhou, Z.; Chen, R.; Kameda, T.; et al. Characteristics and health risks of particulate polycyclic aromatic hydrocarbons and nitro-polycyclic aromatic hydrocarbons at urban and suburban elementary schools in Shanghai, China. Asian J. Atmos. Environ. 2019, 13, 266–275. [Google Scholar] [CrossRef]
- Yang, L.; Zhang, X.; Xing, W.L.; Zhou, Q.Y.; Zhang, L.L.; Wu, Q.; Zhou, Z.; Chen, R.; Toriba, A.; Hayakawa, K.; et al. Yearly variation in characteristics and health risk of polycyclic aromatic hydrocarbons and nitro-pahs in urban shanghai from 2010 to 2018. J. Environ. Sci. 2021, 99, 72–79. [Google Scholar] [CrossRef]
- Farren, N.J.; Dunmore, R.E.; Mead, M.I.; Nadzir, M.; Shahrul, M.; Samah, A.A.; Phang, S.-M.; Bandy, B.J.; Sturges, W.T.; Hamilton, J.F. Chemical characterisation of water-soluble ions in atmospheric particulate matter on the east coast of peninsular Malaysia. Atmos. Chem. Phys. 2019, 19, 1537–1553. [Google Scholar] [CrossRef]
- OEHHA. Air Toxics Hot Spots Program Risk Assessment Guidelines; Part ii Technical Support Document for Describing Available Cancer Potency Factors; Office of Environmental Health Hazard Assessment, Oakland, California Environmental Protection Agency: Oakland, CA, USA, 2005.
- WHO. Air Quality Guidelines for Europe; Part ii evaluation of risks to human health, Chapter 5 organic pollutants; European Series, No. 91; WHO Regional Publications: Copenhagen, Denmark, 2000. [Google Scholar]
- Hayakawa, K.; Tang, N.; Nagato, E.G.; Toriba, A.; Sakai, S.; Kano, F.; Goto, S.; Endo, O.; Arashidani, K.-i.; Kakimoto, H. Long term trends in atmospheric concentrations of polycyclic aromatic hydrocarbons and nitropolycyclic aromatic hydrocarbons: A study of Japanese cities from 1997 to 2014. Environ. Pollut. 2018, 233, 474–482. [Google Scholar] [CrossRef]
- Xing, W.L.; Zhang, L.L.; Yang, L.; Zhou, Q.Y.; Zhang, X.; Toriba, A.; Hayakawa, K.; Tang, N. Characteristics of PM2.5-bound polycyclic aromatic hydrocarbons and nitro-polycyclic aromatic hydrocarbons at a roadside air pollution monitoring station in Kanazawa, Japan. Int. J. Environ. Res. Public Health 2020, 17, 805. [Google Scholar] [CrossRef]
- Zhang, L.L.; Morisaki, H.; Wei, Y.; Li, Z.; Yang, L.; Zhou, Q.Y.; Zhang, X.; Xing, W.L.; Hu, M.; Shima, M.; et al. PM2.5-bound polycyclic aromatic hydrocarbons and nitro-polycyclic aromatic hydrocarbons inside and outside a primary school classroom in Beijing: Concentration, composition, and inhalation cancer risk. Sci. Total Environ. 2020, 705, 135840. [Google Scholar] [CrossRef]
- Yang, L.; Suzuki, G.; Zhang, L.L.; Zhou, Q.Y.; Zhang, X.; Xing, W.L.; Shima, M.; Yoda, Y.; Nakatsubo, R.; Hiraki, T.; et al. The characteristics of polycyclic aromatic hydrocarbons in different emission source areas in Shenyang, China. Int. J. Environ. Res. Public Health 2019, 16, 2817. [Google Scholar] [CrossRef] [PubMed]
- Byambaa, B.; Yang, L.; Matsuki, A.; Nagato, E.G.; Gankhuyag, K.; Chuluunpurev, B.; Banzragch, L.; Chonokhuu, S.; Tang, N.; Hayakawa, K. Sources and characteristics of polycyclic aromatic hydrocarbons in ambient total suspended particles in Ulaanbaatar city, Mongolia. Int. J. Environ. Res. Public Health 2019, 16, 442. [Google Scholar] [CrossRef] [PubMed]
- Huy, D.H.; Hien, T.T.; Takenaka, N. Comparative study on water-soluble inorganic ions in PM2.5 from two distinct climate regions and air quality. J. Environ. Sci. 2020, 88, 349–360. [Google Scholar] [CrossRef] [PubMed]
- Khan, M.F.; Hirano, K.; Masunaga, S. Quantifying the sources of hazardous elements of suspended particulate matter aerosol collected in Yokohama, Japan. Atmos. Environ. 2010, 44, 2646–2657. [Google Scholar] [CrossRef]
- Jiang, N.; Duan, S.; Yu, X.; Zhang, R.; Wang, K. Comparative major components and health risks of toxic elements and polycyclic aromatic hydrocarbons of PM2.5 in winter and summer in Zhengzhou: Based on three-year data. Atmos. Res. 2018, 213, 173–184. [Google Scholar] [CrossRef]
- Ye, Z.; Liu, J.; Gu, A.; Feng, F.; Liu, Y.; Bi, C.; Xu, J.; Li, L.; Chen, H.; Chen, Y. Chemical characterization of fine particulate matter in Changzhou, China, and source apportionment with offline aerosol mass spectrometry. Atmos. Chem. Phys. 2017, 17, 2573–2592. [Google Scholar] [CrossRef]
- Nirmalkar, J.; Batmunkh, T.; Jung, J. An optimized tracer-based approach for estimating organic carbon emissions from biomass burning in Ulaanbaatar, Mongolia. Atmos. Chem. Phys. 2020, 20, 3231–3247. [Google Scholar] [CrossRef]
- Zhang, L.L.; Yang, L.; Zhang, H.; Zhou, Q.Y.; Zhang, X.; Xing, W.L.; Toriba, A.; Hayakawa, K.; Tang, N. Impact of the COVID-19 outbreak on the long-range transport of particulate PAHs in East Asia. Aerosol Air Qual. Res. 2020, 20, 2035–2046. [Google Scholar] [CrossRef]
- Zhang, X.; Zhang, L.L.; Yang, L.; Zhou, Q.Y.; Xing, W.L.; Toriba, A.; Hayakawa, K.; Wei, Y.; Tang, N. Characteristics of polycyclic aromatic hydrocarbons (PAHs) and common air pollutants at Wajima, a remote background site in japan. Int. J. Environ. Res. Public Health 2020, 17, 957. [Google Scholar] [CrossRef]
- Ma, W.-L.; Liu, L.-Y.; Jia, H.-L.; Yang, M.; Li, Y.-F. PAHs in Chinese atmosphere part i: Concentration, source and temperature dependence. Atmos. Environ. 2018, 173, 330–337. [Google Scholar] [CrossRef]
- Yamasaki, H.; Kuwata, K.; Miyamoto, H. Effects of ambient temperature on aspects of airborne polycyclic aromatic hydrocarbons. Environ. Sci. Technol. 1982, 16, 189–194. [Google Scholar] [CrossRef]
- Tang, N.; Sato, K.; Tokuda, T.; Tatematsu, M.; Hama, H.; Suematsu, C.; Kameda, T.; Toriba, A.; Hayakawa, K. Factors affecting atmospheric 1-, 2-nitropyrenes and 2-nitrofluoranthene in winter at Noto Peninsula, a remote background site, Japan. Chemosphere 2014, 107, 324–330. [Google Scholar] [CrossRef] [PubMed]
- Liu, D.; Lin, T.; Syed, J.H.; Cheng, Z.; Xu, Y.; Li, K.; Zhang, G.; Li, J. Concentration, source identification, and exposure risk assessment of pm2. 5-bound parent PAHs and nitro-PAHs in atmosphere from typical Chinese cities. Sci. Rep. 2017, 7, 10398. [Google Scholar] [CrossRef] [PubMed]
- Zhang, L.L.; Morisaki, H.; Wei, Y.; Li, Z.; Yang, L.; Zhou, Q.Y.; Zhang, X.; Xing, W.L.; Hu, M.; Shima, M.; et al. Characteristics of air pollutants inside and outside a primary school classroom in Beijing and respiratory health impact on children. Environ. Pollut. 2019, 255, 113147. [Google Scholar] [CrossRef] [PubMed]
- Zhang, F.; Xu, L.; Chen, J.; Chen, X.; Niu, Z.; Lei, T.; Li, C.; Zhao, J. Chemical characteristics of PM2.5 during haze episodes in the urban of Fuzhou, China. Particuology 2013, 11, 264–272. [Google Scholar] [CrossRef]
- Rogge, W.F.; Hildemann, L.M.; Mazurek, M.A.; Cass, G.R.; Simoneit, B.R. Sources of fine organic aerosol. 2. Noncatalyst and catalyst-equipped automobiles and heavy-duty diesel trucks. Environ. Sci. Technol. 1993, 27, 636–651. [Google Scholar] [CrossRef]
- Simcik, M.F.; Eisenreich, S.J.; Lioy, P.J. Source apportionment and source/sink relationships of pahs in the coastal atmosphere of Chicago and lake Michigan. Atmos. Environ. 1999, 33, 5071–5079. [Google Scholar] [CrossRef]
- Yunker, M.B.; Macdonald, R.W.; Vingarzan, R.; Mitchell, R.H.; Goyette, D.; Sylvestre, S. PAHs in the Fraser river basin: A critical appraisal of PAH ratios as indicators of PAH source and composition. Org. Geochem. 2002, 33, 489–515. [Google Scholar] [CrossRef]
- Bamford, H.A.; Baker, J.E. Nitro-polycyclic aromatic hydrocarbon concentrations and sources in urban and suburban atmospheres of the mid-Atlantic region. Atmos. Environ. 2003, 37, 2077–2091. [Google Scholar] [CrossRef]
- Park, S.; Song, C.; Kim, M.; Kwon, S.; Lee, K. Study on size distribution of total aerosol and water-soluble ions during an Asian dust storm event at Jeju island, Korea. Environ. Monit. Assess. 2004, 93, 157–183. [Google Scholar] [CrossRef]
- Tang, N.; Hakamata, M.; Sato, K.; Okada, Y.; Yang, X.; Tatematsu, M.; Toriba, A.; Kameda, T.; Hayakawa, K. Atmospheric behaviors of polycyclic aromatic hydrocarbons at a Japanese remote background site, Noto Peninsula, from 2004 to 2014. Atmos. Environ. 2015, 120, 144–151. [Google Scholar] [CrossRef]
- Sato, K.; Takami, A.; Irei, S.; Miyoshi, T.; Ogawa, Y.; Yoshino, A.; Nakayama, H.; Maeda, M.; Hatakeyama, S.; Hara, K. Transported and local organic aerosols over Fukuoka, Japan. Aerosol Air Qual. Res. 2013, 13, 1263–1272. [Google Scholar] [CrossRef]
- Kakimoto, H.; Kitamura, M.; Matsumoto, Y.; Sakai, S.; Kanoh, F.; Murahashi, T.; Akutsu, K.; Kizu, R.; Hayakawa, K. Comparison of atmospheric polycyclic aromatic hydrocarbons and nitropolycyclic aromatic hydrocarbons in Kanazawa, Sapporo and Tokyo. J. Health Sci. 2000, 46, 5–15. [Google Scholar] [CrossRef][Green Version]
- Hong, W.-J.; Jia, H.; Ma, W.-L.; Sinha, R.K.; Moon, H.-B.; Nakata, H.; Minh, N.H.; Chi, K.H.; Li, W.-L.; Kannan, K. Distribution, fate, inhalation exposure and lung cancer risk of atmospheric polycyclic aromatic hydrocarbons in some Asian countries. Environ. Sci. Technol. 2016, 50, 7163–7174. [Google Scholar] [CrossRef] [PubMed]


| Species | Abbreviation | Minimum | Median | Maximum | Average ± SD a |
|---|---|---|---|---|---|
| PAHs (ng/m3) | |||||
| Fluoranthene | FR | 0.05 | 0.23 | 0.72 | 0.31 ± 0.20 |
| Pyrene | Pyr | 0.04 | 0.14 | 0.46 | 0.18 ± 0.11 |
| Benz[a]anthracene | BaA | 0.01 | 0.05 | 0.13 | 0.06 ± 0.03 |
| Chrysene | Chr | 0.02 | 0.06 | 0.22 | 0.09 ± 0.05 |
| Benzo[b]fluoranthene | BbF | 0.04 | 0.16 | 0.48 | 0.19 ± 0.12 |
| Benzo[k]fluoranthene | BkF | 0.01 | 0.06 | 0.17 | 0.07 ± 0.04 |
| Benzo[a]pyrene | BaP | 0.02 | 0.09 | 0.19 | 0.09 ± 0.05 |
| Benzo[ghi]perylene | BgPe | 0.06 | 0.18 | 0.38 | 0.18 ± 0.09 |
| Indeno[1,2,3-cd]pyrene | IDP | 0.04 | 0.15 | 0.33 | 0.16 ± 0.08 |
| Total PAHs | ƩPAHs | 0.36 | 1.07 | 2.90 | 1.32 ± 0.71 |
| NPAHs (pg/m3) | |||||
| 1-Nitropyrene | 1-NP | 0.31 | 1.69 | 3.87 | 1.77 ± 1.02 |
| 2-Nitropyrene | 2-NP | 0.14 | 0.48 | 0.86 | 0.46 ± 0.25 |
| 2-Nitrofluoranthene | 2-NFR | 1.53 | 7.40 | 17.7 | 7.75 ± 4.59 |
| Total NPAHs | ƩNPAHs | 2.12 | 9.88 | 22.3 | 9.98 ± 5.75 |
| WSIIs (μg/m3) | |||||
| Sodium | Na+ | 0.03 | 0.08 | 0.15 | 0.07 ± 0.03 |
| Ammonium | NH4+ | 0.54 | 1.30 | 2.64 | 1.35 ± 0.59 |
| Potassium | K+ | 0.05 | 0.09 | 0.22 | 0.11 ± 0.06 |
| Calcium | Ca2+ | 0.06 | 0.10 | 0.24 | 0.11 ± 0.04 |
| Magnesium | Mg2+ | 0.01 | 0.02 | 0.04 | 0.02 ± 0.01 |
| Chloride | Cl− | <LOD b | 0.03 | 0.10 | 0.04 ± 0.02 |
| Nitrate | NO3− | <LOD b | 0.19 | 0.76 | 0.28 ± 0.23 |
| Sulfate | SO42− | 1.14 | 3.49 | 7.80 | 3.78 ± 1.77 |
| Total WSIIs | ƩWSIIs | 1.96 | 5.31 | 11.4 | 5.74 ± 2.59 |
| Ratio Values a | Coal Burning | Traffic Emission | |
|---|---|---|---|
| [FR]/([FR] + [Pyr]) | 0.61 (0.50–0.74) | >0.5 b | 0.4–0.5 b |
| [BaA]/[([BaA]/[Chr]) | 0.41 (0.34–0.52) | >0.35 c | 0.2–0.35 c |
| [BbF]/([BbF] + [BkF]) | 0.74 (0.72–0.76) | 0.78–0.95 c | 0.52–0.60 c |
| [BaP]/[BgPe] | 0.57 (0.32–0.90) | >0.6 d | <0.6 d |
| [IDP]/([IDP] + [BgPe]) | 0.48 (0.34–0.58) | >0.5 e | 0.2–0.5 e |
| [1-NP]/[Pyr] | 0.008 (0.005–0.019) | 0.001 f | 0.36 f |
| [NO3−]/[SO42−] | 0.11 (0 h–0.32) | <1.0 g | ≥1.0 g |
| Ratio Values a | PM2.5 b | Sea Salt b | |
|---|---|---|---|
| [SO42−]/[Na+] | 14.5 (3.28–28.8) | 14.2 | 0.25 |
| [K+]/[Na+] | 1.12 (0.37–4.11) | 1.26 | 0.037 |
| [Ca2+]/[Na+] | 1.08 (0.41–2.27) | 1.11 | 0.038 |
| [Mg2+]/[Na+] | 0.26 (0.10–0.66) | 0.54 | 0.12 |
| Species a | TEF b | Minimum | Median | Maximum | Average ± SD c |
|---|---|---|---|---|---|
| FR | 0.001 | 0.05 | 0.23 | 0.72 | 0.31 ± 0.20 |
| Pyr | 0.001 | 0.04 | 0.14 | 0.46 | 0.18 ± 0.11 |
| BaA | 0.1 | 1.18 | 4.80 | 12.7 | 5.75 ± 2.88 |
| Chr | 0.01 | 0.16 | 0.59 | 2.15 | 0.87 ± 0.55 |
| BbF | 0.1 | 3.73 | 15.8 | 48.0 | 18.7 ± 12.1 |
| BkF | 0.1 | 1.28 | 5.65 | 17.3 | 6.65 ± 4.28 |
| BaP | 1 | 19.7 | 85.6 | 191 | 90.9 ± 45.8 |
| BgPe | 0.01 | 0.58 | 1.79 | 3.80 | 1.82 ± 0.95 |
| IDP | 0.1 | 4.14 | 15.0 | 33.4 | 16.3 ± 8.11 |
| 1-NP | 0.1 | 0.03 | 0.17 | 0.39 | 0.18 ± 0.10 |
| 2-NP | - d | ||||
| 2-NFR | 0.05 | 0.08 | 0.37 | 0.88 | 0.39 ± 0.23 |
| ƩBaPeq | 31.2 | 135 | 302 | 142 ± 73.8 | |
Publisher’s Note: MDPI stays neutral with regard to jurisdictional claims in published maps and institutional affiliations. |
© 2021 by the authors. Licensee MDPI, Basel, Switzerland. This article is an open access article distributed under the terms and conditions of the Creative Commons Attribution (CC BY) license (http://creativecommons.org/licenses/by/4.0/).
Share and Cite
Yang, L.; Zhou, Q.; Zhang, H.; Zhang, X.; Xing, W.; Wang, Y.; Bai, P.; Yamauchi, M.; Chohji, T.; Zhang, L.; et al. Atmospheric Behaviour of Polycyclic and Nitro-Polycyclic Aromatic Hydrocarbons and Water-Soluble Inorganic Ions in Winter in Kirishima, a Typical Japanese Commercial City. Int. J. Environ. Res. Public Health 2021, 18, 688. https://doi.org/10.3390/ijerph18020688
Yang L, Zhou Q, Zhang H, Zhang X, Xing W, Wang Y, Bai P, Yamauchi M, Chohji T, Zhang L, et al. Atmospheric Behaviour of Polycyclic and Nitro-Polycyclic Aromatic Hydrocarbons and Water-Soluble Inorganic Ions in Winter in Kirishima, a Typical Japanese Commercial City. International Journal of Environmental Research and Public Health. 2021; 18(2):688. https://doi.org/10.3390/ijerph18020688
Chicago/Turabian StyleYang, Lu, Quanyu Zhou, Hao Zhang, Xuan Zhang, Wanli Xing, Yan Wang, Pengchu Bai, Masahito Yamauchi, Tetsuji Chohji, Lulu Zhang, and et al. 2021. "Atmospheric Behaviour of Polycyclic and Nitro-Polycyclic Aromatic Hydrocarbons and Water-Soluble Inorganic Ions in Winter in Kirishima, a Typical Japanese Commercial City" International Journal of Environmental Research and Public Health 18, no. 2: 688. https://doi.org/10.3390/ijerph18020688
APA StyleYang, L., Zhou, Q., Zhang, H., Zhang, X., Xing, W., Wang, Y., Bai, P., Yamauchi, M., Chohji, T., Zhang, L., Hayakawa, K., Toriba, A., & Tang, N. (2021). Atmospheric Behaviour of Polycyclic and Nitro-Polycyclic Aromatic Hydrocarbons and Water-Soluble Inorganic Ions in Winter in Kirishima, a Typical Japanese Commercial City. International Journal of Environmental Research and Public Health, 18(2), 688. https://doi.org/10.3390/ijerph18020688