The Perceived Restorativeness of Differently Managed Forests and Its Association with Forest Qualities and Individual Variables: A Field Experiment


Abstract
1. Introduction
2. Theoretical Framework
2.1. The Theory of Lansdscape Preferences and Restoration
2.2. Forest Preferences and Restorativeness of Forests
2.3. The Effect of Individual Variables
2.4. Objectives and Hypotheses
- The restorative nature experience is based on four components (fascination, being away, compatibility, and extent [20,26]). However, it is not known whether these components are perceived differently during actual visits to differently managed forest sites. It is hypothesized that there are differences on restorative experiences between the forest sites.
- Several previous studies have identified a set of preferred forest qualities (e.g., beauty, species richness, naturalness, and brightness). However, there is a limited number of on-site studies with several forest sites, especially also including a pristine forest. It is hypothesized that these forest qualities differ in differently managed forests sites.
- As previous research is limited regarding how peoples’ individual variables such as age, education, and nature relationship affect how they evaluate their restorative experience in differently managed forests, specific hypotheses are not formulated on this issue.
- It is unknown if the preferred forest qualities explain the forest’s perceived restorativeness. This study hypothesized that the most important properties such us beauty, safety, brightness, biodiversity, and management significantly explain how restorative forests are perceived.
3. Materials and Methods
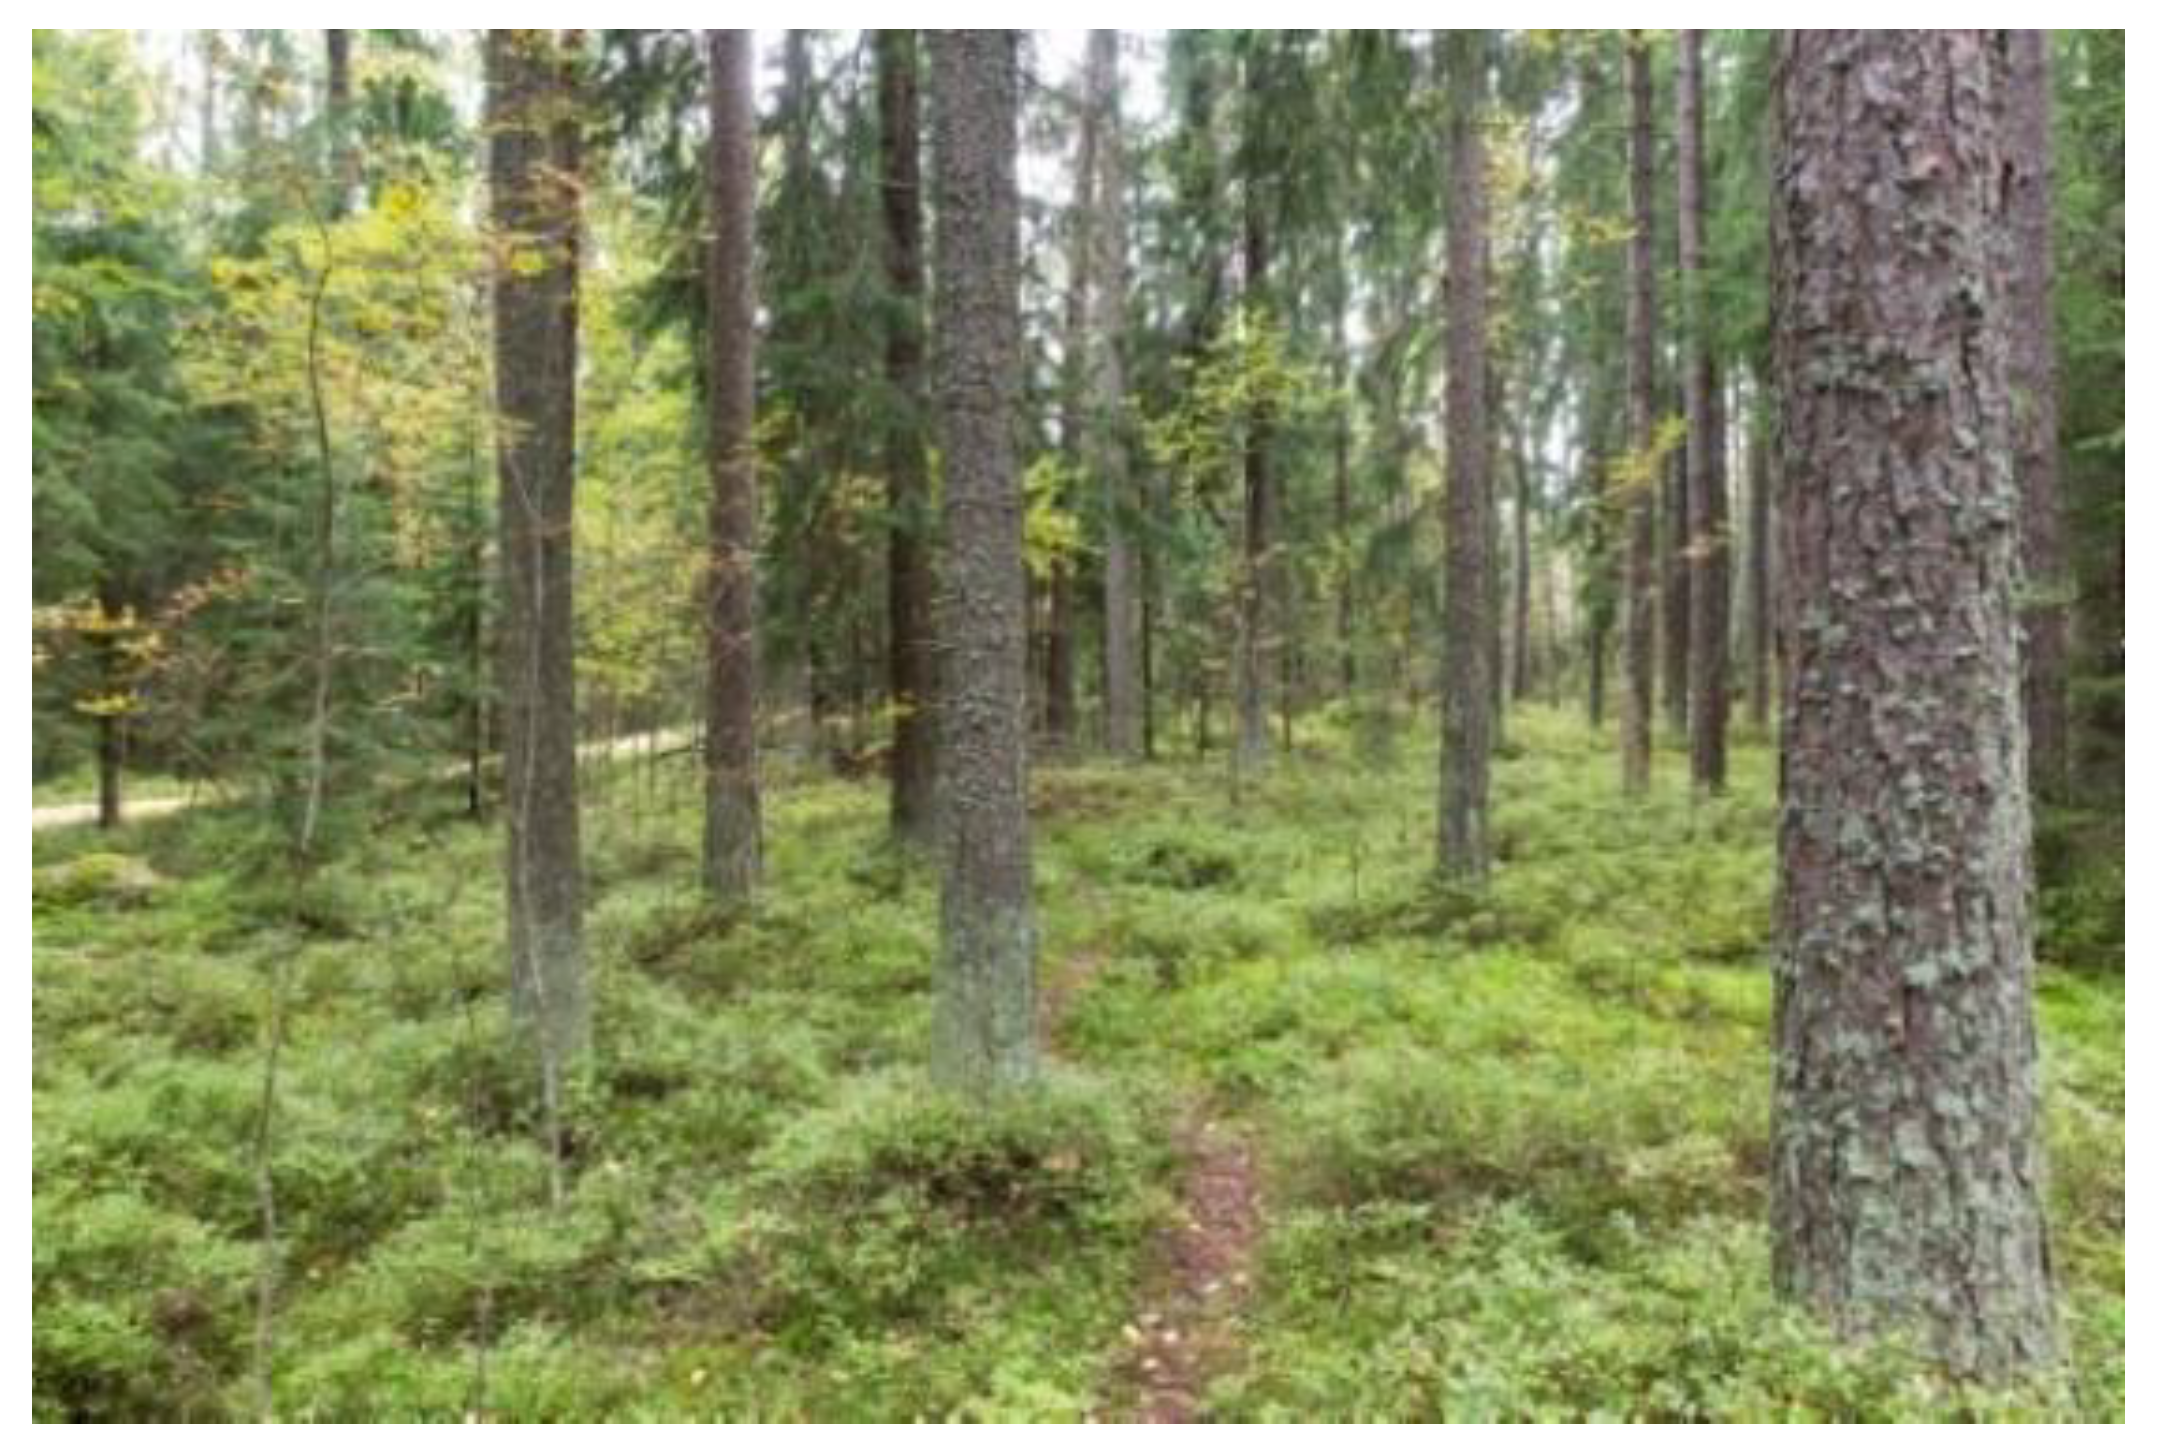
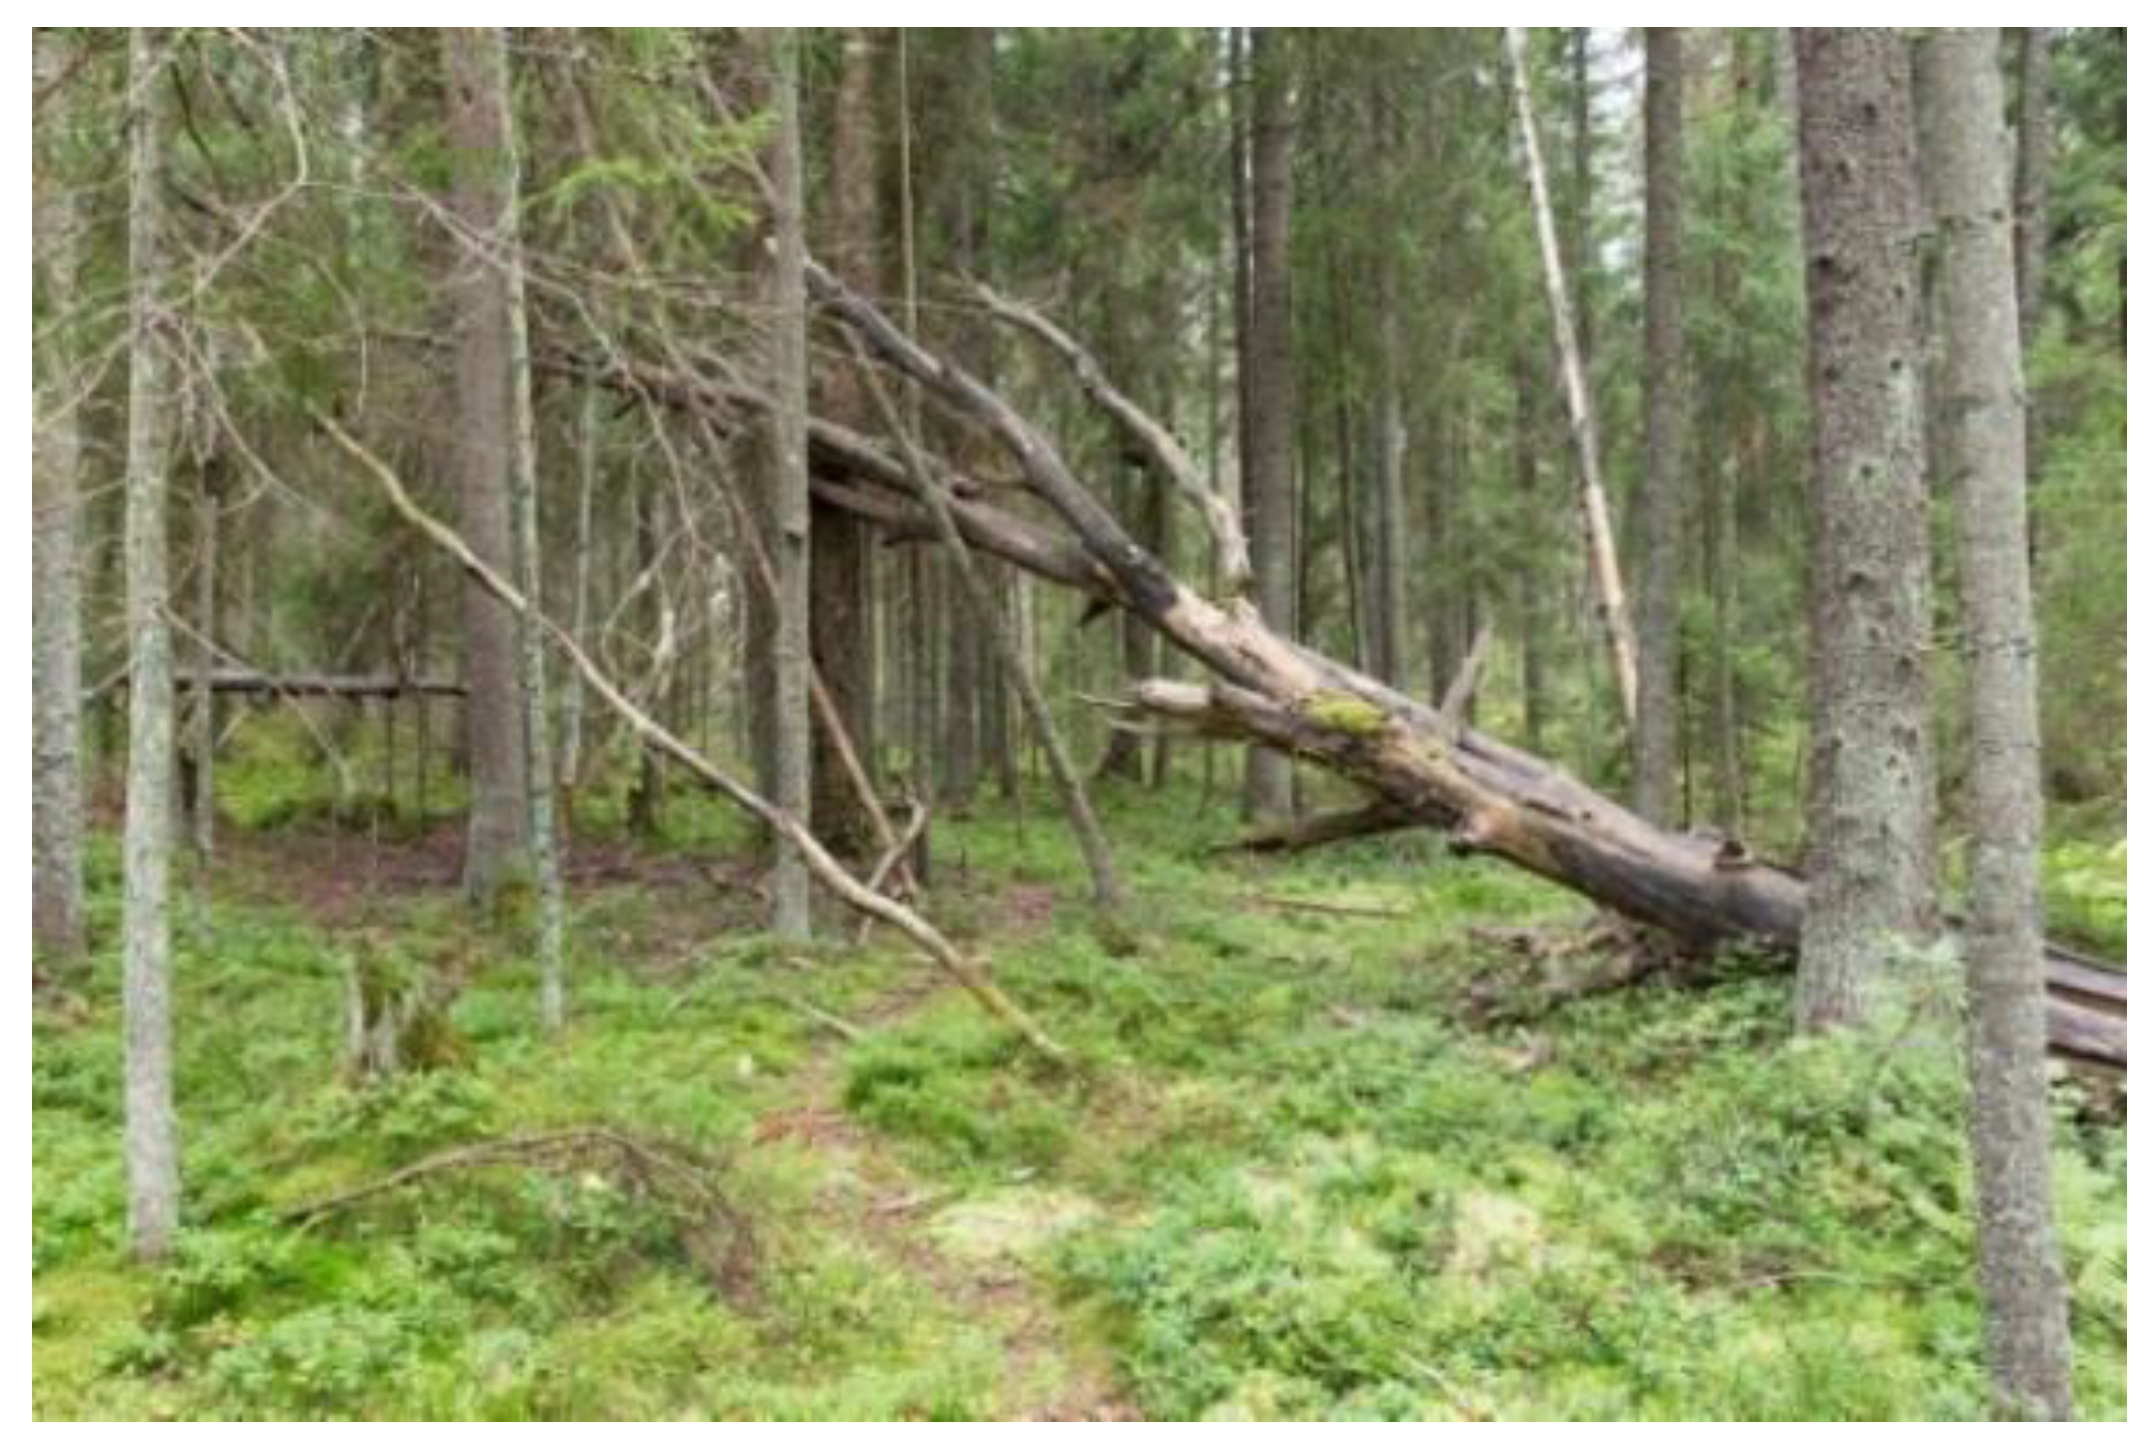
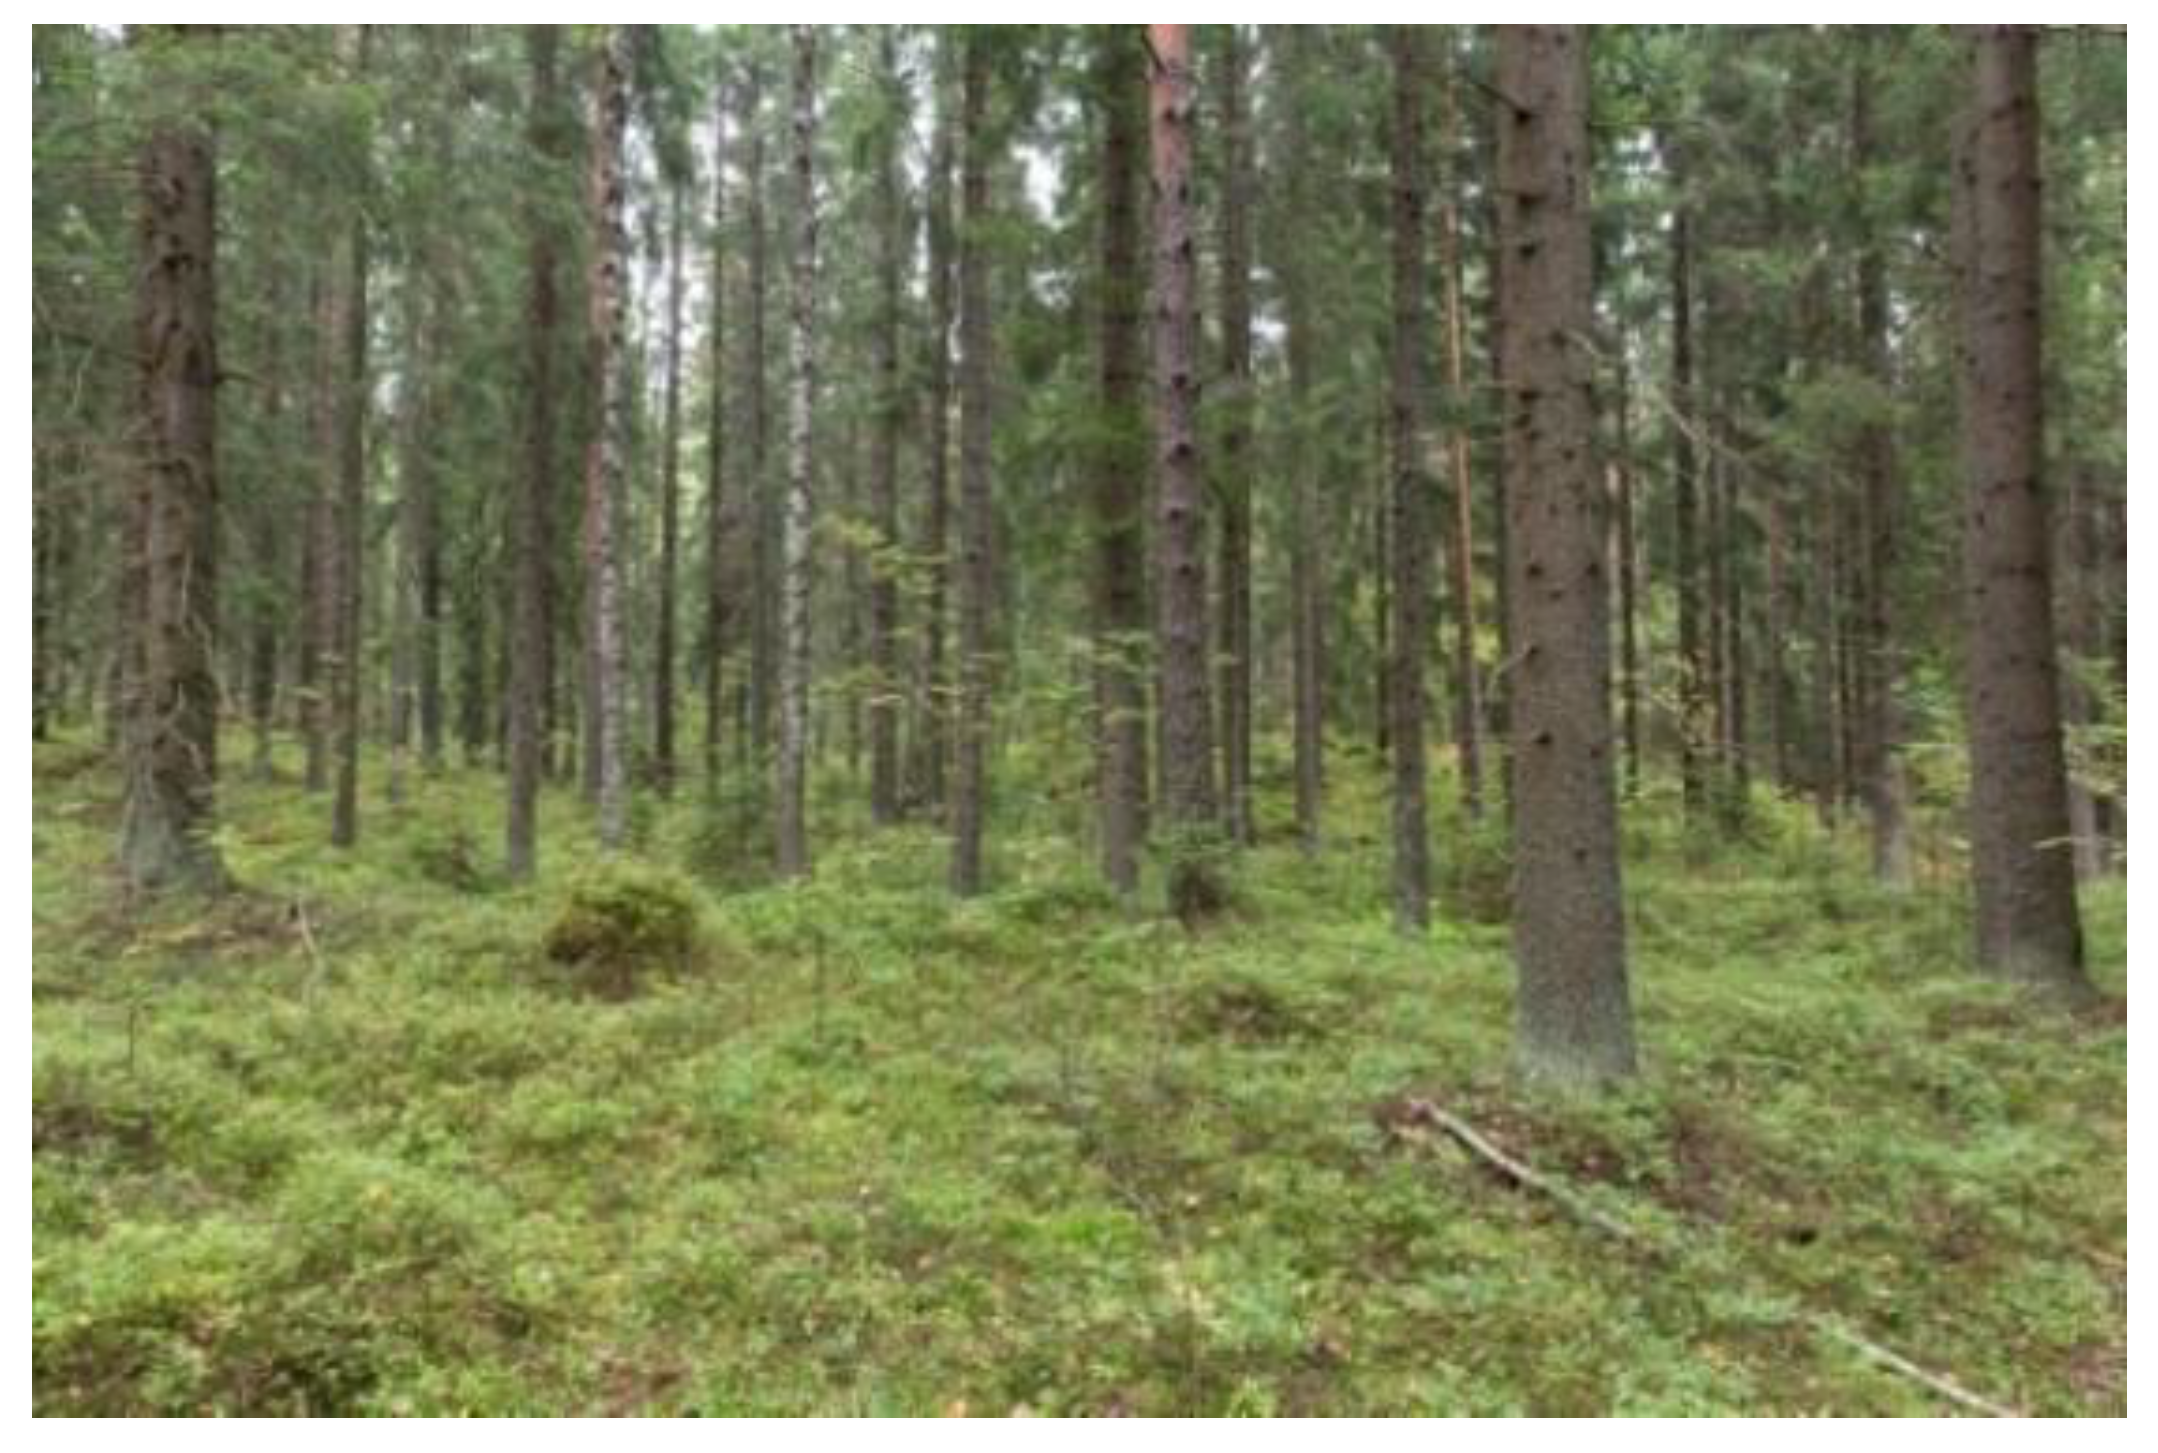
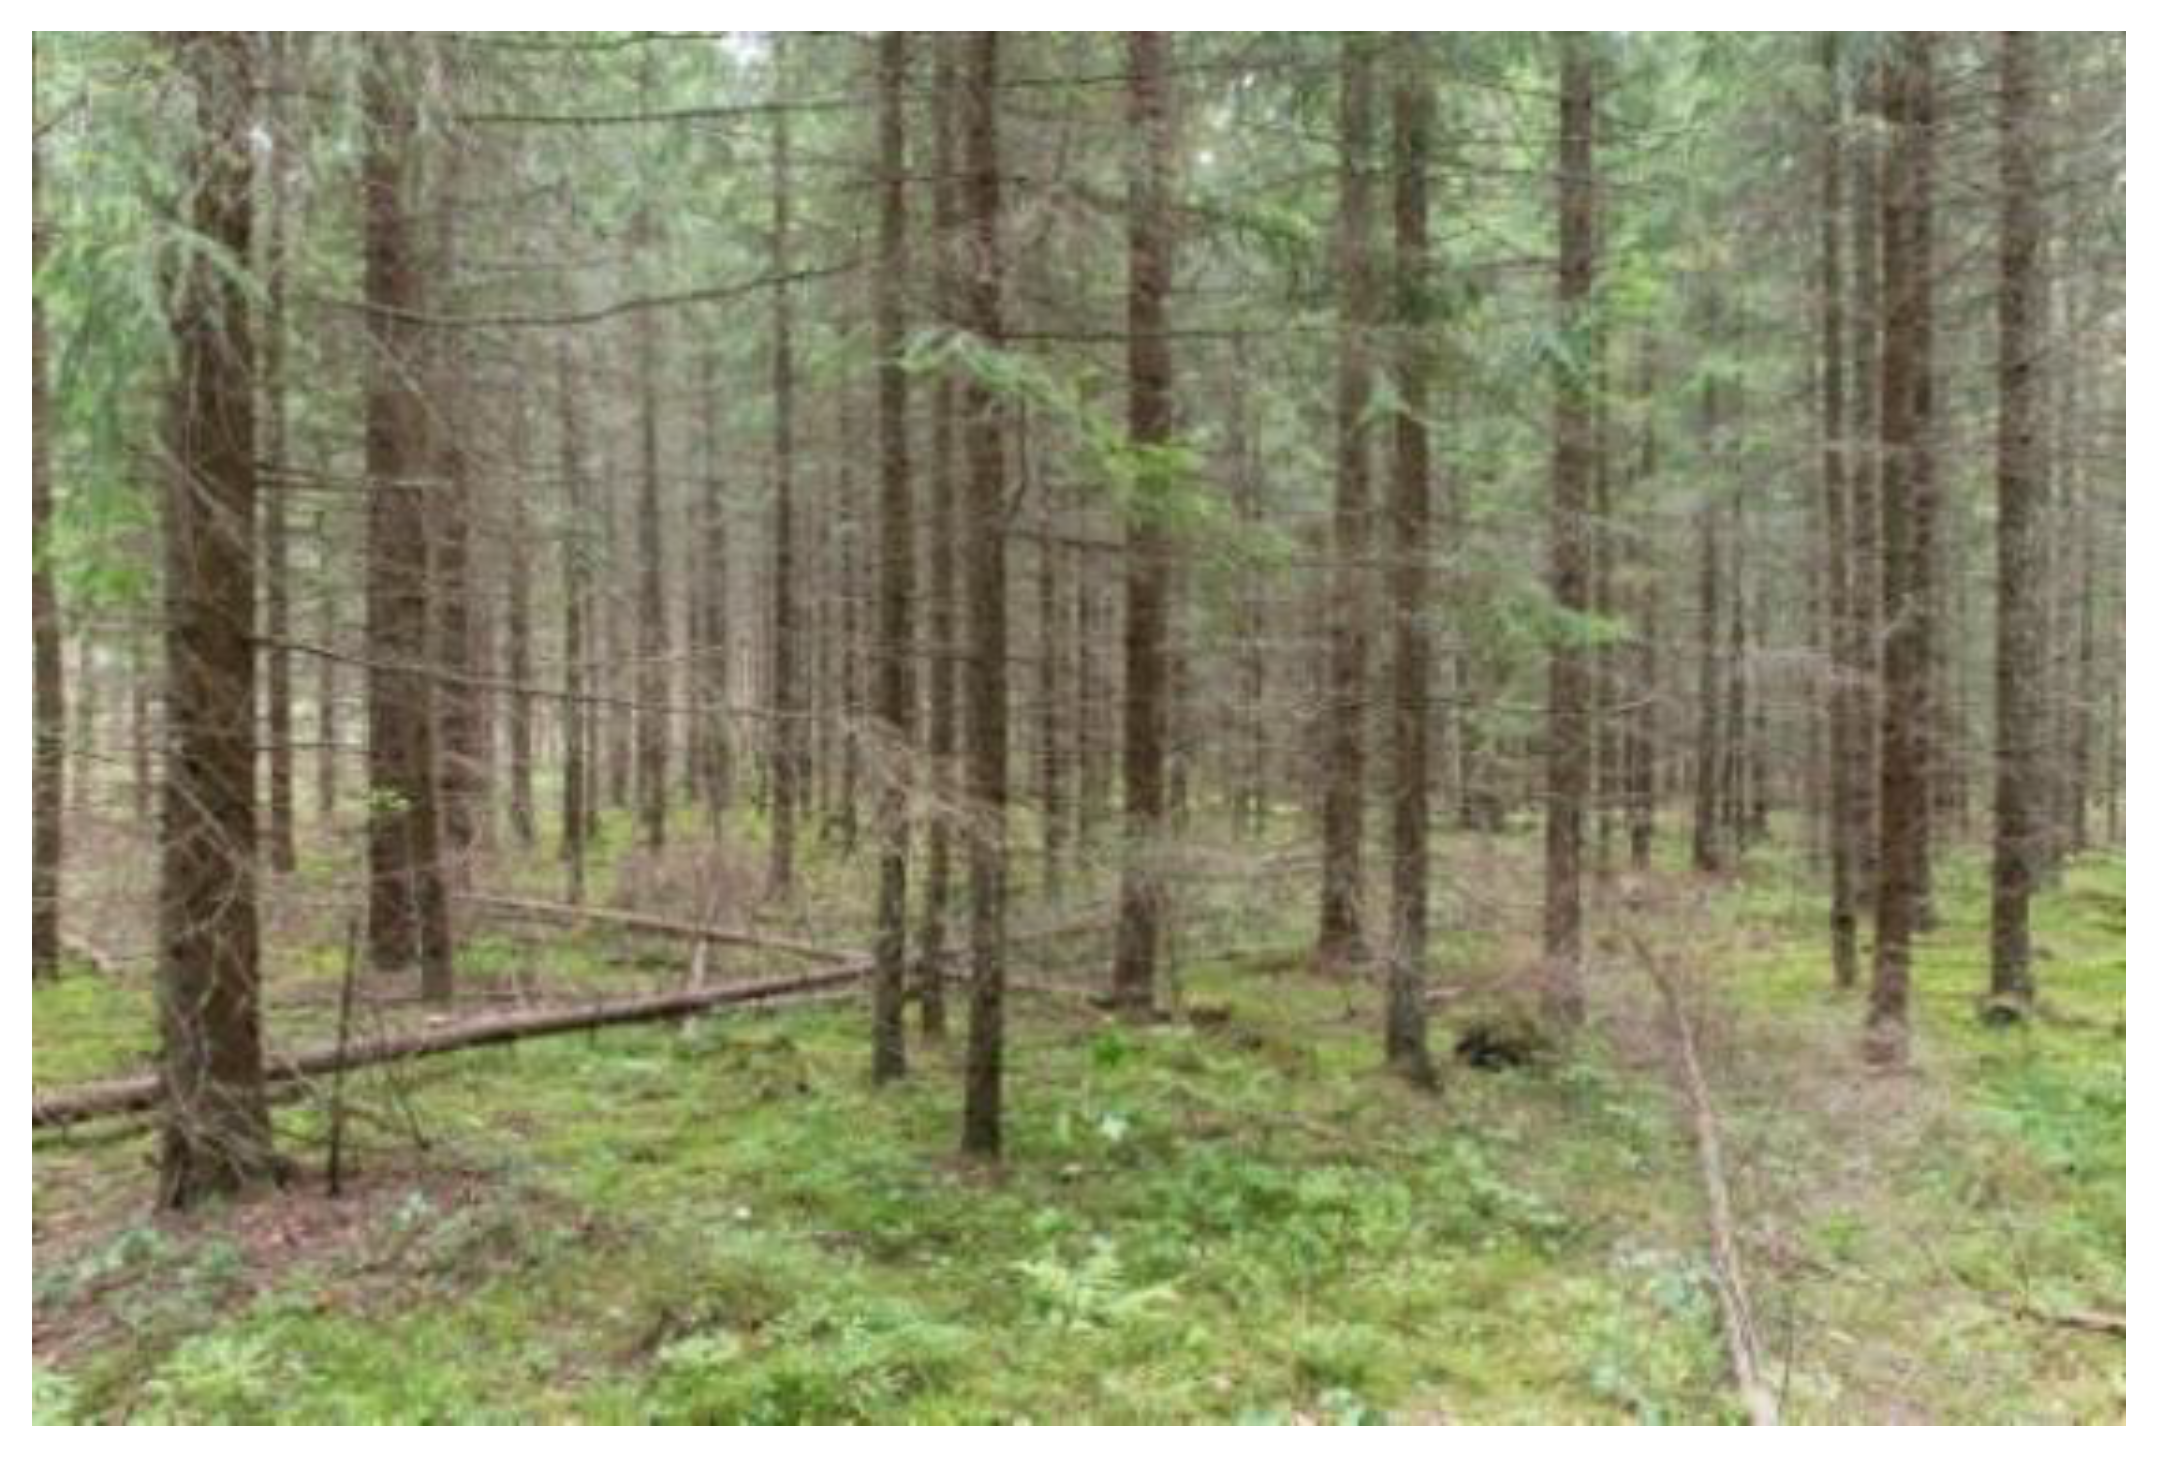
3.1. Study Sites and Their Selection
3.2. Recruitment
3.3. Experimental Procedure
3.4. Measures
3.4.1. Background Information
3.4.2. Relationship with Nature
3.4.3. Measures during the Experiment
Perceived Restorativeness Scale (PRS)
Semantic Differential Method for Forest Qualities
Open Questions
Other Measures
Statistical Analyses
4. Results
4.1. Background Information
4.2. Relationship with Nature
4.3. Results from the Experiment
4.3.1. Results of Repeated Measures ANOVA and Analysis of Covariance (ANCOVA)
Results of the Perceived Restorativeness Scale
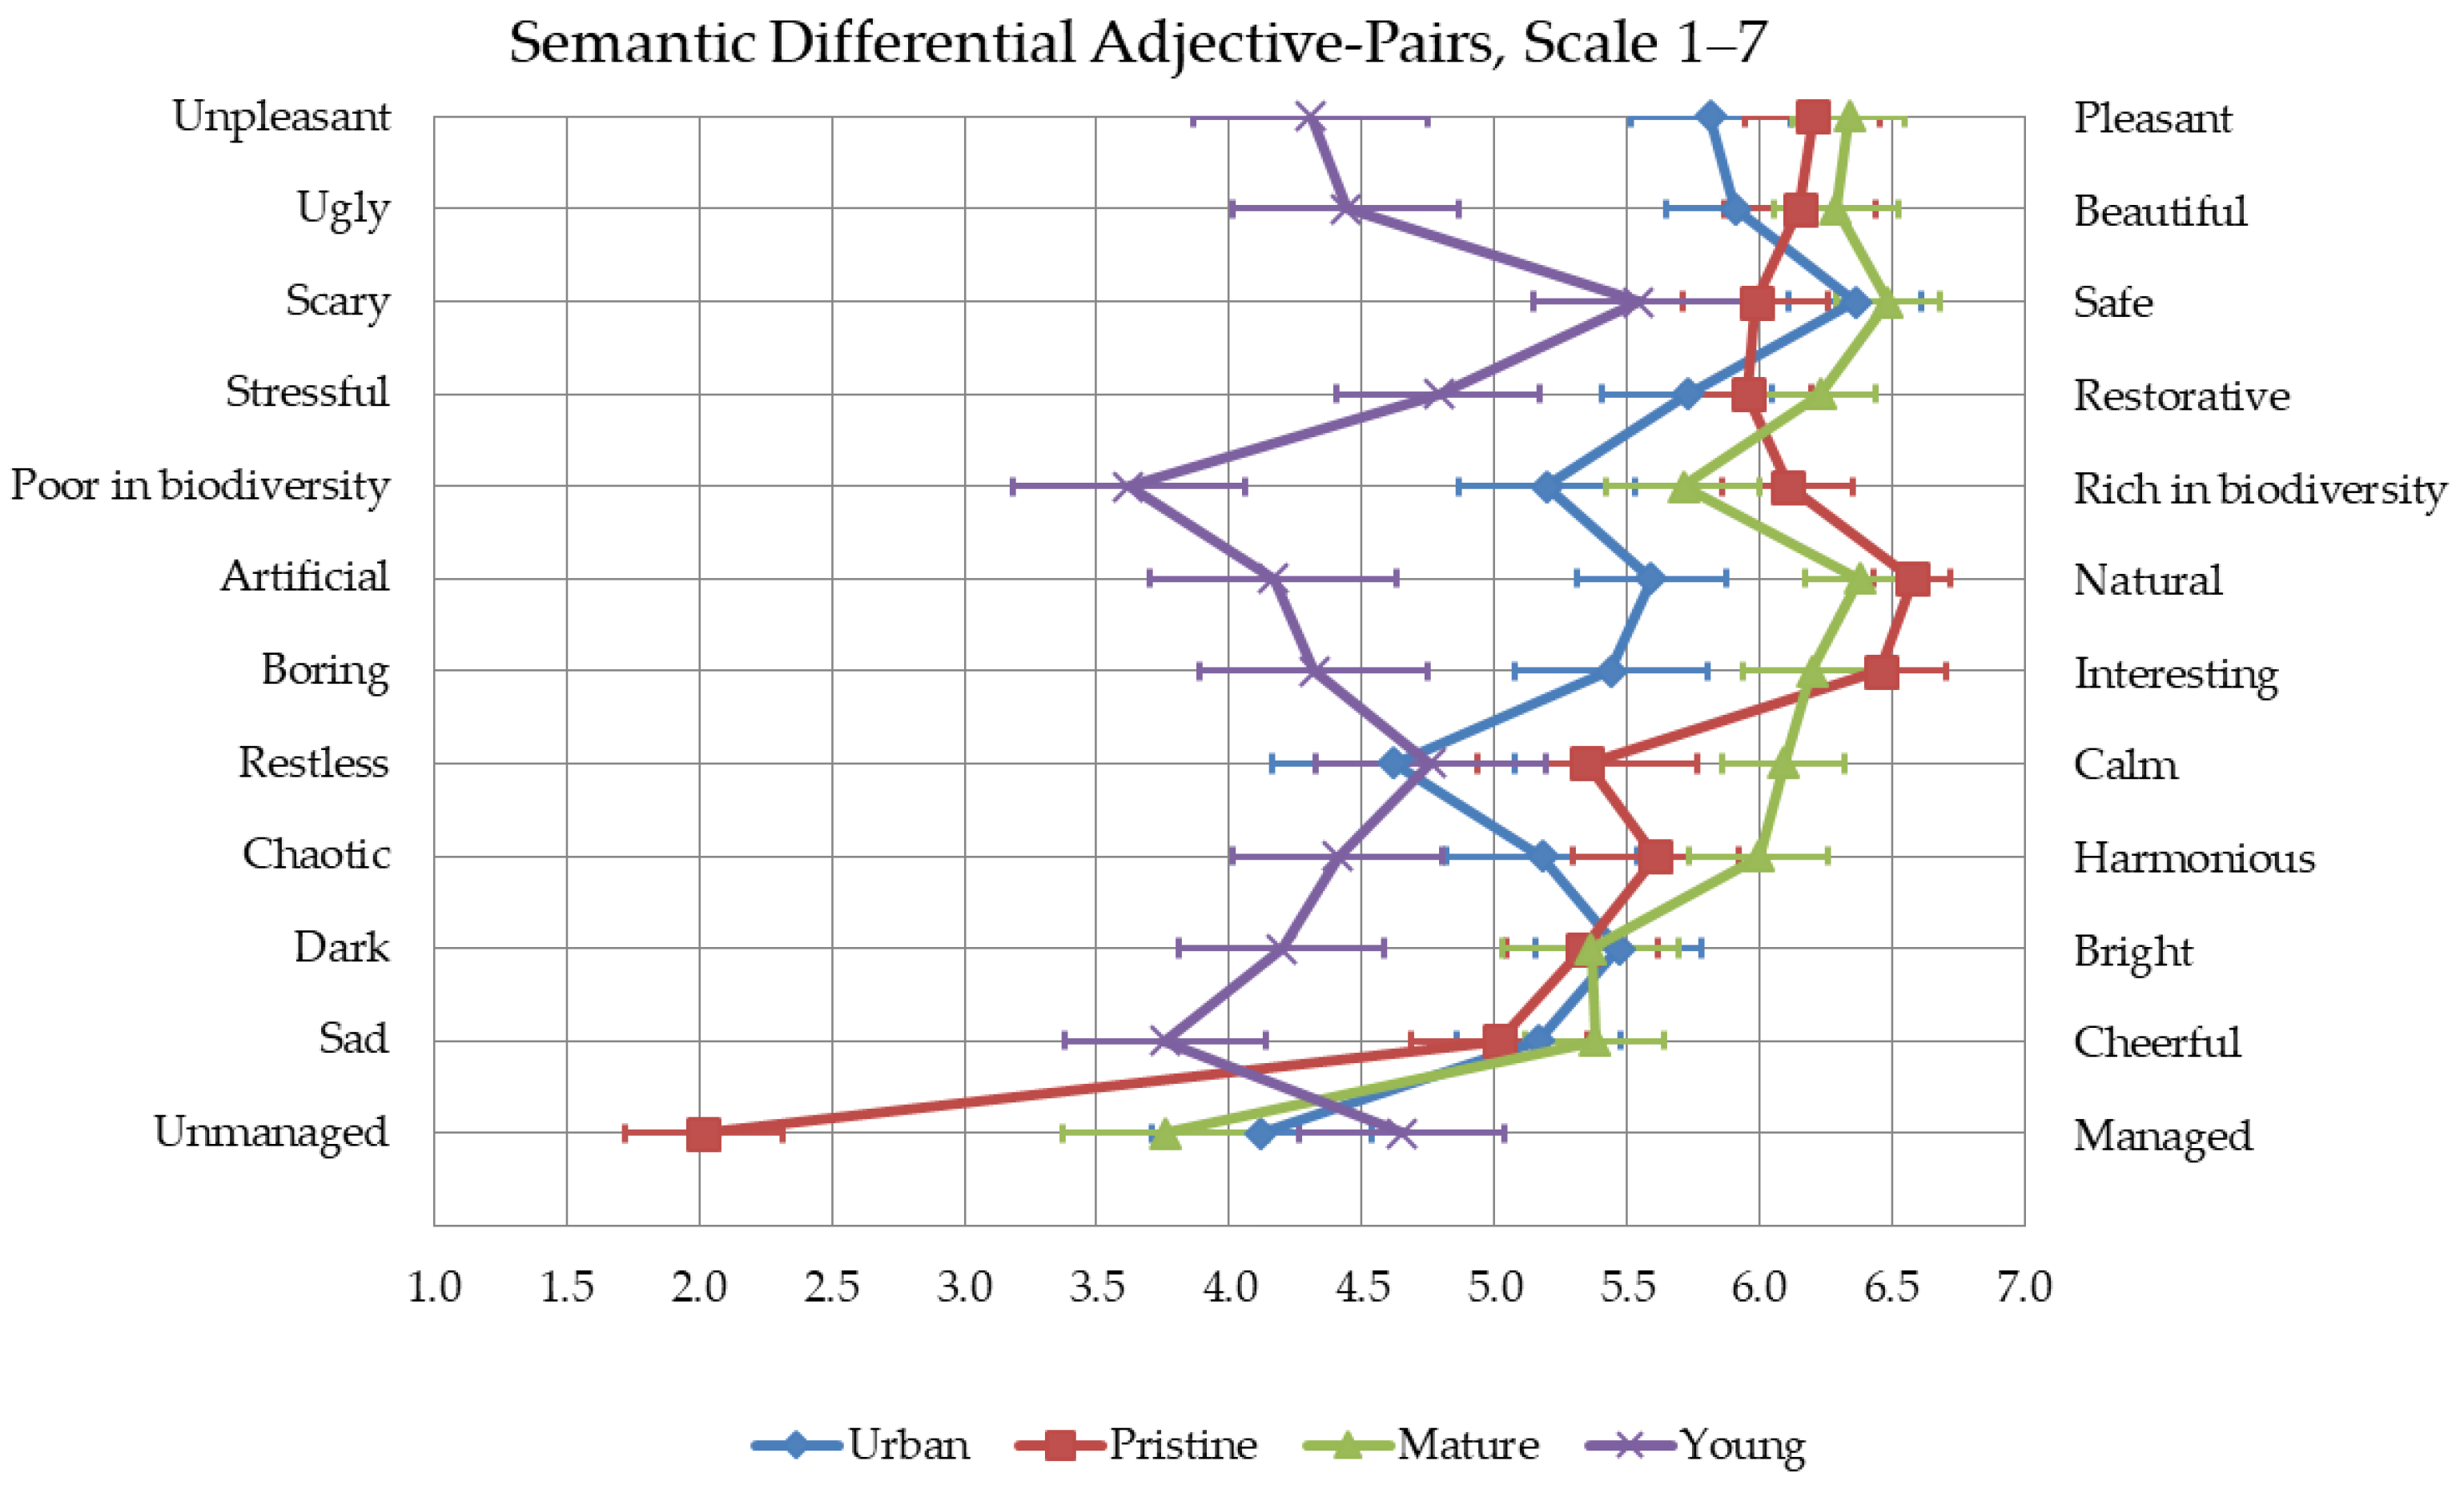
Results of Semantic Differential Adjective-Pairs
4.3.2. Results from the Open Questions
4.3.3. Results of the Effect of Individual Variables and Forest Qualities on Restorativeness
5. Discussion
5.1. The Four Components of the PRS Are Perceived Differently in All Forests
5.2. The Preferred Forest Qualities Were Identified More in Older Forests
5.3. Some Individual Variables Affect Overall Perceived Restorativeness (PRS-Score) in Differently Managed Forests
5.4. The Qualities Are Important in Explaining Restorativeness
6. Strengths, Limitations, and Conclusions
6.1. Strengths and Limitations
6.2. Conclusions
6.3. Implementation Guidelines and Future Recommendations
Supplementary Materials
Author Contributions
Funding
Institutional Review Board Statement
Informed Consent Statement
Data Availability Statement
Acknowledgments
Conflicts of Interest
References
- Park, B.-J.; Furuya, K.; Kasetani, T.; Takayama, N.; Kagawa, T.; Miyazaki, Y. Relationship between psychological responses and physical environments in forest settings. Landsc. Urban Plan. 2011, 102, 24–32. [Google Scholar] [CrossRef]
- Pasanen, T.P.; Ojala, A.; Tyrväinen, L.; Korpela, K.M. Restoration, well-being, and everyday physical activity in indoor, built outdoor and natural outdoor settings. J. Environ. Psychol. 2018, 59, 85–93. [Google Scholar] [CrossRef]
- Tsunetsugu, Y.; Lee, J.; Park, B.-J.; Tyrväinen, L.; Kagawa, T.; Miyazaki, Y. Physiological and psychological effects of viewing urban forest landscapes assessed by multiple measurements. Landsc. Urban Plan. 2013, 113, 90–93. [Google Scholar] [CrossRef]
- Van den Berg, A.E.; Koole, S.L.; van der Wulp, N.Y. Environmental preference and restoration: (How) are they related? J. Environ. Psychol. 2003, 23, 135–146. [Google Scholar] [CrossRef]
- Hartig, T.; Evans, G.W.; Jamner, L.D.; Davis, D.S.; Gärling, T. Tracking restoration in natural and urban field settings. J. Environ. Psychol. 2003, 23, 109–123. [Google Scholar] [CrossRef]
- Tyrväinen, L.; Ojala, A.; Korpela, K.; Lanki, T.; Tsunetsugu, Y.; Kagawa, T. The influence of urban green environments on stress relief measures: A field experiment. J. Environ. Psychol. 2014, 38, 1–9. [Google Scholar] [CrossRef]
- Gruebner, O.; Rapp, M.A.; Adli, M.; Kluge, U.; Galea, S.; Heinz, A. Cities and Mental Health. Dtsch. Arztebl. Int. 2017, 114, 121–127. [Google Scholar] [CrossRef]
- Engemann, K.; Svenning, J.C.; Arge, L.; Brandt, J.; Geels, C.; Mortensen, P.B.; Plana-Ripoll, O.; Tsirogiannis, C.; Pedersen, C.B. Natural surroundings in childhood are associated with lower schizophrenia rates. Schizophr. Res. 2020, 216, 488–495. [Google Scholar] [CrossRef]
- Engemann, K.; Svenning, J.C.; Arge, L.; Brandt, J.; Erikstrup, C.; Geels, C.; Hertel, O.; Mortensen, P.B.; Plana-Ripoll, O.; Tsirogiannis, C.; et al. Associations between growing up in natural environments and subsequent psychiatric disorders in Denmark. Environ. Res. 2020, 188, 109788. [Google Scholar] [CrossRef]
- United Nations; Department of Economic and Social Affairs; Population Division. World Urbanization Prospects; United Nations: Rome, Italy, 2018; pp. 1–38. [Google Scholar]
- Van Herzele, A.; Wiedemann, T. A monitoring tool for the provision of accessible and attractive urban green spaces. Landsc. Urban Plan. 2003, 63, 109–126. [Google Scholar] [CrossRef]
- Faehnle, M.; Bäcklund, P.; Tyrväinen, L.; Niemelä, J.; Yli-Pelkonen, V. How can residents’ experiences inform planning of urban green infrastructure? Case Finland. Landsc. Urban Plan. 2014, 130, 171–183. [Google Scholar] [CrossRef]
- Tyrväinen, L. Monetary Valuation of Urban Forest Amenities in Finland; Finnish Forest Research Institutes: Helsinki, Finland, 1999; Volume 739, p. 51.
- Simmonds, K.R. European Parliament. Int. Comp. Law Q. 1979, 28, 152. [Google Scholar] [CrossRef]
- Peltola, A.; Ihalainen, A.; Mäki-Simola, E.; Sauvula-Seppälä, T.; Torvelainen, J.; Uotila, E.; Vaahtera, E.; Ylitalo, E. Finnish Forest Statistics 2019|Suomen Metsätilastot. Available online: https://stat.luke.fi/en/finnish-forest-statistics-2019-2019_en (accessed on 16 March 2020).
- Tyrväinen, L.; Silvennoinen, H.; Hallikainen, V. Effect of the season and forest management on the visual quality of the nature-based tourism environment: A case from Finnish Lapland. Scand. J. Forest Res. 2017, 7581. [Google Scholar] [CrossRef]
- Gundersen, V.S.; Frivold, L.H. Public preferences for forest structures: A review of quantitative surveys from Finland, Norway and Sweden. Urban For. Urban Green. 2008, 7, 241–258. [Google Scholar] [CrossRef]
- Tyrväinen, L.; Silvennoinen, H.; Kolehmainen, O. Ecological and aesthetic values in urban forest management. Urban For. Urban Green. 2003, 1, 135–149. [Google Scholar] [CrossRef]
- Koivula, M.; Silvennoinen, H.; Koivula, H.; Tikkanen, J.; Tyrväinen, L. Continuous-cover management and attractiveness of managed scots pine forests. Can. J. For. Res. 2020, 50, 819–828. [Google Scholar] [CrossRef]
- Kaplan, R.; Kaplan, S. The Experience of Nature: A Psychological Perspective; Cambridge University Press: Cambridge, UK, 1989; Volume 35. [Google Scholar] [CrossRef]
- Hartig, T.; van den Berg, A.E.; Hagerhall, C.M.; Tomalak, M.; Bauer, N.; Hansmann, R.; Ojala, A.; Syngollitou, E.; Carrus, G.; van Herzele, A.; et al. Health Benefits of Nature Experience: Psychological, Social and Cultural Processes. In Forests, Trees and Human Health; Springer: Dordrecht, The Netherlands, 2011; pp. 127–168. ISBN 9789048198054. [Google Scholar]
- Hartig, T.; Korpela, K.; Evans, G.W.; Gärling, T.; Artesia, J.; Caywood, Q.; Nguyen, K.; Phelan, A. Validation of a Measure of Perceived Environmental Restorativeness 1. Göteborg Psychol. Rep. 1996, 26, 349–359. [Google Scholar] [CrossRef]
- Kaplan, S. The restorative benefits of nature: Toward an integrative framework. J. Environ. Psychol. 1995, 15, 169–182. [Google Scholar] [CrossRef]
- Korpela, K.; Hartig, T. Restorative qualities of favorite places. J. Environ. Psychol. 1996, 16, 221–233. [Google Scholar] [CrossRef]
- Hartig, T.; Kaiser, F.G.; Bowler, P.A. Psychological Restoration in Nature as a Positive Motivation for Ecological Behavior. Environ. Behav. 2001, 33, 590–607. [Google Scholar] [CrossRef]
- Hartig, T.; Korpela, K.; Evans G., W.; Garling, T. A measure of restorative quality in environments. Scand. J. Psychol. 1997, 37, 378–393. [Google Scholar] [CrossRef] [PubMed]
- Ribe, R.G. In-stand scenic beauty of variable retention harvests and mature forests in the U.S. Pacific Northwest: The effects of basal area, density, retention pattern and down wood. J. Environ. Manag. 2009, 91, 245–260. [Google Scholar] [CrossRef] [PubMed]
- Silvennoinen, H.; Alho, J.; Kolehmainen, O.; Pukkala, T. Prediction models of landscape preferences at the forest stand level. Landsc. Urban Plan. 2001, 56, 11–20. [Google Scholar] [CrossRef]
- Stoltz, J.; Lundell, Y.; Skärbäck, E.; van Den Bosch, M.A.; Grahn, P.; Nordström, E.M.; Dolling, A. Planning for restorative forests: Describing stress-reducing qualities of forest stands using available forest stand data. Eur. J. For. Res. 2016, 1–11. [Google Scholar] [CrossRef]
- Silvennoinen, H.; Pukkala, T.; Tahvanainen, L. Effect of Cuttings on the Scenic Beauty of a Tree Stand. Scand. J. For. Res. 2002, 17, 263–273. [Google Scholar] [CrossRef]
- Silvennoinen, H. Metsämaiseman kauneus ja metsänhoidon vaikutus koettuun maisemaan metsikkötasolla. (Scenic beauty of forest stands and impact of management). Diss. For. 2017, 242, 86. (In Finnish) [Google Scholar] [CrossRef]
- Karjalainen, E.; Hall, W.; Sjöbergin katu, A. The visual preferences for forest regeneration and field afforestation—Four case studies in Finland. Diss. For. 2006, 31, 111. [Google Scholar] [CrossRef]
- Gundersen, V.; Stange, E.E.; Kaltenborn, B.P.; Vistad, O.I. Public visual preferences for dead wood in natural boreal forests: The effects of added information. Landsc. Urban Plan. 2017, 158, 12–24. [Google Scholar] [CrossRef]
- Frick, J.; Bauer, N.; Von Lindern, E.; Hunziker, M. What forest is in the light of people’s perceptions and values: Socio-cultural forest monitoring in Switzerland. Geogr. Helv. 2018, 73, 335–345. [Google Scholar] [CrossRef]
- Stelzig, I. Zur Akzeptanz von Totholz in deutschen Wald Nationalparken. In Naturbildung und Naturakzeptanz; Trommer, G., Stelzig, I., Eds.; Shaker-Verlag: Frankfurt, Germany, 2000; pp. 117–123. [Google Scholar]
- Karjalainen, E. Ulkoilumetsien kokeminen ja merkitys. In Luonnon Monimuotoisuus, Maisema ja Virkistysarvot Ulkoilumetsien Hoidossa. Helsingin Kaupungin Nuuksion Järviylängön Ulkoilualueiden Luonnonhoito Kävijöiden Arvioimana; Lyytikäinen, S., Ed.; Metsäntutkimuslaitoksen Tiedonantoja: Helsinki, Finland, 2002; Volume 846, 60p, Available online: https://jukuri.luke.fi/handle/10024/521480 (accessed on 6 June 2020). (In Finnish)
- Karjalainen, E. Metsänhoitovaihtoehtojen arvostus ulkoilualueilla. (Preferences of forest management alternatives in recreation areas). In Metsä, Harju ja Järvi: Näkökulmia Suomalaiseen Maisematutkimukseen ja—Suunnitteluun; Finnish Forest Research Institute Research Papers, 776; Saarinen, J., Raivo, O., Eds.; Finnish Forest Research Institute: Helsinki, Finland, 2000. (In Finnish) [Google Scholar]
- Edwards, D.M.; Jay, M.; Jensen, F.S.; Lucas, B.; Marzano, M.; Montagné, C.; Peace, A.; Weiss, G. Public preferences across Europe for different forest stand types as sites for recreation. Ecol. Soc. 2012, 17. [Google Scholar] [CrossRef]
- Takayama, N.; Fujiwara, A.; Saito, H.; Horiuchi, M. Management effectiveness of a secondary coniferous forest for landscape appreciation and psychological restoration. Int. J. Environ. Res. Public Health 2017, 14, 800. [Google Scholar] [CrossRef] [PubMed]
- Martens, D.; Gutscher, H.; Bauer, N. Walking in “wild” and “tended” urban forests: The impact on psychological well-being. J. Environ. Psychol. 2011, 31, 36–44. [Google Scholar] [CrossRef]
- Tomao, A.; Secondi, L.; Carrus, G.; Corona, P.; Portoghesi, L.; Agrimi, M. Restorative urban forests: Exploring the relationships between forest stand structure, perceived restorativeness and benefits gained by visitors to coastal Pinus pinea forests. Ecol. Indic. 2018, 90, 594–605. [Google Scholar] [CrossRef]
- Chiang, Y.C.; Li, D.; Jane, H.A. Wild or tended nature? The effects of landscape location and vegetation density on physiological and psychological responses. Landsc. Urban Plan. 2017, 167, 72–83. [Google Scholar] [CrossRef]
- Carrus, G.; Scopelliti, M.; Lafortezza, R.; Colangelo, G.; Ferrini, F.; Salbitano, F.; Agrimi, M.; Portoghesi, L.; Semenzato, P.; Sanesi, G. Go greener, feel better? The positive effects of biodiversity on the well-being of individuals visiting urban and peri-urban green areas. Landsc. Urban Plan. 2015, 134, 221–228. [Google Scholar] [CrossRef]
- Fuller, R.A.; Irvine, K.N.; Devine-Wright, P.; Warren, P.H.; Gaston, K.J. Psychological benefits of greenspace increase with biodiversity. Biol. Lett. 2007, 3, 390–394. [Google Scholar] [CrossRef]
- Marselle, M.R.; Irvine, K.N.; Lorenzo-Arribas, A.; Warber, S.L. Does perceived restorativeness mediate the effects of perceived biodiversity and perceived naturalness on emotional well-being following group walks in nature? J. Environ. Psychol. 2016, 46, 217–232. [Google Scholar] [CrossRef]
- McMahan, E.A.; Estes, D. The effect of contact with natural environments on positive and negative affect: A meta-analysis. J. Posit. Psychol. 2015, 10, 507–519. [Google Scholar] [CrossRef]
- Carrus, G.; Lafortezza, R.; Colangelo, G.; Dentamaro, I.; Scopelliti, M.; Sanesi, G. Relations between naturalness and perceived restorativeness of different urban green spaces. Psyecology 2013, 4, 227–244. [Google Scholar] [CrossRef]
- Shin, W.S.; Yeoun, P.S.; Yoo, R.W.; Shin, C.S. Forest experience and psychological health benefits: The state of the art and future prospect in Korea. Environ. Health Prev. Med. 2010, 15, 38–47. [Google Scholar] [CrossRef]
- Gobster, P.H.; Westphal, L.M. The human dimensions of urban greenways: Planning for recreation and related experiences. Landsc. Urban Plan. 2004, 68, 147–165. [Google Scholar] [CrossRef]
- Schroeder, H. Experiencing nature in special places: Surveys in the north-central region. J. For. 2002, 100, 8–14. [Google Scholar] [CrossRef]
- Horne, P. Ulkoilijoille Tärkeät Metsäluonnon Ominaisuudet. Available online: https://jukuri.luke.fi/handle/10024/528585 (accessed on 17 November 2020).
- Laumann, K.; GÄRling, T.; Stormark, K.M. Rating Scale Measures of Restorative Components of Environments. J. Environ. Psychol. 2001, 21, 31–44. [Google Scholar] [CrossRef]
- Han, K.-T. An Exploration of Relationships among the Responses to Natural Scenes. Environ. Behav. 2010, 42, 243–270. [Google Scholar] [CrossRef]
- De Jong, K.; Albin, M.; Skärbäck, E.; Grahn, P.; Björk, J. Perceived green qualities were associated with neighborhood satisfaction, physical activity, and general health: Results from a cross-sectional study in suburban and rural Scania, southern Sweden. Heal. Place 2012, 18, 1374–1380. [Google Scholar] [CrossRef] [PubMed]
- Ode Sang, Å.; Knez, I.; Gunnarsson, B.; Hedblom, M. The effects of naturalness, gender, and age on how urban green space is perceived and used. Urban For. Urban Green. 2016, 18, 268–276. [Google Scholar] [CrossRef]
- Astell-Burt, T.; Feng, X.; Kolt, G.S. Mental health benefits of neighbourhood green space are stronger among physically active adults in middle-to-older age: Evidence from 260,061 Australians. Prev. Med. 2013, 57, 601–606. [Google Scholar] [CrossRef] [PubMed]
- Tyrväinen, L.; Mäkinen, K.; Schipperijn, J. Tools for mapping social values of urban woodlands and other green areas. Landsc. Urban Plan. 2007, 79, 5–19. [Google Scholar] [CrossRef]
- Adevi, A.A.; Grahn, P. Preferences for Landscapes: A Matter of Cultural Determinants or Innate Reflexes that Point to Our Evolutionary Background? Landsc. Res. 2012, 37, 27–49. [Google Scholar] [CrossRef]
- Hinds, J.; Sparks, P. The affective quality of human-natural environment relationships. Evol. Psychol. 2011, 9, 451–469. [Google Scholar] [CrossRef]
- Davis, N.; Gatersleben, B. Transcendent Experiences in Wild and Manicured Settings: The Influence of the Trait “Connectedness to Nature”. Ecopsychology 2013, 5, 92–102. [Google Scholar] [CrossRef]
- Ojala, A.; Korpela, K.; Tyrväinen, L.; Tiittanen, P.; Lanki, T. Restorative effects of urban green environments and the role of urban-nature orientedness and noise sensitivity: A field experiment. Health Place 2019, 55, 59–70. [Google Scholar] [CrossRef] [PubMed]
- Natural Resources Institute Finland, Luke. Forest Resources. NFI11/12. Statistics Database. 2017. Creation Date 2/22/2017. Latest Update 2/24/2017. Available online: http://statdb.luke.fi/PXWeb/pxweb/en/LUKE/ (accessed on 14 January 2020).
- White, M.; Smith, A.; Humphryes, K.; Pahl, S.; Snelling, D.; Depledge, M. Blue space: The importance of water for preference, affect, and restorativeness ratings of natural and built scenes. J. Environ. Psychol. 2010, 30, 482–493. [Google Scholar] [CrossRef]
- White, M.P.; Pahl, S.; Ashbullby, K.; Herbert, S.; Depledge, M.H. Feelings of restoration from recent nature visits. J. Environ. Psychol. 2013, 35, 40–51. [Google Scholar] [CrossRef]
- Marselle, M.; Irvine, K.; Lorenzo-Arribas, A.; Warber, S. Moving beyond Green: Exploring the Relationship of Environment Type and Indicators of Perceived Environmental Quality on Emotional Well-Being following Group Walks. Int. J. Environ. Res. Public Health 2014, 12, 106–130. [Google Scholar] [CrossRef]
- Simkin, J.; Ojala, A.; Tyrväinen, L. Restorative effects of mature and young commercial forests, pristine old-growth forest and urban recreation forest—A field experiment. Urban For. Urban Green. 2020, 48. [Google Scholar] [CrossRef]
- Nisbet, E.K.; Zelenski, J.M. The NR-6: A new brief measure of nature relatedness. Front. Psychol. 2013, 4, 813. [Google Scholar] [CrossRef]
- Hietanen, J.K.; Klemettilä, T.; Kettunen, J.E.; Korpela, K.M. What is a nice smile like that doing in a place like this? Automatic affective responses to environments influence the recognition of facial expressions. Psychol. Res. 2007, 71, 539–552. [Google Scholar] [CrossRef]
- Osgood, C.E. The nature and measurement of meaning. Psychol. Bull. 1952, 49, 197–237. [Google Scholar] [CrossRef]
- Metsämuuronen, J. Tutkimuksen Tekemisen Perusteet Ihmistieteissä: E-kirja Opiskelijalaitos; International Methelp: Helsinki, Finland, 2011; Volume 978, ISBN 9525372286. [Google Scholar]
- Cohen, J. Statistical Power Analysis for the Behavioral Sciences, 2nd ed.; Lawrence Erlbaum Associates, Publishers: Hillsdale, NJ, USA, 1988. [Google Scholar]
- Nielsen, A.B.; Heyman, E.; Richnau, G. Liked, disliked and unseen forest attributes: Relation to modes of viewing and cognitive constructs. J. Environ. Manag. 2012, 113, 456–466. [Google Scholar] [CrossRef]
- Brunson, M.W.; Reiter, D.K. Effects of ecological information on judgments about scenic impacts of timber harvest. J. Environ. Manag. 1996, 46, 31–41. [Google Scholar] [CrossRef]
- Roe, J.; Aspinall, P. The restorative benefits of walking in urban and rural settings in adults with good and poor mental health. Health Place 2011, 17, 103–113. [Google Scholar] [CrossRef] [PubMed]
- Arnberger, A. Recreation use of urban forests: An inter-area comparison. Urban For. Urban Green. 2006, 4, 135–144. [Google Scholar] [CrossRef]
- Benfield, J.A.; Bell, P.A.; Troup, L.J.; Soderstrom, N.C. Aesthetic and affective effects of vocal and traffic noise on natural landscape assessment. J. Environ. Psychol. 2010, 30, 103–111. [Google Scholar] [CrossRef]
- Herzog, T.R.; Kutzli, G.E. Preference and Perceived Danger in Field/Forest Settings. Environ. Behav. 2002, 34, 819–835. [Google Scholar] [CrossRef]
- Appleton, J. The Experience of Landscape; John Wiley & Sons: Hoboken, NJ, USA, 1975; Volume 293. [Google Scholar]
- Äijälä, O.; Koistinen, A.; Sved, J.; Vanhatalo, K.; Väisänen, P. Metsänhoidon Suositukset; Metsätalouden Kehittämiskeskus Tapio: Helsinki, Finland, 2014; ISBN 978-952-6612-32-4. [Google Scholar]
- Meisenberg, G.; Williams, A. Are acquiescent and extreme response styles related to low intelligence and education? Pers. Individ. Differ. 2008, 44, 1539–1550. [Google Scholar] [CrossRef]
- Mayer, F.S.; Frantz, C.M.; Bruehlman-Senecal, E.; Dolliver, K. Why Is Nature Beneficial? Environ. Behav. 2009, 41, 607–643. [Google Scholar] [CrossRef]
- Lee, J.; Park, B.-J.; Tsunetsugu, Y.; Kagawa, T.; Miyazaki, Y. Restorative effects of viewing real forest landscapes, based on a comparison with urban landscapes. Scand. J. For. Res. 2009, 24, 227–234. [Google Scholar] [CrossRef]
- Lee, J.; Park, B.-J.J.; Tsunetsugu, Y.; Ohira, T.; Kagawa, T.; Miyazaki, Y. Effect of forest bathing on physiological and psychological responses in young Japanese male subjects. Public Health 2011, 125, 93–100. [Google Scholar] [CrossRef]
- Park, B.-J.; Tsunetsugu, Y.; Ishii, H.; Furuhashi, S.; Hirano, H.; Kagawa, T.; Miyazaki, Y. Physiological effects of Shinrin-yoku (taking in the atmosphere of the forest) in a mixed forest in Shinano Town, Japan. Scand. J. For. Res. 2008, 23, 278–283. [Google Scholar] [CrossRef]
- Official Statistics of Finland (OSF). Population Structure [e-Publication]; Statistics Finland: Helsinki, Finland, 2018; Available online: http://www.stat.fi/til/vaerak/index_en.html (accessed on 7 March 2019).
- Ahtikoski, A.; Tuulentie, S.; Hallikainen, V.; Nivala, V.; Vatanen, E.; Tyrväinen, L.; Salminen, H. Potential trade-offs between nature-based tourism and forestry, a case study in Northern Finland. Forests 2011, 2, 894–912. [Google Scholar] [CrossRef]


| Forest Site | Urban | Pristine | Mature | Young |
|---|---|---|---|---|
| Location | Helsinki/Urban | Sipoo/Rural | Sipoo/Rural | Sipoo/Rural |
| Average age (years) | 95 | >120 | 100 | 40 |
| Tree height (m) | 26 | 33 | 27 | 16 |
| Diameter breast height (cm) | 30 | 35 | 28 | 16 |
| Stand volume (m3/ha) | 370 | 524 | 403 | 299 |
| Dominant tree species | Norway spruce | Norway spruce | Norway spruce | Norway spruce |
| Other tree species | pine, birch, aspen, rowan | pine, birch, aspen, rowan | pine, birch, aspen, rowan | pine, birch, rowan |
| Forest Site | Urban | Pristine | Mature | Young | ||||||||
|---|---|---|---|---|---|---|---|---|---|---|---|---|
| Measures | Mean | SD | α | Mean | SD | α | Mean | SD | α | Mean | SD | α |
| After walking | ||||||||||||
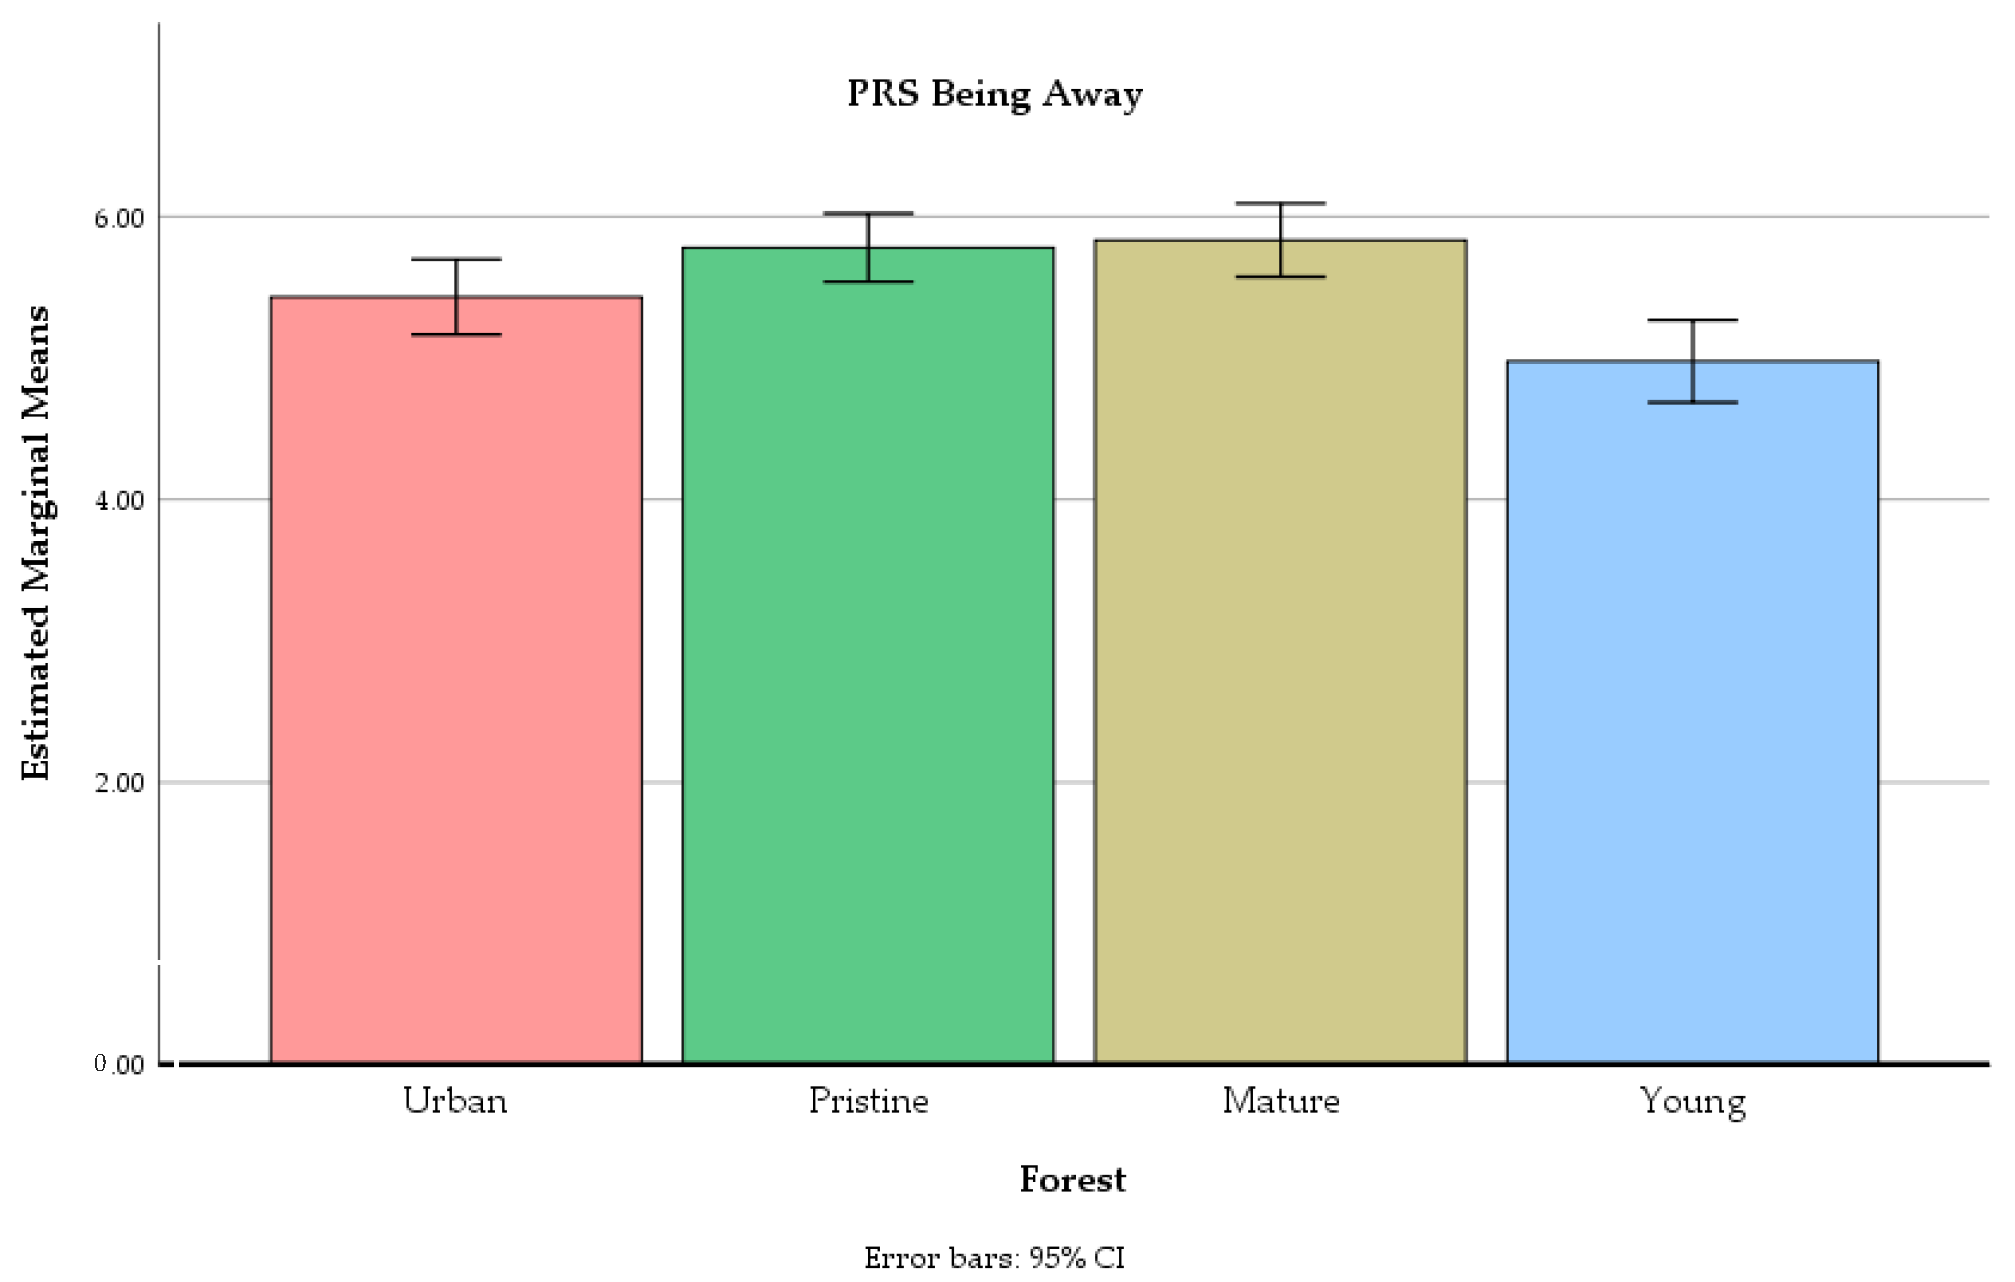
| PRS being away | 5.43 | 1.08 | 0.52 | 5.78 | 0.98 | 0.61 | 5.83 | 1.05 | 0.65 | 4.98 | 1.18 | 0.71 |
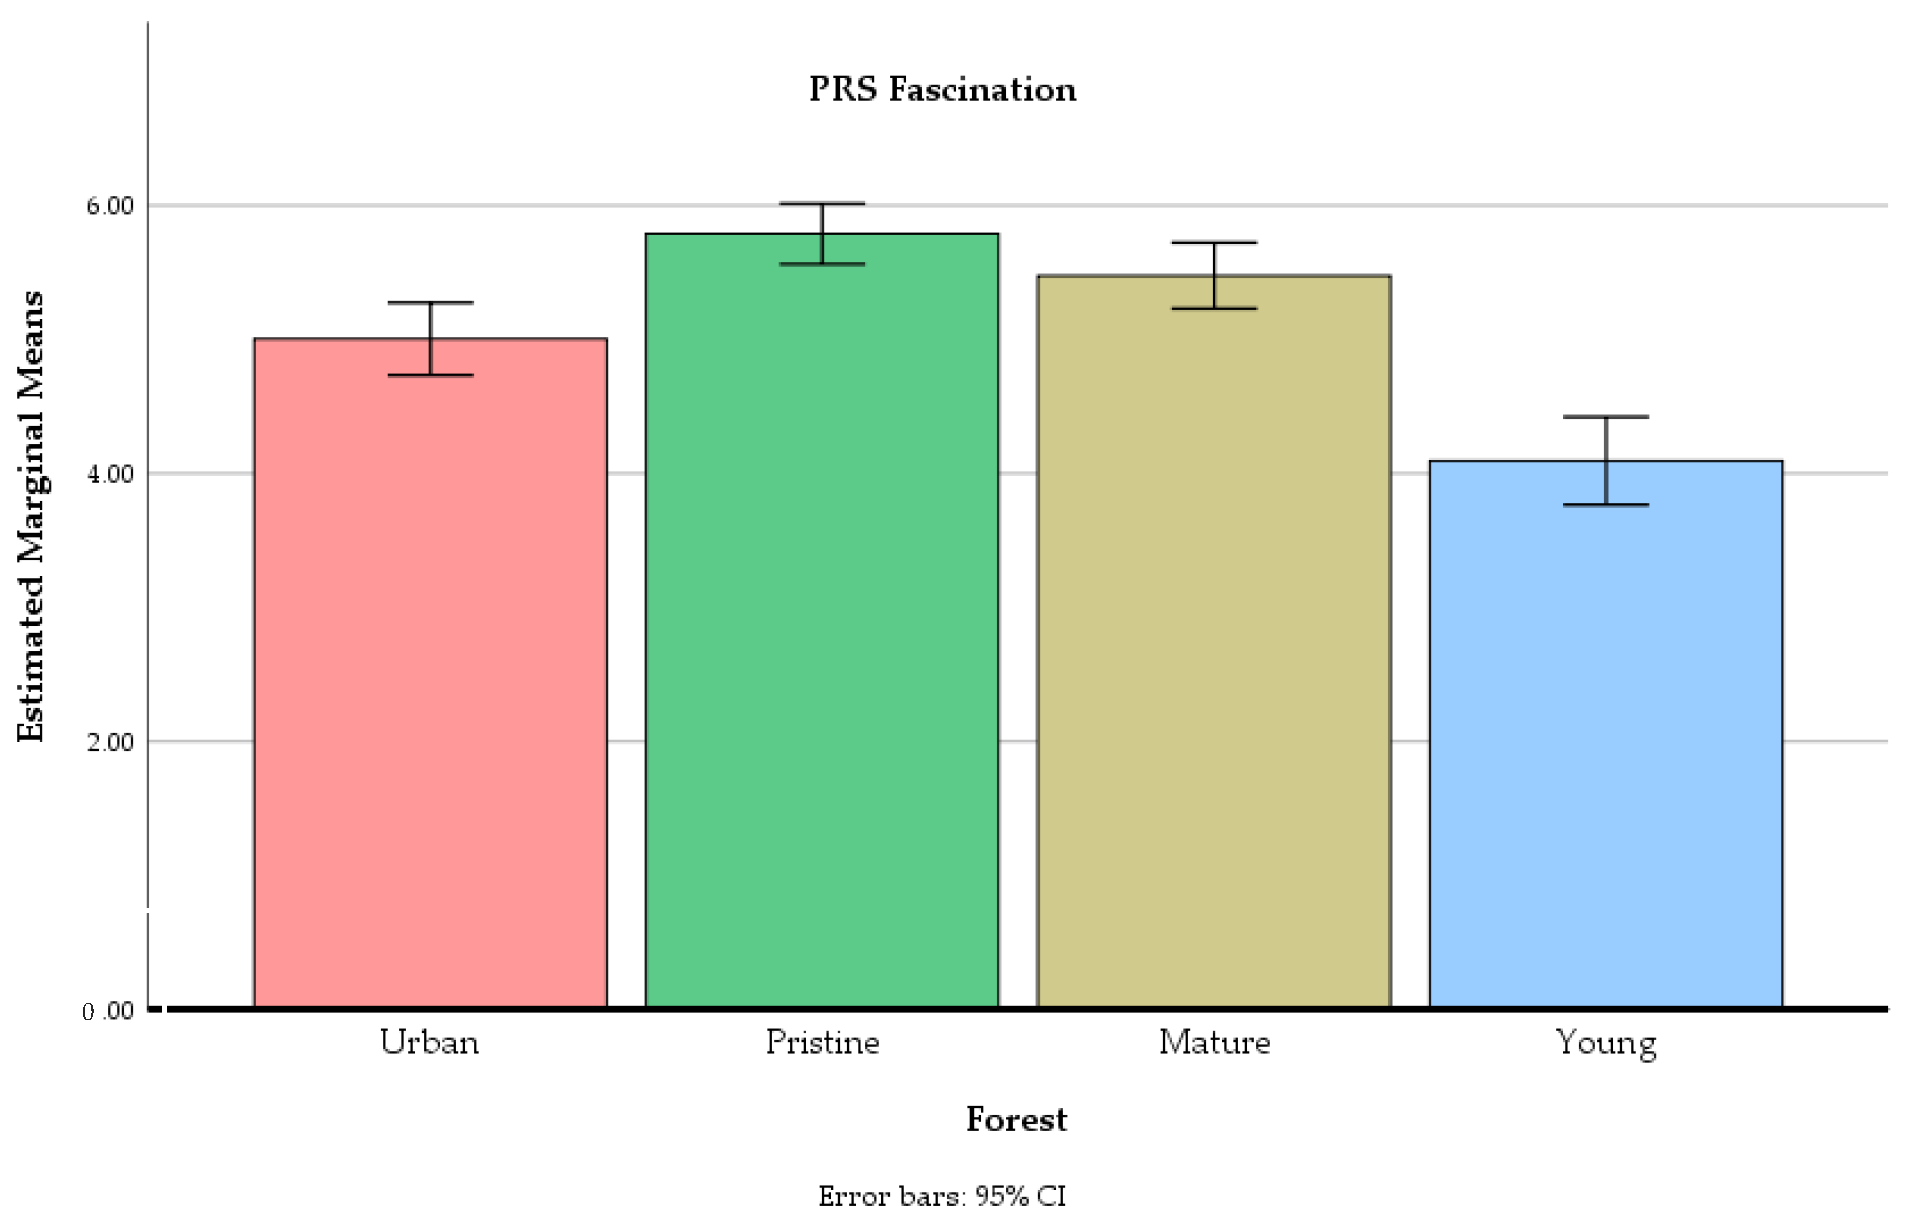
| PRS fascination | 5.00 | 1.10 | 0.90 | 5.79 | 0.92 | 0.89 | 5.48 | 1.00 | 0.89 | 4.09 | 1.33 | 0.92 |
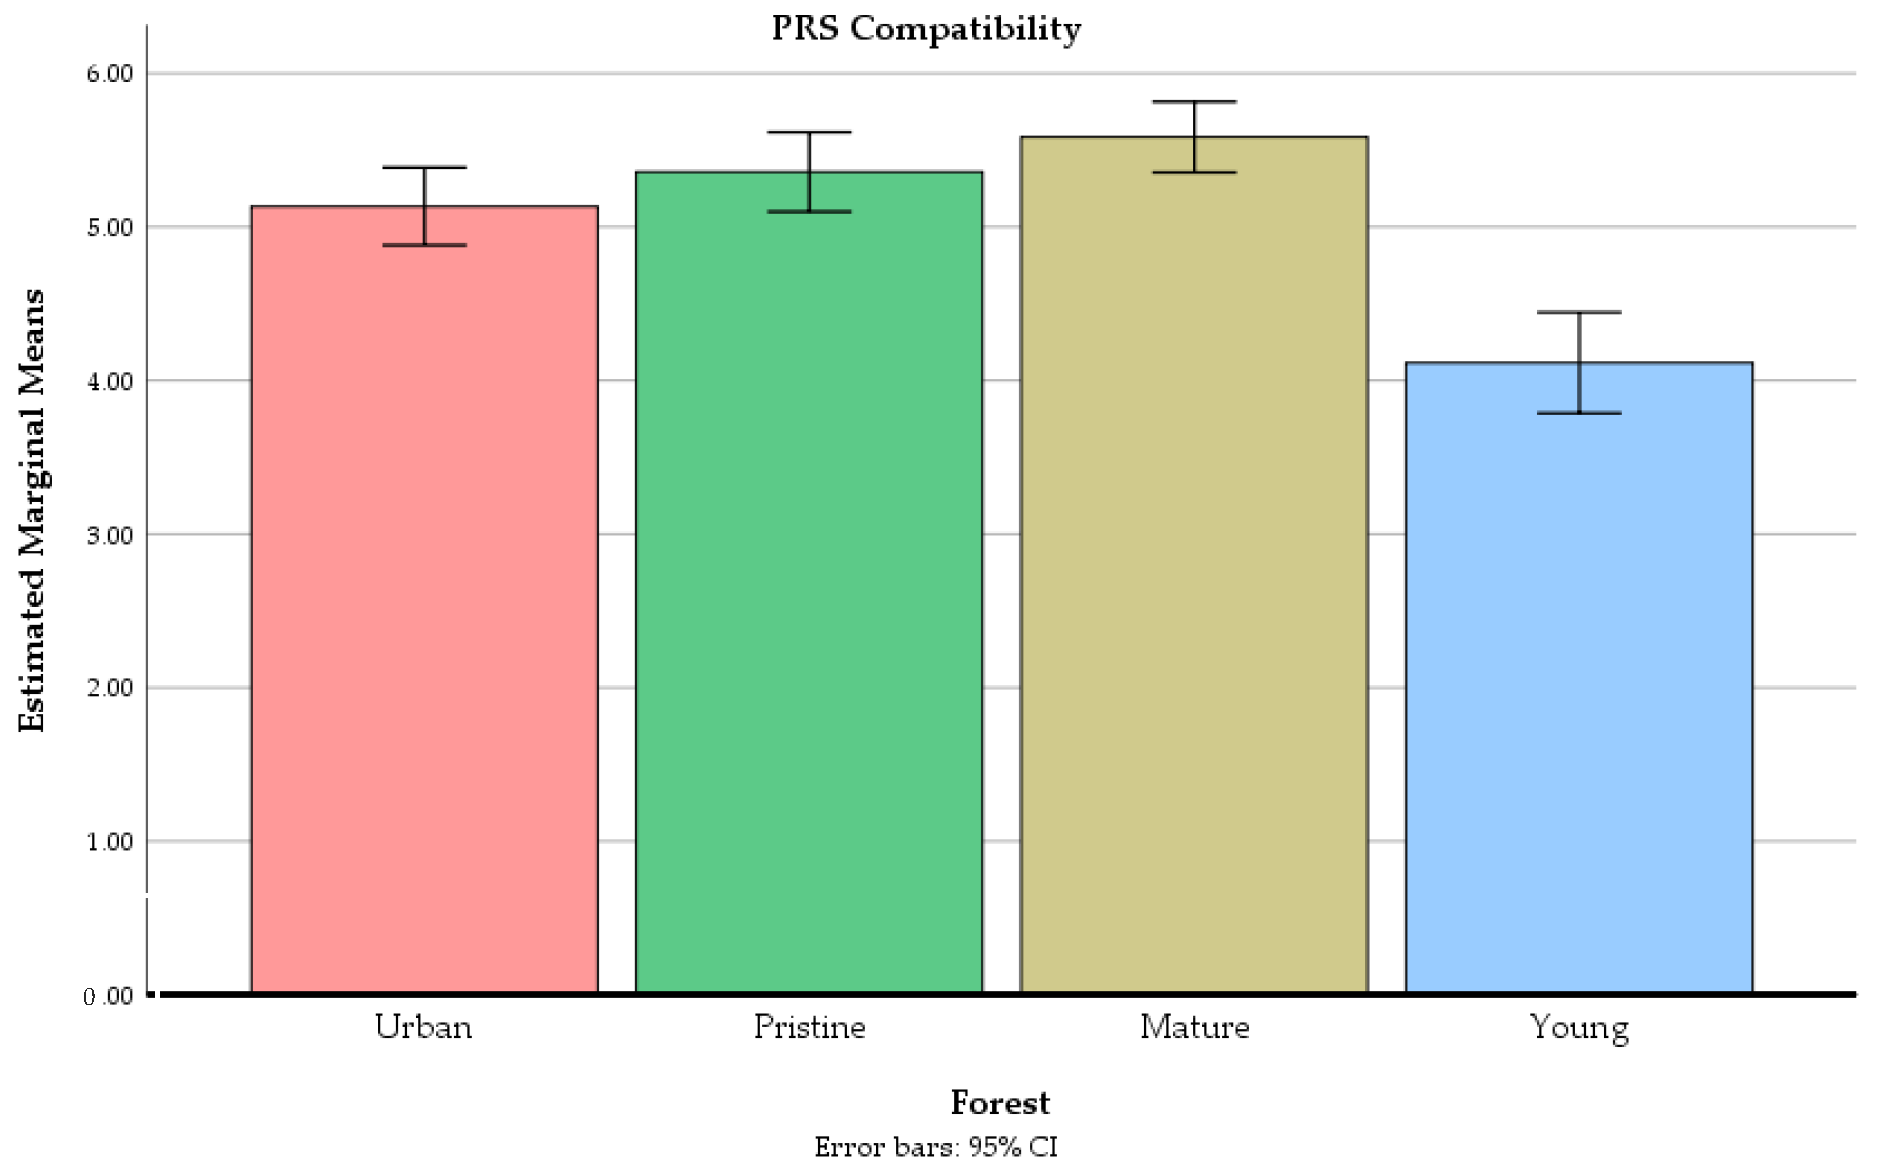
| PRS compatibility | 5.13 | 1.03 | 0.90 | 5.36 | 1.05 | 0.90 | 5.58 | 0.94 | 0.91 | 4.12 | 1.34 | 0.93 |
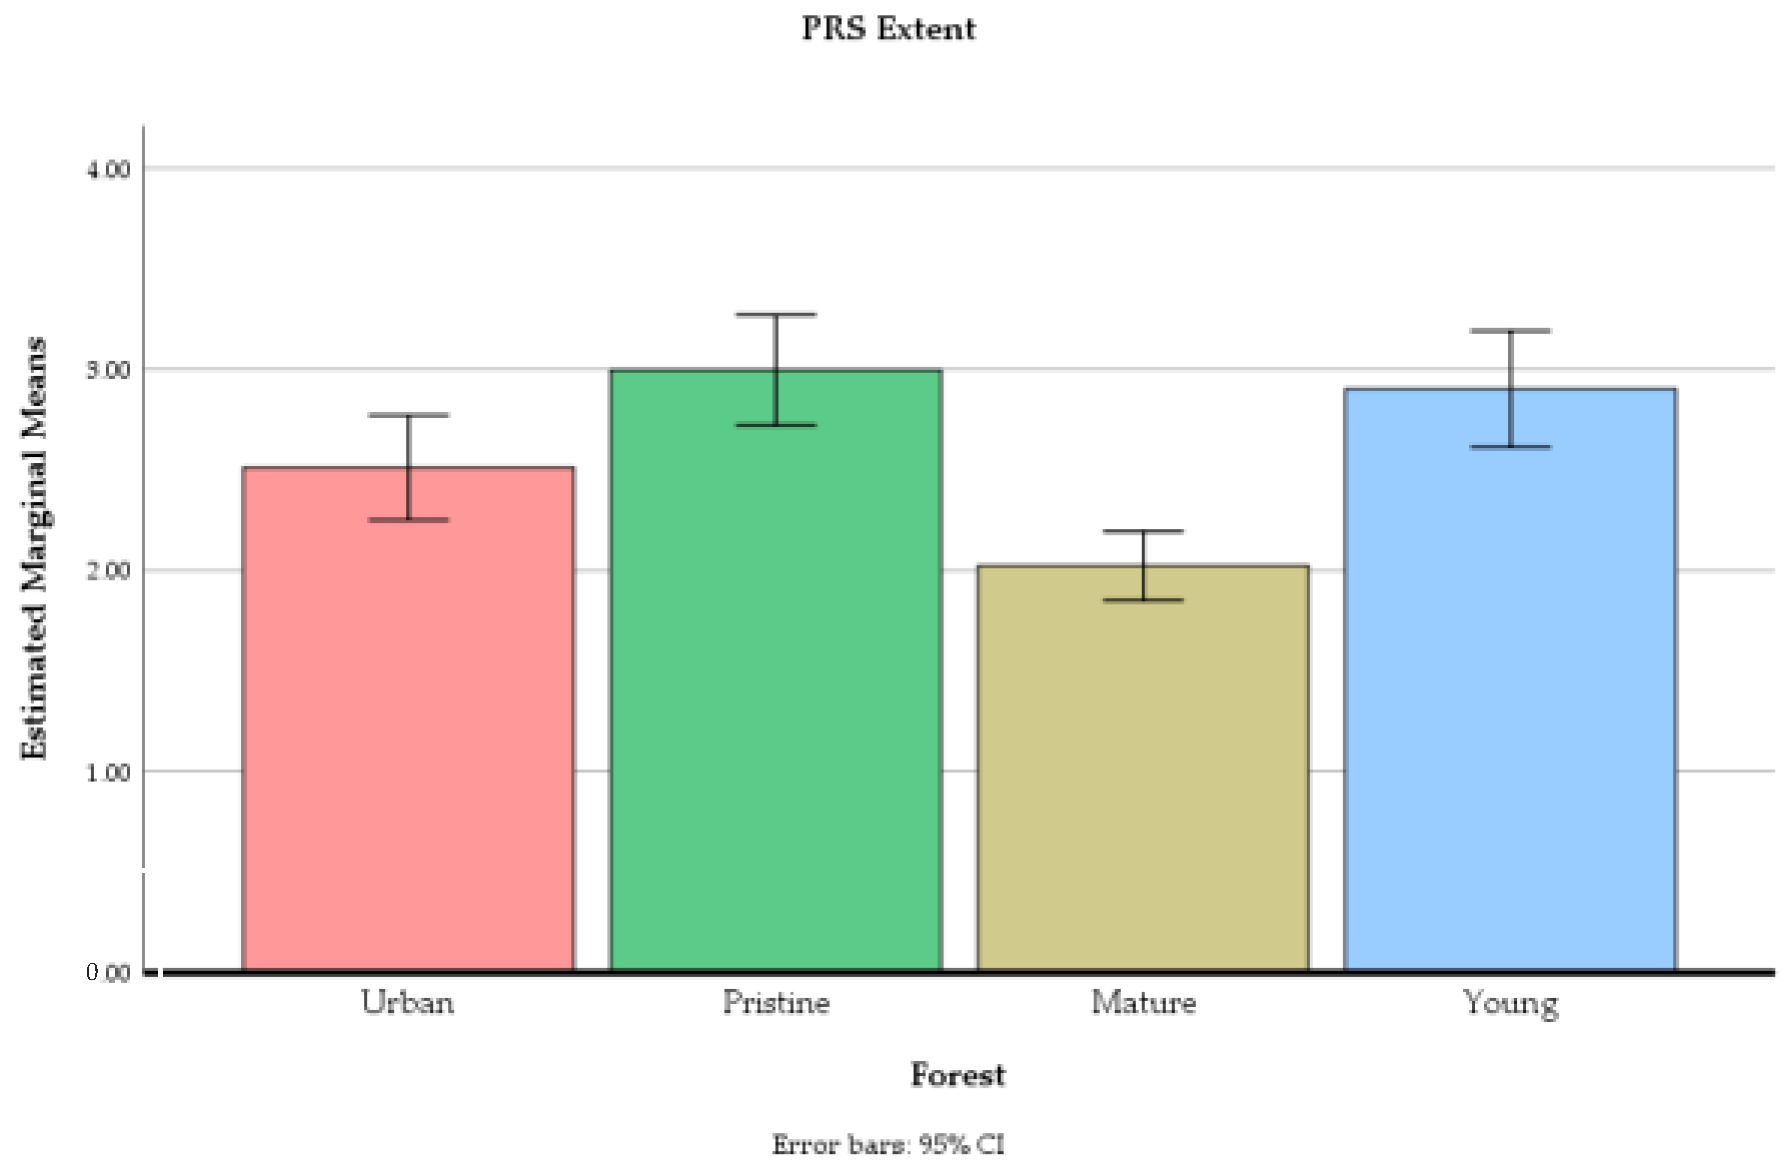
| PRS extent (not reversed) | 2.51 | 1.06 | 0.74 | 3.00 | 1.12 | 0.63 | 2.02 | 0.70 | 0.47 | 2.90 | 1.18 | 0.75 |
| PRS-score (extent reversed) | 5.21 | 0.88 | 0.93 | 5.46 | 0.82 | 0.90 | 5.68 | 0.75 | 0.91 | 4.46 | 1.09 | 0.94 |
| (7) Pleasant–Unpleasant (1) | 5.79 | 1.22 | - | 6.20 | 1.03 | - | 6.33 | 0.85 | - | 4.35 | 1.81 | - |
| (7) Beautiful–Ugly (1) | 5.91 | 1.06 | - | 6.15 | 1.15 | - | 6.29 | 0.96 | - | 4.44 | 1.72 | - |
| (7) Safe–Scary (1) | 6.36 | 1.02 | - | 5.98 | 1.10 | - | 6.48 | 0.79 | - | 5.55 | 1.63 | - |
| (7) Restorative–Stressful (1) | 5.73 | 1.30 | - | 5.95 | 0.98 | - | 6.23 | 0.86 | - | 4.79 | 1.56 | - |
| (7) Rich–Poor in biodiversity (1) | 5.20 | 1.35 | - | 6.11 | 1.01 | - | 5.71 | 1.17 | - | 3.62 | 1.77 | - |
| (7) Natural–Artificial (1) | 5.59 | 1.15 | - | 6.58 | 0.58 | - | 6.38 | 0.84 | - | 4.17 | 1.89 | - |
| (7) Interesting–Dull (1) | 5.44 | 1.49 | - | 6.45 | 1.01 | - | 6.20 | 1.07 | - | 4.32 | 1.75 | - |
| (7) Calm–Restless (1) | 4.62 | 1.85 | - | 5.35 | 1.69 | - | 6.09 | 0.94 | - | 4.76 | 1.77 | - |
| (7) Harmonious–Chaotic (1) | 5.18 | 1.47 | - | 5.61 | 1.28 | - | 6.00 | 1.07 | - | 4.41 | 1.60 | - |
| (7) Bright–Dark (1) | 5.47 | 1.27 | - | 5.33 | 1.17 | - | 5.36 | 1.35 | - | 4.20 | 1.57 | - |
| (7) Cheerful–Sad (1) | 5.17 | 1.27 | - | 5.02 | 1.35 | - | 5.38 | 1.06 | - | 3.76 | 1.54 | - |
| (7) Managed–Unmanaged (1) | 4.12 | 1.70 | - | 2.02 | 1.21 | - | 3.76 | 1.58 | - | 4.65 | 1.56 | - |
| Measure | Forest Site | Urban vs. Pristine | Urban vs. Mature | Urban vs. Young | Pristine vs. Mature | Pristine vs. Young | Mature vs. Young |
|---|---|---|---|---|---|---|---|
| PRS being away | F | 5.63 * | 7.31 ** | 7.27 ** | .25 | 34.39 ** | 30.86 ** |
| r 1 | 0.28 | 0.32 | 0.32 | 0.06 | 0.59 | 0.57 | |
| PRS fascination | F | 31.58 ** | 13.40 ** | 25.19 ** | 8.62 ** | 91.74 ** | 62.37 ** |
| r 1 | 0.57 | 0.41 | 0.53 | 0.34 | 0.77 | 0.70 | |
| PRS compatibility | F | 2.43 | 13.25 ** | 30.37 ** | 3.54 | 48.06 ** | 60.98 ** |
| r 1 | 0.19 | 0.41 | 0.56 | 0.23 | 0.65 | 0.70 | |
| PRS Extent (not reversed) | F | 8.65 ** | 15.48 ** | 4.17 * | 56.06** | 0.36 | 30.56 ** |
| r 1 | 0.34 | 0.44 | 0.25 | 0.68 | 0.07 | 0.57 | |
| Pleasant–Unpleasant | F | 4.01 * | 9.97 ** | 31.08 ** | 1.21 | 59.05 ** | 80.95 ** |
| r 1 | 0.24 | 0.37 | 0.57 | 0.14 | 0.69 | 0.75 | |
| Beautiful–Ugly | F | 2.06 | 7.37 ** | 39.19 ** | 0.82 | 52.94 ** | 72.39 ** |
| r 1 | 0.18 | 0.32 | 0.61 | 0.11 | 0.67 | 0.73 | |
| Safe–Scary | F | 4.98 * | 0.71 | 13.31 ** | 16.63 ** | 3.83 | 19.54 ** |
| r 1 | 0.27 | 0.10 | 0.41 | 0.45 | 0.24 | 0.48 | |
| Restorative–Stressful | F | 1.26 | 10.67 ** | 14.80 ** | 3.36 | 25.26 ** | 48.77 ** |
| r 1 | 0.14 | 0.38 | 0.43 | 0.22 | 0.53 | 0.65 | |
| Rich in biodiversity–Poor in biodiversity | F | 18.33 ** | 7.99 ** | 39.73 ** | 4.70 * | 99.40 ** | 78.33 ** |
| r 1 | 0.47 | 0.33 | 0.62 | 0.26 | 0.78 | 0.74 | |
| Natural–Artificial | F | 45.73 ** | 36.46 ** | 36.65 ** | 2.95 | 107.34 ** | 87.10 ** |
| r 1 | 0.64 | 0.60 | 0.60 | 0.21 | 0.79 | 0.76 | |
| Interesting–Dull | F | 22.22 ** | 15.77 ** | 17.12 ** | 2.40 | 74.23 ** | 80.11 ** |
| r 1 | 0.50 | 0.44 | 0.46 | 0.19 | 0.73 | 0.74 | |
| Calm–Restless | F | 5.41 * | 40.56 ** | 0.21 | 13.24 ** | 5.24 * | 42.21 ** |
| r 1 | 0.28 | 0.62 | 0.06 | 0.41 | 0.27 | 0.63 | |
| Harmonious–Chaotic | F | 3.98 | 16.91 ** | 8.78 ** | 6.42 * | 22.90 ** | 47.63 ** |
| r 1 | 0.24 | 0.45 | 0.35 | 0.30 | 0.51 | 0.65 | |
| Bright–Dark | F | 0.58 | 0.39 | 32.31 ** | 0.02 | 25.21 ** | 30.54 ** |
| r 1 | 0.09 | 0.08 | 0.58 | 0.02 | 0.53 | 0.57 | |
| Cheerful–Sad | F | 0.55 | 2.07 | 43.92 ** | 4.07 * | 29.17 ** | 64.24 ** |
| r 1 | 0.09 | 0.18 | 0.63 | 0.24 | 0.56 | 0.71 | |
| Managed–Unmanaged | F | 105.56 ** | 2.64 | 3.54 | 59.58 ** | 138.51 ** | 12.50 ** |
| r 1 | 0.79 | 0.20 | 0.23 | 0.69 | 0.82 | 0.40 |
| Urban | Pristine | Mature | Young | |||||
|---|---|---|---|---|---|---|---|---|
| no. | % | no. | % | no. | % | no. | % | |
| Dead or decaying wood | 7 | 11 | 24 | 36 | 3 | 5 | 1 | 2 |
| Natural | 9 | 14 | 23 | 35 | 3 | 5 | 1 | 2 |
| Sounds of the forest and birds | 18 | 27 | 18 | 27 | 19 | 29 | 19 | 29 |
| Versatile | 14 | 21 | 18 | 27 | 13 | 20 | 2 | 3 |
| Species richness | 7 | 11 | 17 | 26 | 13 | 20 | 2 | 3 |
| Bright | 11 | 17 | 9 | 14 | 16 | 24 | 14 | 21 |
| Fascinating/awe/details | 8 | 12 | 16 | 24 | 9 | 14 | 2 | 3 |
| Old/large trees | 5 | 8 | 8 | 12 | 13 | 20 | 2 | 3 |
| Oldness | 4 | 6 | 12 | 18 | 6 | 9 | 0 | 0 |
| Serene/peacefulness | 7 | 11 | 9 | 14 | 8 | 12 | 7 | 11 |
| Beautiful | 6 | 9 | 8 | 12 | 9 | 14 | 5 | 8 |
| Easy to walk | 8 | 12 | 3 | 5 | 9 | 14 | 7 | 11 |
| Prospect/openness | 3 | 5 | 4 | 6 | 7 | 11 | 2 | 3 |
| Accessibility | 7 | 11 | 0 | 0 | 1 | 2 | 1 | 2 |
| Scents | 1 | 2 | 4 | 6 | 6 | 9 | 4 | 6 |
| Unmanaged | 1 | 2 | 6 | 9 | 1 | 2 | 1 | 2 |
| Different ages of trees | 3 | 5 | 5 | 8 | 3 | 5 | 1 | 2 |
| Compatibility | 2 | 3 | 1 | 2 | 1 | 2 | 0 | 0 |
| Extent | 0 | 0 | 2 | 3 | 0 | 0 | 0 | 0 |
| Space | 2 | 3 | 0 | 0 | 0 | 0 | 0 | 0 |
| Orderliness | 0 | 0 | 0 | 0 | 0 | 0 | 2 | 3 |
| Safe | 1 | 2 | 0 | 0 | 1 | 2 | 0 | 0 |
| Managed | 0 | 0 | 0 | 0 | 0 | 0 | 1 | 2 |
| Culture | 0 | 0 | 0 | 0 | 0 | 0 | 1 | 2 |
| Refuge/hide | 0 | 0 | 1 | 2 | 0 | 0 | 0 | 0 |
| No answer | 1 | 2 | 0 | 0 | 0 | 0 | 0 | 0 |
| Urban | Pristine | Mature | Young | |||||
|---|---|---|---|---|---|---|---|---|
| no. | % | no. | % | no. | % | no. | % | |
| Airplane noise | 13 | 20 | 42 | 64 | 19 | 29 | 28 | 42 |
| Traffic noise | 31 | 47 | 3 | 5 | 4 | 6 | 0 | 0 |
| Characteristics of commercial forest | 0 | 0 | 0 | 0 | 2 | 3 | 21 | 32 |
| Dull | 2 | 3 | 2 | 3 | 2 | 3 | 17 | 26 |
| Dead branches | 0 | 0 | 0 | 0 | 0 | 0 | 13 | 20 |
| Other people | 12 | 18 | 1 | 2 | 2 | 3 | 1 | 2 |
| Thinning waste | 0 | 0 | 0 | 0 | 0 | 0 | 11 | 17 |
| Paths | 9 | 14 | 0 | 0 | 0 | 0 | 0 | 0 |
| Dead or decaying wood | 0 | 0 | 4 | 6 | 0 | 0 | 0 | 0 |
| Gloomy spruces | 2 | 3 | 1 | 2 | 3 | 5 | 0 | 0 |
| Dark | 1 | 2 | 0 | 0 | 2 | 3 | 3 | 5 |
| Mosquitos | 0 | 0 | 1 | 2 | 1 | 2 | 3 | 5 |
| Thicket | 0 | 0 | 0 | 0 | 0 | 0 | 3 | 5 |
| Rubbish | 1 | 2 | 2 | 3 | 1 | 2 | 0 | 0 |
| Worn spots | 2 | 3 | 0 | 0 | 0 | 0 | 0 | 0 |
| Fear of downfall dead trees | 0 | 0 | 2 | 3 | 0 | 0 | 0 | 0 |
| Sadness | 0 | 0 | 1 | 2 | 0 | 0 | 1 | 2 |
| Familiarity | 1 | 2 | 0 | 0 | 0 | 0 | 1 | 2 |
| No answer | 9 | 14 | 5 | 8 | 18 | 27 | 4 | 6 |
| Urban | Pristine | Mature | Young | |||||||||||||
|---|---|---|---|---|---|---|---|---|---|---|---|---|---|---|---|---|
| Step 3 | B | Std. Error | β | p | B | Std. Error | β | p | B | Std. Error | β | p | B | Std. Error | β | p |
| (Constant) | 0.73 | 1.11 | 0.517 | 0.69 | 0.68 | 0.314 | 0.13 | 0.89 | 0.882 | 1.91 | 0.98 | 0.057 | ||||
| Temperature, °C | 0.01 | 0.02 | 0.06 | 0.582 | −0.01 | 0.02 | −0.03 | 0.749 | 0.02 | 0.01 | 0.20 | 0.041 | −0.01 | 0.02 | −0.03 | 0.720 |
| Gender: 0 = Men, 1 = Women | −0.06 | 0.20 | −0.03 | 0.775 | −0.05 | 0.13 | −0.03 | 0.729 | −0.23 | 0.15 | −0.15 | 0.121 | 0.12 | 0.19 | 0.05 | 0.527 |
| Age | 0.01 | 0.01 | 0.07 | 0.536 | 0.00 | 0.01 | 0.02 | 0.755 | 0.01 | 0.01 | 0.11 | 0.216 | −0.01 | 0.01 | −0.07 | 0.387 |
| Educational level: Other = 0, Uni = 1 | −0.10 | 0.23 | −0.05 | 0.686 | −0.32 | 0.14 | −0.17 | 0.031 | 0.13 | 0.16 | 0.08 | 0.426 | 0.01 | 0.21 | 0.00 | 0.968 |
| Childhood environment: Countryside = 0, City = 1 | 0.07 | 0.25 | 0.03 | 0.790 | −0.20 | 0.17 | −0.09 | 0.261 | −0.20 | 0.19 | −0.10 | 0.293 | −0.13 | 0.24 | −0.05 | 0.593 |
| Nature Relatedness, NR-6 | 0.26 | 0.18 | 0.18 | 0.150 | 0.30 | 0.12 | 0.23 | 0.013 | 0.33 | 0.13 | 0.27 | 0.014 | 0.12 | 0.16 | 0.07 | 0.461 |
| Familiarity of outdooring in forest | −0.09 | 0.13 | −0.08 | 0.523 | 0.02 | 0.09 | 0.02 | 0.836 | 0.06 | 0.10 | 0.06 | 0.564 | −0.02 | 0.12 | −0.01 | 0.869 |
| Work related to nature: No = 0, Yes = 1 | 0.06 | 0.22 | 0.03 | 0.799 | −0.15 | 0.15 | −0.08 | 0.349 | 0.05 | 0.17 | 0.03 | 0.778 | 0.09 | 0.23 | 0.04 | 0.697 |
| Beautiful | 0.31 | 0.12 | 0.37 | 0.016 | 0.37 | 0.08 | 0.52 | 0.001 | 0.33 | 0.10 | 0.42 | 0.002 | 0.34 | 0.09 | 0.54 | 0.001 |
| Safe | 0.16 | 0.11 | 0.18 | 0.135 | 0.03 | 0.07 | 0.04 | 0.641 | 0.07 | 0.10 | 0.08 | 0.493 | 0.13 | 0.07 | 0.19 | 0.085 |
| Bright | 0.02 | 0.09 | 0.03 | 0.795 | 0.00 | 0.06 | 0.01 | 0.939 | −0.02 | 0.06 | −0.04 | 0.729 | −0.12 | 0.08 | −0.17 | 0.175 |
| Managed | −0.04 | 0.06 | −0.08 | 0.499 | 0.14 | 0.05 | 0.21 | 0.012 | −0.01 | 0.05 | −0.03 | 0.780 | 0.01 | 0.06 | 0.01 | 0.901 |
| Rich in biodiversity | 0.13 | 0.08 | 0.20 | 0.106 | 0.19 | 0.08 | 0.24 | 0.025 | 0.18 | 0.07 | 0.29 | 0.013 | 0.23 | 0.07 | 0.38 | 0.002 |
Publisher’s Note: MDPI stays neutral with regard to jurisdictional claims in published maps and institutional affiliations. |
© 2021 by the authors. Licensee MDPI, Basel, Switzerland. This article is an open access article distributed under the terms and conditions of the Creative Commons Attribution (CC BY) license (http://creativecommons.org/licenses/by/4.0/).
Share and Cite
Simkin, J.; Ojala, A.; Tyrväinen, L. The Perceived Restorativeness of Differently Managed Forests and Its Association with Forest Qualities and Individual Variables: A Field Experiment. Int. J. Environ. Res. Public Health 2021, 18, 422. https://doi.org/10.3390/ijerph18020422
Simkin J, Ojala A, Tyrväinen L. The Perceived Restorativeness of Differently Managed Forests and Its Association with Forest Qualities and Individual Variables: A Field Experiment. International Journal of Environmental Research and Public Health. 2021; 18(2):422. https://doi.org/10.3390/ijerph18020422
Chicago/Turabian StyleSimkin, Jenni, Ann Ojala, and Liisa Tyrväinen. 2021. "The Perceived Restorativeness of Differently Managed Forests and Its Association with Forest Qualities and Individual Variables: A Field Experiment" International Journal of Environmental Research and Public Health 18, no. 2: 422. https://doi.org/10.3390/ijerph18020422
APA StyleSimkin, J., Ojala, A., & Tyrväinen, L. (2021). The Perceived Restorativeness of Differently Managed Forests and Its Association with Forest Qualities and Individual Variables: A Field Experiment. International Journal of Environmental Research and Public Health, 18(2), 422. https://doi.org/10.3390/ijerph18020422